Embed Size (px)
Citation preview
Proceeding - Kuala Lumpur International Business, Economics and Law Conference Vol. 3.
November 29 - 30, 2014. Hotel Putra, Kuala Lumpur, Malaysia. ISBN 978-967-11350-4-4
58
OIL PRICE, MONETARY AND FISCAL POLICY: INDONESIA EVIDENCE
Rossanto Dwi Handoyo,
Department of Economics,
Faculty of Economics and Business, Airlangga University Indonesia,
4 Airlangga Road, Surabaya, East Java, Indonesia, 60285.
Email : [email protected]
Mansor Jusoh
School of Economics, Faculty of Economics and Management,
Universiti Kebangsaan Malaysia, 3600 UKM, Bangi Selangor, Malaysia
Email: [email protected]
Mohd. Azlan Shah Zaidi
School of Economics, Faculty of Economics and Management,
Universiti Kebangsaan Malaysia, 3600 UKM, Bangi Selangor, Malaysia
Email: [email protected]
ABSTRACT
Since 2003, Indonesia’s oil production had decreased and at the same time the domestic oil consumption had
increased significantly due to economic growth. Indonesia becomes net importer oil country and suffer from any
increase of such shock due to oil price in domestic market is heavily regulated by the authority and set the price to be
lower than the international market through fiscal subsidy ever since. Oil price shock then will lead to deficit of trade
balance, depreciate the exchange rate, increase domestic inflation, increase in fuel subsidy and depress economic
activity. To mitigate the effect of an increase of oil price on Indonesian economy, government uses the instrument of
both monetary and fiscal policy. The aim of the paper is to investigate the effect of oil price shock, business cycles,
monetary and fiscal policy shocks on Indonesian macroeconomic variables.
Keywords: Oil Price, Monetary Policy, Fiscal Policy, Macro economy, Sign Restriction VAR model, Impulse
Response
JEL Classification codes: E20, E52, E62, F41
1. Background
The past experience of 1970 oil price shocks indicate that oil price movements are so fragile with factors not just
economic but also non economic. In the 1970 oil price shock, Indonesia gain benefit from an increase in oil price
(namely “oil bonanza moments”) because Indonesia became net exporter oil country. But since 2003, Indonesia’s oil
production had decreased and at the same time the oil consumption had increased significantly due to economic
growth. Indonesia becomes net importer oil country and suffer from any increase of such shock due to oil price in
domestic market is heavily regulated by the authority and set to be lower than the international market through fiscal
subsidy ever since. Oil price shock then will lead to deficit of trade balance, increase domestic inflation, increase in
fuel subsidy and depress economic activity. Under these circumstances, Indonesia is inevitably affected by
international oil price shock. As result, observing whether the shocks in energy price are transmitted to Indonesia
macroeconomic variables will receive considerable attention from economic agents including the government.
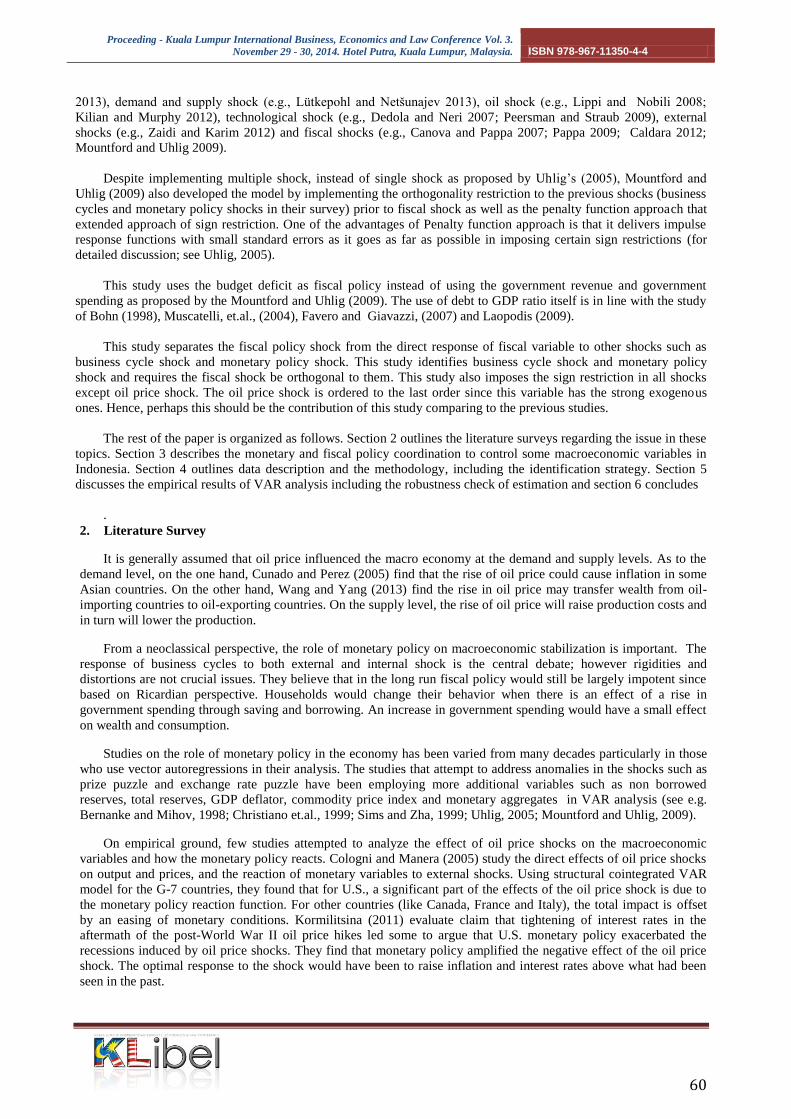
The relationship between oil price and fiscal policy can be described in figure 1. From the graph, Indonesia’s
debt reaches the peak in 2010 (130 billion US dollars) when the world’s oil price approaches 120 dollars per barrel.
From this point of view, it seems there is positive relationship between world oil price and Indonesian fiscal debt.
Eyeball Econometrics such as Figure 1 can be deceptive. Many things are going on simultaneously in the economy
and we have to keep in mind the misleading of this single cause-and-effect perspective.
Proceeding - Kuala Lumpur International Business, Economics and Law Conference Vol. 3.
November 29 - 30, 2014. Hotel Putra, Kuala Lumpur, Malaysia. ISBN 978-967-11350-4-4
59
Figure 1 The relationship between Oil Price and Indonesian Fiscal Debt
The impact of high oil price on fiscal budget and other macroeconomic variables has dominated national
economic agenda for the last decades. The international high oil price recently reflect the growing demand from Asia
especially China and India and geopolitical issues in Middle East. Figure 1 shows the fluctuation of the 2004 of the
world oil price. In 2001 the price was about 29 USD/barrel, increase to 40 USD/barrel, approach the peak at 130
USD/barrel in mids 2008, fall to 65 USD/barrel in mid 2009 and 100 USD/barrel in last 2011. For comparison,
Indonesian government has spent much fiscal budget on energy subsidy: 5% of its GDP (Son, 2008), 27.93% of its
total budget on energy subsidy and 80% of this was allocated for fuel subsidies (Agustina, 2008) and in 2013 17% of
budget spent for fuel subsidy (Dartanto, 2013).
The government regulates the domestic oil price through the fuel subsidy especially for household’s
consumption, public transportation, small and medium enterprises, and other public and social services, but it does not
regulate fuel price (non subsidy price) for large industries or factories and foreign-flagged vessels. The purpose of this
fiscal policy is to prevent the fall of people’s purchasing power from the increase in oil price and at the same time to
prevent economy from high inflation and economy expected to continue grow steadily. The sharp reduction of fuel
subsidy took place in 2005 as the part of phasing out of fuel subsidy program lead to increase in price level, lower the
purchasing power and then in turn reduced household consumption in the short run, but in the long run able to
increase the fiscal sustainability.
Despite the fiscal policy, in order to combat oil price hikes that will pass-through to inflation, the government
also implements the monetary policy. In the context of an increase in oil price, Bank Indonesia has obligation to
response to such an adverse supply shock that potentially raises prices and decrease output through raising its policy
rate to reach the established inflation target. On the other hand, the consequences of such monetary policy will lead to
bust the economic activity, the output will fall, unemployment rise, including industrial production indices and
employ them as short-run leading indicators for the stance of monetary policy. The Central Bank that has obligations
to control aggregate demand particularly to control inflation and output.
From the aforementioned discussion, this study proposes the question that need to be undertaken by the policy
makers. What are the effect of oil price, business cycles, monetary and fiscal policy shocks on the economy? This
study includes the business cycles shock with regards to the fact that economy will experience the period of expansion
and recession based on Real Business Cycles (RBC) theory. Under the period of recession, the government economic
policy is important to combat the recession and in turn, to stabilize the economy. Fiscal policy ranges from the view
that no recession has ever ended without fiscal expansion to the view that fiscal stimulus has always come too late.
Similarly, for monetary policy, there was agreement about whether looser policy has been a primary engine of
recovery from recessions or no government intervention in these periods.
This paper aims to answer those questions by applying the method developed by Mountford and Uhlig (2009).
Their method is an extension of Uhlig (2005)’s agnostic identification method of imposing sign restrictions on
impulse response functions. One of the major contributions of Mountford and Uhlig (2009) is to take into account the
identification of multiple fundamental shocks. Previous studies that used sign restriction in Vector Auto Regression
(VAR) only consider one single shock in various areas although the original application were to model the monetary
policy. Sign identified VAR models have been used to study monetary policy shock (e.g., Rafiq and Malik 2008;
Vargas-Silva 2008; Franta 2011; Jääskelä and Jennings 2011; Tachibana 2013), capital inflows shocks (e.g., Tillmann
70
80
90
100
110
120
130
140
0
20
40
60
80
100
120
140
01 02 03 04 05 06 07 08 09 10 11
DEBT_INA (in billion dollars)- left scaleOIL (in dollars per barrell) - right scale
Proceeding - Kuala Lumpur International Business, Economics and Law Conference Vol. 3.
November 29 - 30, 2014. Hotel Putra, Kuala Lumpur, Malaysia. ISBN 978-967-11350-4-4
60
2013), demand and supply shock (e.g., Lütkepohl and Netšunajev 2013), oil shock (e.g., Lippi and Nobili 2008;
Kilian and Murphy 2012), technological shock (e.g., Dedola and Neri 2007; Peersman and Straub 2009), external
shocks (e.g., Zaidi and Karim 2012) and fiscal shocks (e.g., Canova and Pappa 2007; Pappa 2009; Caldara 2012;
Mountford and Uhlig 2009).
Despite implementing multiple shock, instead of single shock as proposed by Uhlig’s (2005), Mountford and
Uhlig (2009) also developed the model by implementing the orthogonality restriction to the previous shocks (business
cycles and monetary policy shocks in their survey) prior to fiscal shock as well as the penalty function approach that
extended approach of sign restriction. One of the advantages of Penalty function approach is that it delivers impulse
response functions with small standard errors as it goes as far as possible in imposing certain sign restrictions (for
detailed discussion; see Uhlig, 2005).
This study uses the budget deficit as fiscal policy instead of using the government revenue and government
spending as proposed by the Mountford and Uhlig (2009). The use of debt to GDP ratio itself is in line with the study
of Bohn (1998), Muscatelli, et.al., (2004), Favero and Giavazzi, (2007) and Laopodis (2009).
This study separates the fiscal policy shock from the direct response of fiscal variable to other shocks such as
business cycle shock and monetary policy shock. This study identifies business cycle shock and monetary policy
shock and requires the fiscal shock be orthogonal to them. This study also imposes the sign restriction in all shocks
except oil price shock. The oil price shock is ordered to the last order since this variable has the strong exogenous
ones. Hence, perhaps this should be the contribution of this study comparing to the previous studies.
The rest of the paper is organized as follows. Section 2 outlines the literature surveys regarding the issue in these
topics. Section 3 describes the monetary and fiscal policy coordination to control some macroeconomic variables in
Indonesia. Section 4 outlines data description and the methodology, including the identification strategy. Section 5
discusses the empirical results of VAR analysis including the robustness check of estimation and section 6 concludes
.
2. Literature Survey
It is generally assumed that oil price influenced the macro economy at the demand and supply levels. As to the
demand level, on the one hand, Cunado and Perez (2005) find that the rise of oil price could cause inflation in some
Asian countries. On the other hand, Wang and Yang (2013) find the rise in oil price may transfer wealth from oil-
importing countries to oil-exporting countries. On the supply level, the rise of oil price will raise production costs and
in turn will lower the production.
From a neoclassical perspective, the role of monetary policy on macroeconomic stabilization is important. The
response of business cycles to both external and internal shock is the central debate; however rigidities and
distortions are not crucial issues. They believe that in the long run fiscal policy would still be largely impotent since
based on Ricardian perspective. Households would change their behavior when there is an effect of a rise in
government spending through saving and borrowing. An increase in government spending would have a small effect
on wealth and consumption.
Studies on the role of monetary policy in the economy has been varied from many decades particularly in those
who use vector autoregressions in their analysis. The studies that attempt to address anomalies in the shocks such as
prize puzzle and exchange rate puzzle have been employing more additional variables such as non borrowed
reserves, total reserves, GDP deflator, commodity price index and monetary aggregates in VAR analysis (see e.g.
Bernanke and Mihov, 1998; Christiano et.al., 1999; Sims and Zha, 1999; Uhlig, 2005; Mountford and Uhlig, 2009).
On empirical ground, few studies attempted to analyze the effect of oil price shocks on the macroeconomic
variables and how the monetary policy reacts. Cologni and Manera (2005) study the direct effects of oil price shocks
on output and prices, and the reaction of monetary variables to external shocks. Using structural cointegrated VAR
model for the G-7 countries, they found that for U.S., a significant part of the effects of the oil price shock is due to
the monetary policy reaction function. For other countries (like Canada, France and Italy), the total impact is offset
by an easing of monetary conditions. Kormilitsina (2011) evaluate claim that tightening of interest rates in the
aftermath of the post-World War II oil price hikes led some to argue that U.S. monetary policy exacerbated the
recessions induced by oil price shocks. They find that monetary policy amplified the negative effect of the oil price
shock. The optimal response to the shock would have been to raise inflation and interest rates above what had been
seen in the past.
Proceeding - Kuala Lumpur International Business, Economics and Law Conference Vol. 3.
November 29 - 30, 2014. Hotel Putra, Kuala Lumpur, Malaysia. ISBN 978-967-11350-4-4
61
From a Keynesian perspective, rigidities and distortions are central to business cycle dynamics and business
cycles are associated with allocative inefficiencies. Under these circumstances, fiscal policy perhaps can be the
solution. The effectiveness of fiscal policy, however, depends on the existence of distortions and rigidities such as
limited access to credit that leads to non-Ricardian behavior e.g., consumption out of current income rather than
lifetime income, as in the ISLM model (Hermawan and Munro, 2008). In the presence of such rigidities, a rise in
Government spending would lead to an increase in income and therefore consumption.
Related to these issues, the studies that relate the oil price shocks to fiscal variables are lacking, particularly in
the developing oil importing country like Indonesia. Shah (2012) examines the dynamic effects of oil price shocks in
addition to the aggregate supply and demand shocks on macroeconomic fluctuations in four sample economies:
Indonesia, Malaysia, Pakistan and Thailand. They find evidence that it is less likely that oil price shocks have a
substantial impact on macroeconomic fluctuation. The aggregate supply and demand shocks are the main sources of
fluctuation in output and domestic price respectively in Malaysia, Pakistan and Thailand. In Indonesia, aggregate
supply shocks are the key reason for both output fluctuation and inflation. Employing the IS-MP model, HsingYu
(2012) study potential impacts of selected macroeconomic variables and external shocks including crude oil prices on
real GDP for Indonesia. The results show that a higher real stock prices and a higher real crude oil price are expected
to increase Indonesia’s real GDP. More deficit spending as a percent of GDP would not cause real output to rise.
Hence, Indonesia would not suffer declining output because of higher oil prices. Due to the insignificant coefficient
of the government deficit as a percent of GDP, fiscal prudence needs to be pursued.
3. Monetary and Fiscal Policy in Indonesia
Under a new Central bank Act, the Legislation Act no. 23/1999 on Bank Indonesia and amended with the Act no
23/2004, the status and position of Bank Indonesia became an independent state institution and freedom from
interference by the fiscal authorities or any other external parties in formulating and implementing each of its task
and authority as mandated in the Act. Under the Central Bank Act, Bank Indonesia has one single objective in
achieving and maintaining the stability of domestic currencies in term of against goods and service (maintain the
established inflation target) and the exchange rate of Rupiah against foreign currency using inflation-targeting
framework.
Under this framework, monetary policy is implemented with a forward-looking approach, meaning that any
change in the monetary policy stance is undertaken after evaluating whether future developments in inflation are on
the track with the established inflation target (www.bi.go.id). At the operational level, the monetary policy stance is
reflected in the setting of the central bank policy rate with the expectation of influencing money market rates and in
turn the deposit rates and lending rates in the banking system. Changes in these rates will ultimately influence output
and inflation.
Under fiscal act or State Finance act (legislation act No 17 on year 2003), in order to reach the goal of stable and
steadily economic growth while keeping the fiscal remain sustainable, fiscal debt should not exceed 60 per cent of
GDP and the fiscal deficit should not exceed 3 per cent of GDP. The purpose of this fiscal act is to give direction to
the fiscal authority (President) to manage the prudent fiscal policy while still promote economic growth. In order to
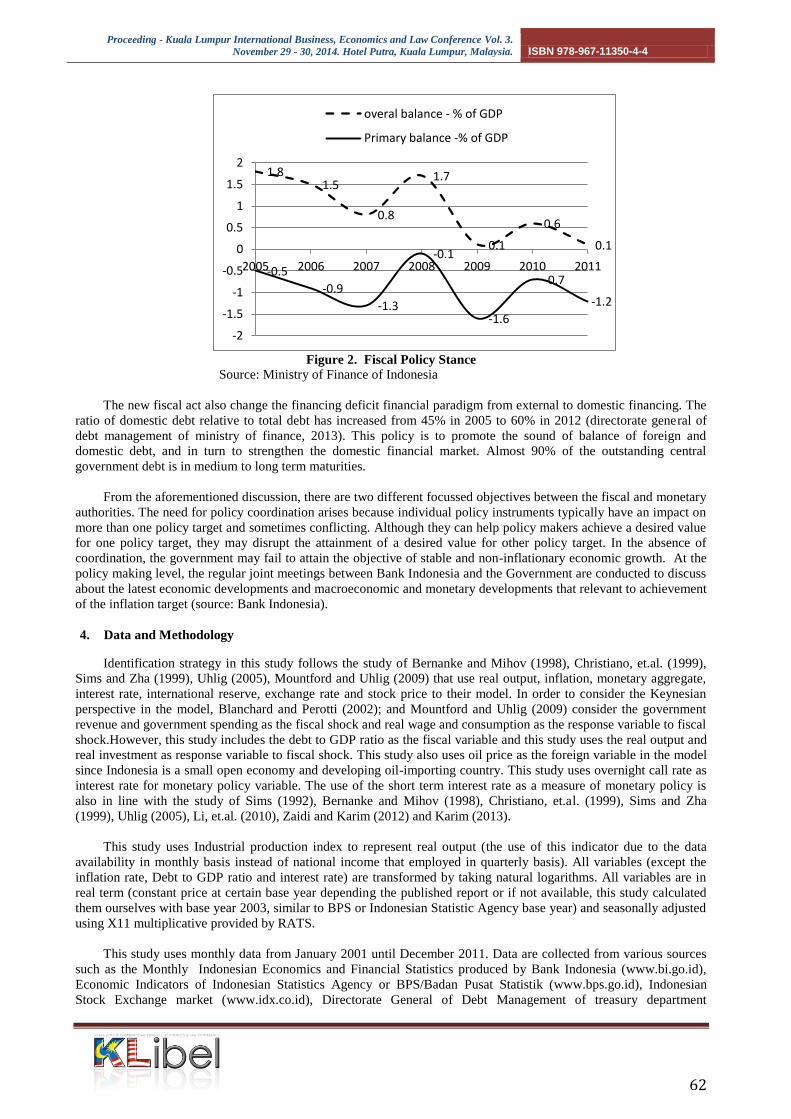
measure the fiscal policy stance, it needs to estimate using the overall balance and primary balance. The figure 2
shows that over several years, government conducts a low bud,get deficit. This can be described in the ratio of the
overall balance, which indicates the gap between government revenue and grants less its expenditure. The highest
fiscal deficit reached at 1.6% of GDP in 2009 when the government anticipated avoiding the broader and worsening
impact of global economic crisis on Indonesian economy.
Proceeding - Kuala Lumpur International Business, Economics and Law Conference Vol. 3.
November 29 - 30, 2014. Hotel Putra, Kuala Lumpur, Malaysia. ISBN 978-967-11350-4-4
62
Figure 2. Fiscal Policy Stance
Source: Ministry of Finance of Indonesia
The new fiscal act also change the financing deficit financial paradigm from external to domestic financing. The
ratio of domestic debt relative to total debt has increased from 45% in 2005 to 60% in 2012 (directorate general of
debt management of ministry of finance, 2013). This policy is to promote the sound of balance of foreign and
domestic debt, and in turn to strengthen the domestic financial market. Almost 90% of the outstanding central
government debt is in medium to long term maturities.
From the aforementioned discussion, there are two different focussed objectives between the fiscal and monetary
authorities. The need for policy coordination arises because individual policy instruments typically have an impact on
more than one policy target and sometimes conflicting. Although they can help policy makers achieve a desired value
for one policy target, they may disrupt the attainment of a desired value for other policy target. In the absence of
coordination, the government may fail to attain the objective of stable and non-inflationary economic growth. At the
policy making level, the regular joint meetings between Bank Indonesia and the Government are conducted to discuss
about the latest economic developments and macroeconomic and monetary developments that relevant to achievement
of the inflation target (source: Bank Indonesia).
4. Data and Methodology
Identification strategy in this study follows the study of Bernanke and Mihov (1998), Christiano, et.al. (1999),
Sims and Zha (1999), Uhlig (2005), Mountford and Uhlig (2009) that use real output, inflation, monetary aggregate,
interest rate, international reserve, exchange rate and stock price to their model. In order to consider the Keynesian
perspective in the model, Blanchard and Perotti (2002); and Mountford and Uhlig (2009) consider the government
revenue and government spending as the fiscal shock and real wage and consumption as the response variable to fiscal
shock.However, this study includes the debt to GDP ratio as the fiscal variable and this study uses the real output and
real investment as response variable to fiscal shock. This study also uses oil price as the foreign variable in the model
since Indonesia is a small open economy and developing oil-importing country. This study uses overnight call rate as
interest rate for monetary policy variable. The use of the short term interest rate as a measure of monetary policy is
also in line with the study of Sims (1992), Bernanke and Mihov (1998), Christiano, et.al. (1999), Sims and Zha
(1999), Uhlig (2005), Li, et.al. (2010), Zaidi and Karim (2012) and Karim (2013).
This study uses Industrial production index to represent real output (the use of this indicator due to the data
availability in monthly basis instead of national income that employed in quarterly basis). All variables (except the
inflation rate, Debt to GDP ratio and interest rate) are transformed by taking natural logarithms. All variables are in
real term (constant price at certain base year depending the published report or if not available, this study calculated
them ourselves with base year 2003, similar to BPS or Indonesian Statistic Agency base year) and seasonally adjusted
using X11 multiplicative provided by RATS.
This study uses monthly data from January 2001 until December 2011. Data are collected from various sources
such as the Monthly Indonesian Economics and Financial Statistics produced by Bank Indonesia (www.bi.go.id),
Economic Indicators of Indonesian Statistics Agency or BPS/Badan Pusat Statistik (www.bps.go.id), Indonesian
Stock Exchange market (www.idx.co.id), Directorate General of Debt Management of treasury department
1.8 1.5
0.8
1.7
0.1
0.6
0.1
-0.5
-0.9
-1.3
-0.1
-1.6
-0.7
-1.2
-2
-1.5
-1
-0.5
0
0.5
1
1.5
2
2005 2006 2007 2008 2009 2010 2011
overal balance - % of GDP
Primary balance -% of GDP
Proceeding - Kuala Lumpur International Business, Economics and Law Conference Vol. 3.
November 29 - 30, 2014. Hotel Putra, Kuala Lumpur, Malaysia. ISBN 978-967-11350-4-4
63
(www.djpu.kemenkeu.go.id), the world oil price data is taken from the website www.indexmundi.com. Some
variables that are not available in monthly data, such as GDP (data in quarterly basis) and Debt (data from 2000 until
2008 are not provided in monthly but quarterly) are interpolated using cubic match last.1
The reduced form model is an unrestricted VAR. This study uses an unrestricted VAR since it is a good
approximation to the DGP of any vector of time series, as long as enough lags are included (see e.g. Canova and
Nicolo, 2002) and the VAR model is specified in level.2 The studies that employ the reduced form VAR models,
which include real activity, inflation and measures of interest rates and money have been examined by many authors
such as Sims and Zha (1999), Canova and Nicolo (2002), Uhlig (2005), Vargas-Silva (2008), Scholl and Uhlig
(2008), Rafiq and Mallick (2008), Mountford and Uhlig (2009), Dungey and Fry (2009), and Peersman and Straub
(2009), however Peersman and Straub (2009) also use the first difference in their analysis for the robustness check
purposes.
One widely used strategy for estimating the effect of any shock is Vector Auto Regression. In VAR approach, it
assumes that the error term , are related to the structural macroeconomic shocks , via matrix such that .
In the case of monetary policy shock, given some VAR coefficient matrices
, some error variance-
covariance matrix , and some horizon , let b eset of all monetary policy impulse vectors. Furthermore,
Uhlig (2005) proposed penalty function approach. The point is that this approach will find the best impulse vector
for any given . If the set is empty, the penalty function approach will find an impulse vector which
comes as close as possible satisfying the sign restrictions by minimizing a penalty for sign restriction violation,for the
detailed discussion see Uhlig (2005).
This paper implements the method proposed by Mountford and Uhlig (2009) that extended the method of Uhlig
(2005). Suppose that is positive definit matrix. Let given impulse matrix of size n be a submatrix of
two matrices , with . They identified at least three fundamental shocks and so needs to
characterize an impulse matrix a 1 a 2 a 3 of rank 3 rather than all . This can be done by implementing sign
restriction on the impulse response. They set the covariance between the fundamental shocks t 1
t 2
t 3
corresponding to a 1 a 2 a 3 zero (these fundamental shocks are orthogonal.
Identification Strategy
This section discusses the model based identification strategy. This study orders 10 variables in the VAR model
consist of oil price ( P), real output ( ), debt to GDP ratio (D ), inflation ( ), money supply (M), interest rate (ir),
total reserve ( es), real investment (Inv), real exchange rate ( ), and stock price (SP). The model follows the
empirical approach in some studies. Bernanke and Mihov (2008) and Uhlig (2005) used real GDP, the GDP deflator,
commodity price index, total reserve, nonborrowed reserve and federal fund rate for US case. Mountford and Uhlig
(2009) used VAR in GDP, private consumption, total government expenditure, total government revenue, real wage,
private non-residential investment, interest rate, adjusted reserves, the producer price index for crude material and
GDP deflator for the US case. This study takes into account the oil price (in the first order), money supply (in the fifth
order), the real exchange rate (in the ninth order) and the stock price (in the last order) to accommodate the small open
economy model and this is similar to the study of Jarocinski and Smets (2008), Scholl and Uhlig (2008), Jääskelä and
Jennings (2011), An and Wang (2012).
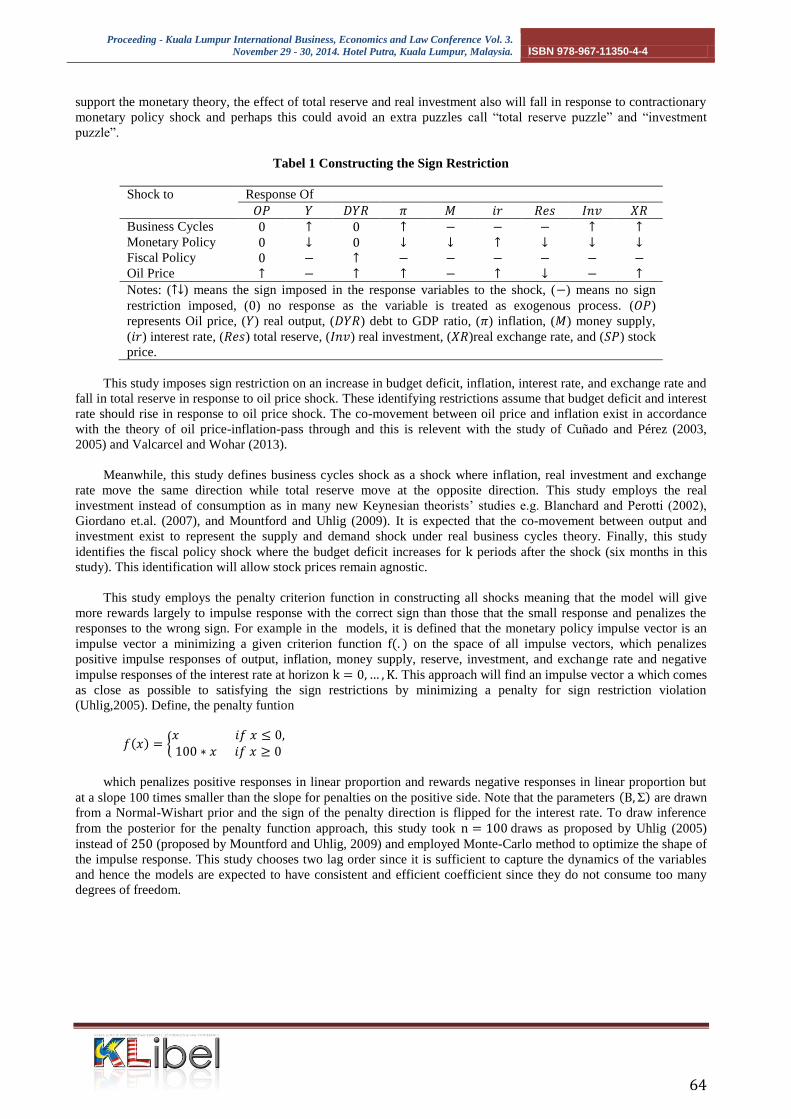
Tabel 1 shows the identification of the sign restriction on impulse response’s V analysis. In the model, oil
price shock enters the VAR model as exogenous processes and this study assumes that domestic shocks do not affect
the oil price. As Uhlig (2005) proposed, this study employs sign restriction approach based on the theoretical
background. This study also remains agnostic about the response of stock price to all the shocks in the model. By
construction, this study avoids the price, exchange rate, liquidity, exchange rate and output puzzles by assuming that
inflation, monetary aggregate, exchange rate and output fall in response to a contractionary monetary policy for the k
impact period (this study assumes k equal 6 months) and left unrestricted after 6 months. Furthermore, In order to
1 option for interpolating from low to high frequency data provided by the Eviews 6. The detailed formula of cubic
match last is available at EVIEWS 6 user’s guide 2 The data used in this study in levels form because implicit cointegration relationships exist in the series (see Sims
et. al., 1990). In addition, this study does not want to lose any information if the VAR is estimated in first difference compare to the loss of efficiency (when the VAR is estimated in levels, but without imposing any cointegrating relationships), for further discussion see Ramaswamy and Sloek (1998), Zaidi and Fisher(2010)
Proceeding - Kuala Lumpur International Business, Economics and Law Conference Vol. 3.
November 29 - 30, 2014. Hotel Putra, Kuala Lumpur, Malaysia. ISBN 978-967-11350-4-4
64
support the monetary theory, the effect of total reserve and real investment also will fall in response to contractionary
monetary policy shock and perhaps this could avoid an extra puzzles call “total reserve puzzle” and “investment
puzzle”.
Tabel 1 Constructing the Sign Restriction
Shock to Response Of
Business Cycles
Monetary Policy Fiscal Policy
Oil Price
Notes: ( ) means the sign imposed in the response variables to the shock, ( ) means no sign
restriction imposed, ( ) no response as the variable is treated as exogenous process. ( )
represents Oil price, ( ) real output, ( ) debt to GDP ratio, ( ) inflation, ( ) money supply,
( ) interest rate, ( ) total reserve, ( ) real investment, ( )real exchange rate, and ( ) stock
price.
This study imposes sign restriction on an increase in budget deficit, inflation, interest rate, and exchange rate and
fall in total reserve in response to oil price shock. These identifying restrictions assume that budget deficit and interest
rate should rise in response to oil price shock. The co-movement between oil price and inflation exist in accordance
with the theory of oil price-inflation-pass through and this is relevent with the study of Cuñado and Pérez (2003,
2005) and Valcarcel and Wohar (2013).
Meanwhile, this study defines business cycles shock as a shock where inflation, real investment and exchange
rate move the same direction while total reserve move at the opposite direction. This study employs the real
investment instead of consumption as in many new Keynesian theorists’ studies e.g. Blanchard and Perotti (2002),
Giordano et.al. (2007), and Mountford and Uhlig (2009). It is expected that the co-movement between output and
investment exist to represent the supply and demand shock under real business cycles theory. Finally, this study
identifies the fiscal policy shock where the budget deficit increases for periods after the shock (six months in this
study). This identification will allow stock prices remain agnostic.
This study employs the penalty criterion function in constructing all shocks meaning that the model will give
more rewards largely to impulse response with the correct sign than those that the small response and penalizes the
responses to the wrong sign. For example in the models, it is defined that the monetary policy impulse vector is an
impulse vector minimizing a given criterion function on the space of all impulse vectors, which penalizes
positive impulse responses of output, inflation, money supply, reserve, investment, and exchange rate and negative
impulse responses of the interest rate at horizon . This approach will find an impulse vector which comes
as close as possible to satisfying the sign restrictions by minimizing a penalty for sign restriction violation
(Uhlig,2005). Define, the penalty funtion
which penalizes positive responses in linear proportion and rewards negative responses in linear proportion but
at a slope 100 times smaller than the slope for penalties on the positive side. Note that the parameters are drawn
from a Normal-Wishart prior and the sign of the penalty direction is flipped for the interest rate. To draw inference
from the posterior for the penalty function approach, this study took draws as proposed by Uhlig (2005)
instead of (proposed by Mountford and Uhlig, 2009) and employed Monte-Carlo method to optimize the shape of
the impulse response. This study chooses two lag order since it is sufficient to capture the dynamics of the variables
and hence the models are expected to have consistent and efficient coefficient since they do not consume too many
degrees of freedom.
Proceeding - Kuala Lumpur International Business, Economics and Law Conference Vol. 3.
November 29 - 30, 2014. Hotel Putra, Kuala Lumpur, Malaysia. ISBN 978-967-11350-4-4
65
5. Estimation Results
This section discusses the results of impulse responses of all variables (except the oil price) to each shock. This
study aims to analyze the responses of key variables only, not to all variables. The shocks are identified for each draw
from the posterior and 68% posterior band of the median response function is used.
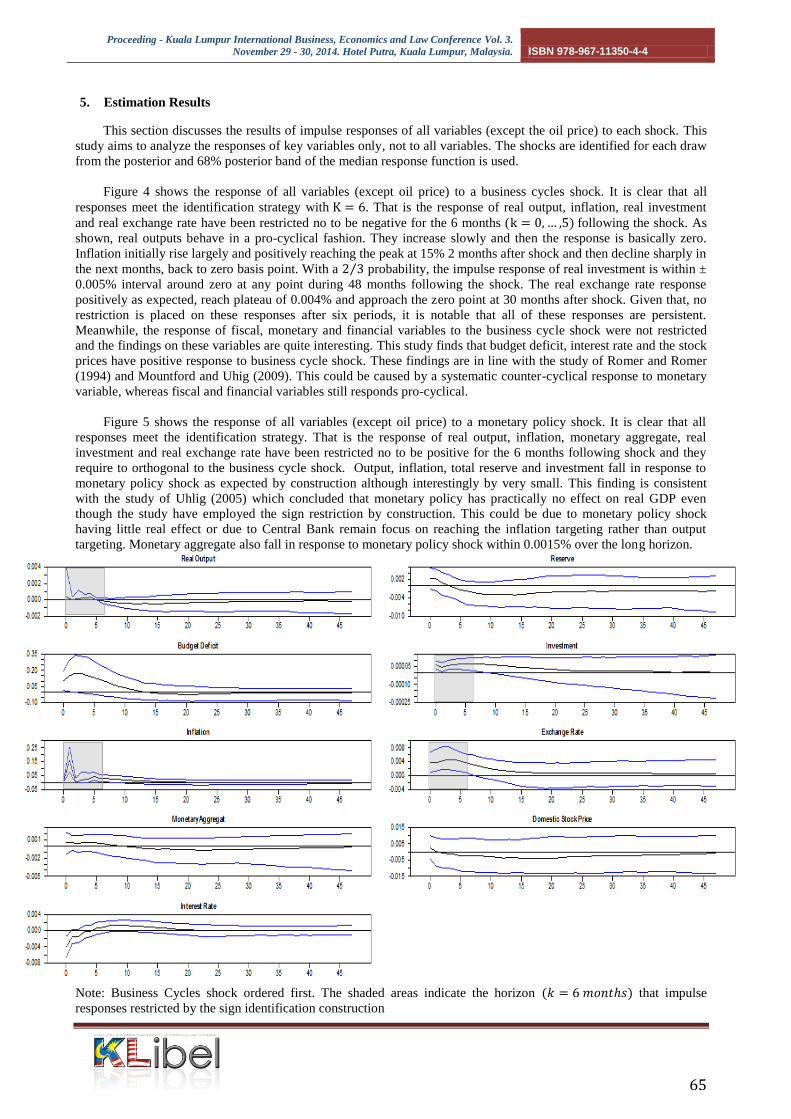
Figure 4 shows the response of all variables (except oil price) to a business cycles shock. It is clear that all
responses meet the identification strategy with . That is the response of real output, inflation, real investment
and real exchange rate have been restricted no to be negative for the 6 months ( following the shock. As
shown, real outputs behave in a pro-cyclical fashion. They increase slowly and then the response is basically zero.
Inflation initially rise largely and positively reaching the peak at 15% 2 months after shock and then decline sharply in
the next months, back to zero basis point. With a probability, the impulse response of real investment is within ±
0.005% interval around zero at any point during 48 months following the shock. The real exchange rate response
positively as expected, reach plateau of 0.004% and approach the zero point at 30 months after shock. Given that, no
restriction is placed on these responses after six periods, it is notable that all of these responses are persistent.
Meanwhile, the response of fiscal, monetary and financial variables to the business cycle shock were not restricted
and the findings on these variables are quite interesting. This study finds that budget deficit, interest rate and the stock
prices have positive response to business cycle shock. These findings are in line with the study of Romer and Romer
(1994) and Mountford and Uhig (2009). This could be caused by a systematic counter-cyclical response to monetary
variable, whereas fiscal and financial variables still responds pro-cyclical.
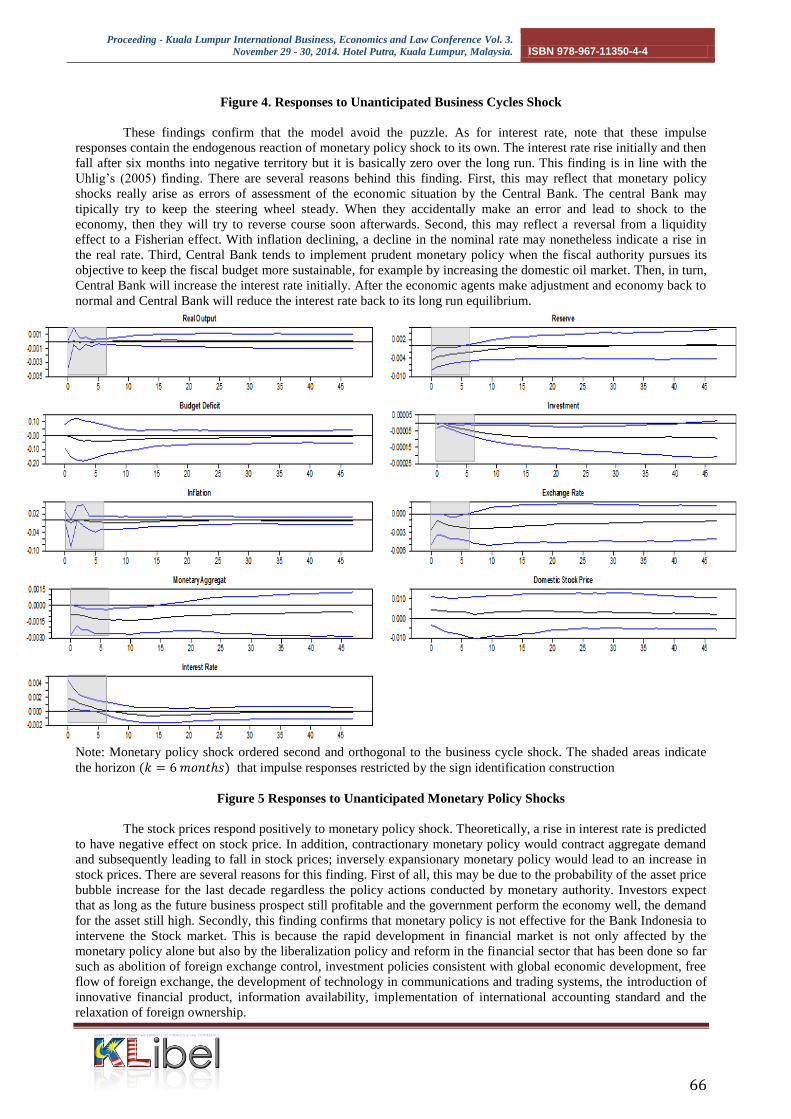
Figure 5 shows the response of all variables (except oil price) to a monetary policy shock. It is clear that all
responses meet the identification strategy. That is the response of real output, inflation, monetary aggregate, real
investment and real exchange rate have been restricted no to be positive for the 6 months following shock and they
require to orthogonal to the business cycle shock. Output, inflation, total reserve and investment fall in response to
monetary policy shock as expected by construction although interestingly by very small. This finding is consistent
with the study of Uhlig (2005) which concluded that monetary policy has practically no effect on real GDP even
though the study have employed the sign restriction by construction. This could be due to monetary policy shock
having little real effect or due to Central Bank remain focus on reaching the inflation targeting rather than output
targeting. Monetary aggregate also fall in response to monetary policy shock within 0.0015% over the long horizon.
Note: Business Cycles shock ordered first. The shaded areas indicate the horizon that impulse
responses restricted by the sign identification construction
Proceeding - Kuala Lumpur International Business, Economics and Law Conference Vol. 3.
November 29 - 30, 2014. Hotel Putra, Kuala Lumpur, Malaysia. ISBN 978-967-11350-4-4
66
Figure 4. Responses to Unanticipated Business Cycles Shock
These findings confirm that the model avoid the puzzle. As for interest rate, note that these impulse
responses contain the endogenous reaction of monetary policy shock to its own. The interest rate rise initially and then
fall after six months into negative territory but it is basically zero over the long run. This finding is in line with the
Uhlig’s (2005) finding. There are several reasons behind this finding. First, this may reflect that monetary policy
shocks really arise as errors of assessment of the economic situation by the Central Bank. The central Bank may
tipically try to keep the steering wheel steady. When they accidentally make an error and lead to shock to the
economy, then they will try to reverse course soon afterwards. Second, this may reflect a reversal from a liquidity
effect to a Fisherian effect. With inflation declining, a decline in the nominal rate may nonetheless indicate a rise in
the real rate. Third, Central Bank tends to implement prudent monetary policy when the fiscal authority pursues its
objective to keep the fiscal budget more sustainable, for example by increasing the domestic oil market. Then, in turn,
Central Bank will increase the interest rate initially. After the economic agents make adjustment and economy back to
normal and Central Bank will reduce the interest rate back to its long run equilibrium.
Note: Monetary policy shock ordered second and orthogonal to the business cycle shock. The shaded areas indicate
the horizon that impulse responses restricted by the sign identification construction
Figure 5 Responses to Unanticipated Monetary Policy Shocks
The stock prices respond positively to monetary policy shock. Theoretically, a rise in interest rate is predicted
to have negative effect on stock price. In addition, contractionary monetary policy would contract aggregate demand
and subsequently leading to fall in stock prices; inversely expansionary monetary policy would lead to an increase in
stock prices. There are several reasons for this finding. First of all, this may be due to the probability of the asset price
bubble increase for the last decade regardless the policy actions conducted by monetary authority. Investors expect
that as long as the future business prospect still profitable and the government perform the economy well, the demand
for the asset still high. Secondly, this finding confirms that monetary policy is not effective for the Bank Indonesia to
intervene the Stock market. This is because the rapid development in financial market is not only affected by the
monetary policy alone but also by the liberalization policy and reform in the financial sector that has been done so far
such as abolition of foreign exchange control, investment policies consistent with global economic development, free
flow of foreign exchange, the development of technology in communications and trading systems, the introduction of
innovative financial product, information availability, implementation of international accounting standard and the
relaxation of foreign ownership.
Proceeding - Kuala Lumpur International Business, Economics and Law Conference Vol. 3.
November 29 - 30, 2014. Hotel Putra, Kuala Lumpur, Malaysia. ISBN 978-967-11350-4-4
67
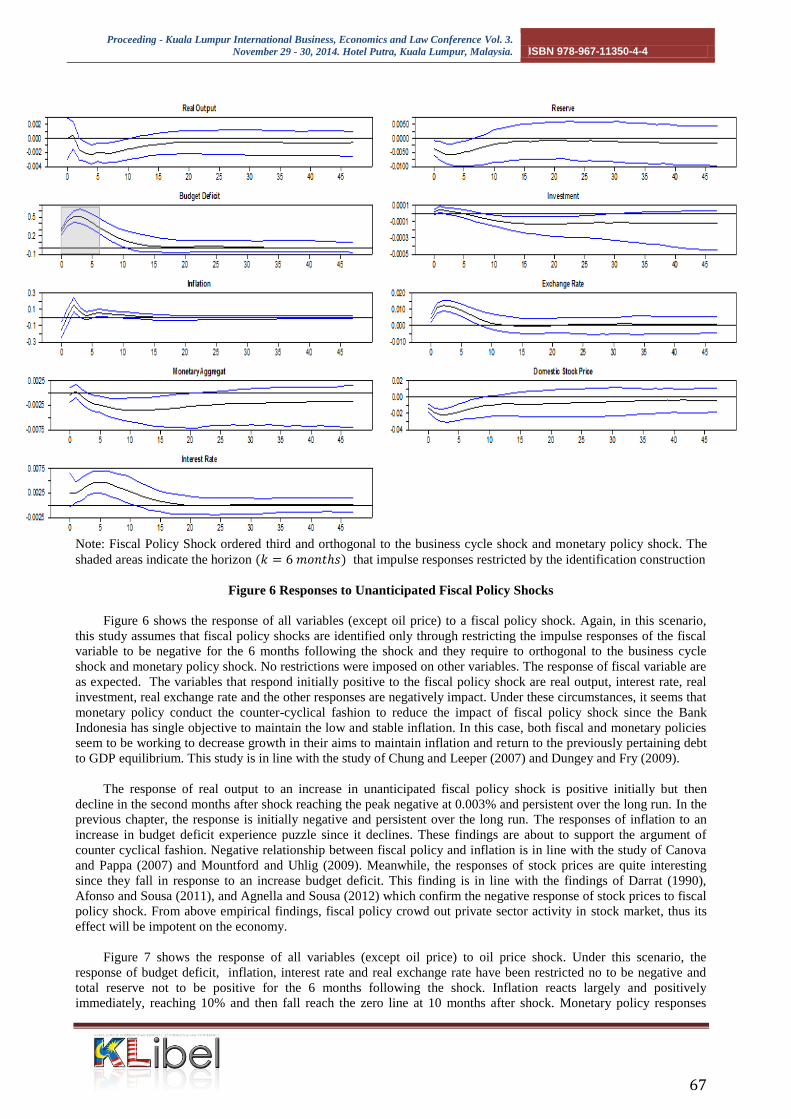
Note: Fiscal Policy Shock ordered third and orthogonal to the business cycle shock and monetary policy shock. The
shaded areas indicate the horizon that impulse responses restricted by the identification construction
Figure 6 Responses to Unanticipated Fiscal Policy Shocks
Figure 6 shows the response of all variables (except oil price) to a fiscal policy shock. Again, in this scenario,
this study assumes that fiscal policy shocks are identified only through restricting the impulse responses of the fiscal
variable to be negative for the 6 months following the shock and they require to orthogonal to the business cycle
shock and monetary policy shock. No restrictions were imposed on other variables. The response of fiscal variable are
as expected. The variables that respond initially positive to the fiscal policy shock are real output, interest rate, real
investment, real exchange rate and the other responses are negatively impact. Under these circumstances, it seems that
monetary policy conduct the counter-cyclical fashion to reduce the impact of fiscal policy shock since the Bank
Indonesia has single objective to maintain the low and stable inflation. In this case, both fiscal and monetary policies
seem to be working to decrease growth in their aims to maintain inflation and return to the previously pertaining debt
to GDP equilibrium. This study is in line with the study of Chung and Leeper (2007) and Dungey and Fry (2009).
The response of real output to an increase in unanticipated fiscal policy shock is positive initially but then
decline in the second months after shock reaching the peak negative at 0.003% and persistent over the long run. In the
previous chapter, the response is initially negative and persistent over the long run. The responses of inflation to an
increase in budget deficit experience puzzle since it declines. These findings are about to support the argument of
counter cyclical fashion. Negative relationship between fiscal policy and inflation is in line with the study of Canova
and Pappa (2007) and Mountford and Uhlig (2009). Meanwhile, the responses of stock prices are quite interesting
since they fall in response to an increase budget deficit. This finding is in line with the findings of Darrat (1990),
Afonso and Sousa (2011), and Agnella and Sousa (2012) which confirm the negative response of stock prices to fiscal
policy shock. From above empirical findings, fiscal policy crowd out private sector activity in stock market, thus its
effect will be impotent on the economy.
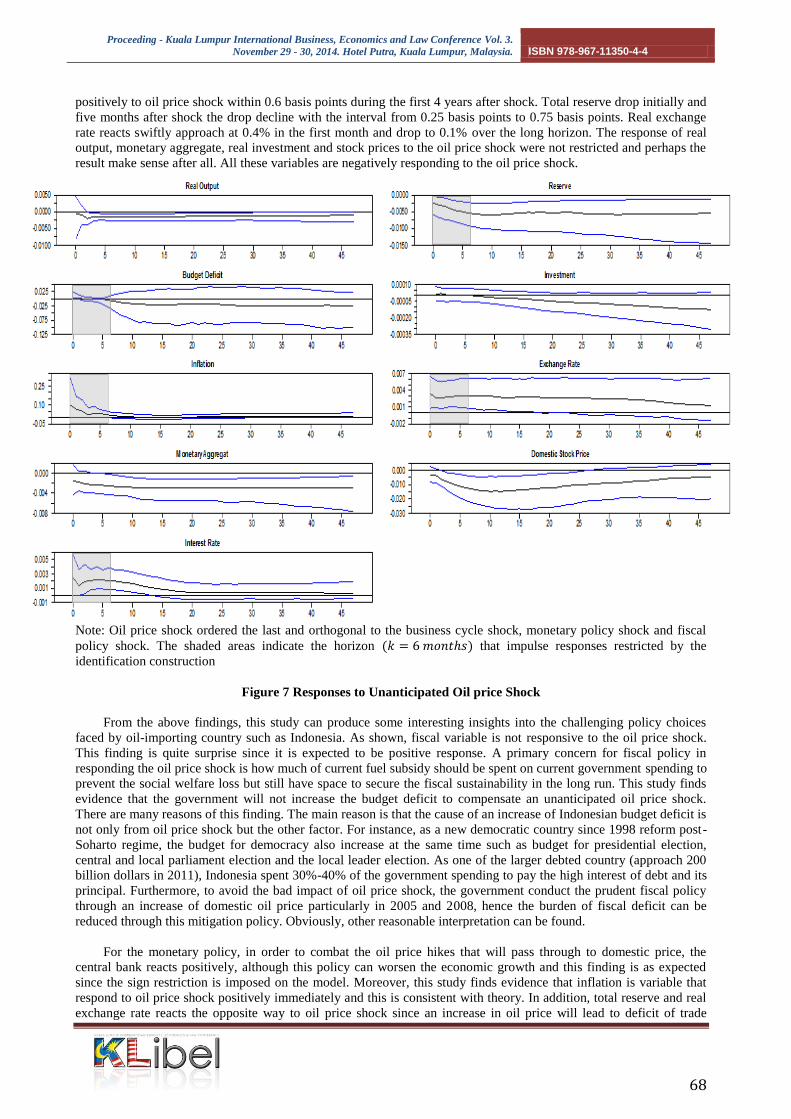
Figure 7 shows the response of all variables (except oil price) to oil price shock. Under this scenario, the
response of budget deficit, inflation, interest rate and real exchange rate have been restricted no to be negative and
total reserve not to be positive for the 6 months following the shock. Inflation reacts largely and positively
immediately, reaching 10% and then fall reach the zero line at 10 months after shock. Monetary policy responses
Proceeding - Kuala Lumpur International Business, Economics and Law Conference Vol. 3.
November 29 - 30, 2014. Hotel Putra, Kuala Lumpur, Malaysia. ISBN 978-967-11350-4-4
68
positively to oil price shock within 0.6 basis points during the first 4 years after shock. Total reserve drop initially and
five months after shock the drop decline with the interval from 0.25 basis points to 0.75 basis points. Real exchange
rate reacts swiftly approach at 0.4% in the first month and drop to 0.1% over the long horizon. The response of real
output, monetary aggregate, real investment and stock prices to the oil price shock were not restricted and perhaps the
result make sense after all. All these variables are negatively responding to the oil price shock.
Note: Oil price shock ordered the last and orthogonal to the business cycle shock, monetary policy shock and fiscal
policy shock. The shaded areas indicate the horizon that impulse responses restricted by the
identification construction
Figure 7 Responses to Unanticipated Oil price Shock
From the above findings, this study can produce some interesting insights into the challenging policy choices
faced by oil-importing country such as Indonesia. As shown, fiscal variable is not responsive to the oil price shock.
This finding is quite surprise since it is expected to be positive response. A primary concern for fiscal policy in
responding the oil price shock is how much of current fuel subsidy should be spent on current government spending to
prevent the social welfare loss but still have space to secure the fiscal sustainability in the long run. This study finds
evidence that the government will not increase the budget deficit to compensate an unanticipated oil price shock.
There are many reasons of this finding. The main reason is that the cause of an increase of Indonesian budget deficit is
not only from oil price shock but the other factor. For instance, as a new democratic country since 1998 reform post-
Soharto regime, the budget for democracy also increase at the same time such as budget for presidential election,
central and local parliament election and the local leader election. As one of the larger debted country (approach 200
billion dollars in 2011), Indonesia spent 30%-40% of the government spending to pay the high interest of debt and its
principal. Furthermore, to avoid the bad impact of oil price shock, the government conduct the prudent fiscal policy
through an increase of domestic oil price particularly in 2005 and 2008, hence the burden of fiscal deficit can be
reduced through this mitigation policy. Obviously, other reasonable interpretation can be found.
For the monetary policy, in order to combat the oil price hikes that will pass through to domestic price, the
central bank reacts positively, although this policy can worsen the economic growth and this finding is as expected
since the sign restriction is imposed on the model. Moreover, this study finds evidence that inflation is variable that
respond to oil price shock positively immediately and this is consistent with theory. In addition, total reserve and real
exchange rate reacts the opposite way to oil price shock since an increase in oil price will lead to deficit of trade
Proceeding - Kuala Lumpur International Business, Economics and Law Conference Vol. 3.
November 29 - 30, 2014. Hotel Putra, Kuala Lumpur, Malaysia. ISBN 978-967-11350-4-4
69
balance and exchange rate to depreciate regarding an increase in oil import. The stock prices response the opposite
direction to the oil price shock and these circumstances has motivated the investor to adjust their portfolio to move
their capital to other asset in order to avoid the capital loss regarding the slowdown of Indonesian economy since
Indonesia become net importer oil country.
Robustness Check
In this section, this study attempts to check the robustness of the empirical results. In particular, this study
investigates the findings of the VAR analysis using four basic aspects. First of all, this study investigates whether the
specification of the variables in first differences for the results different from those on the basic model. Second of all,
this study runs the VAR model using the central bank policy rate (certificate bank Indonesia) to replace the interbank
offer rate (IBOR) as in basic model and analyze whether the second specification perform similar to the basic model.
Thirdly, this study re-estimates the basic model using various of lag such as 4, 6, and 8 and check the difference with
the original model which use lag 2. The results from the visual inspection of the responses to all shocks on these four
specifications show that model is robust.3
6. Conclusion
The aim of the study is to investigate the effect of oil price shock, business cycles, monetary and policy shocks
on Indonesian economy using sign restriction VAR developed by Mountford and Uhlig (2009). Overall, the results of
the study are consistent with standard economic theory. The findings stated that budget deficit, interest rate and the
stock prices have positive response to business cycle shock. Monetary policy has practically no effect on real GDP
even though this study employed the sign restriction by construction. This could be due to monetary policy shock
having little real effect or due to Central Bank remain focus on reaching the inflation targeting rather than output
targeting. The stock prices response positively to monetary policy shock . This study also found the negative
relationship between fiscal policy and inflation. From this empirical findings, fiscal policy crowd out private sector
activity in market, thus its effect will be impotent on the economy and particularly on the financial market. Moreover,
fiscal policy is not responsive to oil price shock. In addition, the stock prices response the opposite direction to the oil
price shock.
Refference
Afonso, António, & Sousa, Ricardo M. (2011). What are the effects of fiscal policy on asset markets? Economic
Modelling, 28(4), 1871-1890. doi: http://dx.doi.org/10.1016/j.econmod.2011.03.018
Agnello, Luca, Castro, Vítor, & Sousa, Ricardo M. (2012). How does fiscal policy react to wealth composition and
asset prices? Journal of Macroeconomics, 34(3), 874-890. doi:
http://dx.doi.org/10.1016/j.jmacro.2012.04.001
An, Lian, & Wang, Jian. (2012). Exchange rate pass-through: Evidence based on vector autoregression with sign
restrictions. Open Economies Review, 23(2), 359-380.
Agustina, Cut Dian RD, del Granado, Javier Arze, Bulman, Tim, Fengler, Wolfgang, & Ikhsan, Mohamad. (2008).
Black hole or black gold? the impact of oil and gas prices on Indonesia's public finances: The World Bank.
Barro, Robert J. (1990). The stock market and investment. Review of Financial Studies, 3(1), 115-131.
Bernanke, Ben S., & Mihov, Ilian. (1998). The liquidity effect and long-run neutrality. Carnegie-Rochester
Conference Series on Public Policy, 49(0), 149-194. doi: http://dx.doi.org/10.1016/S0167-2231(99)00007-X
Bernanke, Ben S, & Gertler, Mark. (2001). Should central banks respond to movements in asset prices? The American
Economic Review, 91(2), 253-257.
Blanchard, Olivier, & Perotti, Roberto. (2002). An empirical characterization of the dynamic effects of changes in
government spending and taxes on output. the Quarterly Journal of economics, 117(4), 1329-1368.
Bohn, Henning. (1998). The behavior of US public debt and deficits. the Quarterly Journal of economics, 113(3),
949-963.
Canova, Fabio, & Pappa, Evi. (2007). Price Differentials in Monetary Unions: The Role of Fiscal Shocks*. The
Economic Journal, 117(520), 713-737.
Castelnuovo, Efrem, & Nisticò, Salvatore. (2010). Stock market conditions and monetary policy in a DSGE model
for the US. Journal of Economic Dynamics and Control, 34(9), 1700-1731.
Cheung, Yin-Wong, He, Jia, & Ng, Lilian K. (1997). What are the global sources of rational variation in international
equity returns? Journal of International Money and Finance, 16(6), 821-836.
3 The results of the robustness check is upon request
Proceeding - Kuala Lumpur International Business, Economics and Law Conference Vol. 3.
November 29 - 30, 2014. Hotel Putra, Kuala Lumpur, Malaysia. ISBN 978-967-11350-4-4
70
Christiano, Lawrence J, Eichenbaum, Martin, & Evans, Charles L. (1999). Monetary policy shocks: What have we
learned and to what end? Handbook of macroeconomics, 1, 65-148.
Chung, Hess, & Leeper, Eric M. (2007). What has financed government debt? : National Bureau of Economic
Research. http://www.nber.org/papers/w13425
Click, Reid W, & Plummer, Michael G. (2005). Stock market integration in ASEAN after the Asian financial crisis.
Journal of Asian Economics, 16(1), 5-28.
Cologni, Alessandro, & Manera, Matteo. (2005). Oil Prices, Inflation and Interest Rates in a Sstructural Cointegrated
VAR Model for the G-7 Countries.
Cuñado, Juncal, & Pérez de Gracia, Fernando. (2003). Do oil price shocks matter? Evidence for some European
countries. Energy Economics, 25(2), 137-154.
Cunado, Juncal, & Pérez de Gracia, Fernando. (2005). Oil prices, economic activity and inflation: evidence for some
Asian countries. The Quarterly Review of Economics and Finance, 45(1), 65-83.
Darrat, Ali F. (1990). Stock returns, money, and fiscal deficits. Journal of Financial and Quantitative Analysis,
25(03), 387-398.
Dartanto, Teguh. (2013). Reducing fuel subsidies and the implication on fiscal balance and poverty in Indonesia: A
simulation analysis. Energy Policy.
Dedola, Luca, & Neri, Stefano. (2007). What does a technology shock do? A VAR analysis with model-based sign
restrictions. Journal of Monetary Economics, 54(2), 512-549.
Dungey, Mardi, & Fry, Renée. (2009). The identification of fiscal and monetary policy in a structural VAR. Economic
Modelling, 26(6), 1147-1160.
El-Sharif, Idris, Brown, Dick, Burton, Bruce, Nixon, Bill, & Russell, Alex. (2005). Evidence on the nature and extent
of the relationship between oil prices and equity values in the UK. Energy Economics, 27(6), 819-830.
Fama, Eugene F. (1990). Stock returns, expected returns, and real activity. The Journal of Finance, 45(4), 1089-1108.
Fama, Eugene F. (1991). Efficient capital markets: II. The journal of finance, 46(5), 1575-1617.
Favero, Carlo, & Giavazzi, Francesco. (2007). Debt and the effects of fiscal policy: National Bureau of Economic
Research.
Franta, Michal. (2011). Identification of monetary policy shocks in Japan using sign restrictions within the TVP-VAR
framework: Institute for Monetary and Economic Studies, Bank of Japan.
Giordano, Raffaela, Momigliano, Sandro, Neri, Stefano, & Perotti, Roberto. (2007). The effects of fiscal policy in
Italy: Evidence from a VAR model. European Journal of Political Economy, 23(3), 707-733.
Hermawan, Danny, & Munro, A. (2008). Monetary‐ Fiscal Interaction in Indonesia. Journal on Bank for
International Settlements, 272.
Inoue, Atsushi, & Kilian, Lutz. (2011). Inference on impulse response functions in structural VAR models. CEPR
Discussion Paper No. DP8419.
Jääskelä, Jarkko P, & Jennings, David. (2011). Monetary policy and the exchange rate: Evaluation of VAR models.
Journal of International Money and Finance, 30(7), 1358-1374.
Jarocinski, Marek, & Smets, Frank. (2008). House prices and the stance of monetary policy. Federal reserve Bank of
St Louis Review, 339-365.
Jones, Donald W, Leiby, Paul N, & Paik, Inja K. (2004). Oil price shocks and the macroeconomy: what has been
learned since 1996. ENERGY JOURNAL-CAMBRIDGE MA THEN CLEVELAND OH-, 25(2), 1-32.
Karim, Zulkefly Abdul. (2013). Interest Rates Targeting of Monetary Policy: An Open-Economy SVAR Study of
Malaysia. Paper presented at the The Malaysian National Economic Conference / Persidangan Kebangsaan
Ekonomi Malaysia (PERKEM) VIII, Malaysia.
Kaul, Gautam, & Seyhun, H Nejat. (1990). Relative price variability, real shocks, and the stock market. The Journal
of Finance, 45(2), 479-496.
Kilian, Lutz, & Murphy, Daniel P. (2012). Why agnostic sign restrictions are not enough: understanding the dynamics
of oil market VAR models. Journal of the European Economic Association, 10(5), 1166-1188.
Kormilitsina, Anna. (2011). Oil price shocks and the optimality of monetary policy. Review of Economic Dynamics,
14(1), 199-223.
Laopodis, Nikiforos T. (2009). Fiscal policy and stock market efficiency: Evidence for the United States. The
quarterly Review of Economics and finance, 49(2), 633-650.
Li, un Daisy, İşcan, Talan B, & u, Kuan. (2010). The impact of monetary policy shocks on stock prices: Evidence
from Canada and the United States. Journal of International Money and Finance, 29(5), 876-896.
Lippi, Francesco, & Nobili, Andrea. (2008). Oil and the macroeconomy: A structural VAR analysis with sign
restrictions. Bank of Italia
Lütkepohl, Helmut, & Netšunajev, leksei. (2013). Disentangling demand and supply shocks in the crude oil market:
How to check sign restrictions in structural VARs. Journal of Applied Econometrics.
Masih, Rumi, Peters, Sanjay, & De Mello, Lurion. (2011). Oil price volatility and stock price fluctuations in an
emerging market: Evidence from South Korea. Energy Economics, 33(5), 975-986.
Proceeding - Kuala Lumpur International Business, Economics and Law Conference Vol. 3.
November 29 - 30, 2014. Hotel Putra, Kuala Lumpur, Malaysia. ISBN 978-967-11350-4-4
71
Mountford, Andrew, & Uhlig, Harald. (2009). What are the effects of fiscal policy shocks? Journal of applied
econometrics, 24(6), 960-992.
Muscatelli, V Anton, Tirelli, Patrizio, & Trecroci, Carmine. (2004). Fiscal and monetary policy interactions:
Empirical evidence and optimal policy using a structural New-Keynesian model. Journal of
Macroeconomics, 26(2), 257-280.
Narayan, Paresh Kumar, & Narayan, Seema. (2010). Modelling the impact of oil prices on Vietnam’s stock prices.
Applied Energy, 87(1), 356-361.
Pappa, Evi. (2009). The Effects Of Fiscal Shocks On Employment And The Real Wage*. International Economic
Review, 50(1), 217-244.
Papapetrou, Evangelia. (2001). Oil price shocks, stock market, economic activity and employment in Greece. Energy
Economics, 23(5), 511-532.
Peersman, Gert, & Straub, Roland. (2009). Technology Shocks And Robust Sign Restrictions In A Euro Area
SVAR*. International Economic Review, 50(3), 727-750.
Ramaswamy, Ramana, & Sloek, Torsten. (1998). The real effects of monetary policy in the European Union: What
are the differences? IMF staff papers, 45(2), 374-396.
Rafiq, M. S., & Mallick, S. K. (2008). The effect of monetary policy on output in EMU3: A sign restriction approach.
Journal of Macroeconomics, 30(4), 1756-1791. doi: http://dx.doi.org/10.1016/j.jmacro.2007.12.003
Rigobon, Roberto, & Sack, Brian. (2003). Measuring the reaction of monetary policy to the stock market. The
quarterly journal of Economics, 118(2), 639-669.
Sadorsky, Perry. (1999). Oil price shocks and stock market activity. Energy Economics, 21(5), 449-469.
Scholl, Almuth, & Uhlig, Harald. (2008). New evidence on the puzzles: Results from agnostic identification on
monetary policy and exchange rates. Journal of International Economics, 76(1), 1-13.
Schwert, G William. (1990). Stock returns and real activity: A century of evidence. The Journal of Finance, 45(4),
1237-1257.
Semmler, Willi, & Zhang, Wenlang. (2007). Asset price volatility and monetary policy rules: a dynamic model and
empirical evidence. Economic Modelling, 24(3), 411-430.
Shah, Imran. (2012). Revisiting the Dynamic Effects of Oil Price Shock on Small Developing Economies: Department
of Economics, University of Bristol, UK.
Sims, Christopher A, Stock, James H, & Watson, Mark W. (1990). Inference in linear time series models with some
unit roots. Econometrica: Journal of the Econometric Society, 113-144.
Sims, Christopher A. (1992). Interpreting the macroeconomic time series facts: the effects of monetary policy.
European Economic Review, 36(5), 975-1000.
Sims, Christopher A, & Zha, Tao. (1999). Error bands for impulse responses. Econometrica, 67(5), 1113-1155.
Son, Hyun H. (2008). Conditional Cash Transfer Programs: An Effective Tool for Poverty Alleviation? : Asian
Development Bank.
Tachibana, Minoru. (2013). How have inflation-targeting central banks responded to supply shocks? Economics
Letters.
Thorbecke, Willem. (1997). On stock market returns and monetary policy. The Journal of Finance, 52(2), 635-654.
Tillmann, Peter. (2013). Capital inflows and asset prices: Evidence from emerging Asia. Journal of Banking &
Finance, 37(3), 717-729. doi: http://dx.doi.org/10.1016/j.jbankfin.2012.10.017
Tsouma, Ekaterini. (2009). Stock returns and economic activity in mature and emerging markets. The Quarterly
Review of Economics and Finance, 49(2), 668-685.
Uhlig, Harald. (2005). What are the effects of monetary policy on output? Results from an agnostic identification
procedure. Journal of Monetary Economics, 52(2), 381-419.
Valcarcel, Victor, & Wohar, Mark. (2013). Changes in the Oil Price-Inflation Pass-through. Journal of Economics
and Business.
Vargas-Silva, Carlos. (2008). Monetary policy and the US housing market: A VAR analysis imposing sign
restrictions. Journal of Macroeconomics, 30(3), 977-990.
Wang, Yudong, Wu, Chongfeng, & Yang, Li. (2013). Oil price shocks and stock market activities: Evidence from oil-
importing and oil-exporting countries. Journal of Comparative Economics.
www.bi.go.id
www.bps.go.id
www.idx.co.id
www.djpu.kemenkeu.go.id
www.indexmundi.com
Zaidi, Mohd Azlan Shah, & Fisher, Lance A. (2010). Monetary policy and foreign shocks: a SVAR analysis for
Malaysia. Korean and the World Economy, 11(3), 527-550.
Zaidi, Mohd Azlan Shah, & Karim, Zulkefly Abdul. (2012). Relative Importance of Singapore, US and Japanese
Shocks on Malaysian Economy: An SVAR with Sign Restriction Analysis. Paper presented at the Persidangan
Kebangsaan Ekonomi Malaysia VII (PERKEM VII), Malaysia.