Embed Size (px)
Citation preview
February 1, 2005
Lehman BrothersTwenty-Second Annual
Industrial Select Conference
R
2
Agenda
“This is Lear” Video
Strategic Overview / Industry Trends
Bob Rossiter, Chairman & CEO
Our Approach to Creating Shareholder Value
Jim Vandenberghe, Vice Chairman
Q & A Session
3
Highlights of Today’s Presentation
Our customer-focused strategy is delivering profitable growthIndustry trends for automotive interiors are positive Business conditions, however, are very challenging globallyLear’s near-term results are being negatively impacted, but our longer-term outlook remains positiveWe have a balanced approach to creating shareholder value
4
Strategic Overview / Industry Trends
5
The Lear Philosophy --Put Our Customers First in Everything We Do
Stay focused on what we can control – quality, customer service, cost and deliveryOperate leanly with an LBO mentalityWork together as a cohesive teamContinuously improve the fundamentals of our businessConduct our business with integrity and humilityNever quit until the customer is completely satisfied
6
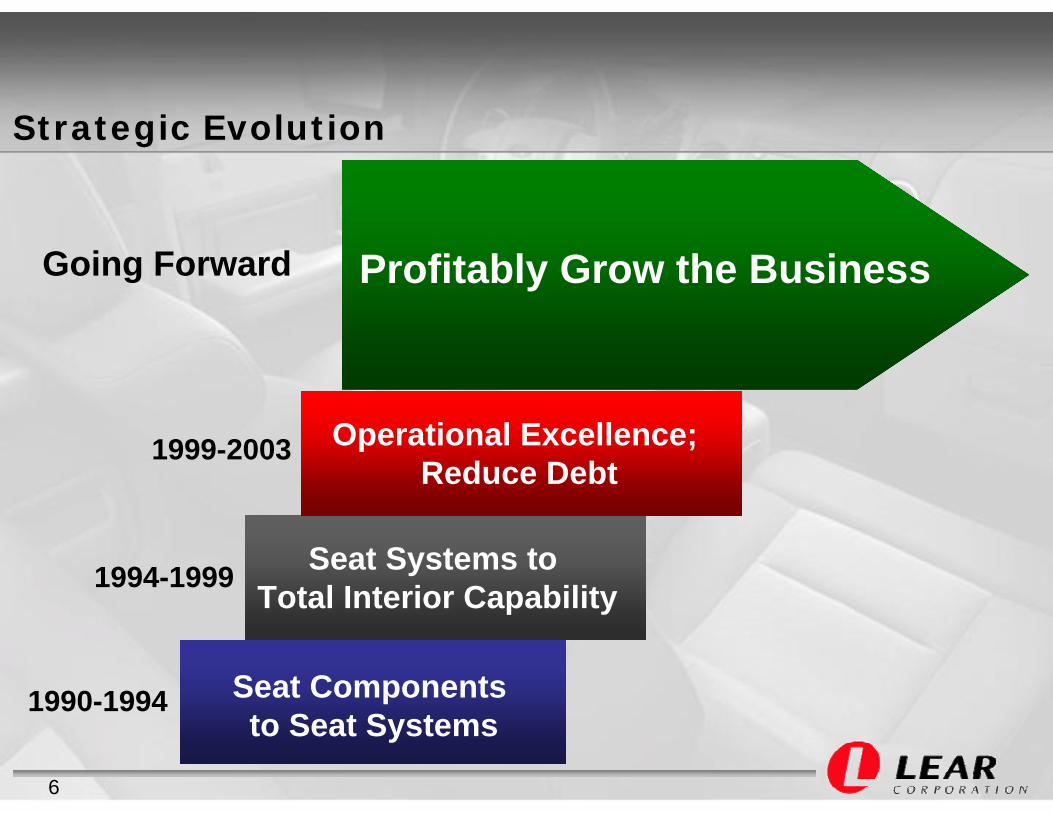
Strategic Evolution
Seat Components to Seat Systems
Seat Systems to Total Interior Capability
Operational Excellence; Reduce Debt
1990-1994
1994-1999
1999-2003
Going Forward Profitably Grow the Business
7
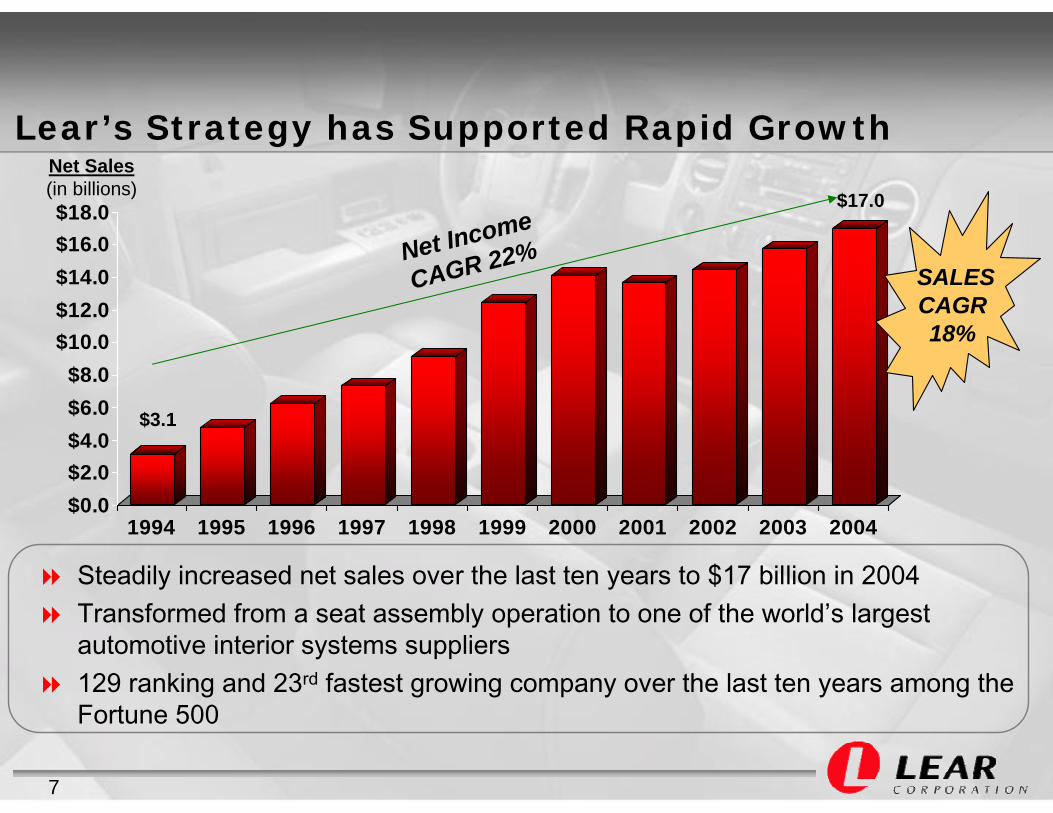
Steadily increased net sales over the last ten years to $17 billion in 2004Transformed from a seat assembly operation to one of the world’s largest automotive interior systems suppliers 129 ranking and 23rd fastest growing company over the last ten years among the Fortune 500
$0.0$2.0$4.0$6.0$8.0
$10.0$12.0$14.0$16.0$18.0
1994 1995 1996 1997 1998 1999 2000 2001 2002 2003 2004
Lear’s Strategy has Supported Rapid GrowthNet Sales(in billions)
Net Income
CAGR 22%SALESCAGR18%
$3.1
$17.0
8
Industry Trends
Consumers demanding more interior features
Automakers focused on world-class interiors and “Perceptual Quality”
Industry progressing toward total interior integration
Automotive interiors are the fastest growing segment of the auto industry
9
Business Conditions
Continued mixed economic signals
North American and European vehicle production down in first quarter; flat for full year
Raw material prices negatively impacting earnings
Fierce global competition for market share
Significant Adverse Earnings Impact In First Quarter;Improving Outlook For Balance Of 2005
10
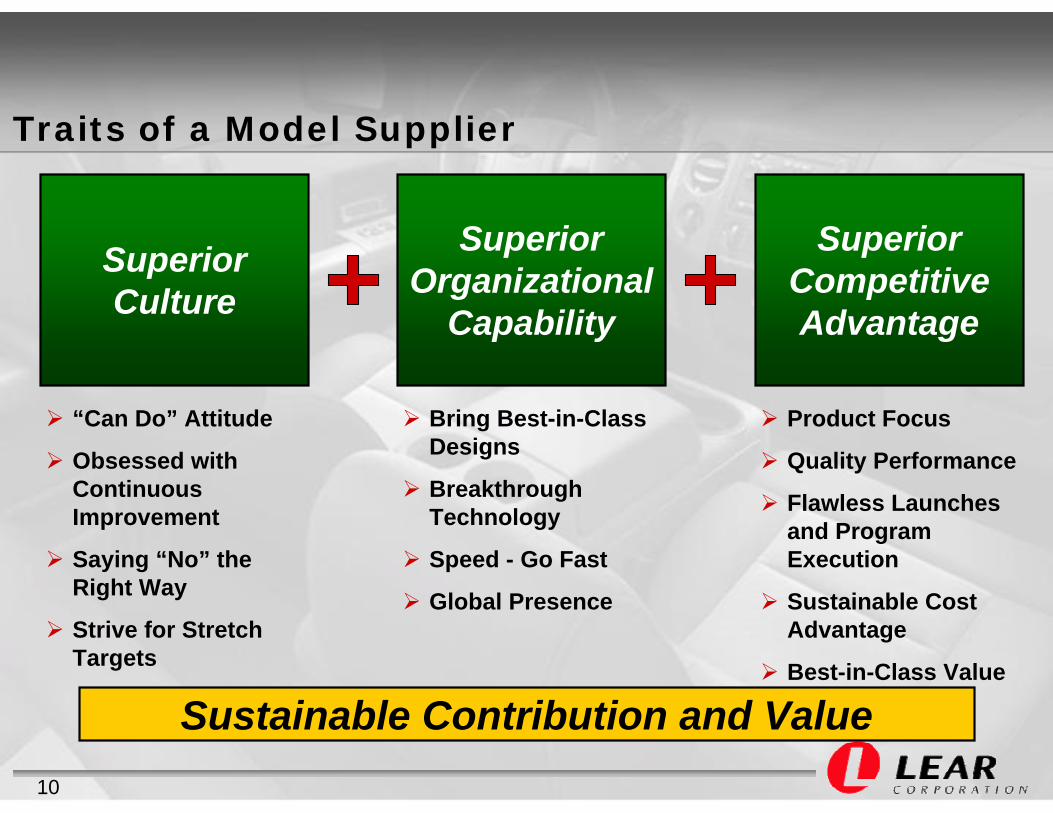
Traits of a Model Supplier
Superior Culture
Superior Organizational
Capability
Superior Competitive Advantage
“Can Do” Attitude
Obsessed with Continuous Improvement
Saying “No” the Right Way
Strive for Stretch Targets
Bring Best-in-Class Designs
Breakthrough Technology
Speed - Go Fast
Global Presence
Product Focus
Quality Performance
Flawless Launches and Program Execution
Sustainable Cost Advantage
Best-in-Class Value
Sustainable Contribution and Value
11
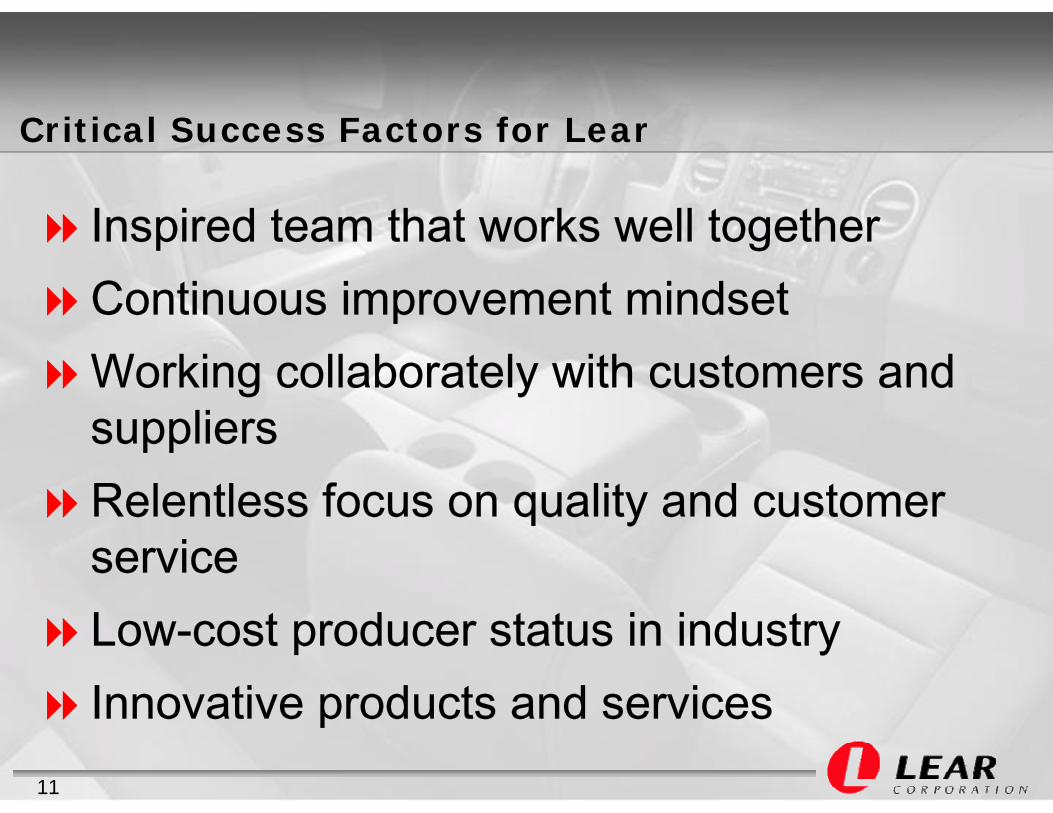
Critical Success Factors for Lear
Inspired team that works well togetherContinuous improvement mindsetWorking collaborately with customers and suppliersRelentless focus on quality and customer serviceLow-cost producer status in industryInnovative products and services
12
Our Approach to Creating
Shareholder Value
13
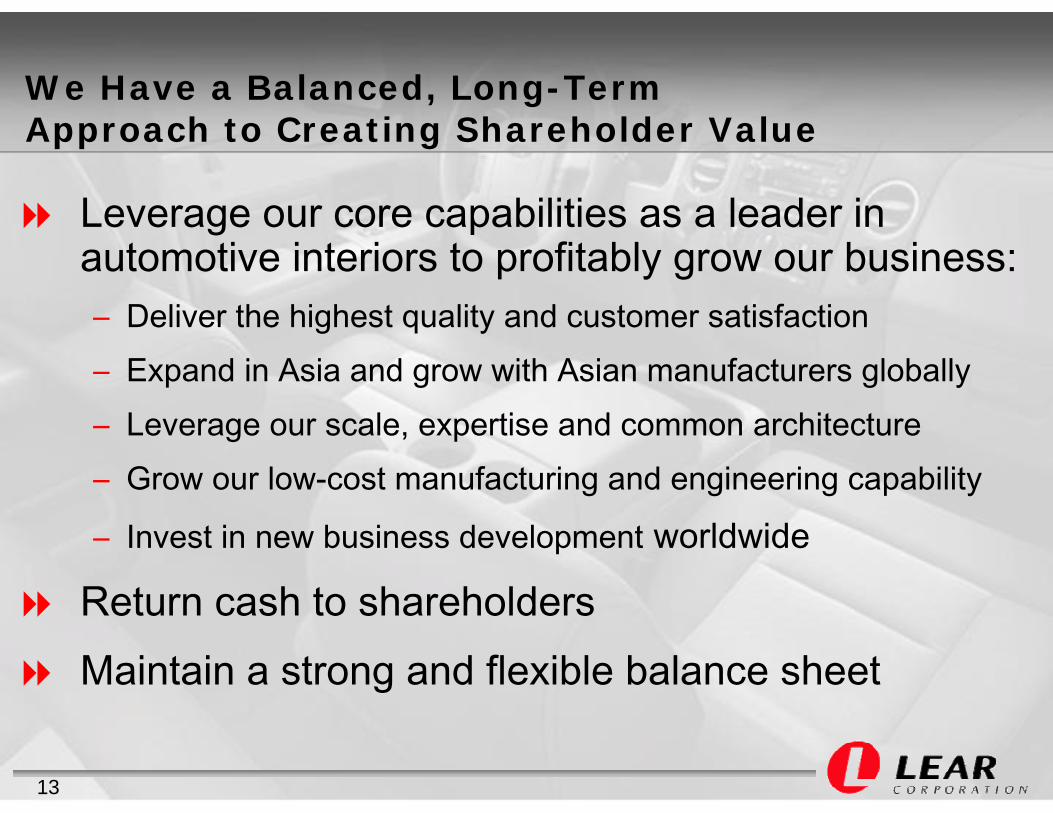
We Have a Balanced, Long-TermApproach to Creating Shareholder Value
Leverage our core capabilities as a leader in automotive interiors to profitably grow our business:– Deliver the highest quality and customer satisfaction– Expand in Asia and grow with Asian manufacturers globally– Leverage our scale, expertise and common architecture – Grow our low-cost manufacturing and engineering capability
– Invest in new business development worldwide
Return cash to shareholdersMaintain a strong and flexible balance sheet
14
Highest Quality and Customer Satisfaction
Internal quality, as measured by defects per million, improved over 50% last year, our 4th consecutive year of improvement
Lear continues to rank as the highest quality seat manufacturer serving multiple automakers in latest J.D. Power survey
Lear has received awards for quality & service excellence from all of our major customers worldwide
Lear is the most admired auto supplier in the Corporate Reputation Survey by Fortune magazine, with the industry's highest score for the quality of our products and services
15
2002 2003 2004 Future
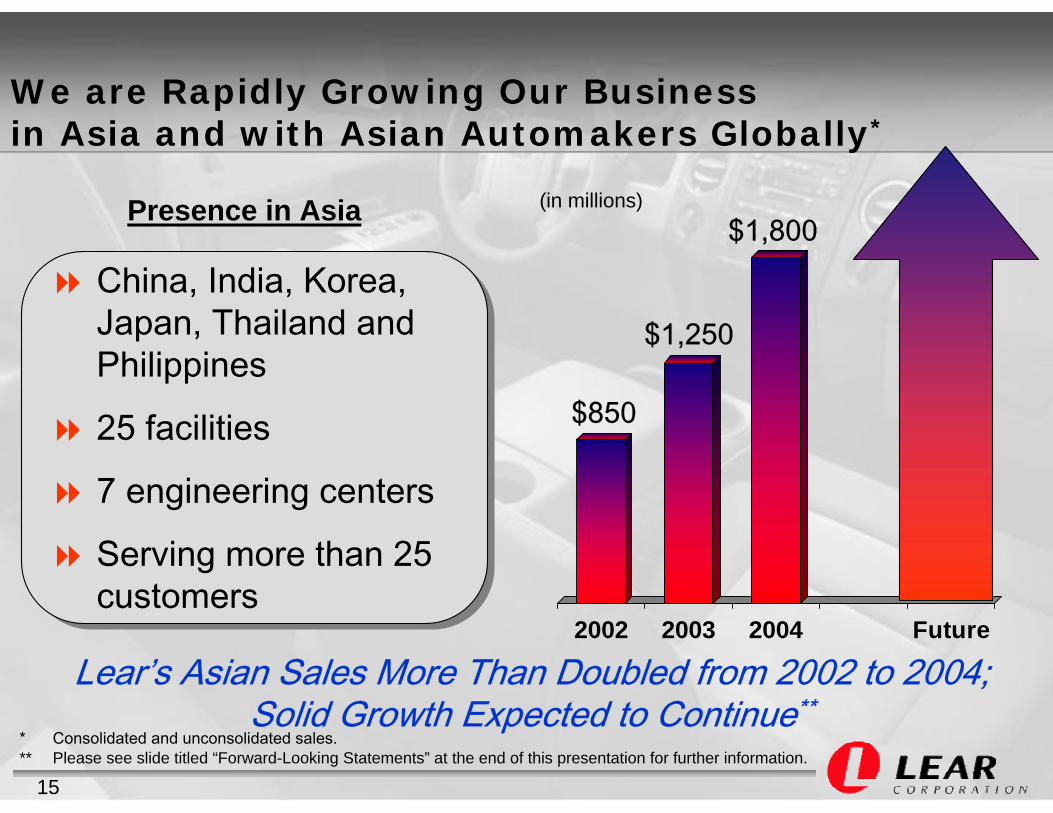
We are Rapidly Growing Our Businessin Asia and with Asian Automakers Globally*
$850
$1,250
$1,800
Lear’s Asian Sales More Than Doubled from 2002 to 2004;Solid Growth Expected to Continue**
(in millions)
* Consolidated and unconsolidated sales.** Please see slide titled “Forward-Looking Statements” at the end of this presentation for further information.
China, India, Korea, Japan, Thailand and Philippines
25 facilities
7 engineering centers
Serving more than 25 customers
China, India, Korea, Japan, Thailand and Philippines
25 facilities
7 engineering centers
Serving more than 25 customers
Presence in Asia
16
Leveraging Our Scale, Expertise and Common Architecture Strategy
World’s leading automotive interior supplier, with $17 billion in annual sales and 110,000 employees in 34 countries
Nearly 90 years of automotive history
9 Cost Technology Optimization (CTO) Centers in 6 locations globally
Common Seat Architecture on more than a dozen programs covering over 4 million vehicles worldwide
17
Ongoing Manufacturing Footprint and Efficiency Actions
Investing In Footprint Actions Globally To Support Growth Opportunities And Low-Cost Country Strategy
Efficiency Actions• Downsizing, closures and relocations impacted 15
facilities in 2004Growth Opportunities• New facilities opened to support business in China,
Korea, Czech Republic and SlovakiaLow-Cost Country• Presently, Lear has low-cost operations in 13 countries• Plans to expand operations in Mexico, Honduras,
Poland, Romania and Philippines• Approximately 20% of sales manufactured in low-cost
locations
18
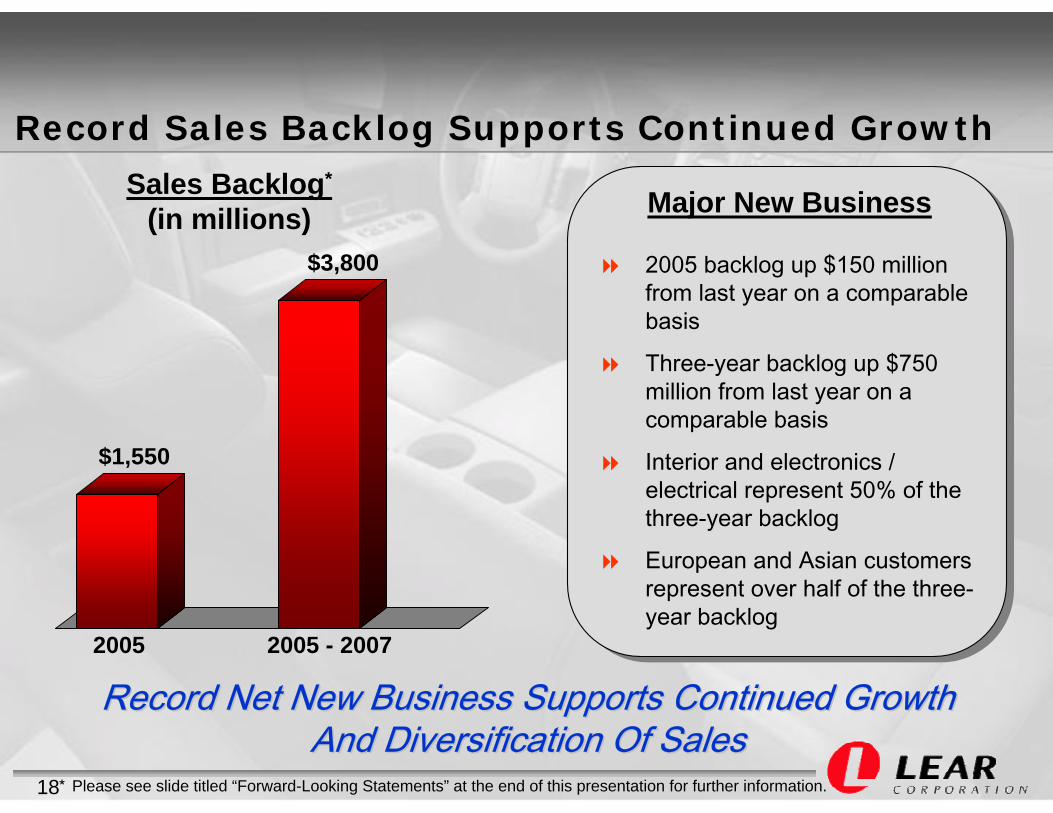
2005 backlog up $150 million from last year on a comparable basis
Three-year backlog up $750 million from last year on a comparable basis
Interior and electronics / electrical represent 50% of the three-year backlog
European and Asian customers represent over half of the three-year backlog
2005 backlog up $150 million from last year on a comparable basis
Three-year backlog up $750 million from last year on a comparable basis
Interior and electronics / electrical represent 50% of the three-year backlog
European and Asian customers represent over half of the three-year backlog
Sales Backlog*
(in millions) Major New Business
Record Sales Backlog Supports Continued Growth
Record Net New Business Supports Continued Growth Record Net New Business Supports Continued Growth And Diversification Of SalesAnd Diversification Of Sales
* Please see slide titled “Forward-Looking Statements” at the end of this presentation for further information.
$1,550
$3,800
2005 2005 - 2007
19
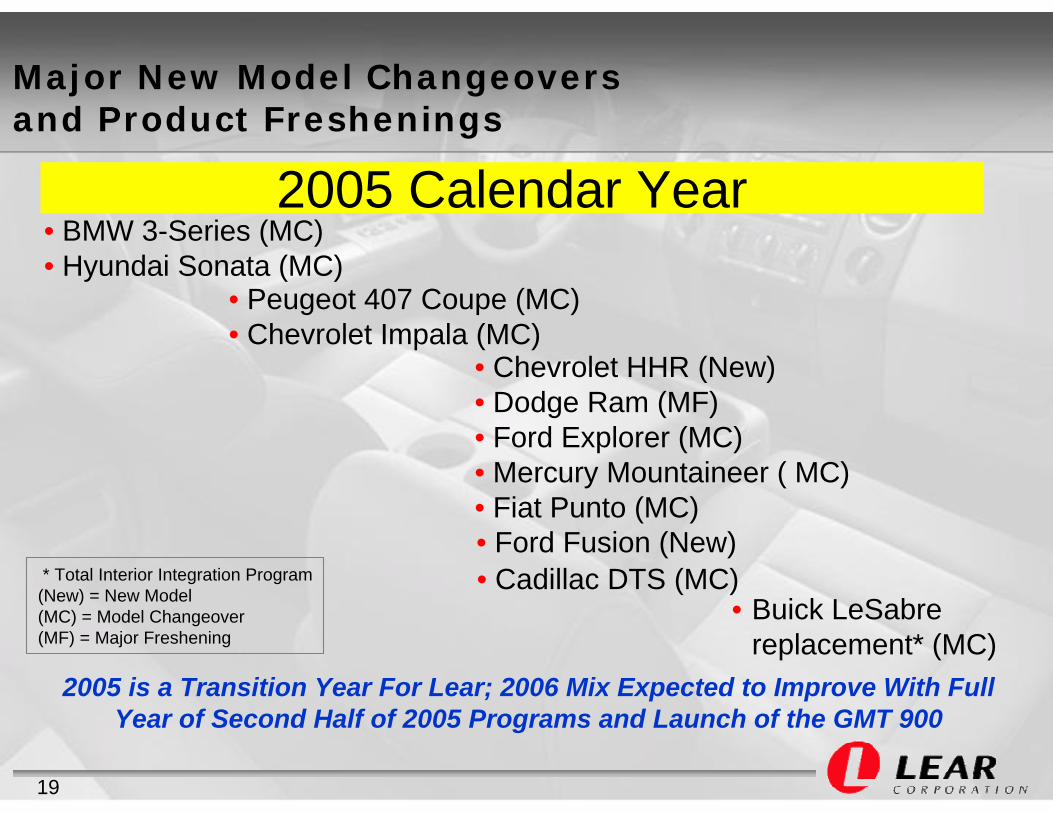
Major New Model Changeovers and Product Freshenings
2005 is a Transition Year For Lear; 2006 Mix Expected to Improve With Full Year of Second Half of 2005 Programs and Launch of the GMT 900
• BMW 3-Series (MC)• Hyundai Sonata (MC)
• Peugeot 407 Coupe (MC)• Chevrolet Impala (MC)
• Chevrolet HHR (New)• Dodge Ram (MF)• Ford Explorer (MC)• Mercury Mountaineer ( MC)• Fiat Punto (MC)
2005 Calendar Year
• Buick LeSabrereplacement* (MC)
• Ford Fusion (New)* Total Interior Integration Program(New) = New Model(MC) = Model Changeover(MF) = Major Freshening
• Cadillac DTS (MC)
20
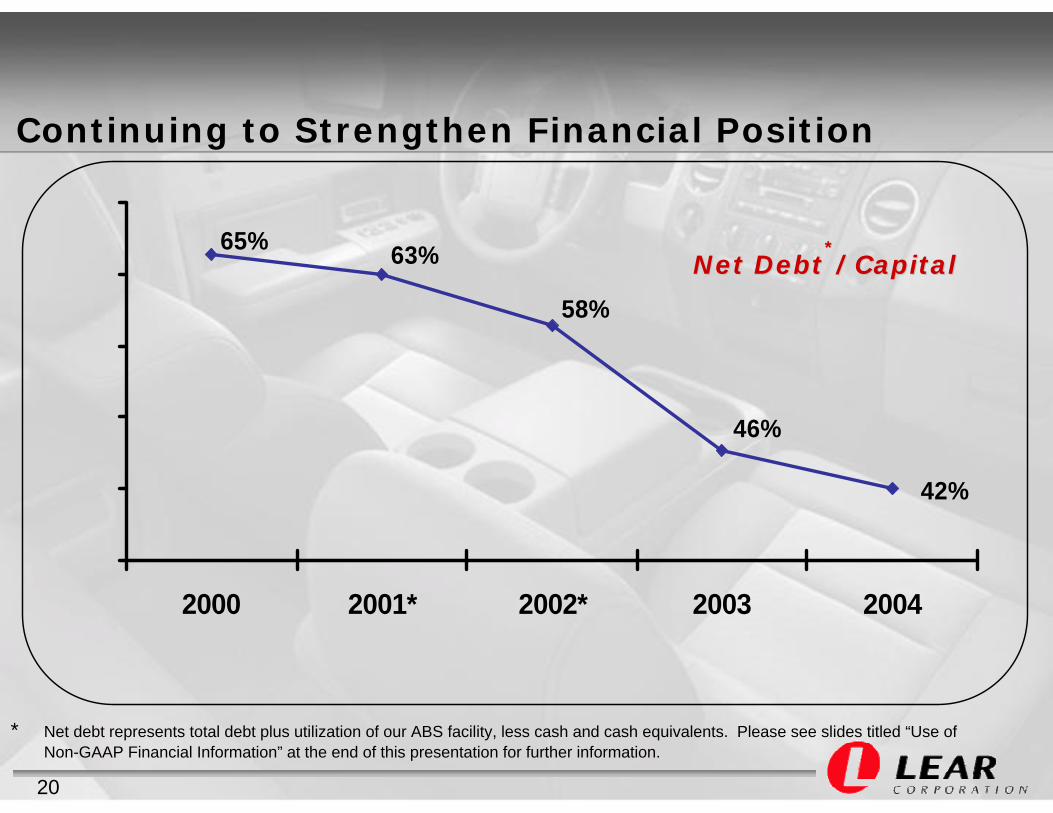
42%
65% 63%
58%
46%
2000 2001* 2002* 2003 2004
* Net debt represents total debt plus utilization of our ABS facility, less cash and cash equivalents. Please see slides titled “Use of Non-GAAP Financial Information” at the end of this presentation for further information.
Net DebtNet Debt**/Capital/Capital
Continuing to Strengthen Financial Position
21
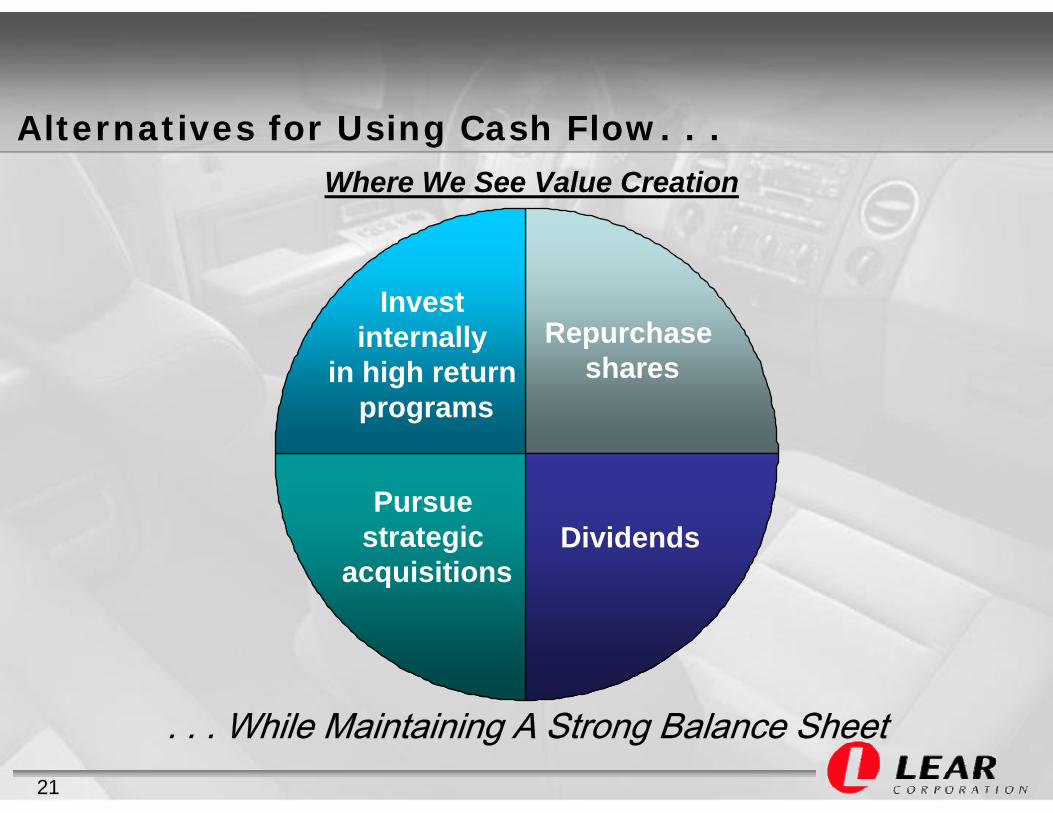
Alternatives for Using Cash Flow. . .
. . . While Maintaining A Strong Balance Sheet
Invest internally
in high return programs
Pursue strategic
acquisitionsDividends
Repurchase shares
Where We See Value Creation
22
Q & A Session
23
The Company has provided information regarding “net debt,” a non-GAAP financial measure. Net debt represents total debt plus utilization under the Company’s ABS facility, less cash and cash equivalents. Management believes that net debt provides useful information regarding the Company’s financial condition. Further, management uses net debt for planning and forecasting in future periods.
Net debt should not be considered in isolation or as a substitute for total debt or other balance sheet data prepared in accordance with GAAP. Also, this non-GAAP financial measure, as determined and presented by the Company, may not be comparable to related or similarly titled measures reported by other companies.
Set forth on the following slide is a reconciliation of net debt to total debt.
Use of Non-GAAP Financial Information
24
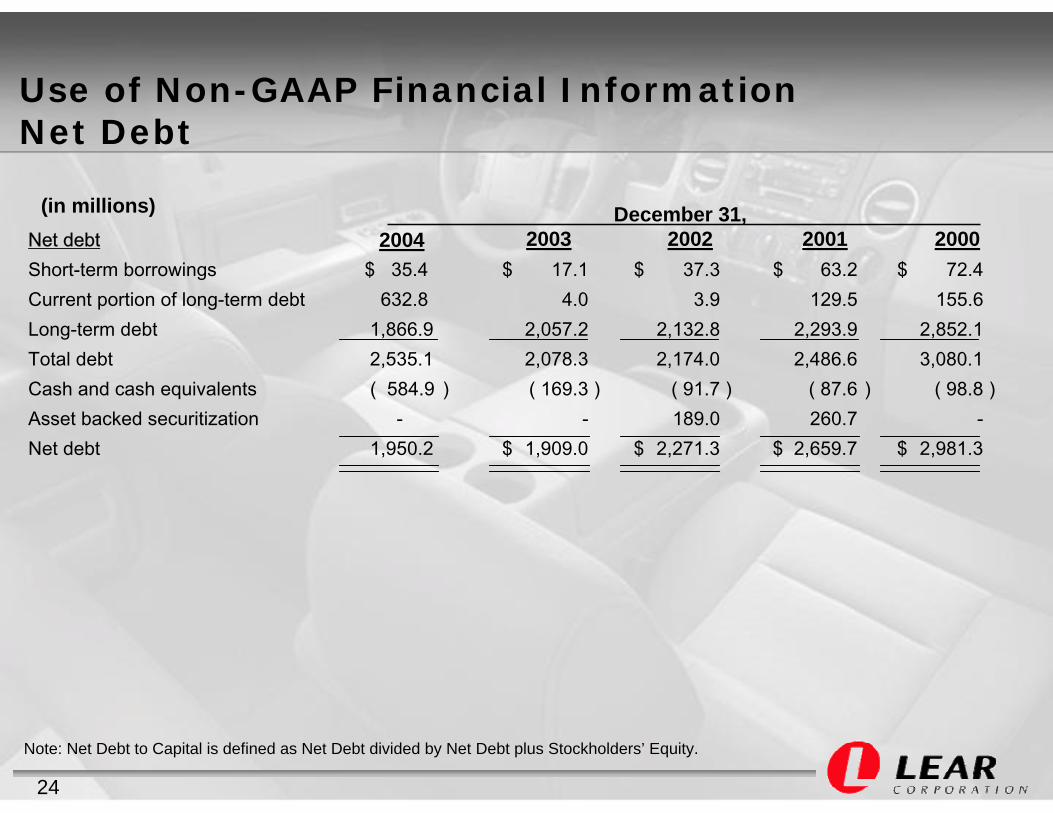
(in millions)Net debtShort-term borrowings $ 35.4 $ 17.1 $ 37.3 $ 63.2 $ 72.4Current portion of long-term debt 632.8 4.0 3.9 129.5 155.6Long-term debt 1,866.9 2,057.2 2,132.8 2,293.9 2,852.1Total debt 2,535.1 2,078.3 2,174.0 2,486.6 3,080.1Cash and cash equivalents ( 584.9 ) ( 169.3 ) ( 91.7 ) ( 87.6 ) ( 98.8 )Asset backed securitization - - 189.0 260.7 -Net debt 1,950.2 $ 1,909.0 $ 2,271.3 $ 2,659.7 $ 2,981.3
2003 2002 2001 2000
Use of Non-GAAP Financial InformationNet Debt
December 31,
Note: Net Debt to Capital is defined as Net Debt divided by Net Debt plus Stockholders’ Equity.
2004
25
This presentation contains forward-looking statements within the meaning of the Private Securities Litigation Reform Act of 1995, including statements regarding anticipated financial results. Actual results may differ materially from anticipated results as a result of certain risks and uncertainties, including but not limited to, general economic conditions in the markets in which the Company operates, fluctuations in the production of vehicles for which the Company is a supplier, labor disputes involving the Company or its significant customers or suppliers or that otherwise affect the Company, the Company’s ability to achieve cost reductions that offset or exceed customer-mandated selling price reductions, the outcome of customer productivity negotiations, the impact and timing of program launch costs, the costs and timing of facility closures or similar actions, increases in the Company’s warranty or product liability costs, risks associated with conducting business in foreign countries, competitive conditions impacting the Company’s key customers, raw material cost and availability, the Company’s ability to mitigate the significant impact of recent increases in raw material prices, the outcome of legal or regulatory proceedings to which the Company is or may become a party, unanticipated changes in free cash flow and other risks described from time to time in the Company’s Securities and Exchange Commission filings.
This presentation also contains information on the Company’s sales backlog. The Company’s incremental sales backlog reflects: anticipated net sales from awarded new programs, less phased-out and cancelled programs. The calculation of backlog does not reflect customer price reductions on existing or newly-awarded programs. The backlog may be impacted by various assumptions embedded in the calculation, including vehicle production levels on new and replacement programs, foreign exchange rates and the timing of program launches.
The forward-looking statements in this presentation are made as of the date hereof, and the Company does not assume any obligation to update them.
Forward-Looking Statements