Embed Size (px)
Citation preview
1
Macroeconomic Indicators of Bangladesh
Presented by:
Md. Shah NaoajAssistant Director
Banking Regulation and Policy DepartmentBangladesh Bank
Head Office
2
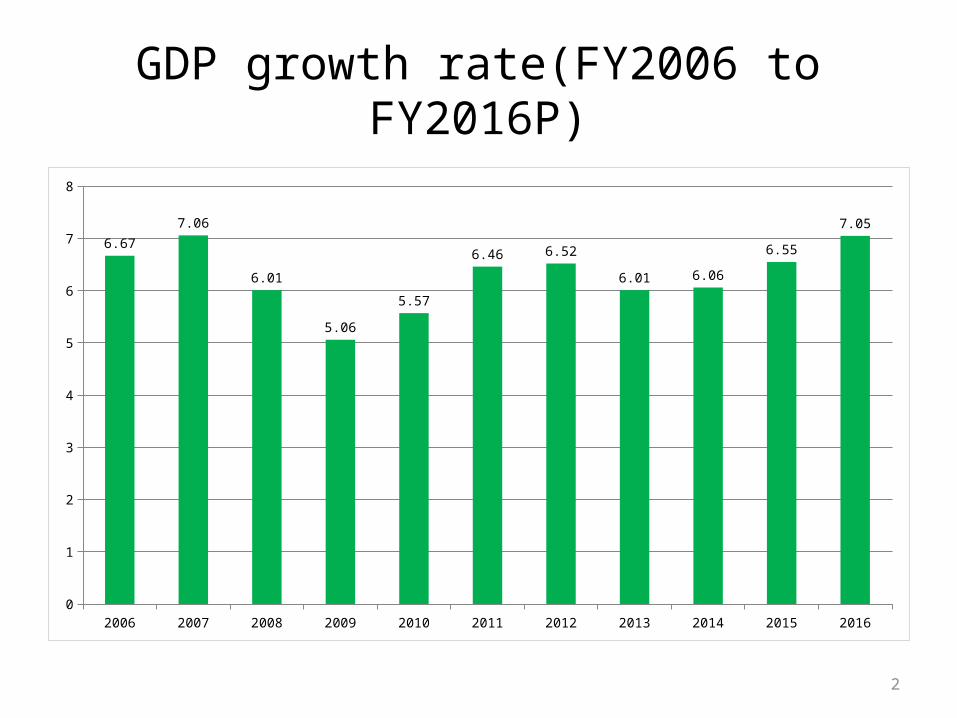
GDP growth rate(FY2006 to FY2016P)
2006 2007 2008 2009 2010 2011 2012 2013 2014 2015 20160
1
2
3
4
5
6
7
8
6.67
7.06
6.01
5.06
5.57
6.46 6.52
6.01 6.06
6.55
7.05
3
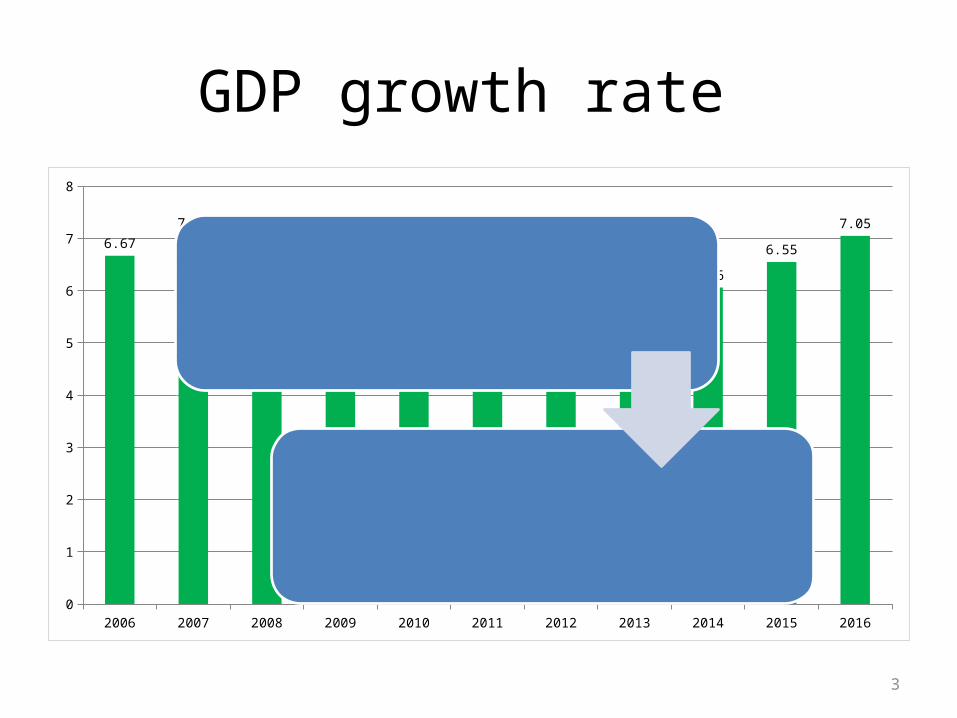
GDP growth rate
2006 2007 2008 2009 2010 2011 2012 2013 2014 2015 20160
1
2
3
4
5
6
7
8
6.67
7.06
6.01
5.06
5.57
6.46 6.52
6.01 6.06
6.55
7.05Despite slower growth in the promising external market, Bangladesh economy achieved reasonably a satisfactory growth during the FY15.
4
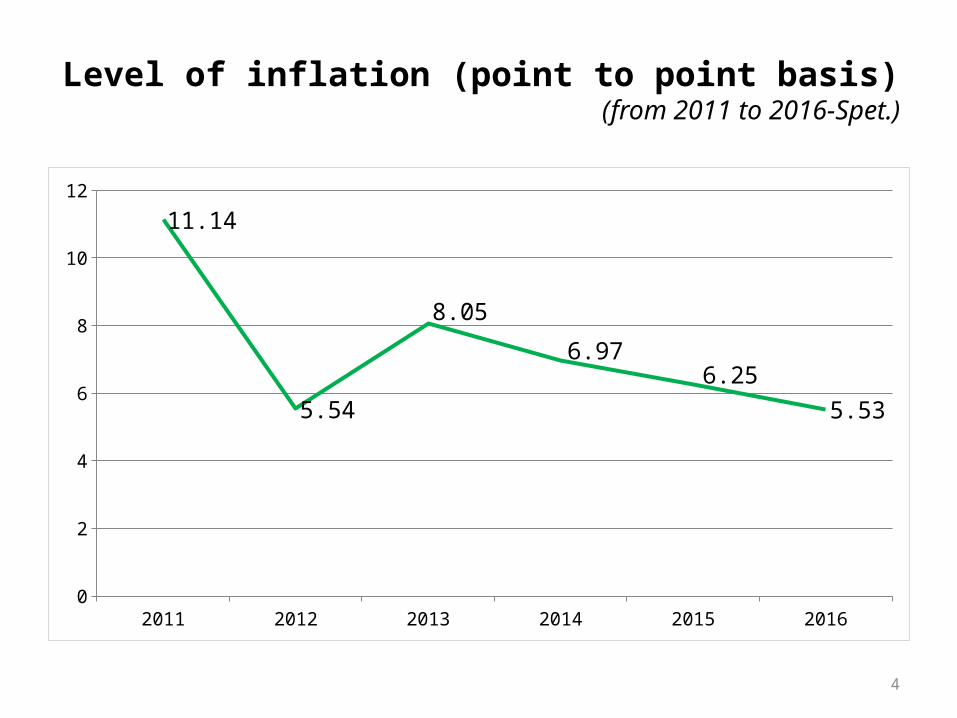
Level of inflation (point to point basis)(from 2011 to 2016-Spet.)
2011 2012 2013 2014 2015 20160
2
4
6
8
10
12
11.14
5.54
8.05
6.976.25
5.53
5
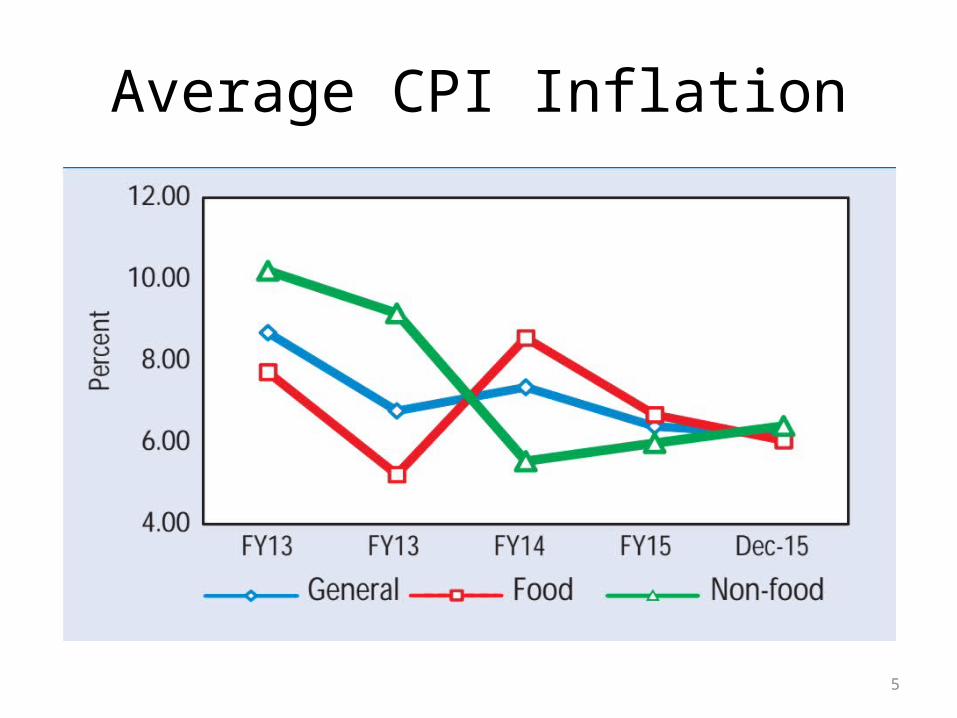
Average CPI Inflation
6
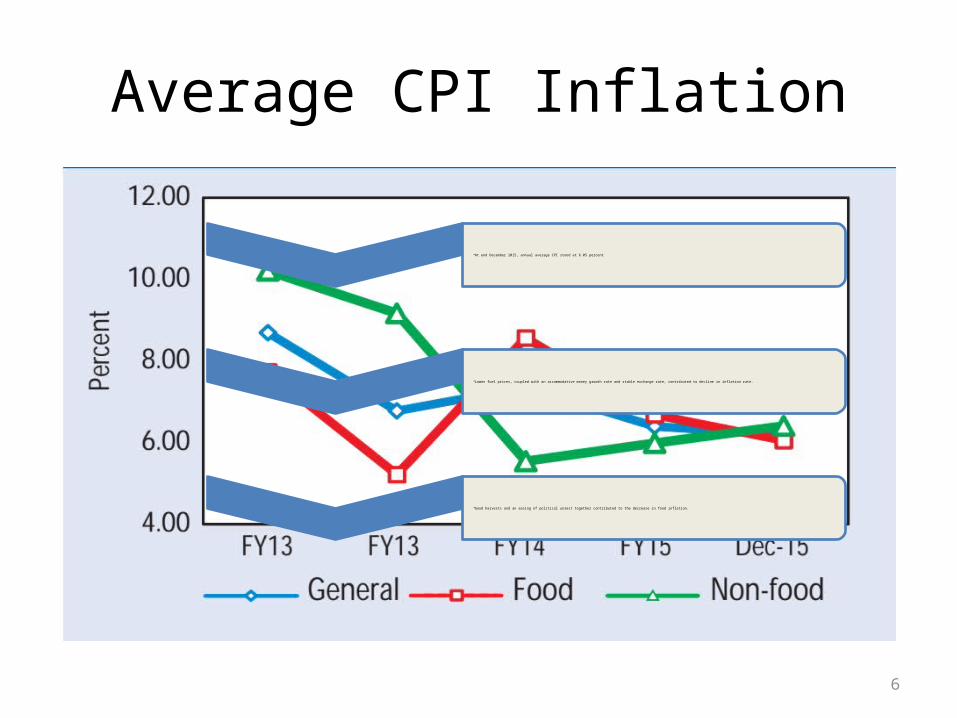
Average CPI Inflation
•At end December 2015, annual average CPI stood at 6.05 percent
•Lower fuel prices, coupled with an accommodative money growth rate and stable exchange rate, contributed to decline in inflation rate.
•Good harvests and an easing of political unrest together contributed to the decrease in food inflation.
7
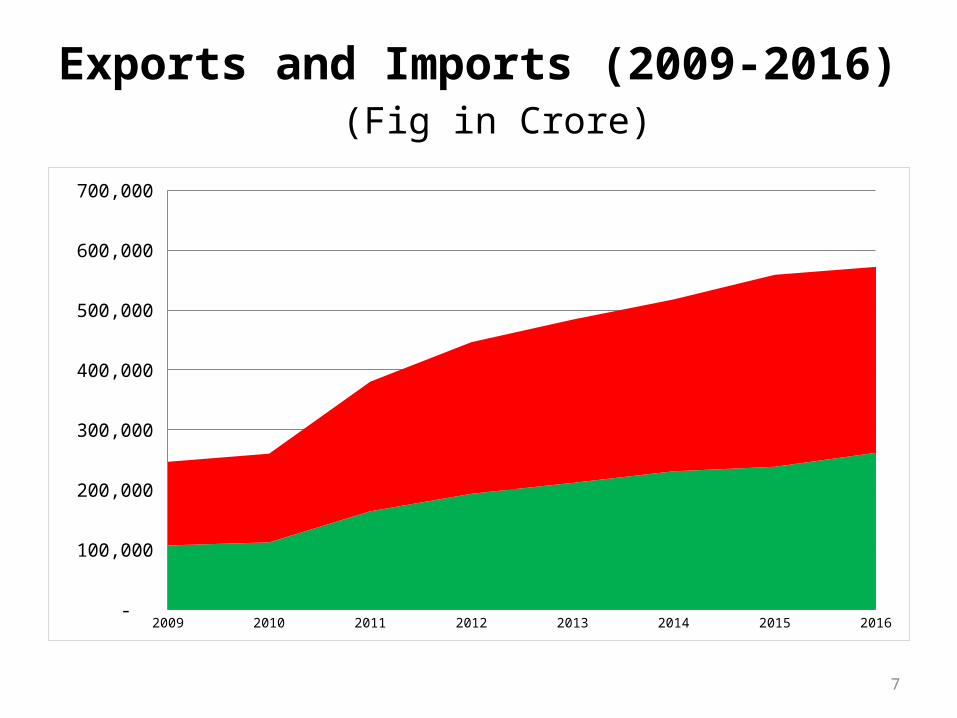
Exports and Imports (2009-2016)(Fig in Crore)
2009 2010 2011 2012 2013 2014 2015 2016 -
100,000
200,000
300,000
400,000
500,000
600,000
700,000
8
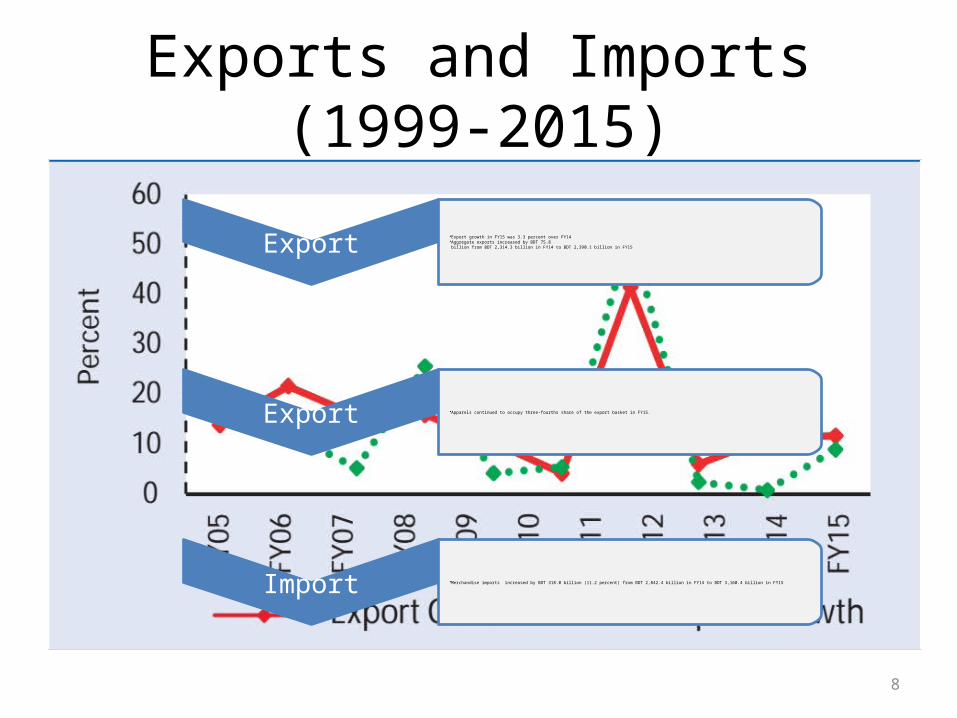
Exports and Imports (1999-2015)19
99
2000
2001
2002
2003
2004
2005
2006
2007
2008
2009
2010
2011
2012
2013
2014
2015
2016
0
50000
100000
150000
200000
250000
300000
350000
ExportImport
Export•Export growth in FY15 was 3.3 percent over FY14•Aggregate exports increased by BDT 75.8billion from BDT 2,314.3 billion in FY14 to BDT 2,390.1 billion in FY15
Export •Apparels continued to occupy three-fourths share of the export basket in FY15.
Import •Merchandise imports increased by BDT 318.0 billion (11.2 percent) from BDT 2,842.4 billion in FY14 to BDT 3,160.4 billion in FY15
9
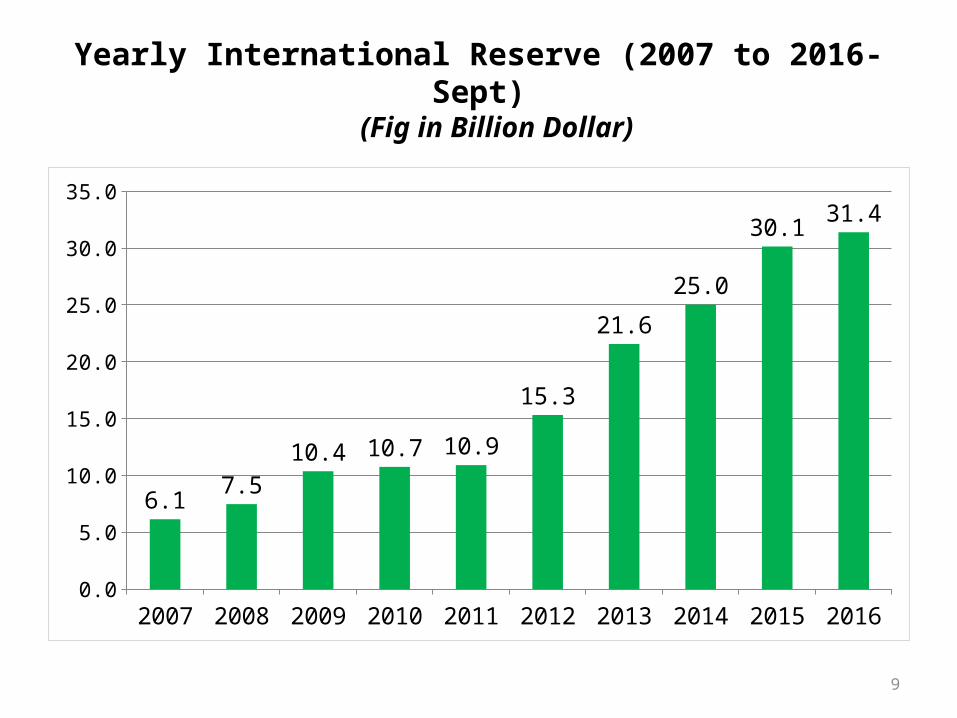
Yearly International Reserve (2007 to 2016-Sept) (Fig in Billion Dollar)
2007 2008 2009 2010 2011 2012 2013 2014 2015 20160.0
5.0
10.0
15.0
20.0
25.0
30.0
35.0
6.17.5
10.4 10.7 10.9
15.3
21.6
25.0
30.131.4
10
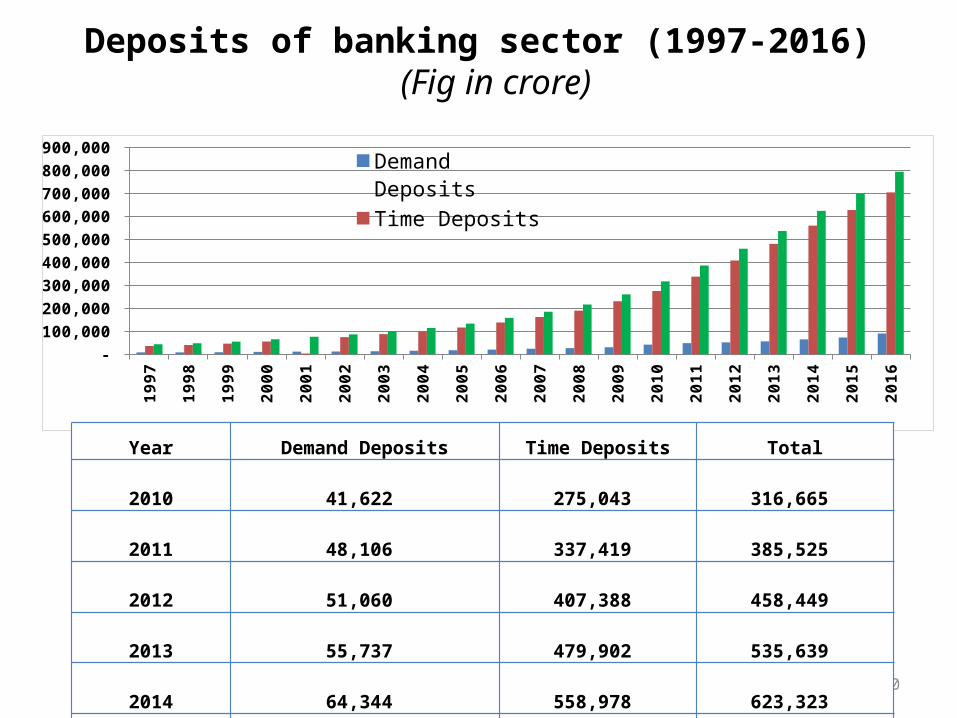
Deposits of banking sector (1997-2016)(Fig in crore)
1997
1998
1999
2000
2001
2002
2003
2004
2005
2006
2007
2008
2009
2010
2011
2012
2013
2014
2015
2016
- 100,000 200,000 300,000 400,000 500,000 600,000 700,000 800,000 900,000
Demand DepositsTime DepositsTotal
Year Demand Deposits Time Deposits Total 2010 41,622 275,043 316,665 2011 48,106 337,419 385,525 2012 51,060 407,388 458,449 2013 55,737 479,902 535,639 2014 64,344 558,978 623,323
2015 72,384 626,800 699,184
2016 89,759 703,947 793,706
11
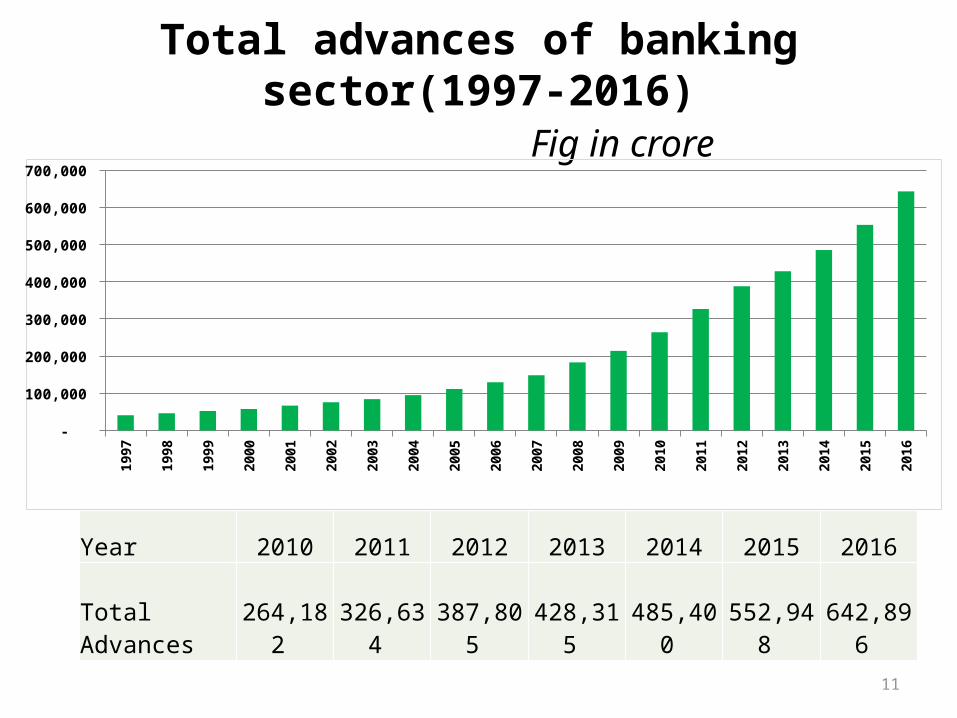
Total advances of banking sector(1997-2016)Fig in crore
Year 2010 2011 2012 2013 2014 2015 2016
Total Advances
264,182
326,634
387,805
428,315
485,400
552,948
642,896
1997
1998
1999
2000
2001
2002
2003
2004
2005
2006
2007
2008
2009
2010
2011
2012
2013
2014
2015
2016
-
100,000
200,000
300,000
400,000
500,000
600,000
700,000
12
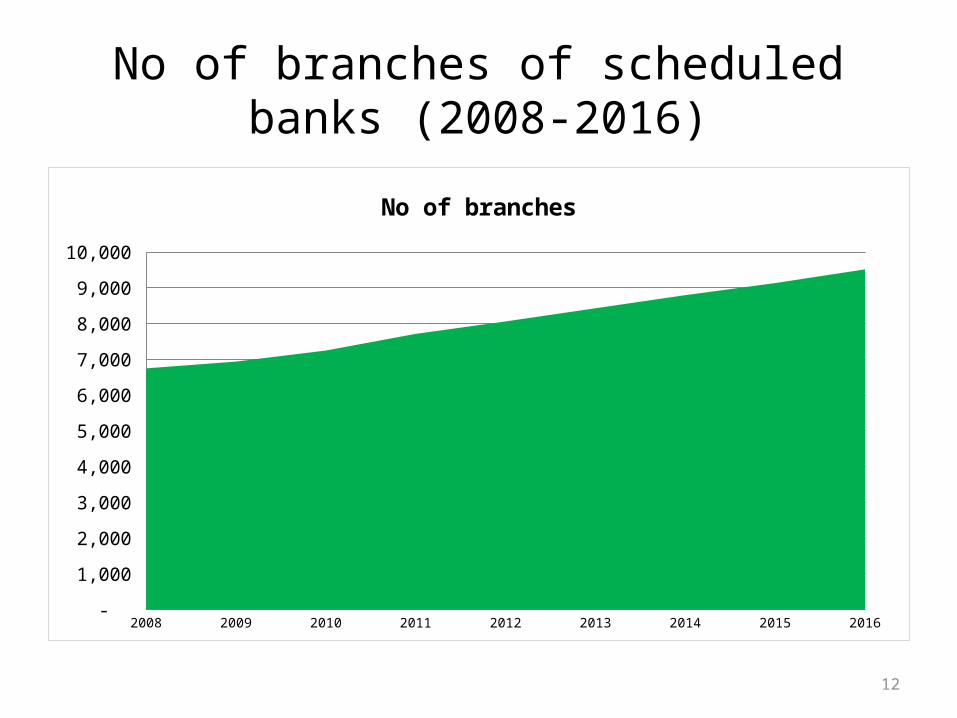
No of branches of scheduled banks (2008-2016)
2008 2009 2010 2011 2012 2013 2014 2015 2016 -
1,000
2,000
3,000
4,000
5,000
6,000
7,000
8,000
9,000
10,000
No of branches
13
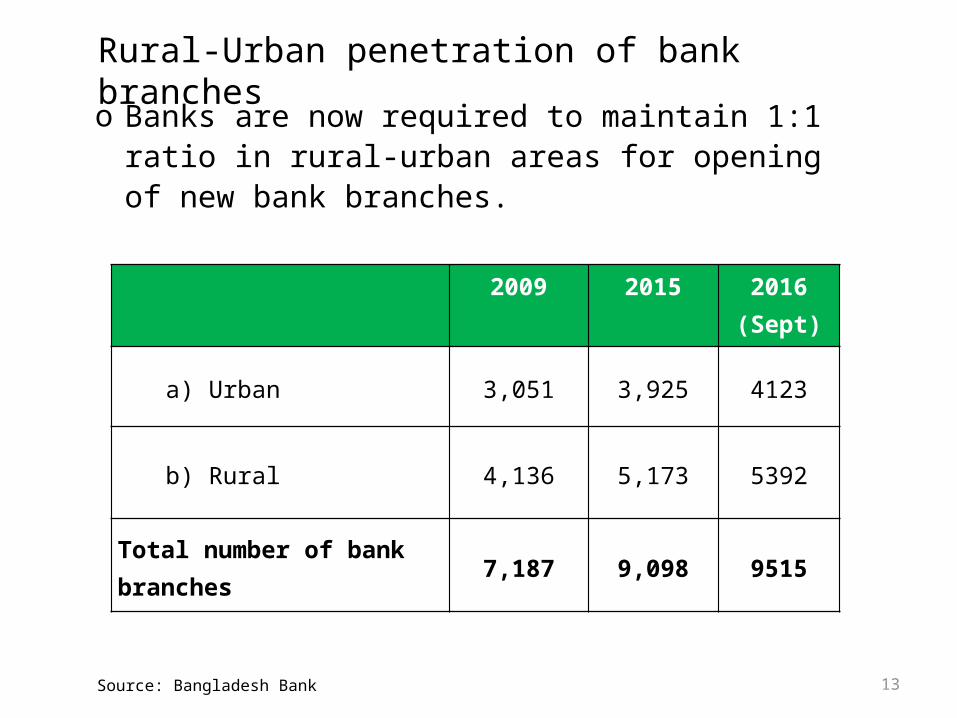
2009 2015 2016 (Sept)
a) Urban 3,051 3,925 4123
b) Rural 4,136 5,173 5392
Total number of bank branches 7,187 9,098 9515
o Banks are now required to maintain 1:1 ratio in rural-urban areas for opening of new bank branches.
Rural-Urban penetration of bank branches
Source: Bangladesh Bank
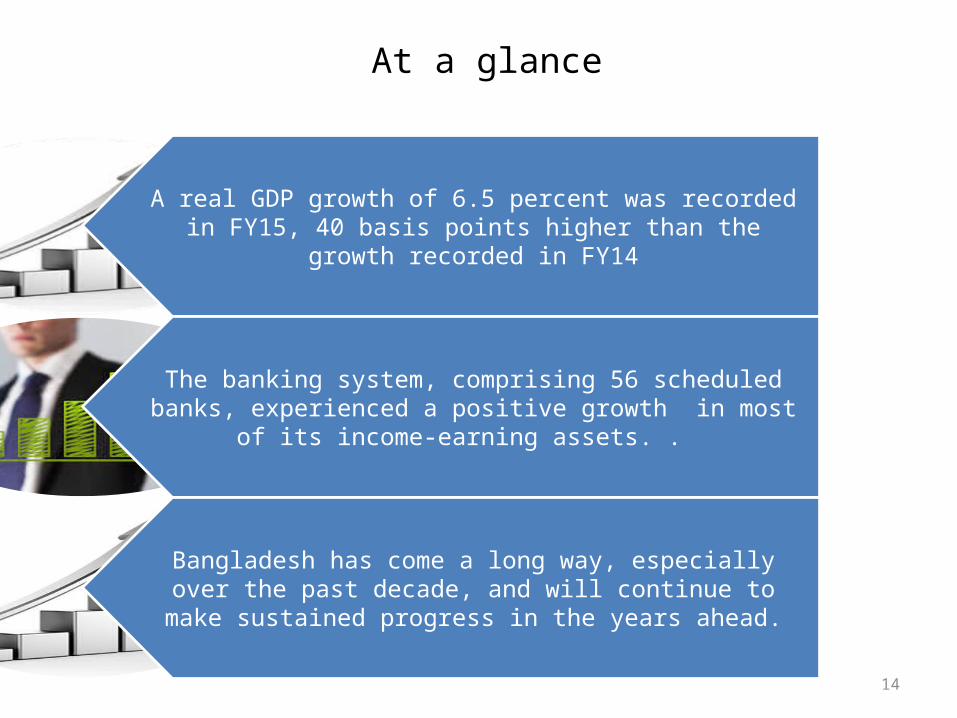
At a glance
A real GDP growth of 6.5 percent was recorded in FY15, 40 basis points higher than the growth recorded in FY14
The banking system, comprising 56 scheduled banks, experienced a positive growth in most of its income-earning
assets. .
Bangladesh has come a long way, especially over the past decade, and will continue to make sustained progress in the years ahead.
14