Embed Size (px)
Citation preview

Bank Watch
August 2015
www.mercercapital.com
Strategic Planning for
Community Banks on the Mend 1
Public Market Indicators 4
M&A Market Indicators 5
Regional Public
Bank Peer Reports 6
About Mercer Capital 7
Erickson Partners
Merges with Mercer Capital 8
© 2015 Mercer Capital // Data provided by SNL Financial 1
Bank Watch
August 2015
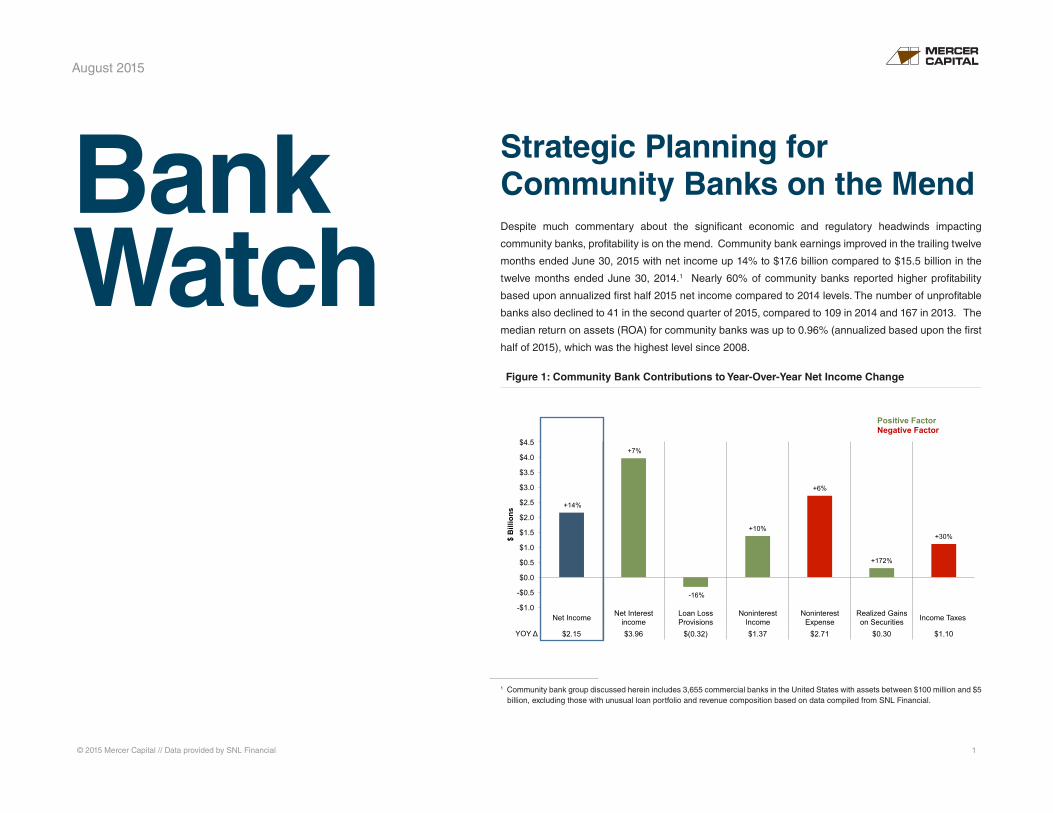
Strategic Planning for Community Banks on the MendDespite much commentary about the significant economic and regulatory headwinds impacting
community banks, profitability is on the mend. Community bank earnings improved in the trailing twelve
months ended June 30, 2015 with net income up 14% to $17.6 billion compared to $15.5 billion in the
twelve months ended June 30, 2014.1 Nearly 60% of community banks reported higher profitability
based upon annualized first half 2015 net income compared to 2014 levels. The number of unprofitable
banks also declined to 41 in the second quarter of 2015, compared to 109 in 2014 and 167 in 2013. The
median return on assets (ROA) for community banks was up to 0.96% (annualized based upon the first
half of 2015), which was the highest level since 2008.
+14%
+7%
-16%
+10%
+6%
+172%
+30%
-$1.0
-$0.5
$0.0
$0.5
$1.0
$1.5
$2.0
$2.5
$3.0
$3.5
$4.0
$4.5
Net Income Net Interest income
Loan Loss Provisions
Noninterest Income
Noninterest Expense
Realized Gains on Securities Income Taxes
YOY Δ $2.15 $3.96 $(0.32) $1.37 $2.71 $0.30 $1.10
$ B
illio
ns
Positive Factor Negative Factor
Figure 1: Community Bank Contributions to Year-Over-Year Net Income Change
1 Community bank group discussed herein includes 3,655 commercial banks in the United States with assets between $100 million and $5 billion, excluding those with unusual loan portfolio and revenue composition based on data compiled from SNL Financial.

© 2015 Mercer Capital // Data provided by SNL Financial 2
Mercer Capital’s Bank Watch August 2015
As detailed in Figure 1, key contributors to improving earnings were higher net interest income
and lower loan loss provisions. Loan growth drove the improvement in net interest income as
84% of community banks reported loan growth in the trailing twelve month period, with the
median community bank’s loan growth rate reported at 7.2%. Loan growth offset net interest
margin (“NIM”) compression as NIMs were at their lowest level over the 10-year historical period.
As the Federal Reserve’s zero-interest rate policy (“ZIRP”) grinds on, asset yields continue to
compress while funding costs have essentially reached a floor. One interesting item to gauge
in future quarters is how much interest rate and credit risk is being taken by community banks
to grow loans and earnings.
Another sign of improving community bank health is that deal activity is up from recent prior
periods as shown in Figure 2. Price/earnings multiples have also improved in recent periods
(Figure 3) and appear to be relatively in line with long-term trends at approximately 20x. Price/
tangible book multiples are still below longer-term trends, largely reflecting that although
improved from the Great Recession returns on assets and equity remain below pre-financial
crisis levels.
While it is difficult to tell whether community bank earnings have peaked and how long
this cycle may last, improving profitability expands the strategic options available to
community banks. A recent article by SNL Financial noted that a number of community
banks are looking to sell as earnings may have plateaued. While selling is one option
available to community banks in this environment, the range of strategic options available
is much broader than that. A well-rounded strategic planning session should include an
assessment of the bank’s unique strengths, weaknesses, and opportunities as well as
a review of the bank’s performance and outlook relative to both its history and peers.
Then, a broader discussion of a range of options that can deliver growth and enhance
shareholder value should be discussed. Those other options could include organic and/or
acquisitive growth and other ways to provide liquidity and enhance returns to shareholders
142
189 189
158
61
22
41 34
84
105 132 135
$0
$3,000
$6,000
$9,000
$12,000
$15,000
0
50
100
150
200
250
2004 2005 2006 2007 2008 2009 2010 2011 2012 2013 2014 LTM 7/15
Valu
e of
Ann
ounc
ed T
rans
actio
ns
Num
ber o
f Ann
ounc
ed T
rans
actio
ns
Number of Transactions Value of Transactions
134%
0%
30%
60%
90%
120%
150%
180%
210%
240%
270%
0x
4x
8x
12x
16x
20x
24x
28x
32x
36x
2004 2005 2006 2007 2008 2009 2010 2011 2012 2013 2014 LTM 7/15
Pric
e / T
angi
ble
Boo
k Va
lue
Pric
e / E
arni
ngs
(Rep
orte
d LT
M)
Price / Earnings Price / Tangible Book Ratio
Figure 2: Community Bank Deal Activity Overview: Transactions
Banks with Assets < $5 Billion and LTM ROE > 5%
Figure 3: Community Bank Deal Activity Overview: P/E & P/TBV Multiples
Banks with Assets < $5 Billion and LTM ROE > 5%

© 2015 Mercer Capital // Data provided by SNL Financial 3
Mercer Capital’s Bank Watch August 2015
such as special dividends, share repurchases, management buy-outs, and employee
stock ownership plans.
Founded in 1982, in the midst of and in response to a previous crisis affecting the financial
services industry, Mercer Capital has witnessed the industry’s cycles. Despite industry cycles,
Mercer Capital’s approach has remained the same – understanding key factors driving the
industry, identifying the impact of industry trends on our clients, and delivering a reasoned and
supported analysis in light of industry and client specific trends.
Mercer Capital has experience facilitating strategic planning sessions for community banks and
providing a broad range of specialized advisory services to the sector. Contact us to discuss
scheduling a strategic planning session or your institution’s specific needs in confidence.
Jay D. Wilson, Jr., CFA, ASA, CBA
901.685.2120
What We’re Reading
Jack Milligan of Bank Director examines “What Makes a Great Bank CEO” and notes the importance
of understanding how technology impacts customers.
http://mer.cr/1Tw9K3j
Jeff Gerrish of Gerrish McCreary Smith has an interesting article entitled “Ignore Defeatist Talk,
Community Bankers.”
http://mer.cr/1Mq7YMU
Brian Graham of Alliance Partners discusses “How Community Banks Can Grow Loans by
Partnering with Competitors.”
http://mer.cr/1IKQ43i
Nathan Stovall of SNL Financial had an interesting piece entitled “Small Banks Taking M&A
Plunge as Earnings Plateau.” (Subscription required.)
http://mer.cr/1Wmevv2

© 2015 Mercer Capital // Data provided by SNL Financial 4
80 !
90 !
100 !
110 !
120 !
130 !
140 !
150 !
8/31/2
012!
9/30/2
012!
10/31
/2012!
11/30
/2012!
12/31
/2012!
1/31/2
013!
2/28/2
013!
3/31/2
013!
4/30/2
013!
5/31/2
013!
6/30/2
013!
7/31/2
013!
Augu
st 3
1, 2
012
= 10
0!
MCM Index - Community Banks! SNL Bank! S&P 500!
Median Valuation Multiples
Mercer Capital’s Bank Group Index Overview Return Stratification of U.S. Banks
by Asset Size
Assets $250 - $500
MM
Assets $500 MM -
$1 BN
Assets $1 - $5 BN
Assets $5 - $10 BN
Assets > $10 BN
Month-to-Date -1.02% -0.92% -5.00% -4.54% -5.67% Year-to-Date 24.98% 22.75% 21.26% 26.38% 21.49% Last 12 Months 32.00% 23.72% 26.18% 27.55% 36.68%
-10%
0%
10%
20%
30%
40%
As o
f Aug
ust 3
0, 2
013
Median Total Return Median Valuation Multiples as of July 31, 2015
Indices Month-to-Date Year-to-Date Last 12 MonthsPrice/
LTM EPSPrice / 2015 (E)
EPSPrice / 2016 (E)
EPSPrice /
Book ValuePrice / Tangible
Book ValueDividend
Yield
Atlantic Coast Index 1.18% 6.15% 18.89% 15.66 15.46 13.19 104.4% 109.8% 2.2%
Midwest Index -0.82% 5.57% 17.81% 14.76 14.62 12.32 118.4% 128.6% 2.3%
Northeast Index -0.45% 1.54% 10.63% 14.50 14.49 13.17 116.3% 128.6% 3.0%
Southeast Index -1.50% 4.64% 19.84% 12.59 14.75 13.14 105.7% 116.6% 1.9%
West Index 2.16% 6.26% 15.51% 15.72 15.99 13.69 117.6% 124.9% 2.6%
Community Bank Index 0.00% 4.45% 15.90% 14.85 14.94 13.08 113.1% 123.8% 2.5%
SNL Bank Index 2.11% 6.83% 17.09%
Assets $250 - $500M
Assets $500M -
$1B
Assets $1 - $5B
Assets $5 - $10B
Assets > $10B
Month-to-Date -0.38% 3.41% 0.16% 0.36% 2.25% Year-to-Date 9.39% 5.91% 5.99% 11.26% 6.69% Last 12 Months 14.15% 11.15% 17.75% 23.09% 16.86%
-10%
0%
10%
20%
30%
As
of J
uly
31, 2
015
80 !
85 !
90 !
95 !
100 !
105 !
110 !
115 !
120 !
125 !
July
31,
201
4 =
100!
MCM Index - Community Banks! SNL Bank! S&P 500!
Mercer Capital’s Public Market Indicators August 2015

© 2015 Mercer Capital // Data provided by SNL Financial 5
2004 2005 2006 2007 2008 2009 2010 2011 2012 2013 2014 LTM U.S. 18.3% 19.9% 19.9% 18.7% 12.0% 6.9% 6.3% 5.4% 4.3% 5.5% 7.5% 7.3%
0%
5%
10%
15%
20%
25%
Cor
e D
epos
it P
rem
ium
s
2004 2005 2006 2007 2008 2009 2010 2011 2012 2013 2014 LTM U.S. 246% 243% 243% 228% 196% 145% 141% 132% 130% 134% 155% 150%
0%
50%
100%
150%
200%
250%
300%
350%
Pric
e / T
angi
ble
Boo
k Va
lue
2004 2005 2006 2007 2008 2009 2010 2011 2012 2013 2014 LTM U.S. 22.3 22.0 22.0 22.1 19.9 19.3 21.7 21.9 17.0 16.5 17.5 19.6
0
5
10
15
20
25
30
Pric
e / L
ast 1
2 M
onth
s E
arni
ngs
Regions
Price / LTM
Earnings
Price / Tang.
BV
Price / Core Dep Premium
No. of
Deals
Median Deal
Value
Target’s Median Assets
Target’s Median
LTM ROAE (%)
Atlantic Coast 21.89 1.61 7.7% 14 71.16 479,979 7.38%
Midwest 17.69 1.55 7.3% 69 33.55 104,786 8.77%
Northeast 20.03 1.67 9.5% 5 126.00 492,002 6.69%
Southeast 17.85 1.40 6.1% 30 29.82 186,921 8.15%
West 20.13 1.48 7.4% 17 58.98 253,143 9.16%
Nat’l Community Banks 19.59 1.50 7.3% 135 41.92 179,459 8.29%
Source: Per SNL Financial
Median Valuation Multiples for M&A Deals
Target Banks’ Assets <$5B and LTM ROE >5%, 12 months ended July 2015
Median Core Deposit Multiples
Target Banks’ Assets <$5B and LTM ROE >5%
Median Price/Tangible Book Value Multiples
Target Banks’ Assets <$5B and LTM ROE >5%
Median Price/Earnings Multiples
Target Banks’ Assets <$5B and LTM ROE >5%
Mercer Capital’s M&A Market Indicators August 2015

Updated weekly, Mercer Capital’s Regional Public Bank Peer Reports offer a closer look at the market pricing and performance of publicly traded banks in the states of five U.S. regions. Click on the map to view the reports from the representative region.
© 2015 Mercer Capital // Data provided by SNL Financial 6
Atlantic Coast Midwest Northeast
Southeast West
Mercer Capital’s Regional Public Bank Peer Reports
Mercer Capital’s Bank Watch August 2015

Mercer Capital assists banks, thrifts, and credit unions with significant corporate valuation requirements, transactional advisory services, and other strategic decisions.
Mercer Capital pairs analytical rigor with industry knowledge to deliver unique insight into issues facing banks. These insights
underpin the valuation analyses that are at the heart of Mercer Capital’s services to depository institutions.
» Bank valuation
» Financial reporting for banks
» Goodwill impairment
» Litigation support
Mercer Capital is a thought-leader among valuation firms in the banking industry. In addition to scores of articles and books, The
ESOP Handbook for Banks, Acquiring a Failed Bank, The Bank Director’s Valuation Handbook, and Valuing Financial Institutions,
Mercer Capital professionals speak at industry and educational conferences.
For more information about Mercer Capital, visit www.mercercapital.com.
Mercer CapitalFinancial Institutions Services
Jeff K. Davis, [email protected]
Andrew K. Gibbs, CFA, CPA/ABV [email protected]
Jay D. Wilson, Jr., CFA, ASA, CBA [email protected]
MERCER CAPITAL
Memphis5100 Poplar Avenue, Suite 2600Memphis, Tennessee 38137901.685.2120
Dallas12201 Merit Drive, Suite 480Dallas, Texas 75251214.468.8400
Nashville102 Woodmont Blvd., Suite 231Nashville, Tennessee 37205615.345.0350
www.mercercapital.com
Contact Us
Copyright © 2015 Mercer Capital Management, Inc. All rights reserved. It is illegal under Federal law to reproduce this publication or any portion of its contents without the publisher’s permission. Media quotations with source attribution are encouraged.
Reporters requesting additional information or editorial comment should contact Barbara Walters Price at 901.685.2120. Mercer Capital’s Industry Focus is published quarterly and does not constitute legal or financial consulting advice. It is offered as an
information service to our clients and friends. Those interested in specific guidance for legal or accounting matters should seek competent professional advice. Inquiries to discuss specific valuation matters are welcomed. To add your name to our mailing list
to receive this complimentary publication, visit our web site at www.mercercapital.com.
» Loan portfolio valuation
» Tax compliance
» Transaction advisory
» Strategic planning

Erickson Partners Merges with Mercer Capital
Mercer Capital, a national business valuation and financial advisory firm specializing in Corporate Valuation, Litigation Support, Finan-cial Reporting Valuation, and Transaction Advisory Consulting, and Erickson Partners, Inc., a Texas-based Valuation and Litigation Support firm, announce their merger effective July 1, 2015.
Mercer Capital, with its strong presence throughout the Southeast and Midwest, and Erickson Partners, with its strong presence in Texas and Oklahoma, are a perfect fit.
Both firms maintain the highest standards of quality for financial analysis and client service and believe deeply in hiring and devel-oping the best professionals.
“The culture of both firms is so similar and that was important to us. The professionals of Erickson Partners are well-known in the valuation profession as some of the best and brightest. Their work product and reputation are stellar. This merger not only allows us to broaden our geographic reach but also our industry expertise,” said Matt Crow, President of Mercer Capital.
Erickson Partners enhances Mercer Capital’s broad base of indus-try concentrations with their exceptional history working with and knowledge of professional sports franchises and the energy sector.
“Over our 30 plus year history, Mercer Capital has developed sev-eral industry concentrations. By adding the knowledge, insight, and expertise of Don Erickson, Bryce Erickson, and the rest of the professionals of Erickson Partners, we now bring deep experience and insight to a broader range of industries than we could as sepa-rate firms,” said Chris Mercer, CEO of Mercer Capital.
“Combining with Mercer Capital, we will now be able to offer new or expanded services that complement our existing services, as well as additional industry expertise,” said Bryce Erickson, Managing
Director of Erickson Partners. “In addition to our sports franchise and energy industry concentrations, we will be able to offer deep industry concentrations in construction and building materials, agribusiness, manufacturing and financial institutions, which in-cludes depository institutions, insurance companies, fintech com-panies, asset management firms, and PE firms.”
“The combined firm will have over 40 valuation professionals po-sitioned in five markets throughout the southwest and southeast. Such a deep bench will provide us with a tremendous opportu-nity to better serve the expanding needs of our clients,” said Don
Erickson, President of Erickson Partners. “Joining with Mercer Capital gives us national resources that will benefit our clients in Texas and beyond.”
About Mercer Capital
Mercer Capital is a national business valuation and financial advi-sory firm offering corporate valuation, litigation support, financial reporting valuation, and transaction advisory consulting services to a national client base. Clients include private and public oper-ating companies, financial institutions, asset holding companies, high-net worth families, and private equity/hedge funds.
About Erickson Partners, Inc.
Erickson Partners is a professional valuation and advisory firm spe-cializing in business valuation, litigation support, financial investiga-tions and strategic corporate advisory services. Founded by Don & Bryce Erickson, Erickson Partners has served large and small clients by providing complex financial and economic analysis, lead-ing to reasonable valuation opinions that withstand scrutiny.
CONTACT US
Z. Christopher Mercer, ASA, CFA, ABAR
901.685.2120
Matthew R. Crow, CFA, ASA
901.685.2120
Donald Erickson, ASA
214.468.8400
Bryce Erickson, ASA, MRICS
214.468.8400
MERCER CAPITAL
Headquarters
5100 Poplar Avenue, Suite 2600
Memphis, TN 38137
901.685.2120
Dallas
12201 Merit Drive, Suite 480
Dallas, TX 75251
214.468.2120
Nashville
102 Woodmont Blvd., Suite 231
Nashville, TN 37205
615.345.0350
www.mercercapital.com
COMBINING CULTURES OF EXCELLENCE
BUSINESS VALUATION & FINANCIAL ADVISORY SERVICES