Embed Size (px)
Citation preview
Recent Trends in Agricultural Production Lending 1
Segment Focus 5
Agriculture Land Values 5
Farmland Cap Rates and Investment 7
Farm Income 9
Agribusiness Industry Commodity Prices 11
Publicly Traded Agriculture Companies 12
Indices Performance 13
Historical EV / EBITDA Multiples 13
About Mercer Capital 14
Q1: Agriculture Machinery, Equipment & Implements
Q2: Crops & Crop Services
Q3: Agriculture Real Estate
Q4: Agriculture Chemicals
SEGMENT FOCUS Agriculture Real Estate 2015
www.mercercapital.com
VALUE FOCUS
Agribusiness Industry
© 2015 Mercer Capital // www.mercercapital.com 1
Mercer Capital’s Value Focus: Agribusiness Industry Third Quarter 2015
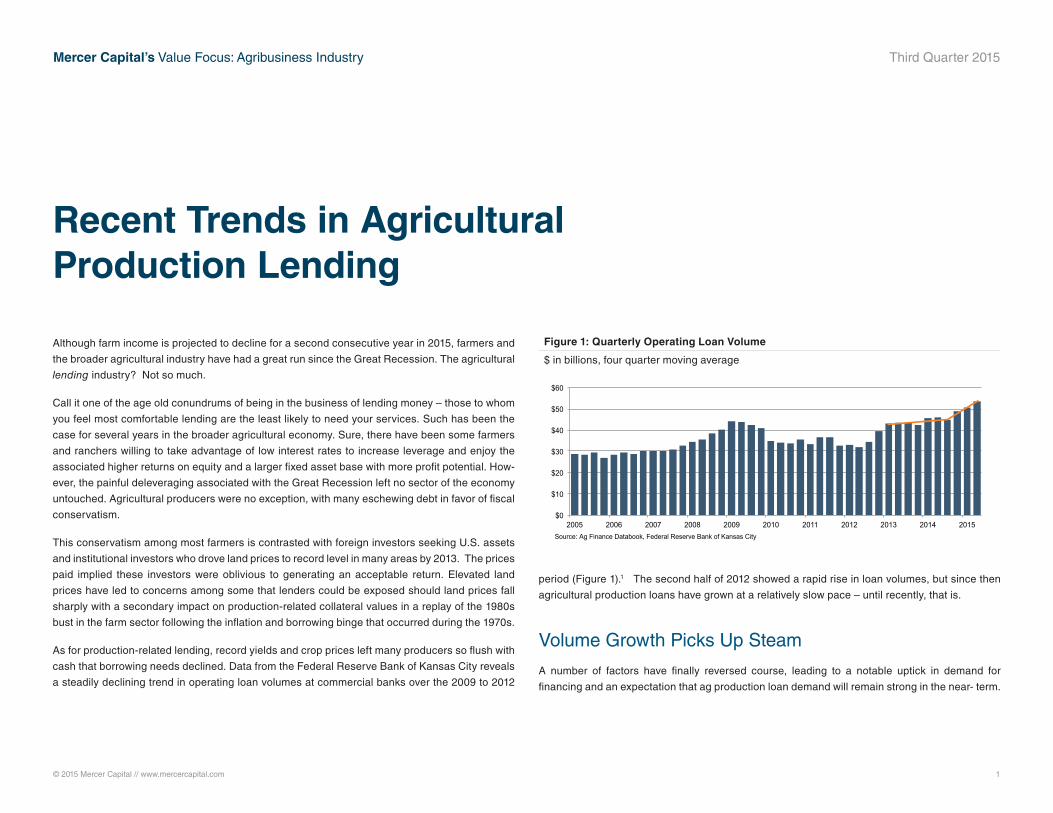
Although farm income is projected to decline for a second consecutive year in 2015, farmers and
the broader agricultural industry have had a great run since the Great Recession. The agricultural
lending industry? Not so much.
Call it one of the age old conundrums of being in the business of lending money – those to whom
you feel most comfortable lending are the least likely to need your services. Such has been the
case for several years in the broader agricultural economy. Sure, there have been some farmers
and ranchers willing to take advantage of low interest rates to increase leverage and enjoy the
associated higher returns on equity and a larger fixed asset base with more profit potential. How-
ever, the painful deleveraging associated with the Great Recession left no sector of the economy
untouched. Agricultural producers were no exception, with many eschewing debt in favor of fiscal
conservatism.
This conservatism among most farmers is contrasted with foreign investors seeking U.S. assets
and institutional investors who drove land prices to record level in many areas by 2013. The prices
paid implied these investors were oblivious to generating an acceptable return. Elevated land
prices have led to concerns among some that lenders could be exposed should land prices fall
sharply with a secondary impact on production-related collateral values in a replay of the 1980s
bust in the farm sector following the inflation and borrowing binge that occurred during the 1970s.
As for production-related lending, record yields and crop prices left many producers so flush with
cash that borrowing needs declined. Data from the Federal Reserve Bank of Kansas City reveals
a steadily declining trend in operating loan volumes at commercial banks over the 2009 to 2012
period (Figure 1).1 The second half of 2012 showed a rapid rise in loan volumes, but since then
agricultural production loans have grown at a relatively slow pace – until recently, that is.
Volume Growth Picks Up Steam
A number of factors have finally reversed course, leading to a notable uptick in demand for
financing and an expectation that ag production loan demand will remain strong in the near- term.
Recent Trends in Agricultural Production Lending
Figure 1: Quarterly Operating Loan Volume
$ in billions, four quarter moving average
$0
$10
$20
$30
$40
$50
$60
2005 2006 2007 2008 2009 2010 2011 2012 2013 2014 2015 Source: Ag Finance Databook, Federal Reserve Bank of Kansas City
© 2015 Mercer Capital // www.mercercapital.com 2
Mercer Capital’s Value Focus: Agribusiness Industry Third Quarter 2015
While real estate agriculture loans also have increased, lending dollar volume in that area has
been influenced by the substantial increase in farmland values in recent years. The discussion
which follows focuses on production, or operating, lending.
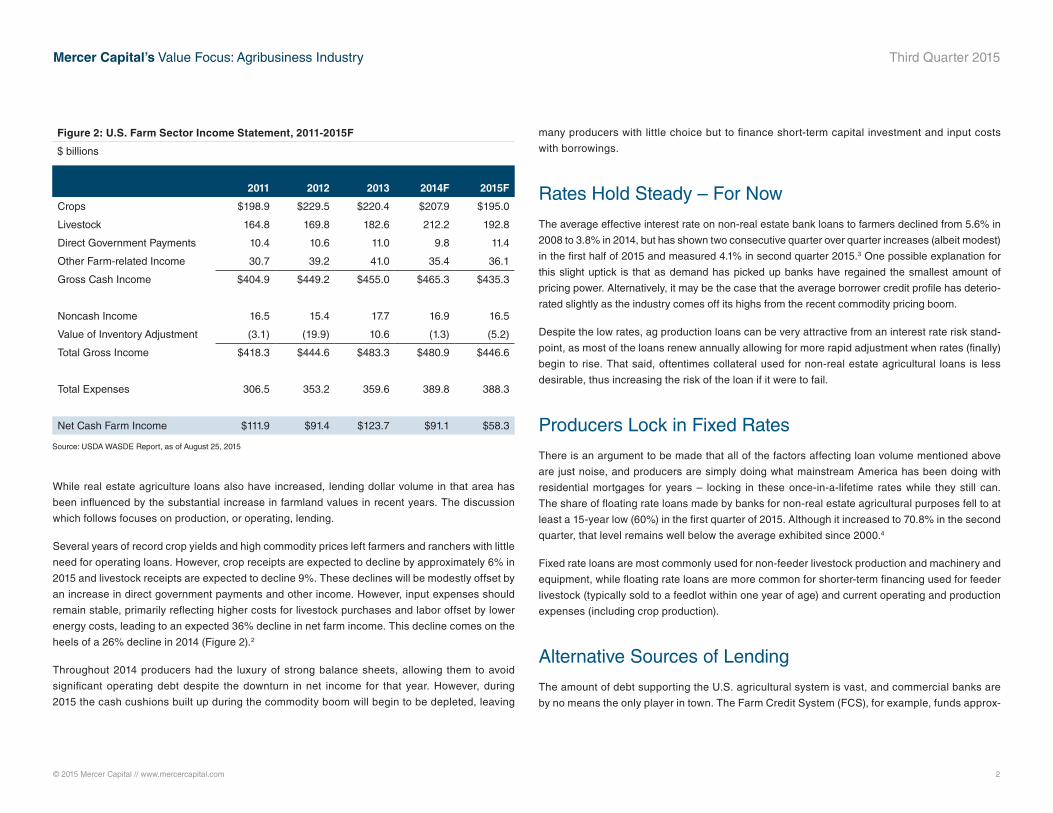
Several years of record crop yields and high commodity prices left farmers and ranchers with little
need for operating loans. However, crop receipts are expected to decline by approximately 6% in
2015 and livestock receipts are expected to decline 9%. These declines will be modestly offset by
an increase in direct government payments and other income. However, input expenses should
remain stable, primarily reflecting higher costs for livestock purchases and labor offset by lower
energy costs, leading to an expected 36% decline in net farm income. This decline comes on the
heels of a 26% decline in 2014 (Figure 2).2
Throughout 2014 producers had the luxury of strong balance sheets, allowing them to avoid
significant operating debt despite the downturn in net income for that year. However, during
2015 the cash cushions built up during the commodity boom will begin to be depleted, leaving
many producers with little choice but to finance short-term capital investment and input costs
with borrowings.
Rates Hold Steady – For Now
The average effective interest rate on non-real estate bank loans to farmers declined from 5.6% in
2008 to 3.8% in 2014, but has shown two consecutive quarter over quarter increases (albeit modest)
in the first half of 2015 and measured 4.1% in second quarter 2015.3 One possible explanation for
this slight uptick is that as demand has picked up banks have regained the smallest amount of
pricing power. Alternatively, it may be the case that the average borrower credit profile has deterio-
rated slightly as the industry comes off its highs from the recent commodity pricing boom.
Despite the low rates, ag production loans can be very attractive from an interest rate risk stand-
point, as most of the loans renew annually allowing for more rapid adjustment when rates (finally)
begin to rise. That said, oftentimes collateral used for non-real estate agricultural loans is less
desirable, thus increasing the risk of the loan if it were to fail.
Producers Lock in Fixed Rates
There is an argument to be made that all of the factors affecting loan volume mentioned above
are just noise, and producers are simply doing what mainstream America has been doing with
residential mortgages for years – locking in these once-in-a-lifetime rates while they still can.
The share of floating rate loans made by banks for non-real estate agricultural purposes fell to at
least a 15-year low (60%) in the first quarter of 2015. Although it increased to 70.8% in the second
quarter, that level remains well below the average exhibited since 2000.4
Fixed rate loans are most commonly used for non-feeder livestock production and machinery and
equipment, while floating rate loans are more common for shorter-term financing used for feeder
livestock (typically sold to a feedlot within one year of age) and current operating and production
expenses (including crop production).
Alternative Sources of Lending
The amount of debt supporting the U.S. agricultural system is vast, and commercial banks are
by no means the only player in town. The Farm Credit System (FCS), for example, funds approx-
Figure 2: U.S. Farm Sector Income Statement, 2011-2015F
$ billions
2011 2012 2013 2014F 2015F
Crops $198.9 $229.5 $220.4 $207.9 $195.0
Livestock 164.8 169.8 182.6 212.2 192.8
Direct Government Payments 10.4 10.6 11.0 9.8 11.4
Other Farm-related Income 30.7 39.2 41.0 35.4 36.1
Gross Cash Income $404.9 $449.2 $455.0 $465.3 $435.3
Noncash Income 16.5 15.4 17.7 16.9 16.5
Value of Inventory Adjustment (3.1) (19.9) 10.6 (1.3) (5.2)
Total Gross Income $418.3 $444.6 $483.3 $480.9 $446.6
Total Expenses 306.5 353.2 359.6 389.8 388.3
Net Cash Farm Income $111.9 $91.4 $123.7 $91.1 $58.3
Source: USDA WASDE Report, as of August 25, 2015
© 2015 Mercer Capital // www.mercercapital.com 3
Mercer Capital’s Value Focus: Agribusiness Industry Third Quarter 2015
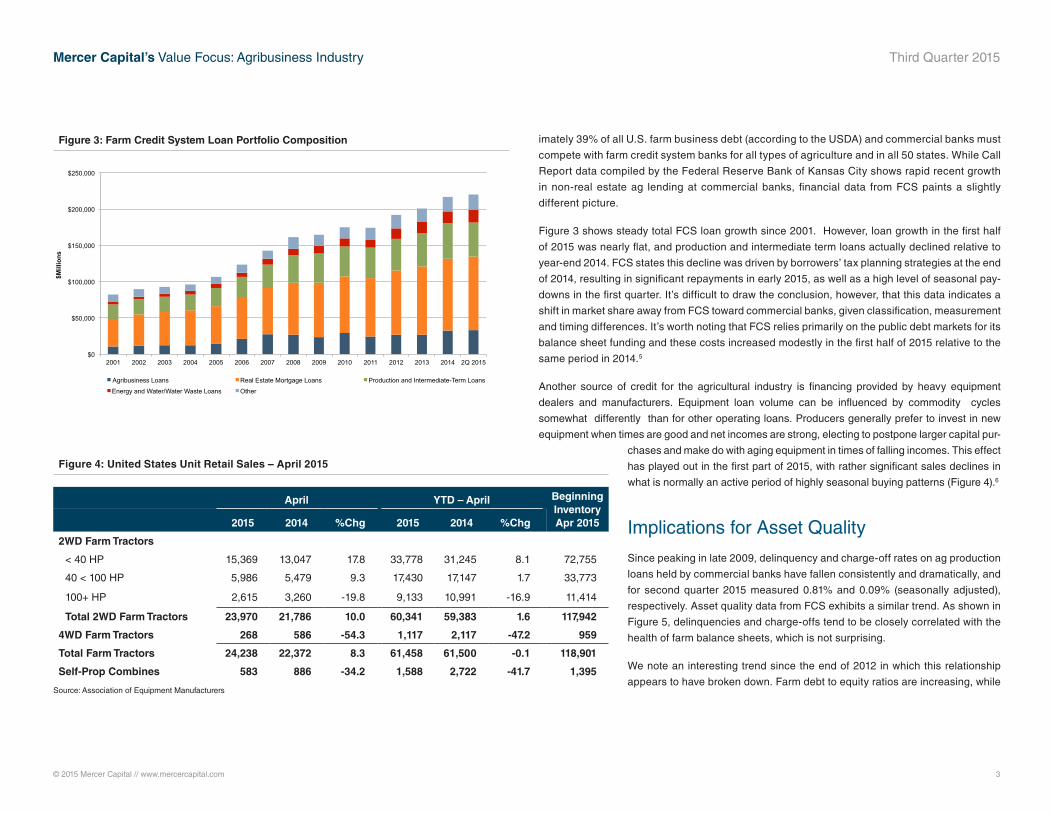
imately 39% of all U.S. farm business debt (according to the USDA) and commercial banks must
compete with farm credit system banks for all types of agriculture and in all 50 states. While Call
Report data compiled by the Federal Reserve Bank of Kansas City shows rapid recent growth
in non-real estate ag lending at commercial banks, financial data from FCS paints a slightly
different picture.
Figure 3 shows steady total FCS loan growth since 2001. However, loan growth in the first half
of 2015 was nearly flat, and production and intermediate term loans actually declined relative to
year-end 2014. FCS states this decline was driven by borrowers’ tax planning strategies at the end
of 2014, resulting in significant repayments in early 2015, as well as a high level of seasonal pay-
downs in the first quarter. It’s difficult to draw the conclusion, however, that this data indicates a
shift in market share away from FCS toward commercial banks, given classification, measurement
and timing differences. It’s worth noting that FCS relies primarily on the public debt markets for its
balance sheet funding and these costs increased modestly in the first half of 2015 relative to the
same period in 2014.5
Another source of credit for the agricultural industry is financing provided by heavy equipment
dealers and manufacturers. Equipment loan volume can be influenced by commodity cycles
somewhat differently than for other operating loans. Producers generally prefer to invest in new
equipment when times are good and net incomes are strong, electing to postpone larger capital pur-
chases and make do with aging equipment in times of falling incomes. This effect
has played out in the first part of 2015, with rather significant sales declines in
what is normally an active period of highly seasonal buying patterns (Figure 4).6
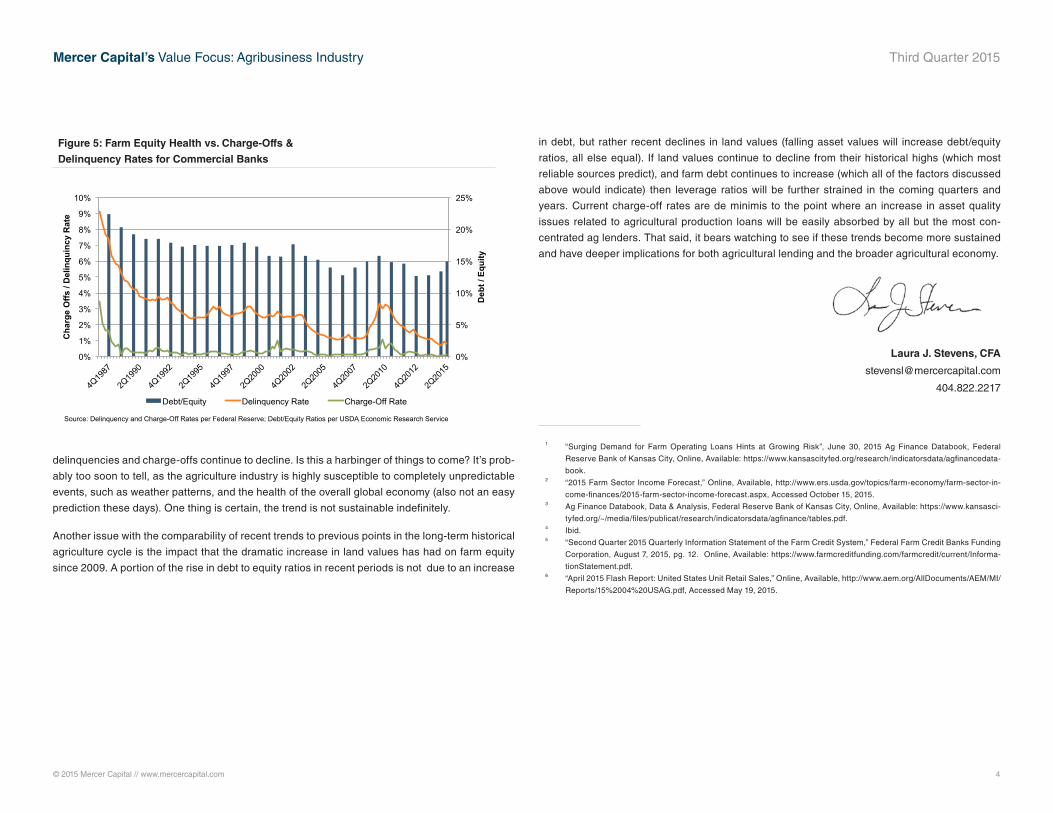
Implications for Asset Quality
Since peaking in late 2009, delinquency and charge-off rates on ag production
loans held by commercial banks have fallen consistently and dramatically, and
for second quarter 2015 measured 0.81% and 0.09% (seasonally adjusted),
respectively. Asset quality data from FCS exhibits a similar trend. As shown in
Figure 5, delinquencies and charge-offs tend to be closely correlated with the
health of farm balance sheets, which is not surprising.
We note an interesting trend since the end of 2012 in which this relationship
appears to have broken down. Farm debt to equity ratios are increasing, while
April YTD – April Beginning Inventory Apr 20152015 2014 %Chg 2015 2014 %Chg
2WD Farm Tractors
< 40 HP 15,369 13,047 17.8 33,778 31,245 8.1 72,755
40 < 100 HP 5,986 5,479 9.3 17,430 17,147 1.7 33,773
100+ HP 2,615 3,260 -19.8 9,133 10,991 -16.9 11,414
Total 2WD Farm Tractors 23,970 21,786 10.0 60,341 59,383 1.6 117,942
4WD Farm Tractors 268 586 -54.3 1,117 2,117 -47.2 959
Total Farm Tractors 24,238 22,372 8.3 61,458 61,500 -0.1 118,901
Self-Prop Combines 583 886 -34.2 1,588 2,722 -41.7 1,395
Source: Association of Equipment Manufacturers
Figure 4: United States Unit Retail Sales – April 2015
$0
$50,000
$100,000
$150,000
$200,000
$250,000
2Q 2015 2014 2013 2012 2011 2010 2009 2008 2007 2006 2005 2004 2003 2002 2001
$Mill
ions
Agribusiness Loans Real Estate Mortgage Loans Production and Intermediate-Term Loans
Energy and Water/Water Waste Loans Other
Source: Farm Credit System Annual Information Statements, 2001 through 2014; Quarterly Information Statement, Second Quarter 2015 Note: Agribusiness Loans includes loans to cooperatives, processing and marketing loans, and farm-related business loans. Other includes rural residential RE loans, communication loans, export loans, lease receivables, loans to other financing institutions and international loans.
Figure 3: Farm Credit System Loan Portfolio Composition
© 2015 Mercer Capital // www.mercercapital.com 4
Mercer Capital’s Value Focus: Agribusiness Industry Third Quarter 2015
in debt, but rather recent declines in land values (falling asset values will increase debt/equity
ratios, all else equal). If land values continue to decline from their historical highs (which most
reliable sources predict), and farm debt continues to increase (which all of the factors discussed
above would indicate) then leverage ratios will be further strained in the coming quarters and
years. Current charge-off rates are de minimis to the point where an increase in asset quality
issues related to agricultural production loans will be easily absorbed by all but the most con-
centrated ag lenders. That said, it bears watching to see if these trends become more sustained
and have deeper implications for both agricultural lending and the broader agricultural economy.
Laura J. Stevens, CFA
404.822.2217
1 “Surging Demand for Farm Operating Loans Hints at Growing Risk”, June 30, 2015 Ag Finance Databook, Federal
Reserve Bank of Kansas City, Online, Available: https://www.kansascityfed.org/research/indicatorsdata/agfinancedata-
book.2 “2015 Farm Sector Income Forecast,” Online, Available, http://www.ers.usda.gov/topics/farm-economy/farm-sector-in-
come-finances/2015-farm-sector-income-forecast.aspx, Accessed October 15, 2015.3 Ag Finance Databook, Data & Analysis, Federal Reserve Bank of Kansas City, Online, Available: https://www.kansasci-
tyfed.org/~/media/files/publicat/research/indicatorsdata/agfinance/tables.pdf.4 Ibid.5 “Second Quarter 2015 Quarterly Information Statement of the Farm Credit System,” Federal Farm Credit Banks Funding
Corporation, August 7, 2015, pg. 12. Online, Available: https://www.farmcreditfunding.com/farmcredit/current/Informa-
tionStatement.pdf.6 “April 2015 Flash Report: United States Unit Retail Sales,” Online, Available, http://www.aem.org/AllDocuments/AEM/MI/
Reports/15%2004%20USAG.pdf, Accessed May 19, 2015.
delinquencies and charge-offs continue to decline. Is this a harbinger of things to come? It’s prob-
ably too soon to tell, as the agriculture industry is highly susceptible to completely unpredictable
events, such as weather patterns, and the health of the overall global economy (also not an easy
prediction these days). One thing is certain, the trend is not sustainable indefinitely.
Another issue with the comparability of recent trends to previous points in the long-term historical
agriculture cycle is the impact that the dramatic increase in land values has had on farm equity
since 2009. A portion of the rise in debt to equity ratios in recent periods is not due to an increase
Figure 5: Farm Equity Health vs. Charge-Offs &
Delinquency Rates for Commercial Banks
0%
1%
2%
3%
4%
5%
6%
7%
8%
9%
10%
0%
5%
10%
15%
20%
25%
2Q20
15
4Q20
12
2Q20
10
4Q20
07
2Q20
05
4Q20
02
2Q20
00
4Q19
97
2Q19
95
4Q19
92
2Q19
90
4Q19
87
Cha
rge
Offs
/ D
elin
quin
cy R
ate
Deb
t / E
quity
Debt/Equity Delinquency Rate Charge-Off Rate
Source: Delinquency and Charge-Off Rates per Federal Reserve; Debt/Equity Ratios per USDA Economic Research Service
© 2015 Mercer Capital // www.mercercapital.com 5
Mercer Capital’s Value Focus: Agribusiness Industry Third Quarter 2015
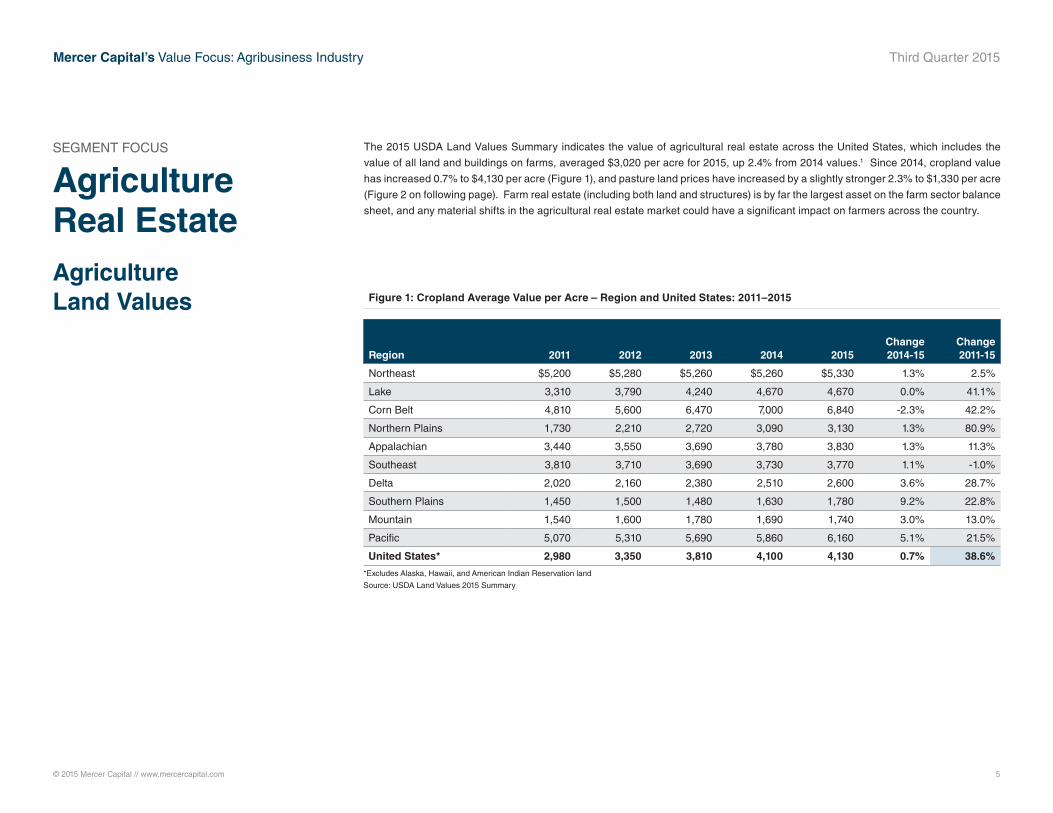
The 2015 USDA Land Values Summary indicates the value of agricultural real estate across the United States, which includes the
value of all land and buildings on farms, averaged $3,020 per acre for 2015, up 2.4% from 2014 values.1 Since 2014, cropland value
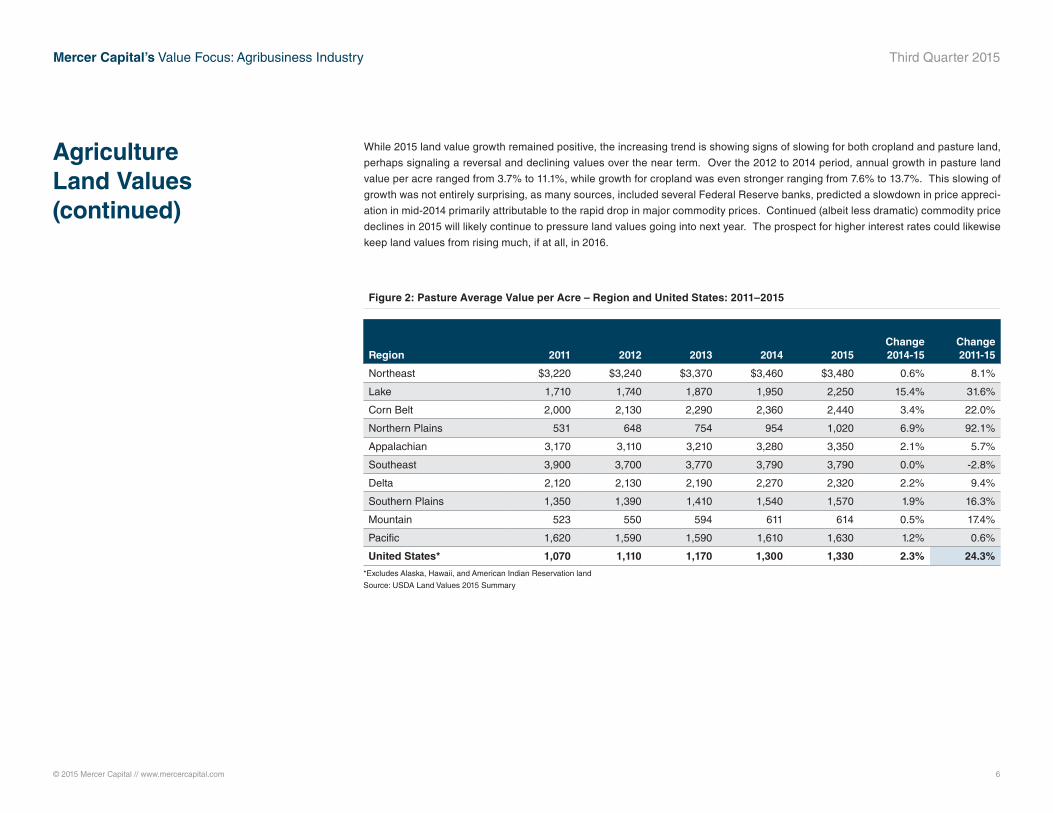
has increased 0.7% to $4,130 per acre (Figure 1), and pasture land prices have increased by a slightly stronger 2.3% to $1,330 per acre
(Figure 2 on following page). Farm real estate (including both land and structures) is by far the largest asset on the farm sector balance
sheet, and any material shifts in the agricultural real estate market could have a significant impact on farmers across the country.
Agriculture Land Values Figure 1: Cropland Average Value per Acre – Region and United States: 2011–2015
Region 2011 2012 2013 2014 2015Change 2014-15
Change 2011-15
Northeast $5,200 $5,280 $5,260 $5,260 $5,330 1.3% 2.5%
Lake 3,310 3,790 4,240 4,670 4,670 0.0% 41.1%
Corn Belt 4,810 5,600 6,470 7,000 6,840 -2.3% 42.2%
Northern Plains 1,730 2,210 2,720 3,090 3,130 1.3% 80.9%
Appalachian 3,440 3,550 3,690 3,780 3,830 1.3% 11.3%
Southeast 3,810 3,710 3,690 3,730 3,770 1.1% -1.0%
Delta 2,020 2,160 2,380 2,510 2,600 3.6% 28.7%
Southern Plains 1,450 1,500 1,480 1,630 1,780 9.2% 22.8%
Mountain 1,540 1,600 1,780 1,690 1,740 3.0% 13.0%
Pacific 5,070 5,310 5,690 5,860 6,160 5.1% 21.5%
United States* 2,980 3,350 3,810 4,100 4,130 0.7% 38.6%
*Excludes Alaska, Hawaii, and American Indian Reservation land
Source: USDA Land Values 2015 Summary
SEGMENT FOCUS
Agriculture Real Estate
© 2015 Mercer Capital // www.mercercapital.com 6
Mercer Capital’s Value Focus: Agribusiness Industry Third Quarter 2015
While 2015 land value growth remained positive, the increasing trend is showing signs of slowing for both cropland and pasture land,
perhaps signaling a reversal and declining values over the near term. Over the 2012 to 2014 period, annual growth in pasture land
value per acre ranged from 3.7% to 11.1%, while growth for cropland was even stronger ranging from 7.6% to 13.7%. This slowing of
growth was not entirely surprising, as many sources, included several Federal Reserve banks, predicted a slowdown in price appreci-
ation in mid-2014 primarily attributable to the rapid drop in major commodity prices. Continued (albeit less dramatic) commodity price
declines in 2015 will likely continue to pressure land values going into next year. The prospect for higher interest rates could likewise
keep land values from rising much, if at all, in 2016.
Agriculture Land Values (continued)
Figure 2: Pasture Average Value per Acre – Region and United States: 2011–2015
Region 2011 2012 2013 2014 2015Change 2014-15
Change 2011-15
Northeast $3,220 $3,240 $3,370 $3,460 $3,480 0.6% 8.1%
Lake 1,710 1,740 1,870 1,950 2,250 15.4% 31.6%
Corn Belt 2,000 2,130 2,290 2,360 2,440 3.4% 22.0%
Northern Plains 531 648 754 954 1,020 6.9% 92.1%
Appalachian 3,170 3,110 3,210 3,280 3,350 2.1% 5.7%
Southeast 3,900 3,700 3,770 3,790 3,790 0.0% -2.8%
Delta 2,120 2,130 2,190 2,270 2,320 2.2% 9.4%
Southern Plains 1,350 1,390 1,410 1,540 1,570 1.9% 16.3%
Mountain 523 550 594 611 614 0.5% 17.4%
Pacific 1,620 1,590 1,590 1,610 1,630 1.2% 0.6%
United States* 1,070 1,110 1,170 1,300 1,330 2.3% 24.3%
*Excludes Alaska, Hawaii, and American Indian Reservation land
Source: USDA Land Values 2015 Summary
© 2015 Mercer Capital // www.mercercapital.com 7
Mercer Capital’s Value Focus: Agribusiness Industry Third Quarter 2015
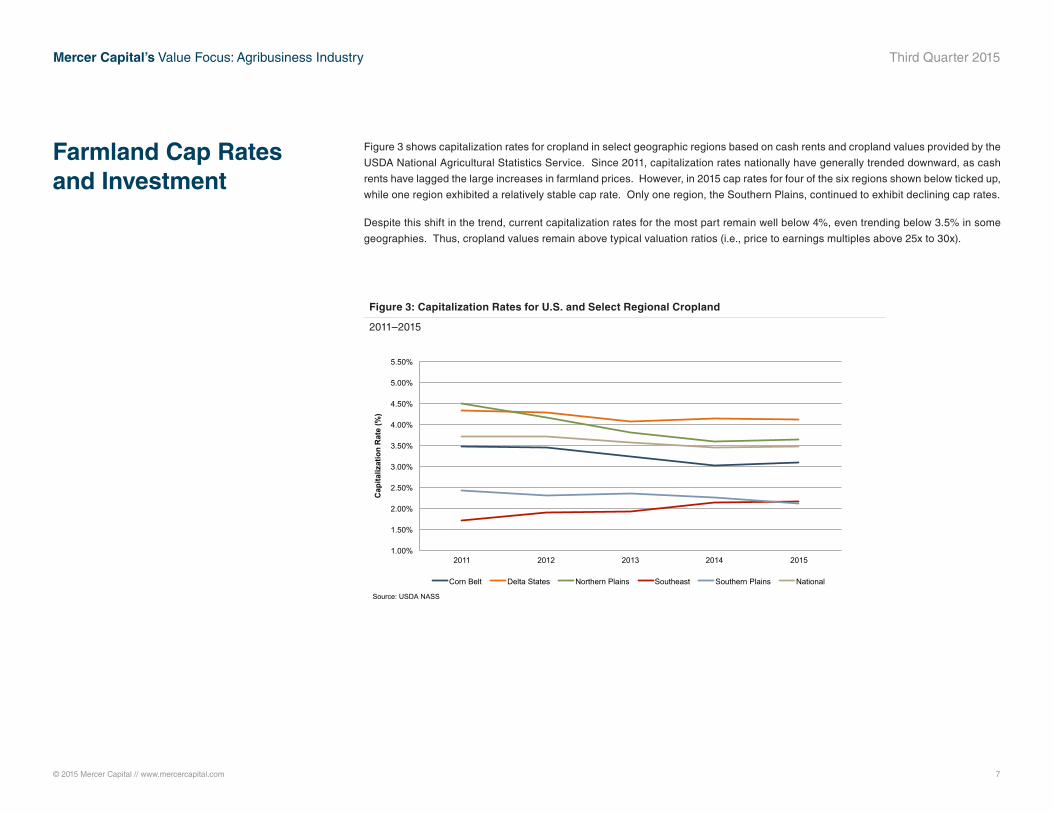
Figure 3 shows capitalization rates for cropland in select geographic regions based on cash rents and cropland values provided by the
USDA National Agricultural Statistics Service. Since 2011, capitalization rates nationally have generally trended downward, as cash
rents have lagged the large increases in farmland prices. However, in 2015 cap rates for four of the six regions shown below ticked up,
while one region exhibited a relatively stable cap rate. Only one region, the Southern Plains, continued to exhibit declining cap rates.
Despite this shift in the trend, current capitalization rates for the most part remain well below 4%, even trending below 3.5% in some
geographies. Thus, cropland values remain above typical valuation ratios (i.e., price to earnings multiples above 25x to 30x).
Farmland Cap Rates and Investment
Figure 3: Capitalization Rates for U.S. and Select Regional Cropland
2011–2015
1.00%
1.50%
2.00%
2.50%
3.00%
3.50%
4.00%
4.50%
5.00%
5.50%
2011 2012 2013 2014 2015
Cap
italiz
atio
n R
ate
(%)
Corn Belt Delta States Northern Plains Southeast Southern Plains National
Source: USDA NASS
© 2015 Mercer Capital // www.mercercapital.com 8
Mercer Capital’s Value Focus: Agribusiness Industry Third Quarter 2015
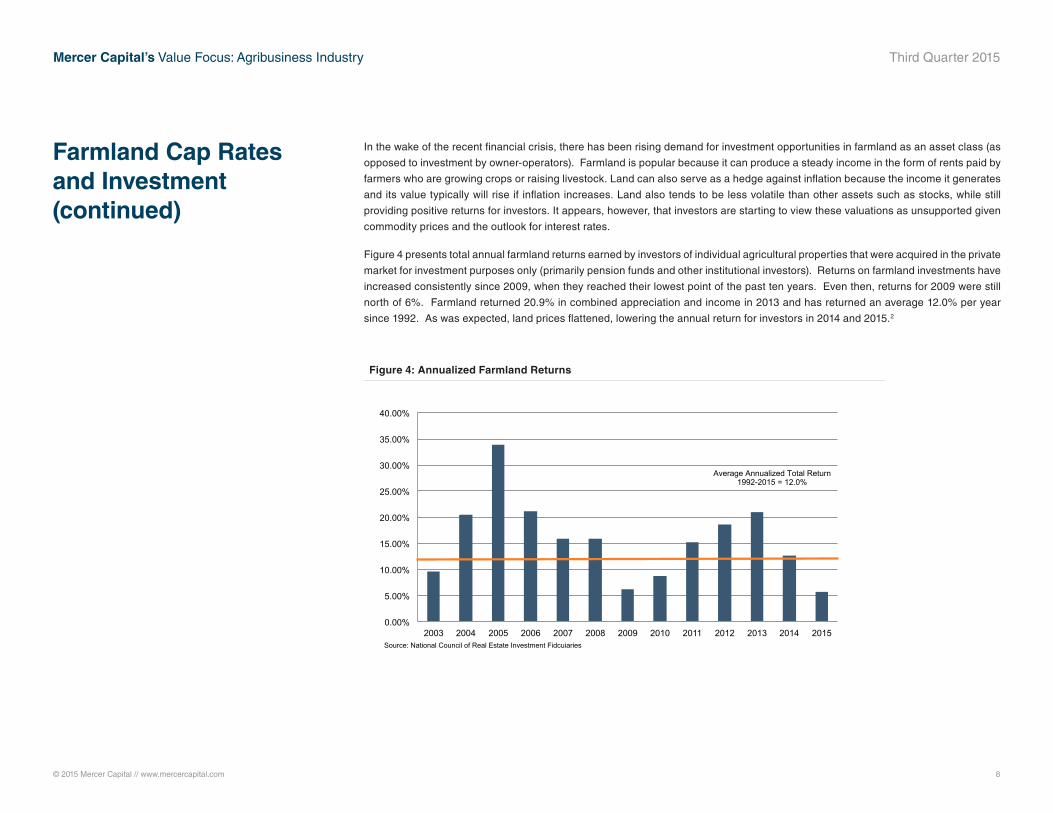
In the wake of the recent financial crisis, there has been rising demand for investment opportunities in farmland as an asset class (as
opposed to investment by owner-operators). Farmland is popular because it can produce a steady income in the form of rents paid by
farmers who are growing crops or raising livestock. Land can also serve as a hedge against inflation because the income it generates
and its value typically will rise if inflation increases. Land also tends to be less volatile than other assets such as stocks, while still
providing positive returns for investors. It appears, however, that investors are starting to view these valuations as unsupported given
commodity prices and the outlook for interest rates.
Figure 4 presents total annual farmland returns earned by investors of individual agricultural properties that were acquired in the private
market for investment purposes only (primarily pension funds and other institutional investors). Returns on farmland investments have
increased consistently since 2009, when they reached their lowest point of the past ten years. Even then, returns for 2009 were still
north of 6%. Farmland returned 20.9% in combined appreciation and income in 2013 and has returned an average 12.0% per year
since 1992. As was expected, land prices flattened, lowering the annual return for investors in 2014 and 2015.2
Farmland Cap Rates and Investment (continued)
Figure 4: Annualized Farmland Returns
0.00%
5.00%
10.00%
15.00%
20.00%
25.00%
30.00%
35.00%
40.00%
2003 2004 2005 2006 2007 2008 2009 2010 2011 2012 2013 2014 2015 Source: National Council of Real Estate Investment Fidcuiaries
Average Annualized Total Return 1992-2015 = 12.0%
© 2015 Mercer Capital // www.mercercapital.com 9
Mercer Capital’s Value Focus: Agribusiness Industry Third Quarter 2015
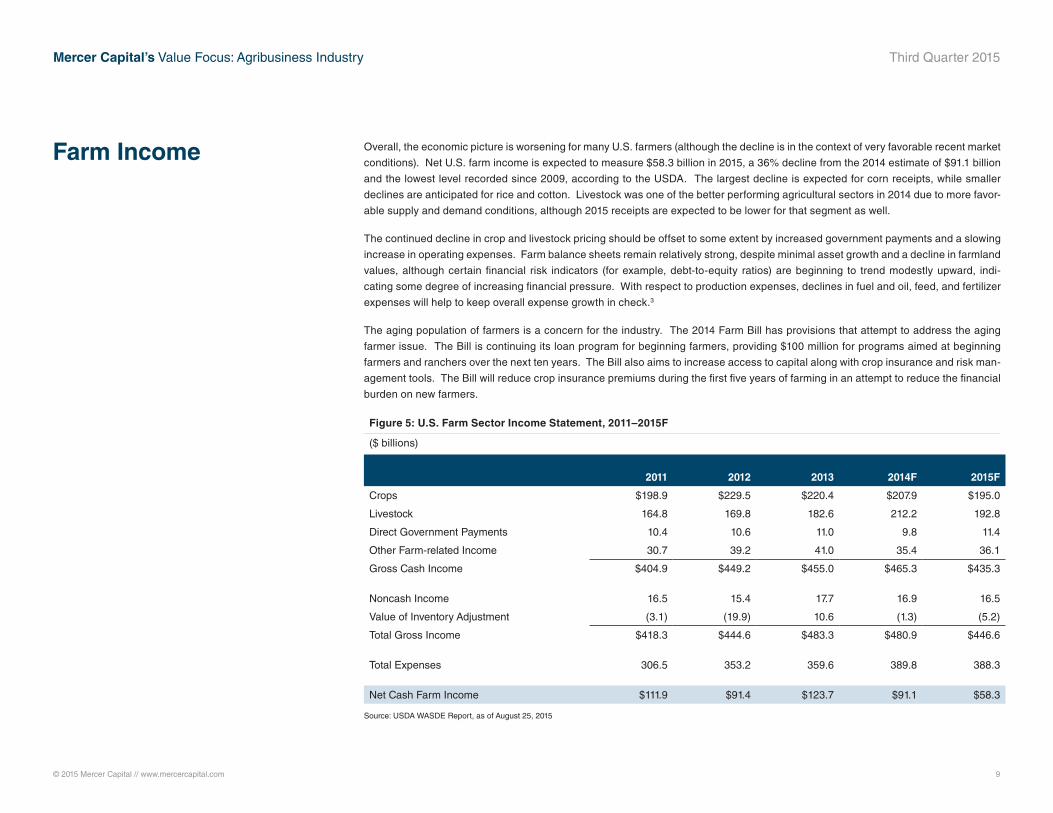
Overall, the economic picture is worsening for many U.S. farmers (although the decline is in the context of very favorable recent market
conditions). Net U.S. farm income is expected to measure $58.3 billion in 2015, a 36% decline from the 2014 estimate of $91.1 billion
and the lowest level recorded since 2009, according to the USDA. The largest decline is expected for corn receipts, while smaller
declines are anticipated for rice and cotton. Livestock was one of the better performing agricultural sectors in 2014 due to more favor-
able supply and demand conditions, although 2015 receipts are expected to be lower for that segment as well.
The continued decline in crop and livestock pricing should be offset to some extent by increased government payments and a slowing
increase in operating expenses. Farm balance sheets remain relatively strong, despite minimal asset growth and a decline in farmland
values, although certain financial risk indicators (for example, debt-to-equity ratios) are beginning to trend modestly upward, indi-
cating some degree of increasing financial pressure. With respect to production expenses, declines in fuel and oil, feed, and fertilizer
expenses will help to keep overall expense growth in check.3
The aging population of farmers is a concern for the industry. The 2014 Farm Bill has provisions that attempt to address the aging
farmer issue. The Bill is continuing its loan program for beginning farmers, providing $100 million for programs aimed at beginning
farmers and ranchers over the next ten years. The Bill also aims to increase access to capital along with crop insurance and risk man-
agement tools. The Bill will reduce crop insurance premiums during the first five years of farming in an attempt to reduce the financial
burden on new farmers.
Farm Income
Figure 5: U.S. Farm Sector Income Statement, 2011–2015F
($ billions)
2011 2012 2013 2014F 2015F
Crops $198.9 $229.5 $220.4 $207.9 $195.0
Livestock 164.8 169.8 182.6 212.2 192.8
Direct Government Payments 10.4 10.6 11.0 9.8 11.4
Other Farm-related Income 30.7 39.2 41.0 35.4 36.1
Gross Cash Income $404.9 $449.2 $455.0 $465.3 $435.3
Noncash Income 16.5 15.4 17.7 16.9 16.5
Value of Inventory Adjustment (3.1) (19.9) 10.6 (1.3) (5.2)
Total Gross Income $418.3 $444.6 $483.3 $480.9 $446.6
Total Expenses 306.5 353.2 359.6 389.8 388.3
Net Cash Farm Income $111.9 $91.4 $123.7 $91.1 $58.3
Source: USDA WASDE Report, as of August 25, 2015
© 2015 Mercer Capital // www.mercercapital.com 10
Mercer Capital’s Value Focus: Agribusiness Industry Third Quarter 2015
References and Data Sources 1 “USDA Land Values 2015 Summary,” August 2015, Online, Available, http://www.usda.gov/nass/PUBS/TODAYRPT/land0815.
pdf, Accessed November 11, 2015.2 “More Individuals Are Looking To Invest In Farmland And Timberland,” Online, Subscription, http://online.wsj.com/articles/
more-individuals-are-looking-to-invest-in-farmland-and-timberland-1405706090, Accessed October 14, 2014. 3 “2015 Farm Sector Income Forecast,” Online, Available, http://www.ers.usda.gov/topics/farm-economy/farm-sector-income-fi-
nances/2015-farm-sector-income-forecast.aspx, Accessed May 19, 2015.
Mercer Capital’s Value Focus: Agribusiness Industry Third Quarter 2015
© 2015 Mercer Capital // www.mercercapital.com // Data Source: Bloomberg 11
0!
100!
200!
300!
400!
500!
600!
Sep-13!
Nov-13!
Jan-14
!
Mar-14!
May-14!
Jul-1
4!
Sep-14!
Nov-14!
Jan-15
!
Mar-15!
May-15!
Jul-1
5!
Sep-15!
Pric
e (c
ents
/bus
hel)!
0!
200!
400!
600!
800!
1000!
1200!
1400!
1600!
1800!
Sep-13!
Nov-13!
Jan-14
!
Mar-14!
May-14!
Jul-1
4!
Sep-14!
Nov-14!
Jan-15
!
Mar-15!
May-15!
Jul-1
5!
Sep-15!
Pric
e (c
ents
/bus
hel)!
0!
100!
200!
300!
400!
500!
600!
700!
800!
Sep-13!
Nov-13!
Jan-14
!
Mar-14!
May-14!
Jul-1
4!
Sep-14!
Nov-14!
Jan-15
!
Mar-15!
May-15!
Jul-1
5!
Sep-15!
Pric
e (c
ents
/bus
hel)!
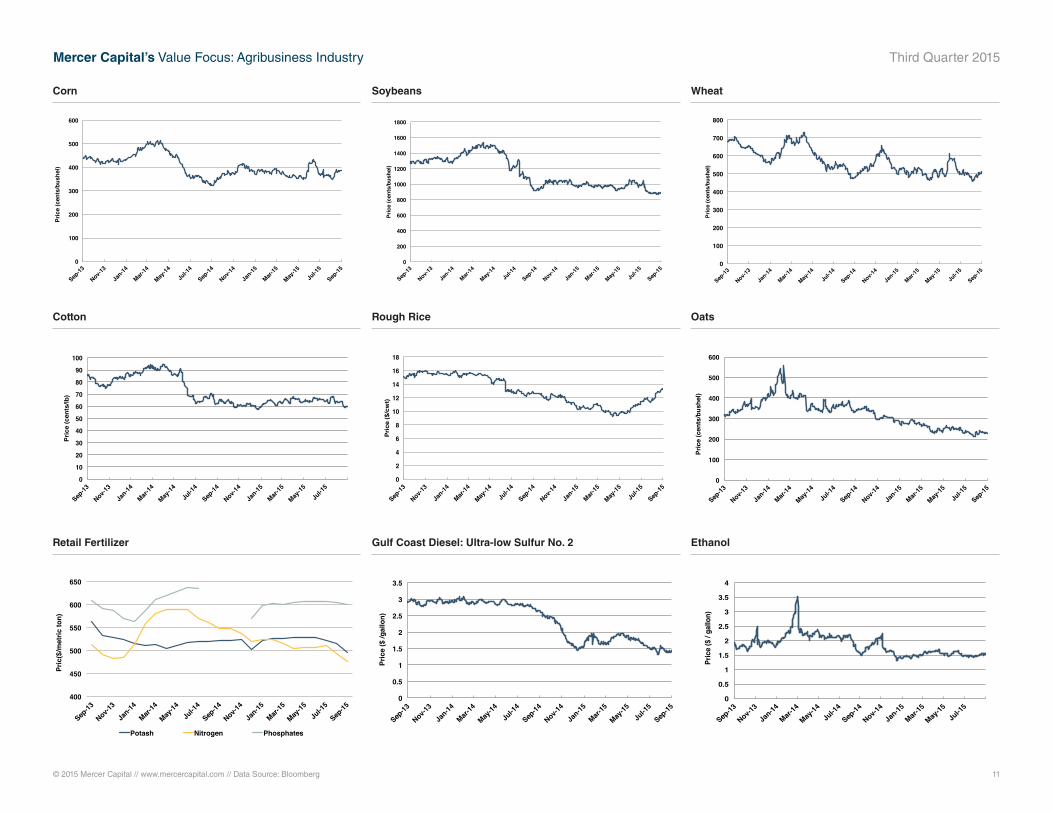
Corn Soybeans Wheat
0!
10!
20!
30!
40!
50!
60!
70!
80!
90!
100!
Sep-13!
Nov-13!
Jan-14!
Mar-14!
May-14!
Jul-1
4!
Sep-14!
Nov-14!
Jan-15!
Mar-15!
May-15!
Jul-1
5!
Pric
e (c
ents
/lb)!
0!
2!
4!
6!
8!
10!
12!
14!
16!
18!
Sep-13!
Nov-13!
Jan-14!
Mar-14!
May-14!
Jul-1
4!
Sep-14!
Nov-14!
Jan-15!
Mar-15!
May-15!
Jul-1
5!
Sep-15!
Pric
e ($
/cw
t)!
0!
100!
200!
300!
400!
500!
600!
Sep-13!
Nov-13!
Jan-14
!
Mar-14!
May-14!
Jul-1
4!
Sep-14!
Nov-14!
Jan-15
!
Mar-15!
May-15!
Jul-1
5!
Sep-15!
Pric
e (c
ents
/bus
hel)!
Cotton Rough Rice Oats
400!
450!
500!
550!
600!
650!
Sep-13!
Nov-13!
Jan-14
!
Mar-14!
May-14!
Jul-1
4!
Sep-14!
Nov-14!
Jan-15
!
Mar-15!
May-15!
Jul-1
5!
Sep-15!
Pric
($/m
etric
ton)!
Potash! Nitrogen! Phosphates!
0!
0.5!
1!
1.5!
2!
2.5!
3!
3.5!
Sep-13!
Nov-13!
Jan-14
!
Mar-14!
May-14!
Jul-1
4!
Sep-14!
Nov-14!
Jan-15
!
Mar-15!
May-15!
Jul-1
5!
Sep-15!
Pric
e ($
/gal
lon)!
0!
0.5!
1!
1.5!
2!
2.5!
3!
3.5!
4!
Sep-13!
Nov-13!
Jan-14
!
Mar-14!
May-14!
Jul-1
4!
Sep-14!
Nov-14!
Jan-15
!
Mar-15!
May-15!
Jul-1
5!Pr
ice
($ /
gallo
n)!
Retail Fertilizer Gulf Coast Diesel: Ultra-low Sulfur No. 2 Ethanol
© 2015 Mercer Capital // www.mercercapital.com 12
Mercer Capital’s Value Focus: Agribusiness Industry Third Quarter 2015
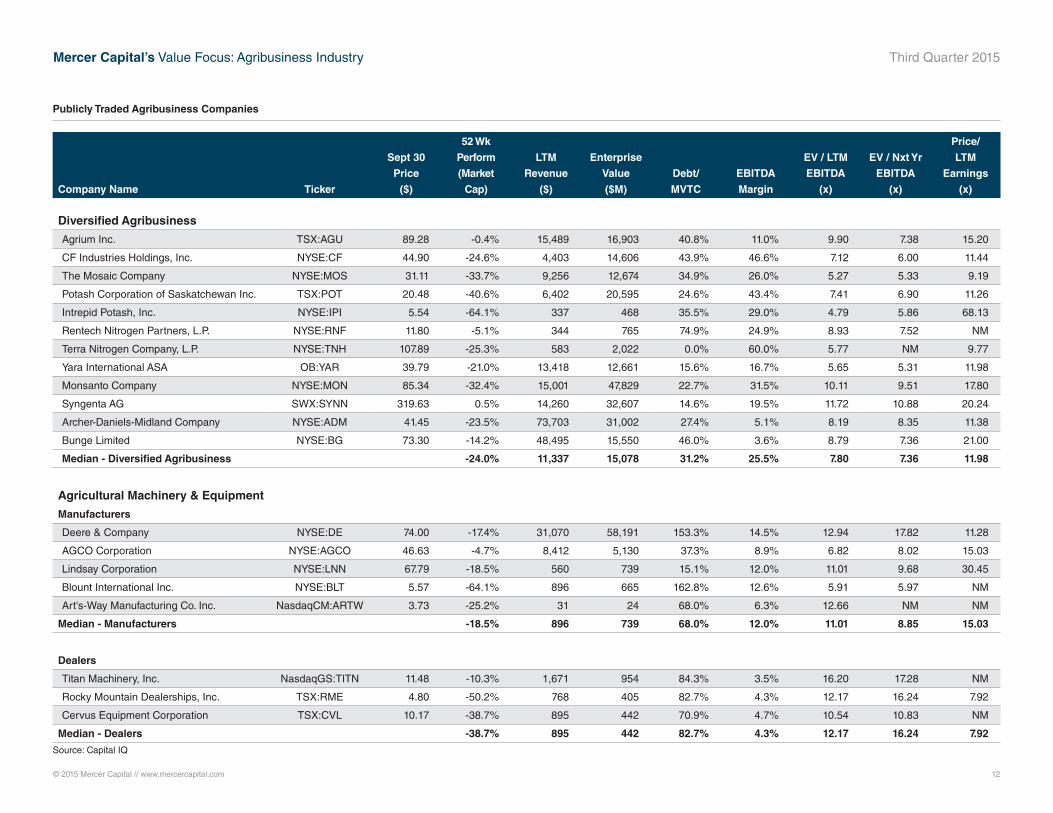
Company Name Ticker
Sept 30
Price
($)
52 Wk
Perform
(Market
Cap)
LTM
Revenue
($)
Enterprise
Value
($M)
Debt/
MVTC
EBITDA
Margin
EV / LTM
EBITDA
(x)
EV / Nxt Yr
EBITDA
(x)
Price/
LTM
Earnings
(x)
Diversified Agribusiness
Agrium Inc. TSX:AGU 89.28 -0.4% 15,489 16,903 40.8% 11.0% 9.90 7.38 15.20
CF Industries Holdings, Inc. NYSE:CF 44.90 -24.6% 4,403 14,606 43.9% 46.6% 7.12 6.00 11.44
The Mosaic Company NYSE:MOS 31.11 -33.7% 9,256 12,674 34.9% 26.0% 5.27 5.33 9.19
Potash Corporation of Saskatchewan Inc. TSX:POT 20.48 -40.6% 6,402 20,595 24.6% 43.4% 7.41 6.90 11.26
Intrepid Potash, Inc. NYSE:IPI 5.54 -64.1% 337 468 35.5% 29.0% 4.79 5.86 68.13
Rentech Nitrogen Partners, L.P. NYSE:RNF 11.80 -5.1% 344 765 74.9% 24.9% 8.93 7.52 NM
Terra Nitrogen Company, L.P. NYSE:TNH 107.89 -25.3% 583 2,022 0.0% 60.0% 5.77 NM 9.77
Yara International ASA OB:YAR 39.79 -21.0% 13,418 12,661 15.6% 16.7% 5.65 5.31 11.98
Monsanto Company NYSE:MON 85.34 -32.4% 15,001 47,829 22.7% 31.5% 10.11 9.51 17.80
Syngenta AG SWX:SYNN 319.63 0.5% 14,260 32,607 14.6% 19.5% 11.72 10.88 20.24
Archer-Daniels-Midland Company NYSE:ADM 41.45 -23.5% 73,703 31,002 27.4% 5.1% 8.19 8.35 11.38
Bunge Limited NYSE:BG 73.30 -14.2% 48,495 15,550 46.0% 3.6% 8.79 7.36 21.00
Median - Diversified Agribusiness -24.0% 11,337 15,078 31.2% 25.5% 7.80 7.36 11.98
Agricultural Machinery & Equipment
Manufacturers
Deere & Company NYSE:DE 74.00 -17.4% 31,070 58,191 153.3% 14.5% 12.94 17.82 11.28
AGCO Corporation NYSE:AGCO 46.63 -4.7% 8,412 5,130 37.3% 8.9% 6.82 8.02 15.03
Lindsay Corporation NYSE:LNN 67.79 -18.5% 560 739 15.1% 12.0% 11.01 9.68 30.45
Blount International Inc. NYSE:BLT 5.57 -64.1% 896 665 162.8% 12.6% 5.91 5.97 NM
Art's-Way Manufacturing Co. Inc. NasdaqCM:ARTW 3.73 -25.2% 31 24 68.0% 6.3% 12.66 NM NM
Median - Manufacturers -18.5% 896 739 68.0% 12.0% 11.01 8.85 15.03
Dealers
Titan Machinery, Inc. NasdaqGS:TITN 11.48 -10.3% 1,671 954 84.3% 3.5% 16.20 17.28 NM
Rocky Mountain Dealerships, Inc. TSX:RME 4.80 -50.2% 768 405 82.7% 4.3% 12.17 16.24 7.92
Cervus Equipment Corporation TSX:CVL 10.17 -38.7% 895 442 70.9% 4.7% 10.54 10.83 NM
Median - Dealers -38.7% 895 442 82.7% 4.3% 12.17 16.24 7.92
Source: Capital IQ
Publicly Traded Agribusiness Companies
© 2015 Mercer Capital // www.mercercapital.com 13
Mercer Capital’s Value Focus: Agribusiness Industry Third Quarter 2015
70
80
90
100
110
120
130
Oct-14 Nov-14 Dec-14 Jan-15 Feb-15 Mar-15 Apr-15 May-15 Jun-15 Jul-15 Aug-15 Sep-15
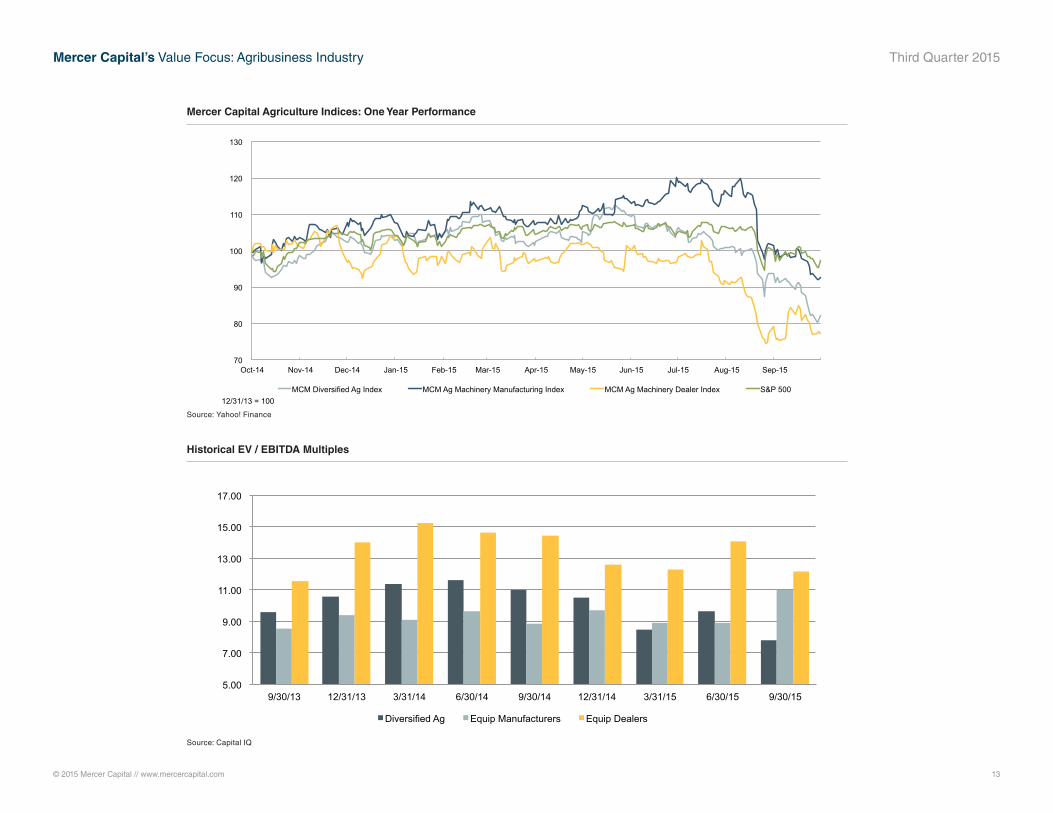
MCM Diversified Ag Index MCM Ag Machinery Manufacturing Index MCM Ag Machinery Dealer Index S&P 500 12/31/13 = 100
Mercer Capital Agriculture Indices: One Year Performance
5.00
7.00
9.00
11.00
13.00
15.00
17.00
9/30/13 12/31/13 3/31/14 6/30/14 9/30/14 12/31/14 3/31/15 6/30/15 9/30/15
Diversified Ag Equip Manufacturers Equip Dealers
Historical EV / EBITDA Multiples
Source: Yahoo! Finance
Source: Capital IQ
Mercer CapitalAgribusiness Industry Services
Contact Us
Copyright © 2015 Mercer Capital Management, Inc. All rights reserved. It is illegal under Federal law to reproduce this publication or any portion of its contents without the publisher’s permission. Media quotations with source attribution are encouraged. Reporters
requesting additional information or editorial comment should contact Barbara Walters Price at 901.685.2120. Mercer Capital’s Industry Focus is published quarterly and does not constitute legal or financial consulting advice. It is offered as an information service to
our clients and friends. Those interested in specific guidance for legal or accounting matters should seek competent professional advice. Inquiries to discuss specific valuation matters are welcomed. To add your name to our mailing list to receive this complimentary
publication, visit our web site at www.mercercapital.com.
Mercer Capital has expertise providing business valuation and financial advisory services to companies in the agribusiness industry.
Industry Segments
Mercer Capital serves the following industry segments:
• Agriculture Machinery, Equipment, & Implements
• Crop and Crop Services
• Agriculture Real Estate
• Agriculture Chemicals
Contact a Mercer Capital professional to discuss your needs in confidence.
Nicholas J. Heinz, [email protected]
Matthew R. Crow, CFA, [email protected]
Timothy R. Lee, [email protected]
Laura J. Stevens, [email protected]
MERCER CAPITAL
Memphis5100 Poplar Avenue, Suite 2600Memphis, Tennessee 38137901.685.2120
Dallas12201 Merit Drive, Suite 480Dallas, Texas 75251214.468.8400
Nashville102 Woodmont Blvd., Suite 231Nashville, Tennessee 37205615.345.0350
www.mercercapital.com
BUSINESS VALUATION & FINANCIAL ADVISORY SERVICES
Services Provided
• Valuation of agriculture companies
• Transaction advisory for acquisitions and divestitures
• Valuations for purchase accounting and impairment testing
• Fairness and solvency opinions
• Litigation support for economic damages and valuation and shareholder
disputes