Embed Size (px)
DESCRIPTION
Citation preview

United States Steel Corporation
Merrill Lynch Global Metals, Mining & Steel
Conference
May 2008© United States Steel Corporation 2008
2
Forward-Looking Statements
This presentation contains forward-looking statements with respect to market conditions, operating costs, shipments, prices and profit-based compensation payments. Some factors, among others, that could affect 2007 market conditions, costs, shipments and prices for both domestic operations and USSE include global product demand, prices and mix; global and company steel production levels; raw materials' availability and prices; plant operating performance; the timing and completion of facility projects; natural gas prices and usage and availability; changes in environmental, tax and other laws; the resumption of operation of steel facilities sold under the bankruptcy laws; employee strikes; power outages; and U.S. and global economic performance and political developments. Domestic steel shipments and prices could be affected by import levels and actions taken by the U.S. Government and its agencies. Political factors in Europe that may affect USSE’s results include, but are not limited to, taxation, nationalization, inflation, currency fluctuations, increased regulation, export quotas, tariffs, and other protectionist measures. The level of income from operations is the primary factor affecting payments under the USWA profit-based plans. In accordance with “safe harbor” provisions of the Private Securities Litigation Reform Act of 1995, cautionary statements identifying important factors, but not necessarily all factors, that could cause actual results to differ materially from those set forth in the forward-looking statements have been included in the Form 10-K of U. S. Steel for the year ended December 31, 2007, and in subsequent filings for U. S. Steel.

3
United States Steel Corporation
• 5th largest global steel producer – 31.7 mnt*
• 2nd Largest North American flat-rolled steel producer – 24 mnt*
• 2nd largest Central European flat-rolled steel producer – 7.4 mnt
• Largest North American tubular producer – 2.8 mnt
• North American raw materials balance
• ROCE:**2007 - 21%2006 - 29%
To grow responsibly while generating a competitive return on capital and meeting our financial and stakeholder obligations
* Pro-Forma for Stelco acquisition
**ROCE = IFO/average(PPE + AR + Inventory – AP)

4
Flat-rolled segment
• LTM 1Q’08 trade shipments – 18.1 million tons*
7 melt locations
• Approximately 50% contract, 40% spot & 10% indexed (CRU)
• Contract industries include: auto, appliance, tin and electrical
• Demands sophisticated metallurgical applications with specialized customer service and technical support
• Typical contract term 1-3 years
• Contract business lessens impact of spot price fluctuations
Leading producer of high quality product
* Pro-Forma for Stelco

5
Acquisition closed 10/31/07
Created 5th largest global steel company
Complementary assets & attributes:
Capability to ship approximately 900,000 tons of slabs to U. S. Steel facilities
Improve U. S. Steel’s finishing facility utilization
Annual synergies estimated to be in excess of $100 million:
Sourcing semi-finished product
Procurement, best practices and SG&A
U. S. Steel Canada

6
U. S. Steel Canada Overview
Hamilton
Lake Erie
BritishColumbia
Alberta
Manitoba
SaskatchewanOntario
Quebec
Mon Valley
Fairfield
Granite City
Minntac/Keetac
Gary
Great Lakes
Tilden
Hibbing
Labrador
Raw Materials OwnershipIron OreMinority shares of:
Hibbing TaconiteTilden MiningWabush MiningSeignelay Reserve
Raw Steel Capability4.9 Million Net Tons:
Hamilton 2.3Lake Erie 2.6
U. S. Steel Iron Ore Mining
Wabush
USSC Iron Ore MiningU. S. Steel Flat Rolled & Tubular
USSC Integrated Steel Mill
East Texas
6
Seignelay

7
European segment
• LTM 1Q’08 shipments – 6.1 million tons
• Approximately 70% spot versus 30% contracts
• Key industries: construction, service center, packaging and conversion
• Dedicated new 386,000 tons automotive/appliance galvanize line in September, 2007
• Strong growth rates and heavy infrastructure investment
Plants in both Slovakia (5.0 mmt) and Serbia (2.4 mmt)

8
Tubular segment
• LTM 1Q’08 – 1.8 million tons:Seamless 865,000 tonsWelded 925,000 tons
• Primarily spot sales
• Oil Country 63%, Standard & Line 32%, Specialty Tube 5%
• Size ranges (outside diameter): Seamless –1.9” to 26”Welded – 1” to 20”
• Shipments:NAFTA 95%International 5%
Oil country and Standard & Line pipe*
* Pro-forma for Lone Star

9
Source: Preston Pipe
Tons in Millions
0
5
10
15
20
StainlessPressure
Structural
Mechanical
OCTG
USS Tubular
Standard
Line
WeldedWelded
SeamlessSeamless
ImportsImports
DomesticDomestic
Total U.S. Tubular Market

10
Improving Industry – Why invest in Steel?
63.0x
22.6x 19.0x 18.9x14.3x
6.0x
14.0x
22.0x
30.0x
38.0x
46.0x
54.0x
62.0x
70.0x
Coa
l
Utilities
Pape
r
Railro
ads
Stee
l
• Steel is a good product, provides excellent value
• Major regions with increasing consumption rates
• Governments mostly out of industry (ex China)
• Metallics are tight, flatter cost curve
• Low Valuation:2008 P/E*
* Source: Bloomberg

11
Bullish on North America
• Melt capacity relatively constrained
• High metallic costs (iron ore & scrap)
• High carbon costs (coal & coke)
• High import transportation costs
• Relatively weak US Dollar
• Low imports and inventory
Optimistic outlook for North American integrated producers
12
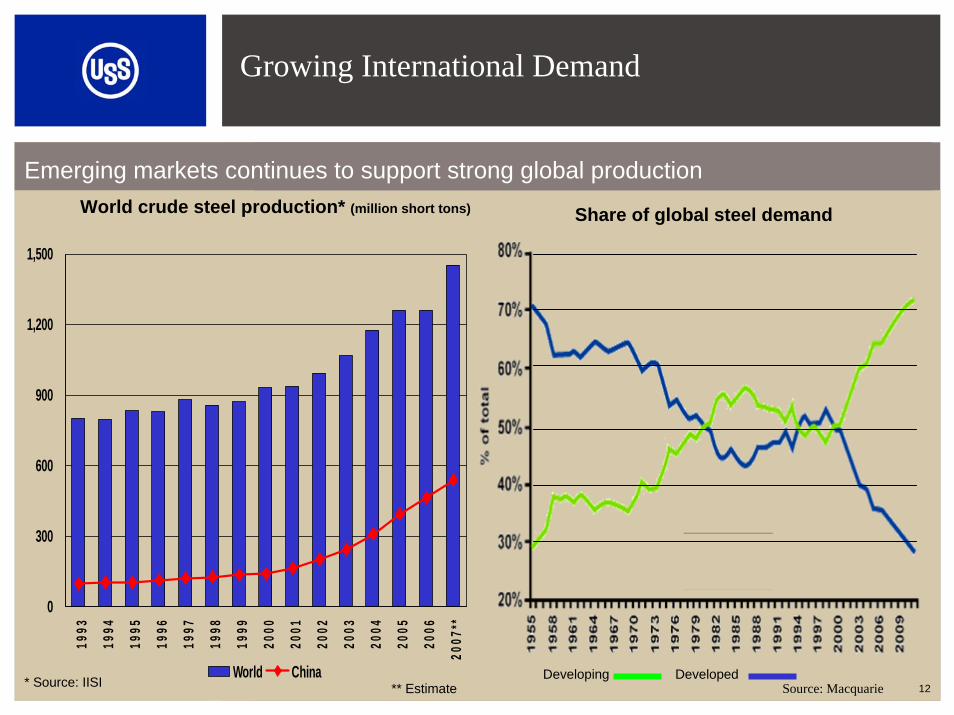
Growing International Demand
0
300
600
900
1,200
1,500
1993
1994
1995
1996
1997
1998
1999
2000
2001
2002
2003
2004
2005
2006
2007
**
World China
World crude steel production* (million short tons)
* Source: IISI ** Estimate
Emerging markets continues to support strong global production
Source: Macquarie
Share of global steel demand
Developing Developed

13
Strong business climate
Source: CRU and SBB.
$175
$275
$375
$475
$575
$675
$775
$875
$975
Jan-
02M
ay-0
2S
ep-0
2Ja
n-03
May
-03
Sep
-03
Jan-
04M
ay-0
4S
ep-0
4Ja
n-05
May
-05
Sep
-05
Jan-
06M
ay-0
6S
ep-0
6Ja
n-07
May
-07
Sep
-07
Jan-
08
USA HR German HR East Asian HR
$75
$125
$175
$225
$275
$325
$375
$425
$475
Jan
Feb
Mar
April
May
June
July
Aug
Sept
Oct
Nov
Dec
2002 2003 2004 2005
2006 2007 2008Source: D.J. Joseph Company
Selected Price Trends – Through April 2008
Shredded scrap composite $/Gross tonHot rolled $/Net Ton

14
U. S. Steel - Global Raw Materials Integration
Control over key raw materials
0
20
40
60
80
100
Coal '08
Coal '09
Coke '08
Coke '09
Iron Ore '08
Iron Ore '09
Percent controlled – Production – Contract (volume & price)
Contract Own make
Estimated annual global requirements:• Coking Coal – 12.5mnt• Coke – 12mnt• Iron Ore – 37.5mnt
• Second largest NA iron ore producerproduced 21 mmnt in 2007reserves 849 mmnt
• Iron ore/coal mines and coke production located close to steel operations or supported by cost competitive transportation facilities
• Produced 7.3 mmnt of coke in 2007
• International coke and coal prices are high and volatile
• Exploring additional raw material integration opportunities

15
MSCI Flat Rolled Inventory
Source: MSCI, U.S. Dept of Customs and Purchasing Magazine
January 2004 – March 2008
6,000
7,000
8,000
9,000
10,000
11,000
Jan-
04
Apr
-04
Jul-0
4
Oct
-04
Jan-
05
Apr
-05
Jul-0
5
Oct
-05
Jan-
06
Apr
-06
Jul-0
6
Oct
-06
Jan-
07
Apr
-07
Jul-0
7
Oct
-07
Jan-
08
400
650
900
1,150
1,400
Sheet Inventory Sheet Imports
$402
$740
$510$655
$580
$575
$630
$550
$425
CRU price
Shee
t Inv
ento
ry ‘0
00 to
ns Sheet Impor ts ‘000 t ons
$565
$520$760

16
$0
$100
$200
$300
$400
$500
$600
$700
1Q'02
2Q'08
1Q'02
2Q'08
1Q'02
2Q'08
Raw Materials Energy Labor
Raw Material Cost - Impact on hot rolled band costs
Source: J.P. Morgan and company estimate
Raw material cost inflation has leveled the playing field – HRB cash cost $/ton
China & other low-labor cost steelProducing countries
US flat-rolled mini-mill steelproducers
NA integrated steel producers
66% 78%
15%19%
15%
7%
13%
78%
24%24%
52%
41%
51%
8%
9%17%
13%
73%
$190
$599
$204
$557
$270
$516

17
• Maintain strong capital structure
• Focused capital spending plan
• Responsible capital allocation
• Remain shareholder focused
Designed to improve shareholder value
Capital Allocation – Building Value
To grow responsibly while generating a competitive return on capital and meeting our financial and stakeholder obligations

18
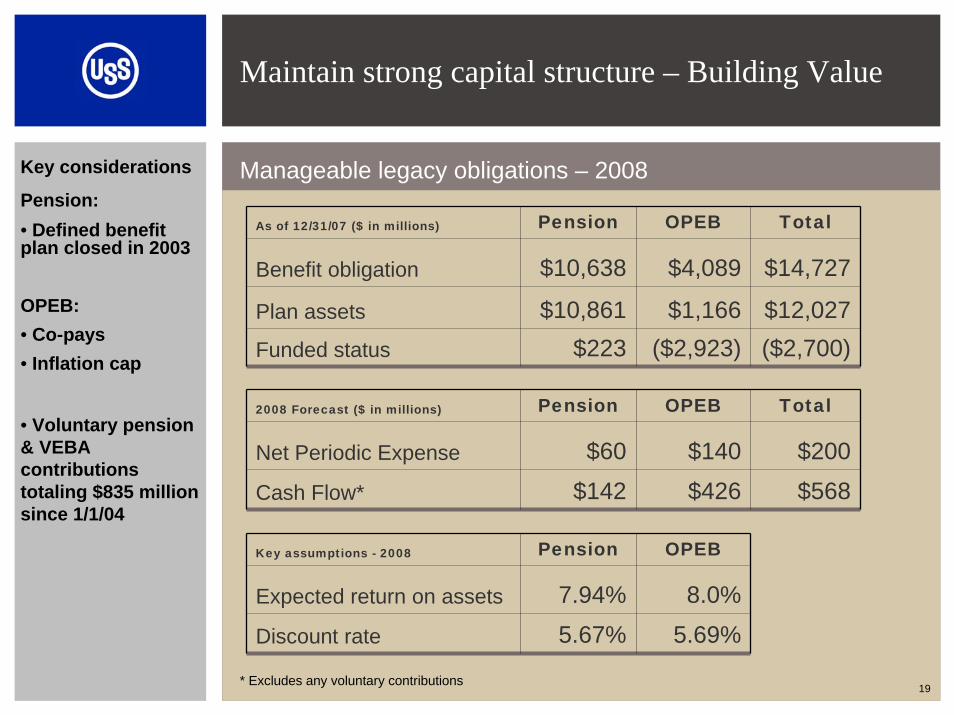
Maintain strong capital structure – Building Value
LTM 1Q’07
Since1/1/04As of ($ in millions)
Cash Provided by Operations
Capital Spending
Voluntary Pension & OPEB Funding
Dividends PaidIncreased 400% since 1/05*
Stock Repurchases**
Millions of shares repurchased
$6,267
$2,751
$870
$301
$849
14.6
* Dividend increased to $0.25/quarter effective with 3/10/08 payment
** Repurchase program initially authorized 7/05
Balanced approach to capital allocation
As of 4/1/08, 6.2 million shares remaining under current repurchase authorization
$1,644
$708
$140
$100
$124
1.2
19
Maintain strong capital structure – Building Value
Manageable legacy obligations – 2008
As of 12/31/07 ($ in millions) Pension OPEB
$10,638 $4,089
$1,166($2,923)
$10,861$223
Total
Benefit obligation $14,727
$12,027Funded status ($2,700)Plan assets
2008 Forecast ($ in millions) Pension OPEB Total
Net Periodic Expense $60 $140
$142 $426
$200
Cash Flow* $568
* Excludes any voluntary contributions
Key assumptions - 2008 Pension OPEB
Expected return on assets 7.94% 8.0%
5.67% 5.69%Discount rate
Key considerations
Pension:• Defined benefit plan closed in 2003
OPEB:• Co-pays• Inflation cap
• Voluntary pension & VEBA contributions totaling $835 million since 1/1/04

20
Capital Spending – Building Value
2004 – 2006 Average CapEx per ton shipped
Source: Accenture
$15
$31
$49
$95
$0$10
$20$30$40
$50$60$70$80
$90$100
Nuc
or
AKS
US
S
Liaw
u
Cor
us
Arce
lor -
Mitt
al
Evra
z
MN
K
Ger
dau
Ave
rage
Nip
pon
JFE
Thys
sen
CS
N
Val
in
Bao
Tata
*
Pos
co
Sev
erst
al
Cap
expe
r ton
* Estimated, pending 2006 final data
U.S. Steel has spent less than global peers in recent years
Will likely incur higher capex during next few years concentrated on infrastructure, but will likely remain below the global average.

21
• Strong business climate
• Improving industry and relatively low valuation
• Favorable North American environment
• Building value:Maintain strong capital structureEvaluate growth opportunitiesImproving infrastructure and product mixResponsible capital allocationRemain shareholder focused
Investment considerations
Making Steel - World Competitive - Building Value