Embed Size (px)
Citation preview
Please refer to important disclosures at the end of this report 1
Consolidated (Rs cr) 1QFY11 1QFY10 % chg (yoy) 4QFY10 % chg (qoq)
Net Sales 1,905 1,442 32 2,028 (6.1)
Operating Profit 186 87 113 301 (38.2)
OPM (%) 9.8 6.1 370bp 14.9 (508)bp
OPM excl. forex (%) 10.0 6.0 399bp 12.3 (232)bp
Reported PAT 60 11 439 142 (58.0)
Source: Company, Angel Research
Mother Sumi Systems (MSSL) reported substantial jump in top-line and bottom-line, though came in below our expectations. This is largely owing to contraction in qoq margins. However, we largely maintain our estimates as management indicated that, the impact of the currency movements and input costs would gradually be passed on to the customers over the next few quarters. Thus, we recommend accumulate the stock on every correction.
Consolidated results below expectations: MSSL registered 32% yoy growth in net sales to Rs1,905cr (Rs1,442cr) on a consolidated basis, which was below our expectation. On the operating front, the company reported 370bp yoy increase in EBITDA margins to 9.8%, but lower than our expectation of 11.6%. Adverse foreign currency fluctuation and increase in input cost impacted margins. Thus, net profit for the quarter came in below our expectation at Rs60cr, largely on lower-than-expected top-line growth and operating margins. Higher tax rate also restricted net profit growth. Outlook and Valuation: We estimate the company to clock consolidated EPS of Rs8.8 for FY2011E and Rs11.2 for FY2012E. At the CMP of Rs176, the stock is trading 15.8x FY2012E consolidated earnings (fully diluted). We maintain Accumulate rating on the stock, with a Target Price of Rs188, at which level the stock would trade at 16.8x FY2012E earnings. We are valuing the company at 5% premium to its historical average of 16x due to estimated higher business RoEs in FY2011-12E. We believe that the recovery in the overseas operations will help the stock in generating higher returns over the next 2-3 years. Further, consistent and strong execution track record of the company implies further scope of re-rating of the stock.
Key Financials (Consolidated)
Y/E March (Rs cr) FY2009 FY2010 FY2011E FY2012E
Net Sales (includes otr. op. inc.) 2,640 6,924 8,090 9,402
% chg 28.7 162.3 16.8 16.2
Net Profit 175 241 340 432
% chg 10.3 37.8 40.7 27.3
OPM (%) 10.9 8.2 10.6 10.9
EPS (Rs) 4.9 6.4 8.8 11.2
P/E (x) 35.7 27.3 20.1 15.8
P/BV (x) 8.0 5.7 5.2 4.7
RoE (%) 26.6 24.8 27.3 31.1
RoCE (%) 11.8 14.1 24.4 30.3
EV/Sales (x) 2.4 1.0 0.8 0.7
EV/EBITDA (x) 23.5 12.1 7.9 6.6
Source: Company, Angel Research
ACCUMULATE CMP Rs176 Target Price Rs188
Investment Period 12 Months Stock Info
Sector
Bloomberg Code MSS@IN
Shareholding Pattern (%)
Promoters 65.2
MF / Banks / Indian Fls 17.6
FII / NRIs / OCBs 8.7
Indian Public / Others 8.5
Abs. (%) 3m 1yr 3yr
Sensex 5.1 20.3 21.6
MSSL 31.9 140.3 104.6
1
18,074
5,416
MOSS.BO
6,803
0.7
184/72
118,716
Auto Ancillary
Avg. Daily Volume
Market Cap (Rs cr)
Beta
52 Week High / Low
Face Value (Rs)
BSE Sensex
Nifty
Reuters Code
Vaishali Jajoo 022-4040 3800 Ext: 344
Yaresh Kothari 022-4040 3800 Ext: 313 [email protected]
Motherson Sumi Systems Performance Highlights
1QFY2011 Result Update | Auto Ancillary
August 12, 2010
Motherson Sumi Systems | 1QFY2011 Result Update
August 12, 2010 2
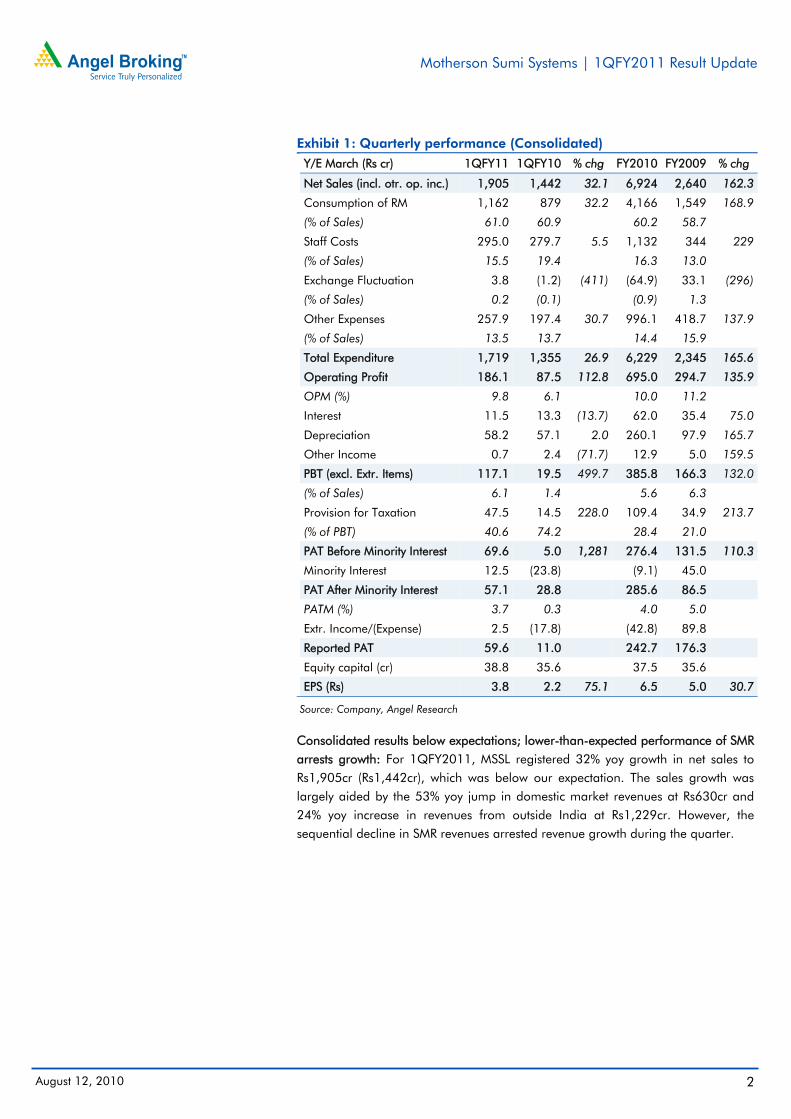
Exhibit 1: Quarterly performance (Consolidated) Y/E March (Rs cr) 1QFY11 1QFY10 % chg FY2010 FY2009 % chg
Net Sales (incl. otr. op. inc.) 1,905 1,442 32.1 6,924 2,640 162.3
Consumption of RM 1,162 879 32.2 4,166 1,549 168.9
(% of Sales) 61.0 60.9
60.2 58.7
Staff Costs 295.0 279.7 5.5 1,132 344 229
(% of Sales) 15.5 19.4
16.3 13.0
Exchange Fluctuation 3.8 (1.2) (411) (64.9) 33.1 (296)
(% of Sales) 0.2 (0.1)
(0.9) 1.3
Other Expenses 257.9 197.4 30.7 996.1 418.7 137.9
(% of Sales) 13.5 13.7
14.4 15.9
Total Expenditure 1,719 1,355 26.9 6,229 2,345 165.6
Operating Profit 186.1 87.5 112.8 695.0 294.7 135.9
OPM (%) 9.8 6.1
10.0 11.2
Interest 11.5 13.3 (13.7) 62.0 35.4 75.0
Depreciation 58.2 57.1 2.0 260.1 97.9 165.7
Other Income 0.7 2.4 (71.7) 12.9 5.0 159.5
PBT (excl. Extr. Items) 117.1 19.5 499.7 385.8 166.3 132.0
(% of Sales) 6.1 1.4
5.6 6.3
Provision for Taxation 47.5 14.5 228.0 109.4 34.9 213.7
(% of PBT) 40.6 74.2
28.4 21.0
PAT Before Minority Interest 69.6 5.0 1,281 276.4 131.5 110.3
Minority Interest 12.5 (23.8)
(9.1) 45.0
PAT After Minority Interest 57.1 28.8
285.6 86.5
PATM (%) 3.7 0.3
4.0 5.0
Extr. Income/(Expense) 2.5 (17.8)
(42.8) 89.8
Reported PAT 59.6 11.0
242.7 176.3
Equity capital (cr) 38.8 35.6
37.5 35.6
EPS (Rs) 3.8 2.2 75.1 6.5 5.0 30.7
Source: Company, Angel Research
Consolidated results below expectations; lower-than-expected performance of SMR arrests growth: For 1QFY2011, MSSL registered 32% yoy growth in net sales to Rs1,905cr (Rs1,442cr), which was below our expectation. The sales growth was largely aided by the 53% yoy jump in domestic market revenues at Rs630cr and 24% yoy increase in revenues from outside India at Rs1,229cr. However, the sequential decline in SMR revenues arrested revenue growth during the quarter.
Motherson Sumi Systems | 1QFY2011 Result Update
August 12, 2010 3
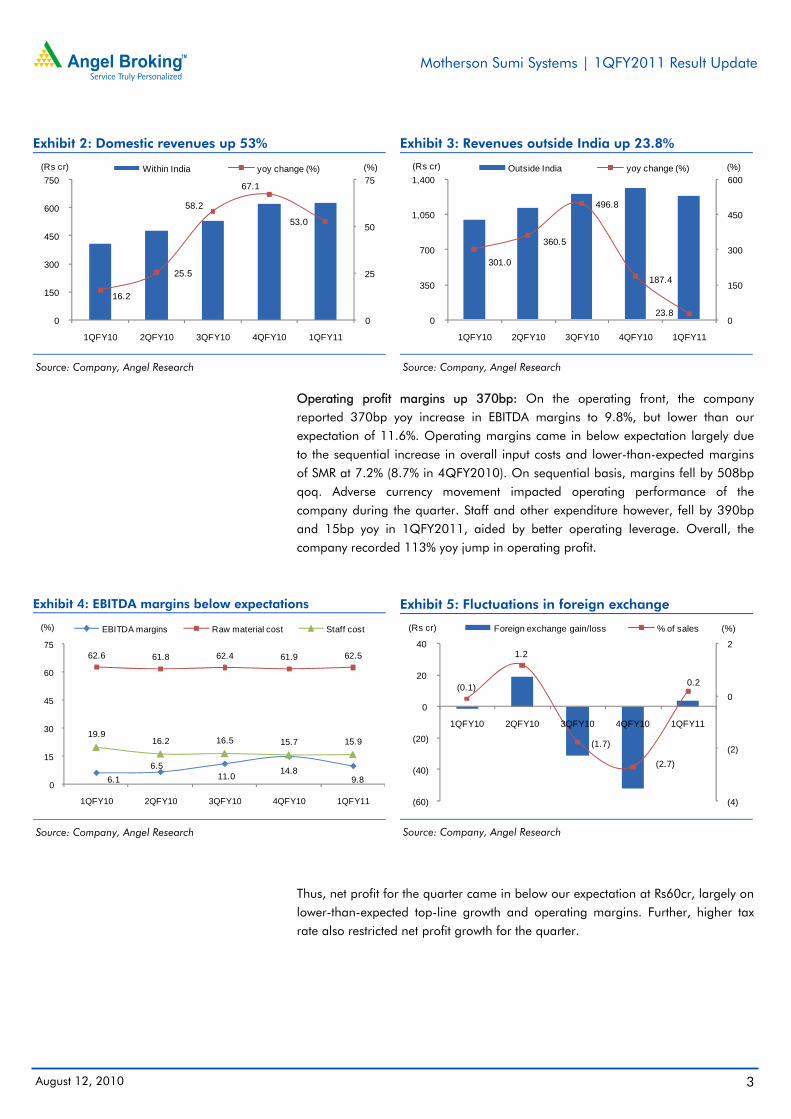
Exhibit 2: Domestic revenues up 53%
Source: Company, Angel Research
Exhibit 3: Revenues outside India up 23.8%
Source: Company, Angel Research
Operating profit margins up 370bp: On the operating front, the company reported 370bp yoy increase in EBITDA margins to 9.8%, but lower than our expectation of 11.6%. Operating margins came in below expectation largely due to the sequential increase in overall input costs and lower-than-expected margins of SMR at 7.2% (8.7% in 4QFY2010). On sequential basis, margins fell by 508bp qoq. Adverse currency movement impacted operating performance of the company during the quarter. Staff and other expenditure however, fell by 390bp and 15bp yoy in 1QFY2011, aided by better operating leverage. Overall, the company recorded 113% yoy jump in operating profit.
Exhibit 4: EBITDA margins below expectations
Source: Company, Angel Research
Exhibit 5: Fluctuations in foreign exchange
Source: Company, Angel Research
Thus, net profit for the quarter came in below our expectation at Rs60cr, largely on lower-than-expected top-line growth and operating margins. Further, higher tax rate also restricted net profit growth for the quarter.
16.2
25.5
58.2
67.1
53.0
0
25
50
75
0
150
300
450
600
750
1QFY10 2QFY10 3QFY10 4QFY10 1QFY11
(%)(Rs cr) Within India yoy change (%)
301.0
360.5
496.8
187.4
23.8 0
150
300
450
600
0
350
700
1,050
1,400
1QFY10 2QFY10 3QFY10 4QFY10 1QFY11
(%)(Rs cr) Outside India yoy change (%)
6.1 6.5
11.0 14.8 9.8
62.6 61.8 62.4 61.9 62.5
19.9 16.2 16.5 15.7 15.9
0
15
30
45
60
75
1QFY10 2QFY10 3QFY10 4QFY10 1QFY11
(%) EBITDA margins Raw material cost Staff cost
(0.1)
1.2
(1.7)
(2.7)
0.2
(4)
(2)
0
2
(60)
(40)
(20)
0
20
40
1QFY10 2QFY10 3QFY10 4QFY10 1QFY11
(%)(Rs cr) Foreign exchange gain/loss % of sales
Motherson Sumi Systems | 1QFY2011 Result Update
August 12, 2010 4
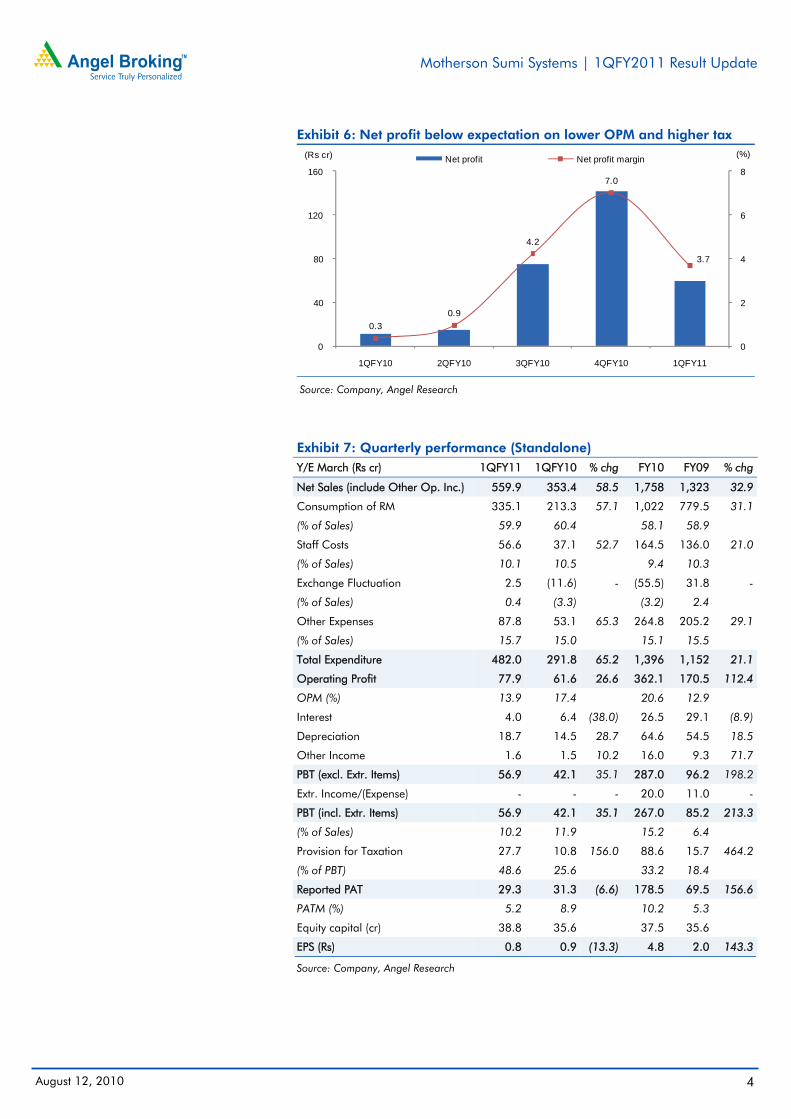
Exhibit 6: Net profit below expectation on lower OPM and higher tax
Source: Company, Angel Research
Exhibit 7: Quarterly performance (Standalone) Y/E March (Rs cr) 1QFY11 1QFY10 % chg FY10 FY09 % chg
Net Sales (include Other Op. Inc.) 559.9 353.4 58.5 1,758 1,323 32.9
Consumption of RM 335.1 213.3 57.1 1,022 779.5 31.1
(% of Sales) 59.9 60.4 58.1 58.9 Staff Costs 56.6 37.1 52.7 164.5 136.0 21.0
(% of Sales) 10.1 10.5 9.4 10.3 Exchange Fluctuation 2.5 (11.6) - (55.5) 31.8 -
(% of Sales) 0.4 (3.3) (3.2) 2.4 Other Expenses 87.8 53.1 65.3 264.8 205.2 29.1
(% of Sales) 15.7 15.0 15.1 15.5 Total Expenditure 482.0 291.8 65.2 1,396 1,152 21.1
Operating Profit 77.9 61.6 26.6 362.1 170.5 112.4
OPM (%) 13.9 17.4 20.6 12.9 Interest 4.0 6.4 (38.0) 26.5 29.1 (8.9)
Depreciation 18.7 14.5 28.7 64.6 54.5 18.5
Other Income 1.6 1.5 10.2 16.0 9.3 71.7
PBT (excl. Extr. Items) 56.9 42.1 35.1 287.0 96.2 198.2
Extr. Income/(Expense) - - - 20.0 11.0 -
PBT (incl. Extr. Items) 56.9 42.1 35.1 267.0 85.2 213.3
(% of Sales) 10.2 11.9 15.2 6.4 Provision for Taxation 27.7 10.8 156.0 88.6 15.7 464.2
(% of PBT) 48.6 25.6 33.2 18.4 Reported PAT 29.3 31.3 (6.6) 178.5 69.5 156.6
PATM (%) 5.2 8.9 10.2 5.3 Equity capital (cr) 38.8 35.6 37.5 35.6 EPS (Rs) 0.8 0.9 (13.3) 4.8 2.0 143.3
Source: Company, Angel Research
0.3 0.9
4.2
7.0
3.7
0
2
4
6
8
0
40
80
120
160
1QFY10 2QFY10 3QFY10 4QFY10 1QFY11
(%)(Rs cr) Net profit Net profit margin
Motherson Sumi Systems | 1QFY2011 Result Update
August 12, 2010 5
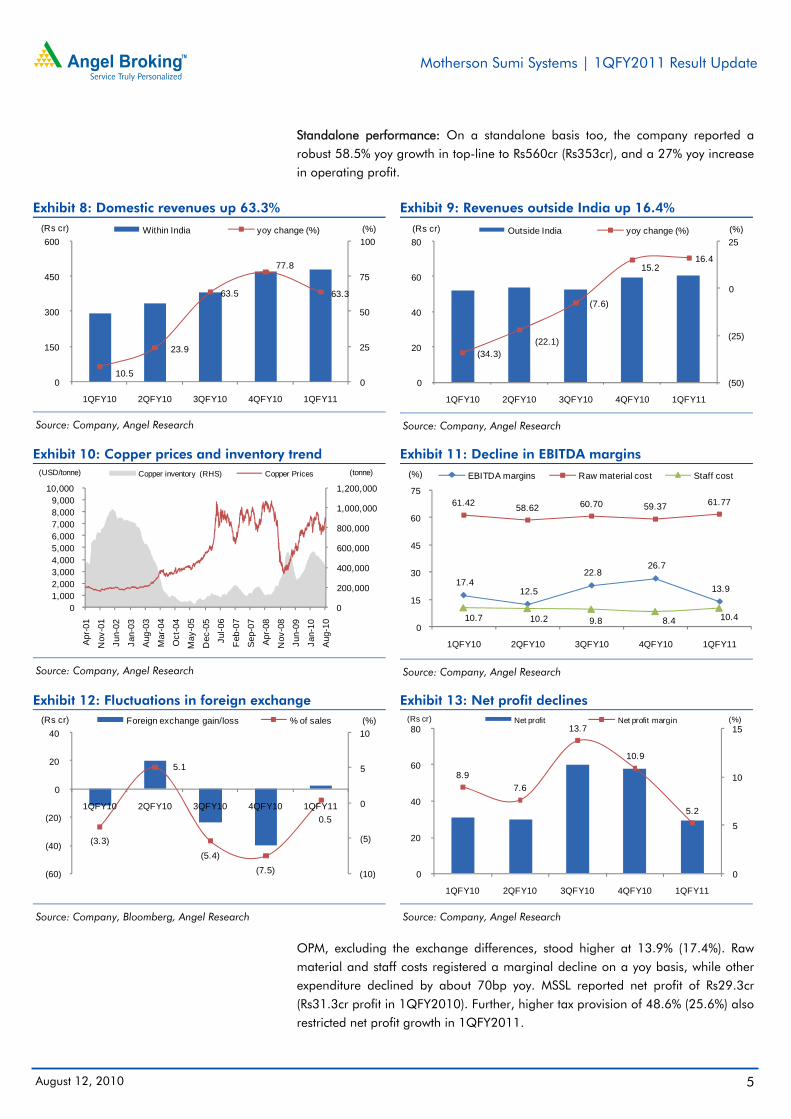
Standalone performance: On a standalone basis too, the company reported a robust 58.5% yoy growth in top-line to Rs560cr (Rs353cr), and a 27% yoy increase in operating profit.
Exhibit 8: Domestic revenues up 63.3%
Source: Company, Angel Research
Exhibit 9: Revenues outside India up 16.4%
Source: Company, Angel Research
Exhibit 10: Copper prices and inventory trend
Source: Company, Angel Research
Exhibit 11: Decline in EBITDA margins
Source: Company, Angel Research
Exhibit 12: Fluctuations in foreign exchange
Source: Company, Bloomberg, Angel Research
Exhibit 13: Net profit declines
Source: Company, Angel Research
OPM, excluding the exchange differences, stood higher at 13.9% (17.4%). Raw material and staff costs registered a marginal decline on a yoy basis, while other expenditure declined by about 70bp yoy. MSSL reported net profit of Rs29.3cr (Rs31.3cr profit in 1QFY2010). Further, higher tax provision of 48.6% (25.6%) also restricted net profit growth in 1QFY2011.
10.5
23.9
63.5
77.8
63.3
0
25
50
75
100
0
150
300
450
600
1QFY10 2QFY10 3QFY10 4QFY10 1QFY11
(%)(Rs cr) Within India yoy change (%)
(34.3)(22.1)
(7.6)
15.2 16.4
(50)
(25)
0
25
0
20
40
60
80
1QFY10 2QFY10 3QFY10 4QFY10 1QFY11
(%)(Rs cr) Outside India yoy change (%)
0
200,000
400,000
600,000
800,000
1,000,000
1,200,000
01,0002,0003,0004,0005,0006,0007,0008,0009,000
10,000
Apr
-01
Nov
-01
Jun-
02
Jan-
03
Aug
-03
Mar
-04
Oct
-04
May
-05
Dec
-05
Jul-0
6
Feb-
07
Sep
-07
Apr
-08
Nov
-08
Jun-
09
Jan-
10
Aug
-10
Copper inventory (RHS) Copper Prices(USD/tonne) (tonne)
17.4 12.5
22.8 26.7
13.9
61.42 58.62 60.70 59.37 61.77
10.7 10.2 9.8 8.4 10.4 0
15
30
45
60
75
1QFY10 2QFY10 3QFY10 4QFY10 1QFY11
(%) EBITDA margins Raw material cost Staff cost
(3.3)
5.1
(5.4)(7.5)
0.5
(10)
(5)
0
5
10
(60)
(40)
(20)
0
20
40
1QFY10 2QFY10 3QFY10 4QFY10 1QFY11
(%)(Rs cr) Foreign exchange gain/loss % of sales
8.9 7.6
13.7
10.9
5.2
0
5
10
15
0
20
40
60
80
1QFY10 2QFY10 3QFY10 4QFY10 1QFY11
(%)(Rs cr) Net profit Net profit margin
Motherson Sumi Systems | 1QFY2011 Result Update
August 12, 2010 6
Segment-wise performance
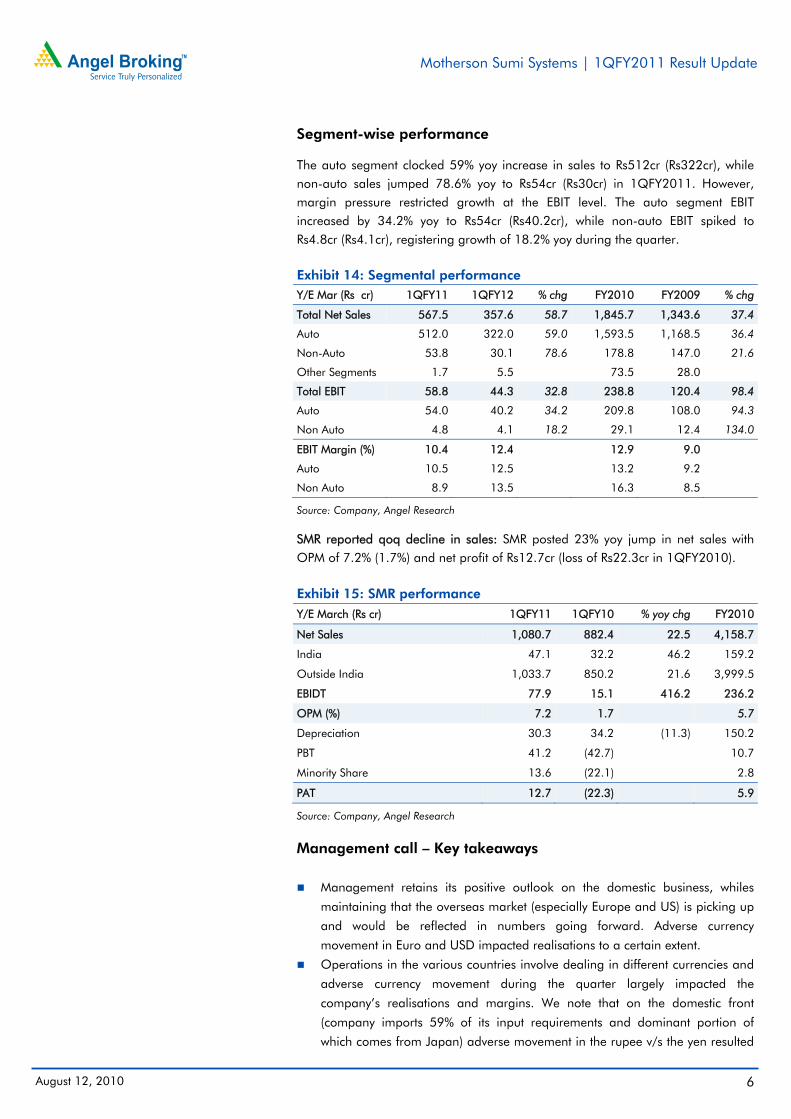
The auto segment clocked 59% yoy increase in sales to Rs512cr (Rs322cr), while non-auto sales jumped 78.6% yoy to Rs54cr (Rs30cr) in 1QFY2011. However, margin pressure restricted growth at the EBIT level. The auto segment EBIT increased by 34.2% yoy to Rs54cr (Rs40.2cr), while non-auto EBIT spiked to Rs4.8cr (Rs4.1cr), registering growth of 18.2% yoy during the quarter. Exhibit 14: Segmental performance
Y/E Mar (Rs cr) 1QFY11 1QFY12 % chg FY2010 FY2009 % chg
Total Net Sales 567.5 357.6 58.7 1,845.7 1,343.6 37.4
Auto 512.0 322.0 59.0 1,593.5 1,168.5 36.4
Non-Auto 53.8 30.1 78.6 178.8 147.0 21.6
Other Segments 1.7 5.5 73.5 28.0 Total EBIT 58.8 44.3 32.8 238.8 120.4 98.4
Auto 54.0 40.2 34.2 209.8 108.0 94.3
Non Auto 4.8 4.1 18.2 29.1 12.4 134.0
EBIT Margin (%) 10.4 12.4 12.9 9.0 Auto 10.5 12.5 13.2 9.2 Non Auto 8.9 13.5 16.3 8.5 Source: Company, Angel Research
SMR reported qoq decline in sales: SMR posted 23% yoy jump in net sales with OPM of 7.2% (1.7%) and net profit of Rs12.7cr (loss of Rs22.3cr in 1QFY2010). Exhibit 15: SMR performance
Y/E March (Rs cr) 1QFY11 1QFY10 % yoy chg FY2010
Net Sales 1,080.7 882.4 22.5 4,158.7
India 47.1 32.2 46.2 159.2
Outside India 1,033.7 850.2 21.6 3,999.5
EBIDT 77.9 15.1 416.2 236.2
OPM (%) 7.2 1.7 5.7
Depreciation 30.3 34.2 (11.3) 150.2
PBT 41.2 (42.7) 10.7
Minority Share 13.6 (22.1) 2.8
PAT 12.7 (22.3) 5.9
Source: Company, Angel Research Management call – Key takeaways
Management retains its positive outlook on the domestic business, whiles
maintaining that the overseas market (especially Europe and US) is picking up
and would be reflected in numbers going forward. Adverse currency
movement in Euro and USD impacted realisations to a certain extent.
Operations in the various countries involve dealing in different currencies and
adverse currency movement during the quarter largely impacted the
company’s realisations and margins. We note that on the domestic front
(company imports 59% of its input requirements and dominant portion of
which comes from Japan) adverse movement in the rupee v/s the yen resulted
Motherson Sumi Systems | 1QFY2011 Result Update
August 12, 2010 7
in an increase in the raw material costs to a certain extent and overall increase
in copper price, which overall impacted the wiring harness business. This is
usually passed on with a lag effect.
Better working capital cycle helped the company generate strong cash flows
during the quarter. Net debt (excluding FCCB’s) as on June 30, 2010 stood at
Rs358cr.
Deferred tax on FCCB conversion and Turnaround of few subsidiaries resulted
in higher tax provisioning for the quarter.
SMR received orders for the supply of mirrors worth approximately Euro
700mn to be supplied over the life of the new models to be launched in 2011.
With the overall scenario improving in Europe and other countries, the
company is hoping to receive such orders going forward.
MSSL has been in the process of restructuring the assets acquired through SMR
and registered a turnaround in FY2010. SMR can exhibit a seasonal
performance in 2QFY2011 (holidays in European countries).
The company keeps its target of achieving 8-10% EBITDA margin for FY2011
on the SMR front. The company stands by its resolve to improve EBITDA and to
generate a decent RoCE.
Investment Arguments
Maintaining leadership position: MSSL is a leader in wire harnessing,
controlling over 65% of the domestic passenger vehicle (PV) market and
around 48% market share in the domestic rear view mirror market. The
company is now focusing on supply of higher level assemblies and modules
(the company is a key supplier for the recently launched Ford Figo), where
margins are comparatively higher. MSSL is also increasing its content per car
in a bid to diversify its product portfolio. The company is laying emphasis on
its global product plan (GPP) where it is looking at setting up joint ventures
with leading Tier-I suppliers to upgrade its technology base and bolster its
clientele as well.
SMR turns positive at PAT level in FY2010: During FY2009, MSSL acquired a
global company in the business of rear view mirrors from Visiocorp PLC, now
known as Samvardhana Motherson Reflectec (SMR). Post the recent
acquisition, the company now controls around 25% of the global Rear View
Mirror market. SMR has shown a substantial expansion in margins in the last
2-3 quarters and has bagged potential orders of about Euro 700mn to be
supplied over the life of the new models that would be launched in 2011.
MSSL is gradually progressing towards achieving its target of around 8%
EBITDA in FY2011E, at the SMR front. The company stands by its resolve to
improve EBITDA and generate good RoCE.
Motherson Sumi Systems | 1QFY2011 Result Update
August 12, 2010 8
Exhibit 16: Five year milestone set in FY2000
Source: Company, Angel Research
Exhibit 17: Five year milestone set in FY2005
Source: Company, Angel Research
Exhibit 18: Company milestones for FY2015
Source: Company, Angel Research
Outlook and Valuation
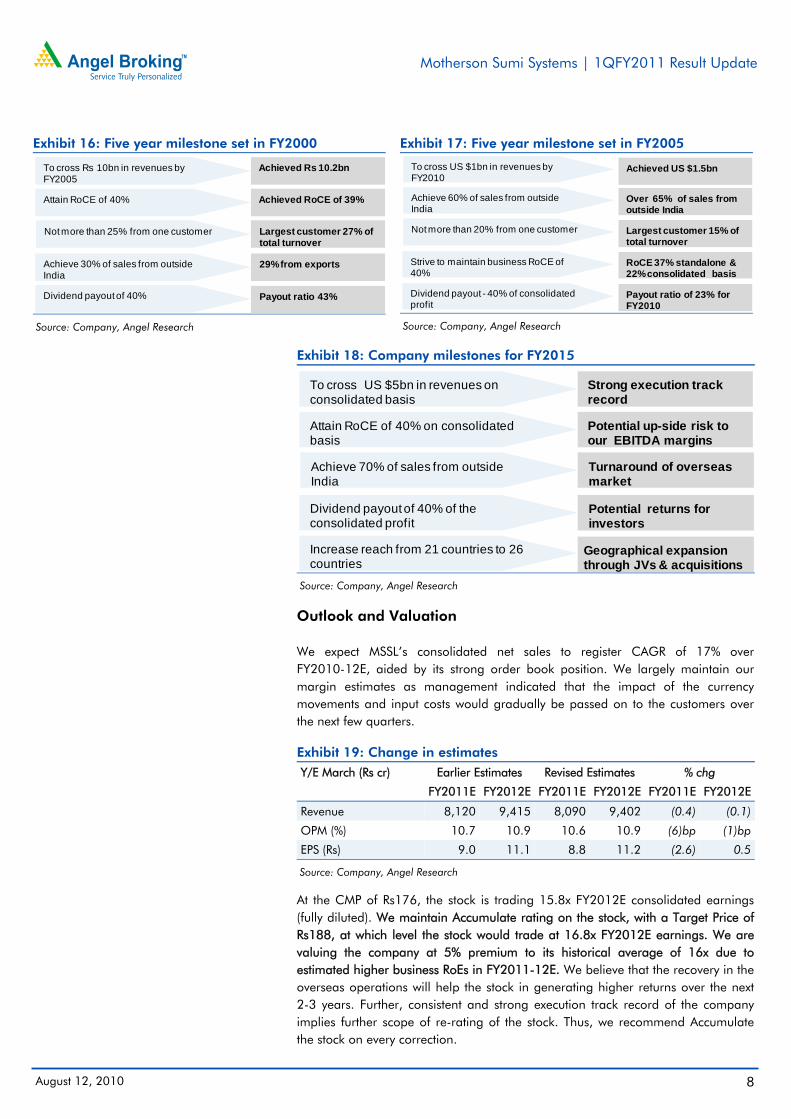
We expect MSSL’s consolidated net sales to register CAGR of 17% over FY2010-12E, aided by its strong order book position. We largely maintain our margin estimates as management indicated that the impact of the currency movements and input costs would gradually be passed on to the customers over the next few quarters.
Exhibit 19: Change in estimates Y/E March (Rs cr) Earlier Estimates Revised Estimates % chg
FY2011E FY2012E FY2011E FY2012E FY2011E FY2012E
Revenue 8,120 9,415 8,090 9,402 (0.4) (0.1)
OPM (%) 10.7 10.9 10.6 10.9 (6)bp (1)bp
EPS (Rs) 9.0 11.1 8.8 11.2 (2.6) 0.5
Source: Company, Angel Research
At the CMP of Rs176, the stock is trading 15.8x FY2012E consolidated earnings (fully diluted). We maintain Accumulate rating on the stock, with a Target Price of Rs188, at which level the stock would trade at 16.8x FY2012E earnings. We are valuing the company at 5% premium to its historical average of 16x due to estimated higher business RoEs in FY2011-12E. We believe that the recovery in the overseas operations will help the stock in generating higher returns over the next 2-3 years. Further, consistent and strong execution track record of the company implies further scope of re-rating of the stock. Thus, we recommend Accumulate the stock on every correction.
Not more than 25% from one customer Largest customer 27% of total turnover
Achieve 30% of sales from outside India
29% from exports
Dividend payout of 40% Payout ratio 43%
To cross Rs 10bn in revenues by FY2005
Achieved Rs 10.2bn
Attain RoCE of 40% Achieved RoCE of 39%
Largest customer 15% of total turnover
To cross US $1bn in revenues by FY2010
Achieved US $1.5bn
Achieve 60% of sales from outside India
Over 65% of sales from outside India
Not more than 20% from one customer
Strive to maintain business RoCE of 40%
RoCE 37% standalone & 22% consolidated basis
Dividend payout - 40% of consolidated profit
Payout ratio of 23% for FY2010
Achieve 70% of sales from outside India
Turnaround of overseas market
Dividend payout of 40% of the consolidated profit
Potential returns for investors
Increase reach from 21 countries to 26 countries
Geographical expansion through JVs & acquisitions
To cross US $5bn in revenues on consolidated basis
Strong execution track record
Attain RoCE of 40% on consolidated basis
Potential up-side risk to our EBITDA margins
Motherson Sumi Systems | 1QFY2011 Result Update
August 12, 2010 9
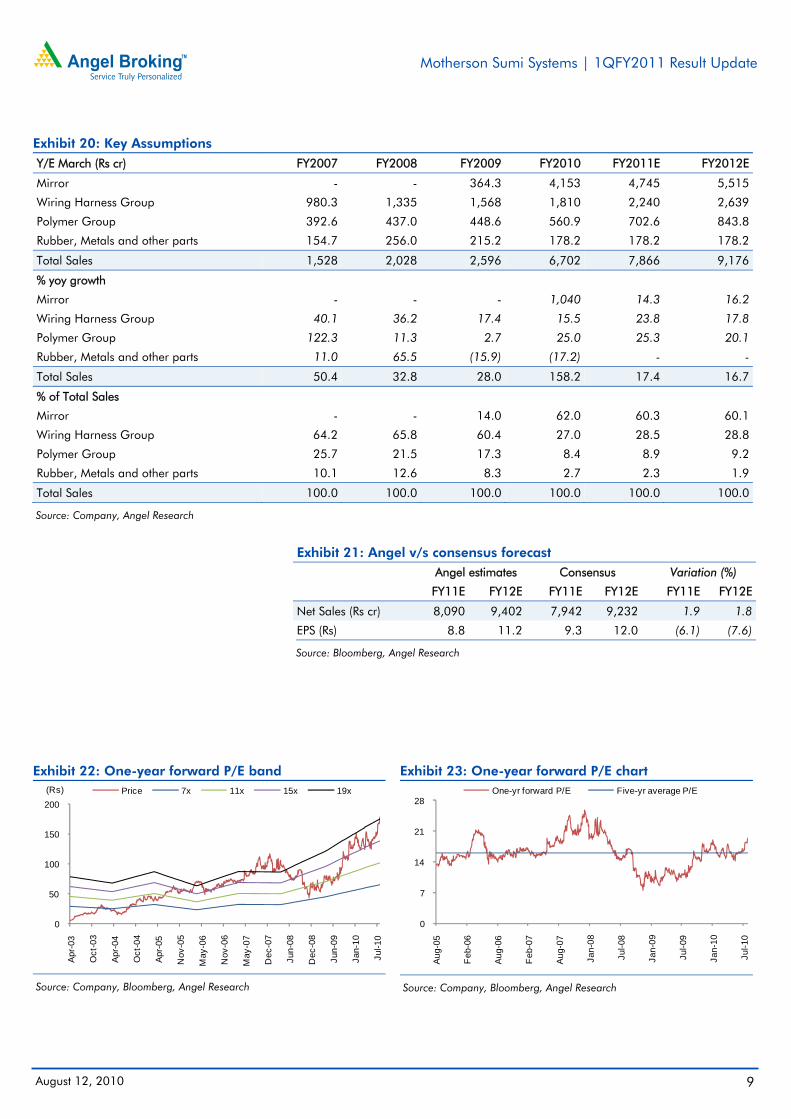
Exhibit 20: Key Assumptions Y/E March (Rs cr) FY2007 FY2008 FY2009 FY2010 FY2011E FY2012E
Mirror - - 364.3 4,153 4,745 5,515
Wiring Harness Group 980.3 1,335 1,568 1,810 2,240 2,639
Polymer Group 392.6 437.0 448.6 560.9 702.6 843.8
Rubber, Metals and other parts 154.7 256.0 215.2 178.2 178.2 178.2
Total Sales 1,528 2,028 2,596 6,702 7,866 9,176
% yoy growth
Mirror - - - 1,040 14.3 16.2
Wiring Harness Group 40.1 36.2 17.4 15.5 23.8 17.8
Polymer Group 122.3 11.3 2.7 25.0 25.3 20.1
Rubber, Metals and other parts 11.0 65.5 (15.9) (17.2) - -
Total Sales 50.4 32.8 28.0 158.2 17.4 16.7
% of Total Sales
Mirror - - 14.0 62.0 60.3 60.1
Wiring Harness Group 64.2 65.8 60.4 27.0 28.5 28.8
Polymer Group 25.7 21.5 17.3 8.4 8.9 9.2
Rubber, Metals and other parts 10.1 12.6 8.3 2.7 2.3 1.9
Total Sales 100.0 100.0 100.0 100.0 100.0 100.0
Source: Company, Angel Research
Exhibit 21: Angel v/s consensus forecast
Angel estimates Consensus Variation (%)
FY11E FY12E FY11E FY12E FY11E FY12E
Net Sales (Rs cr) 8,090 9,402 7,942 9,232 1.9 1.8
EPS (Rs) 8.8 11.2 9.3 12.0 (6.1) (7.6)
Source: Bloomberg, Angel Research
Exhibit 22: One-year forward P/E band
Source: Company, Bloomberg, Angel Research
Exhibit 23: One-year forward P/E chart
Source: Company, Bloomberg, Angel Research
0
50
100
150
200
Apr-
03
Oct
-03
Apr-
04
Oct
-04
Apr-
05
Nov
-05
May
-06
Nov
-06
May
-07
Dec
-07
Jun-
08
Dec
-08
Jun-
09
Jan-
10
Jul-1
0
(Rs) Price 7x 11x 15x 19x
0
7
14
21
28
Aug-
05
Feb
-06
Aug-
06
Feb
-07
Aug-
07
Jan-
08
Jul-0
8
Jan-
09
Jul-0
9
Jan-
10
Jul-1
0
One-yr forward P/E Five-yr average P/E
Motherson Sumi Systems | 1QFY2011 Result Update
August 12, 2010 10
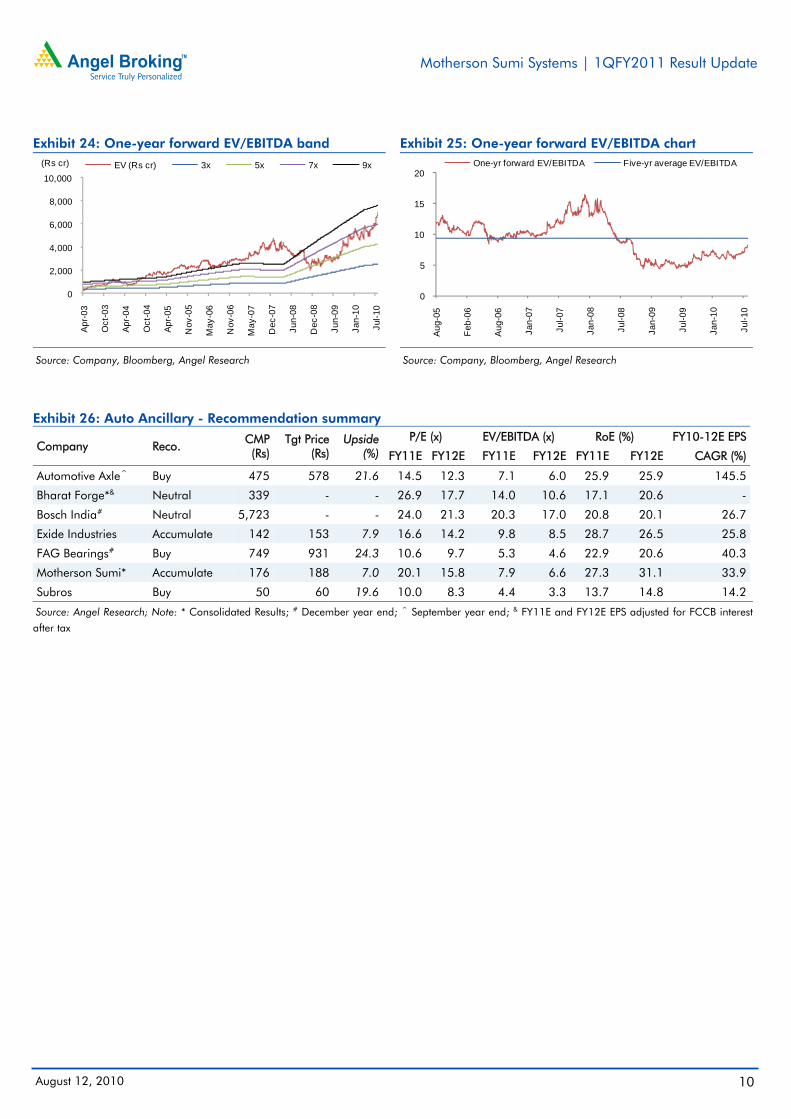
Exhibit 24: One-year forward EV/EBITDA band
Source: Company, Bloomberg, Angel Research
Exhibit 25: One-year forward EV/EBITDA chart
Source: Company, Bloomberg, Angel Research
Exhibit 26: Auto Ancillary - Recommendation summary
Company Reco. CMP (Rs)
Tgt Price (Rs)
Upside (%)
P/E (x) EV/EBITDA (x) RoE (%) FY10-12E EPS
FY11E FY12E FY11E FY12E FY11E FY12E CAGR (%)
Automotive Axle^ Buy 475 578 21.6 14.5 12.3 7.1 6.0 25.9 25.9 145.5
Bharat Forge*& Neutral 339 - - 26.9 17.7 14.0 10.6 17.1 20.6 -
Bosch India# Neutral 5,723 - - 24.0 21.3 20.3 17.0 20.8 20.1 26.7
Exide Industries Accumulate 142 153 7.9 16.6 14.2 9.8 8.5 28.7 26.5 25.8
FAG Bearings# Buy 749 931 24.3 10.6 9.7 5.3 4.6 22.9 20.6 40.3
Motherson Sumi* Accumulate 176 188 7.0 20.1 15.8 7.9 6.6 27.3 31.1 33.9
Subros Buy 50 60 19.6 10.0 8.3 4.4 3.3 13.7 14.8 14.2
Source: Angel Research; Note: * Consolidated Results; # December year end; ^ September year end; & FY11E and FY12E EPS adjusted for FCCB interest
after tax
0
2,000
4,000
6,000
8,000
10,000
Apr
-03
Oct
-03
Apr
-04
Oct
-04
Apr
-05
Nov
-05
May
-06
Nov
-06
May
-07
Dec
-07
Jun-
08
Dec
-08
Jun-
09
Jan-
10
Jul-1
0
(Rs cr) EV (Rs cr) 3x 5x 7x 9x
0
5
10
15
20
Aug-
05
Feb
-06
Aug-
06
Jan-
07
Jul-0
7
Jan-
08
Jul-0
8
Jan-
09
Jul-0
9
Jan-
10
Jul-1
0
One-yr forward EV/EBITDA Five-yr average EV/EBITDA
Motherson Sumi Systems | 1QFY2011 Result Update
August 12, 2010 11
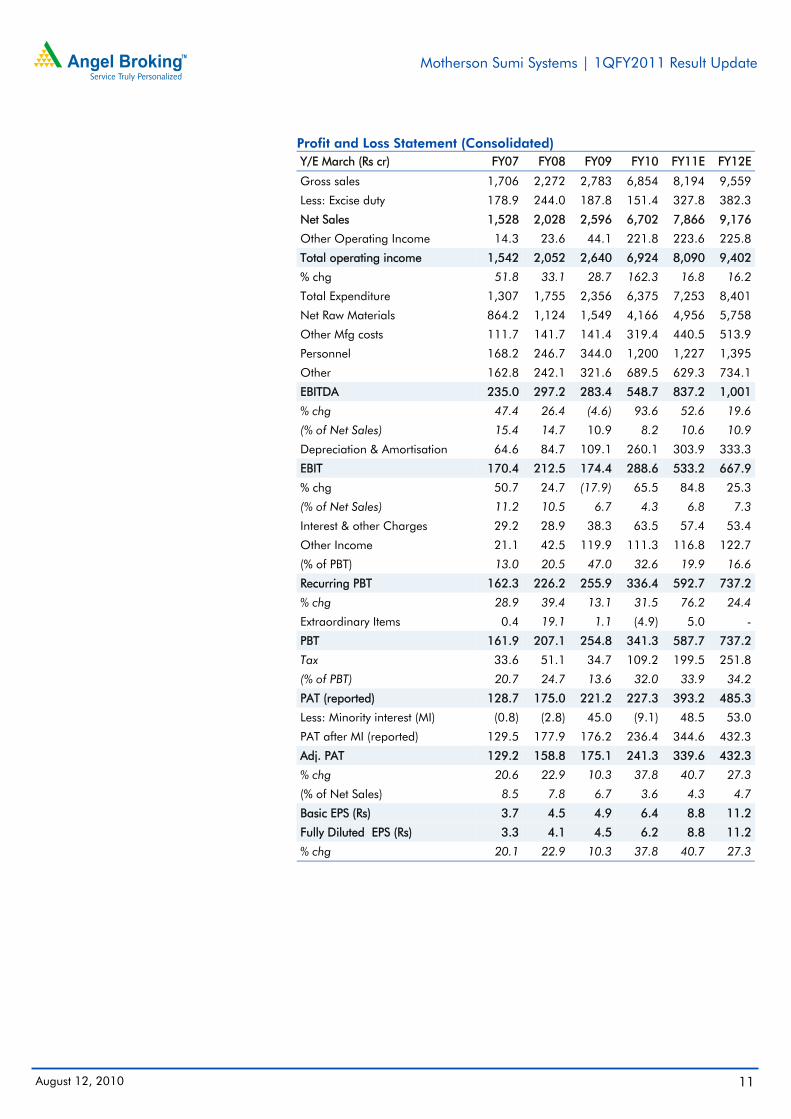
Profit and Loss Statement (Consolidated) Y/E March (Rs cr) FY07 FY08 FY09 FY10 FY11E FY12E
Gross sales 1,706 2,272 2,783 6,854 8,194 9,559
Less: Excise duty 178.9 244.0 187.8 151.4 327.8 382.3
Net Sales 1,528 2,028 2,596 6,702 7,866 9,176
Other Operating Income 14.3 23.6 44.1 221.8 223.6 225.8
Total operating income 1,542 2,052 2,640 6,924 8,090 9,402
% chg 51.8 33.1 28.7 162.3 16.8 16.2
Total Expenditure 1,307 1,755 2,356 6,375 7,253 8,401
Net Raw Materials 864.2 1,124 1,549 4,166 4,956 5,758
Other Mfg costs 111.7 141.7 141.4 319.4 440.5 513.9
Personnel 168.2 246.7 344.0 1,200 1,227 1,395
Other 162.8 242.1 321.6 689.5 629.3 734.1
EBITDA 235.0 297.2 283.4 548.7 837.2 1,001
% chg 47.4 26.4 (4.6) 93.6 52.6 19.6
(% of Net Sales) 15.4 14.7 10.9 8.2 10.6 10.9
Depreciation & Amortisation 64.6 84.7 109.1 260.1 303.9 333.3
EBIT 170.4 212.5 174.4 288.6 533.2 667.9
% chg 50.7 24.7 (17.9) 65.5 84.8 25.3
(% of Net Sales) 11.2 10.5 6.7 4.3 6.8 7.3
Interest & other Charges 29.2 28.9 38.3 63.5 57.4 53.4
Other Income 21.1 42.5 119.9 111.3 116.8 122.7
(% of PBT) 13.0 20.5 47.0 32.6 19.9 16.6
Recurring PBT 162.3 226.2 255.9 336.4 592.7 737.2
% chg 28.9 39.4 13.1 31.5 76.2 24.4
Extraordinary Items 0.4 19.1 1.1 (4.9) 5.0 -
PBT 161.9 207.1 254.8 341.3 587.7 737.2
Tax 33.6 51.1 34.7 109.2 199.5 251.8
(% of PBT) 20.7 24.7 13.6 32.0 33.9 34.2
PAT (reported) 128.7 175.0 221.2 227.3 393.2 485.3
Less: Minority interest (MI) (0.8) (2.8) 45.0 (9.1) 48.5 53.0
PAT after MI (reported) 129.5 177.9 176.2 236.4 344.6 432.3
Adj. PAT 129.2 158.8 175.1 241.3 339.6 432.3
% chg 20.6 22.9 10.3 37.8 40.7 27.3
(% of Net Sales) 8.5 7.8 6.7 3.6 4.3 4.7
Basic EPS (Rs) 3.7 4.5 4.9 6.4 8.8 11.2
Fully Diluted EPS (Rs) 3.3 4.1 4.5 6.2 8.8 11.2
% chg 20.1 22.9 10.3 37.8 40.7 27.3
Motherson Sumi Systems | 1QFY2011 Result Update
August 12, 2010 12
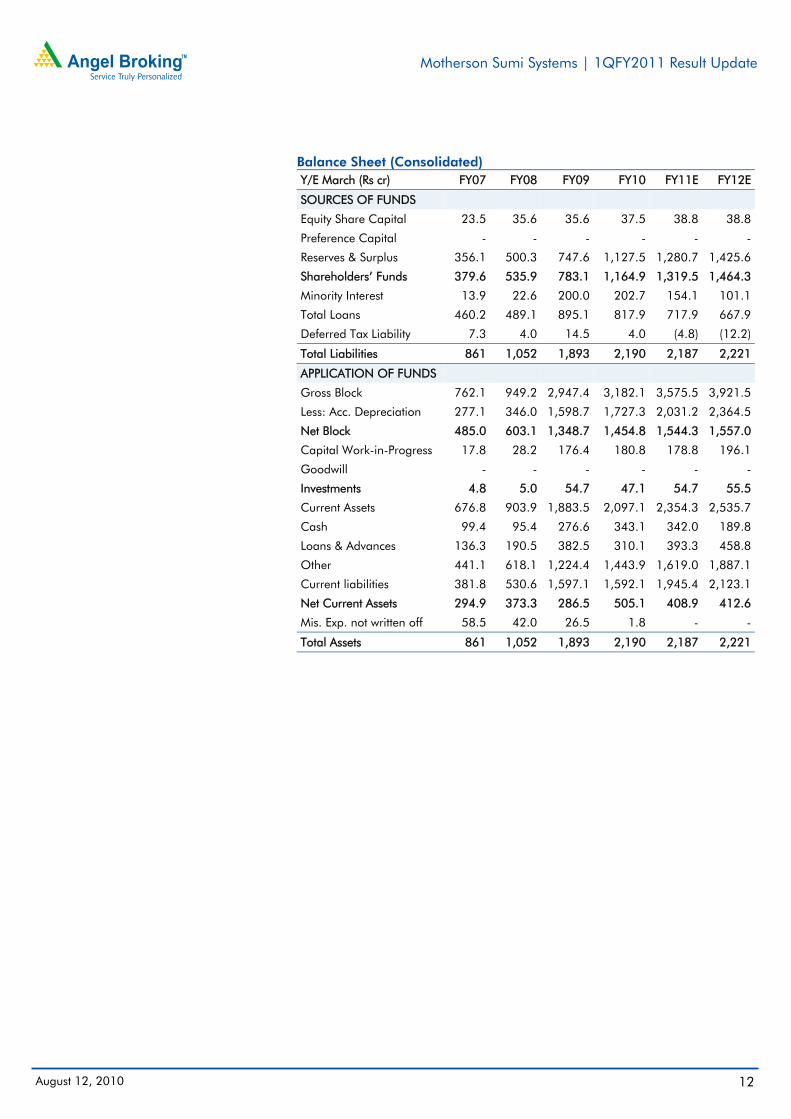
Balance Sheet (Consolidated) Y/E March (Rs cr) FY07 FY08 FY09 FY10 FY11E FY12E
SOURCES OF FUNDS
Equity Share Capital 23.5 35.6 35.6 37.5 38.8 38.8
Preference Capital - - - - - -
Reserves & Surplus 356.1 500.3 747.6 1,127.5 1,280.7 1,425.6
Shareholders’ Funds 379.6 535.9 783.1 1,164.9 1,319.5 1,464.3
Minority Interest 13.9 22.6 200.0 202.7 154.1 101.1
Total Loans 460.2 489.1 895.1 817.9 717.9 667.9
Deferred Tax Liability 7.3 4.0 14.5 4.0 (4.8) (12.2)
Total Liabilities 861 1,052 1,893 2,190 2,187 2,221
APPLICATION OF FUNDS
Gross Block 762.1 949.2 2,947.4 3,182.1 3,575.5 3,921.5
Less: Acc. Depreciation 277.1 346.0 1,598.7 1,727.3 2,031.2 2,364.5
Net Block 485.0 603.1 1,348.7 1,454.8 1,544.3 1,557.0
Capital Work-in-Progress 17.8 28.2 176.4 180.8 178.8 196.1
Goodwill - - - - - -
Investments 4.8 5.0 54.7 47.1 54.7 55.5
Current Assets 676.8 903.9 1,883.5 2,097.1 2,354.3 2,535.7
Cash 99.4 95.4 276.6 343.1 342.0 189.8
Loans & Advances 136.3 190.5 382.5 310.1 393.3 458.8
Other 441.1 618.1 1,224.4 1,443.9 1,619.0 1,887.1
Current liabilities 381.8 530.6 1,597.1 1,592.1 1,945.4 2,123.1
Net Current Assets 294.9 373.3 286.5 505.1 408.9 412.6
Mis. Exp. not written off 58.5 42.0 26.5 1.8 - -
Total Assets 861 1,052 1,893 2,190 2,187 2,221
Motherson Sumi Systems | 1QFY2011 Result Update
August 12, 2010 13
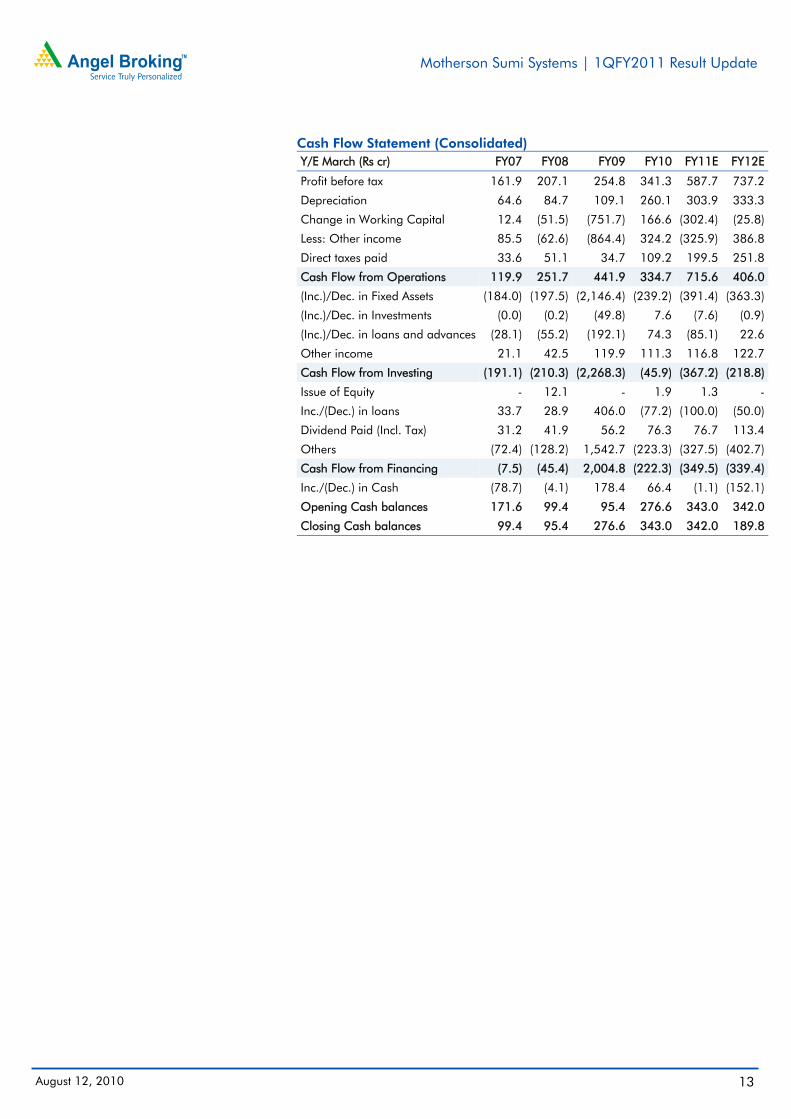
Cash Flow Statement (Consolidated) Y/E March (Rs cr) FY07 FY08 FY09 FY10 FY11E FY12E
Profit before tax 161.9 207.1 254.8 341.3 587.7 737.2
Depreciation 64.6 84.7 109.1 260.1 303.9 333.3
Change in Working Capital 12.4 (51.5) (751.7) 166.6 (302.4) (25.8)
Less: Other income 85.5 (62.6) (864.4) 324.2 (325.9) 386.8
Direct taxes paid 33.6 51.1 34.7 109.2 199.5 251.8
Cash Flow from Operations 119.9 251.7 441.9 334.7 715.6 406.0
(Inc.)/Dec. in Fixed Assets (184.0) (197.5) (2,146.4) (239.2) (391.4) (363.3)
(Inc.)/Dec. in Investments (0.0) (0.2) (49.8) 7.6 (7.6) (0.9)
(Inc.)/Dec. in loans and advances (28.1) (55.2) (192.1) 74.3 (85.1) 22.6
Other income 21.1 42.5 119.9 111.3 116.8 122.7
Cash Flow from Investing (191.1) (210.3) (2,268.3) (45.9) (367.2) (218.8)
Issue of Equity - 12.1 - 1.9 1.3 -
Inc./(Dec.) in loans 33.7 28.9 406.0 (77.2) (100.0) (50.0)
Dividend Paid (Incl. Tax) 31.2 41.9 56.2 76.3 76.7 113.4
Others (72.4) (128.2) 1,542.7 (223.3) (327.5) (402.7)
Cash Flow from Financing (7.5) (45.4) 2,004.8 (222.3) (349.5) (339.4)
Inc./(Dec.) in Cash (78.7) (4.1) 178.4 66.4 (1.1) (152.1)
Opening Cash balances 171.6 99.4 95.4 276.6 343.0 342.0
Closing Cash balances 99.4 95.4 276.6 343.0 342.0 189.8
Motherson Sumi Systems | 1QFY2011 Result Update
August 12, 2010 14
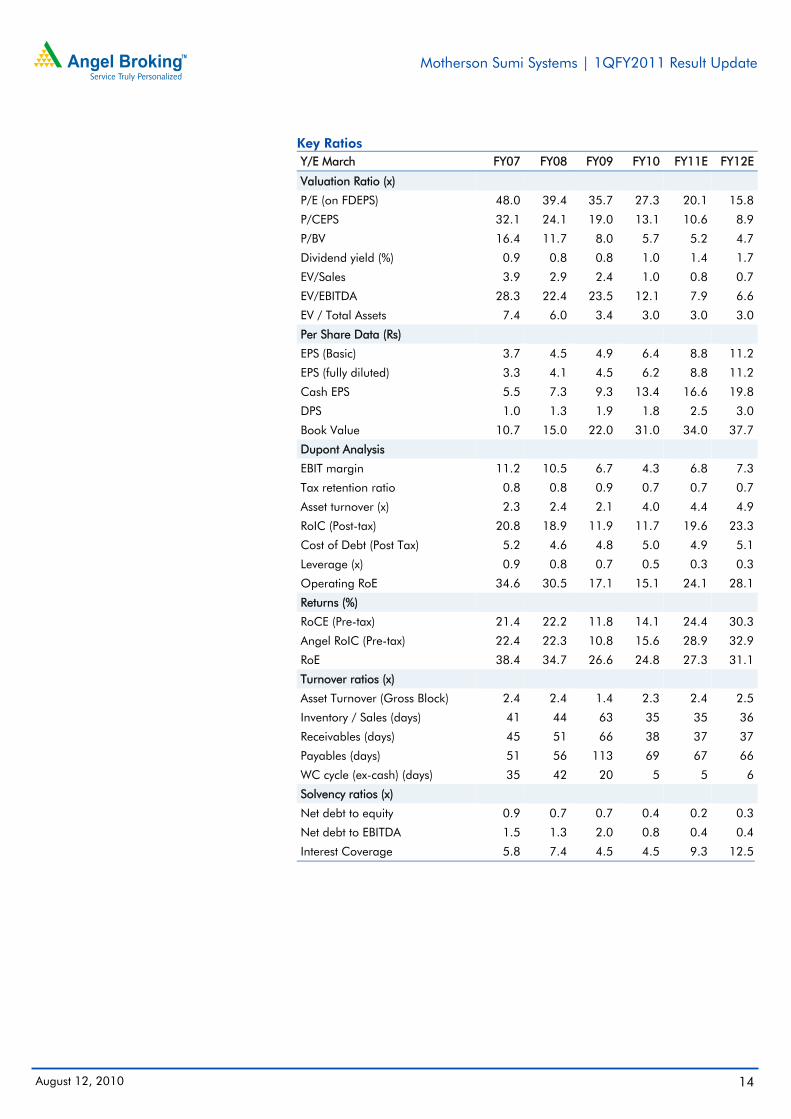
Key Ratios Y/E March FY07 FY08 FY09 FY10 FY11E FY12E
Valuation Ratio (x)
P/E (on FDEPS) 48.0 39.4 35.7 27.3 20.1 15.8
P/CEPS 32.1 24.1 19.0 13.1 10.6 8.9
P/BV 16.4 11.7 8.0 5.7 5.2 4.7
Dividend yield (%) 0.9 0.8 0.8 1.0 1.4 1.7
EV/Sales 3.9 2.9 2.4 1.0 0.8 0.7
EV/EBITDA 28.3 22.4 23.5 12.1 7.9 6.6
EV / Total Assets 7.4 6.0 3.4 3.0 3.0 3.0
Per Share Data (Rs)
EPS (Basic) 3.7 4.5 4.9 6.4 8.8 11.2
EPS (fully diluted) 3.3 4.1 4.5 6.2 8.8 11.2
Cash EPS 5.5 7.3 9.3 13.4 16.6 19.8
DPS 1.0 1.3 1.9 1.8 2.5 3.0
Book Value 10.7 15.0 22.0 31.0 34.0 37.7
Dupont Analysis
EBIT margin 11.2 10.5 6.7 4.3 6.8 7.3
Tax retention ratio 0.8 0.8 0.9 0.7 0.7 0.7
Asset turnover (x) 2.3 2.4 2.1 4.0 4.4 4.9
RoIC (Post-tax) 20.8 18.9 11.9 11.7 19.6 23.3
Cost of Debt (Post Tax) 5.2 4.6 4.8 5.0 4.9 5.1
Leverage (x) 0.9 0.8 0.7 0.5 0.3 0.3
Operating RoE 34.6 30.5 17.1 15.1 24.1 28.1
Returns (%)
RoCE (Pre-tax) 21.4 22.2 11.8 14.1 24.4 30.3
Angel RoIC (Pre-tax) 22.4 22.3 10.8 15.6 28.9 32.9
RoE 38.4 34.7 26.6 24.8 27.3 31.1
Turnover ratios (x)
Asset Turnover (Gross Block) 2.4 2.4 1.4 2.3 2.4 2.5
Inventory / Sales (days) 41 44 63 35 35 36
Receivables (days) 45 51 66 38 37 37
Payables (days) 51 56 113 69 67 66
WC cycle (ex-cash) (days) 35 42 20 5 5 6
Solvency ratios (x)
Net debt to equity 0.9 0.7 0.7 0.4 0.2 0.3
Net debt to EBITDA 1.5 1.3 2.0 0.8 0.4 0.4
Interest Coverage 5.8 7.4 4.5 4.5 9.3 12.5
Motherson Sumi Systems | 1QFY2011 Result Update
August 12, 2010 15
Disclosure of Interest Statement Motherson Sumi Systems 1. Analyst ownership of the stock Yes 2. Angel and its Group companies ownership of the stock No 3. Angel and its Group companies' Directors ownership of the stock No 4. Broking relationship with company covered No Note: We have not considered any Exposure below Rs 1 lakh for Angel, its Group companies and Directors. Ratings (Returns) : Buy (> 15%) Accumulate (5% to 15%) Neutral (-5 to 5%) Reduce (-5% to 15%) Sell (< -15%)
Research Team Tel: 022 - 4040 3800 E-mail: [email protected] Website: www.angeltrade.com DISCLAIMER This document is solely for the personal information of the recipient, and must not be singularly used as the basis of any investment decision. Nothing in this document should be construed as investment or financial advice. Each recipient of this document should make such investigations as they deem necessary to arrive at an independent evaluation of an investment in the securities of the companies referred to in this document (including the merits and risks involved), and should consult their own advisors to determine the merits and risks of such an investment.
Angel Broking Limited, its affiliates, directors, its proprietary trading and investment businesses may, from time to time, make investment decisions that are inconsistent with or contradictory to the recommendations expressed herein. The views contained in this document are those of the analyst, and the company may or may not subscribe to all the views expressed within.
Reports based on technical and derivative analysis center on studying charts of a stock's price movement, outstanding positions and trading volume, as opposed to focusing on a company's fundamentals and, as such, may not match with a report on a company's fundamentals.
The information in this document has been printed on the basis of publicly available information, internal data and other reliable sources believed to be true, but we do not represent that it is accurate or complete and it should not be relied on as such, as this document is for general guidance only. Angel Broking Limited or any of its affiliates/ group companies shall not be in any way responsible for any loss or damage that may arise to any person from any inadvertent error in the information contained in this report. Angel Broking Limited has not independently verified all the information contained within this document. Accordingly, we cannot testify, nor make any representation or warranty, express or implied, to the accuracy, contents or data contained within this document. While Angel Broking Limited endeavours to update on a reasonable basis the information discussed in this material, there may be regulatory, compliance, or other reasons that prevent us from doing so. This document is being supplied to you solely for your information, and its contents, information or data may not be reproduced, redistributed or passed on, directly or indirectly.
Angel Broking Limited and its affiliates may seek to provide or have engaged in providing corporate finance, investment banking or other advisory services in a merger or specific transaction to the companies referred to in this report, as on the date of this report or in the past.
Neither Angel Broking Limited, nor its directors, employees or affiliates shall be liable for any loss or damage that may arise from or in connection with the use of this information.
Note: Please refer to the important `Stock Holding Disclosure' report on the Angel website (Research Section). Also, please refer to the latest update on respective stocks for the disclosure status in respect of those stocks. Angel Broking Limited and its affiliates may have investment positions in the stocks recommended in this report.