Embed Size (px)
Citation preview

Mutual Fund 10 February 2015
“ ERIC ”
Ericson Menor Business Development Officer
Rampver Strategic Advisors
(02) 894-1811 /
(02) 812-1995
0917-718-0325
Unit 2202, 22nd floor, Antel 2000 Corporate
Center, Valero Access Road 3, Valero
Street, Makati City.
Financial Intermediary
Mutual Fund Distributor
Money and Asset Management Advisory
Training, Consulting, and other Financial Services

A good influencer.
Rex Mendoza Senior Adviser AIA Group

• Winning the lotto
• Getting a huge inheritance
• Marrying it
• Working hard for it
• to cope with inflation
•To attain a financial goal

- General increase of prices
of basic goods year after year
2011 2012 2013 2014

Year 2003
P25.00
Year 2006
P45.00
Year 2009
P55.00
Year 2012
P69.00
Year 2014
P79.00

When are you going to act to increase your
financial value?


Man's Economic Life
MAN AT WORK!
MAN AND MONEY AT WORK!
MONEY AT WORK!

THE MUTUL FUND CONCEPT
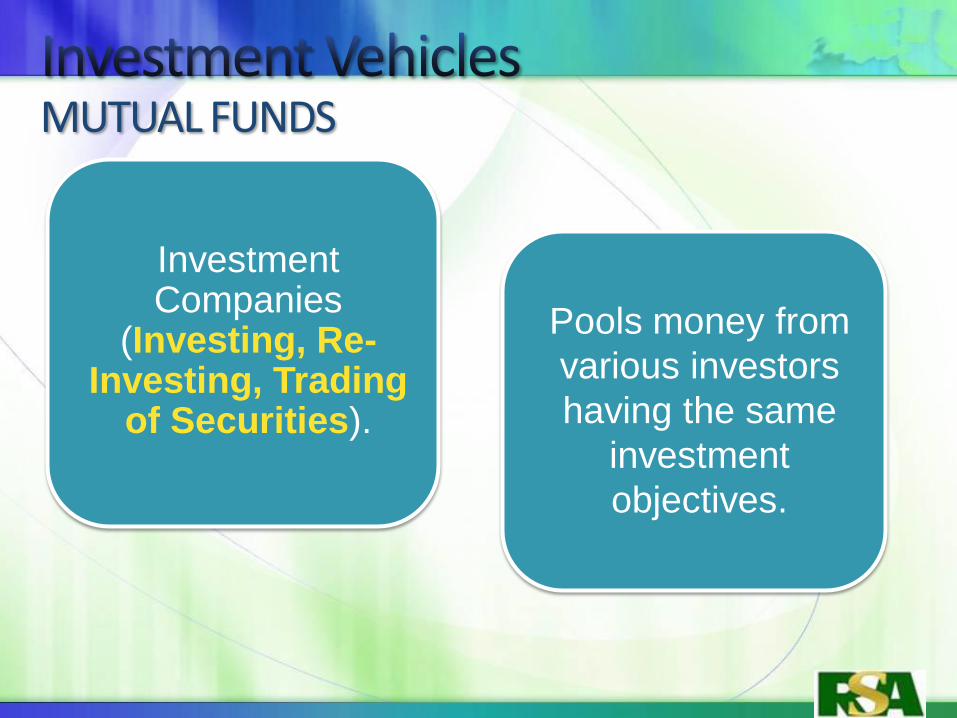
MUTUAL FUNDS
Investment Companies
(Investing, Re-Investing, Trading
of Securities).
Pools money from
various investors
having the same
investment
objectives.
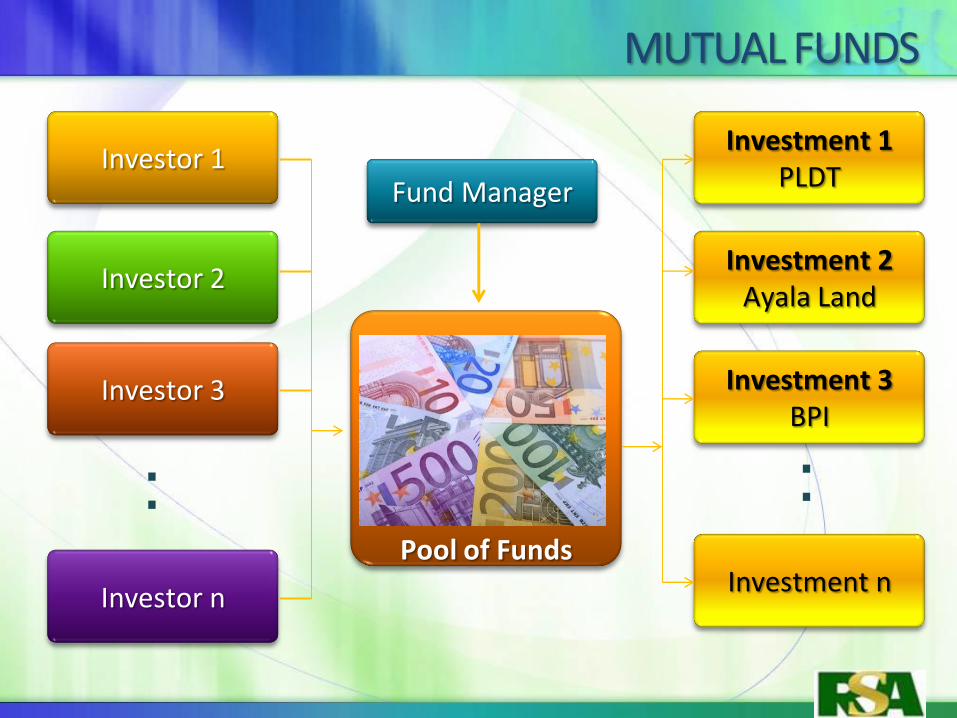
MUTUAL FUNDS
Investor 3
Fund Manager Investor 1
Investor n
Pool of Funds
Investor 2
.
. . .
Investment 1 PLDT
Investment 2 Ayala Land
Investment 3 BPI
Investment n
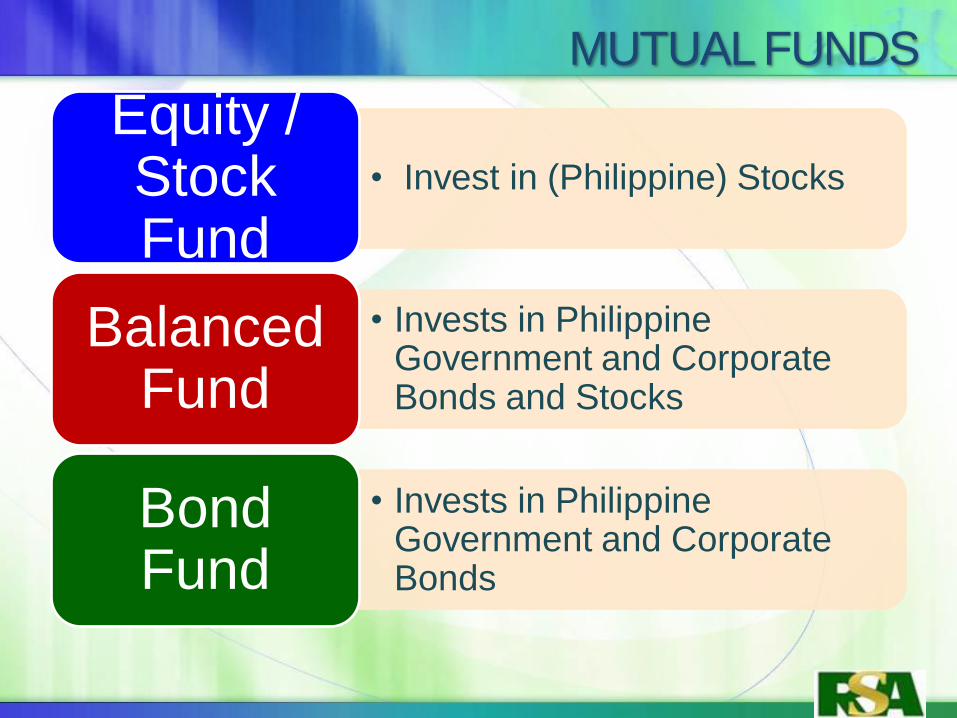
• Invest in (Philippine) Stocks
Equity / Stock Fund
• Invests in Philippine Government and Corporate Bonds and Stocks
Balanced Fund
• Invests in Philippine Government and Corporate Bonds
Bond Fund
MUTUAL FUNDS
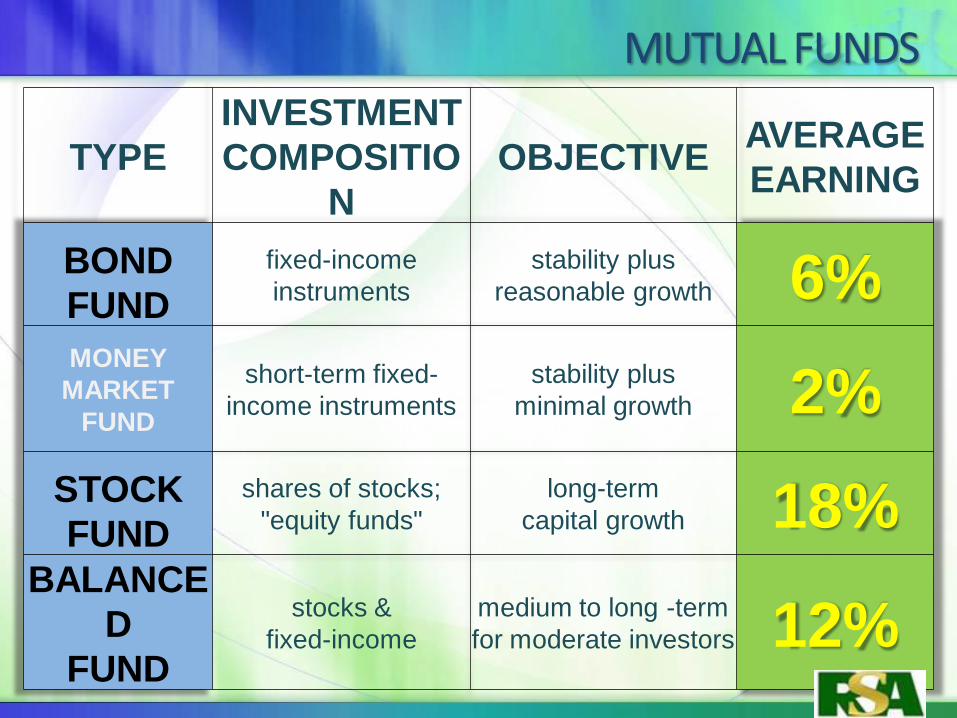
TYPE
INVESTMENT
COMPOSITIO
N
OBJECTIVE AVERAGE
EARNING
BOND
FUND
fixed-income
instruments
stability plus
reasonable growth 6% MONEY
MARKET
FUND
short-term fixed-
income instruments
stability plus
minimal growth 2%
STOCK
FUND
shares of stocks;
"equity funds"
long-term
capital growth 18% BALANCE
D
FUND
stocks &
fixed-income
medium to long -term
for moderate investors 12%
MUTUAL FUNDS

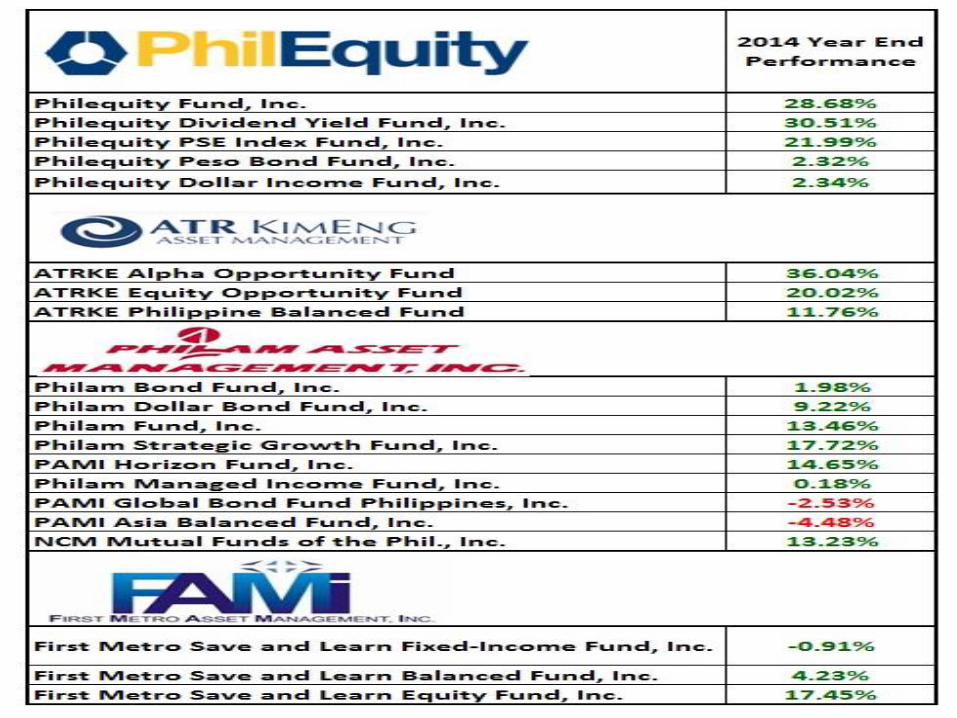
Our Financial Partners
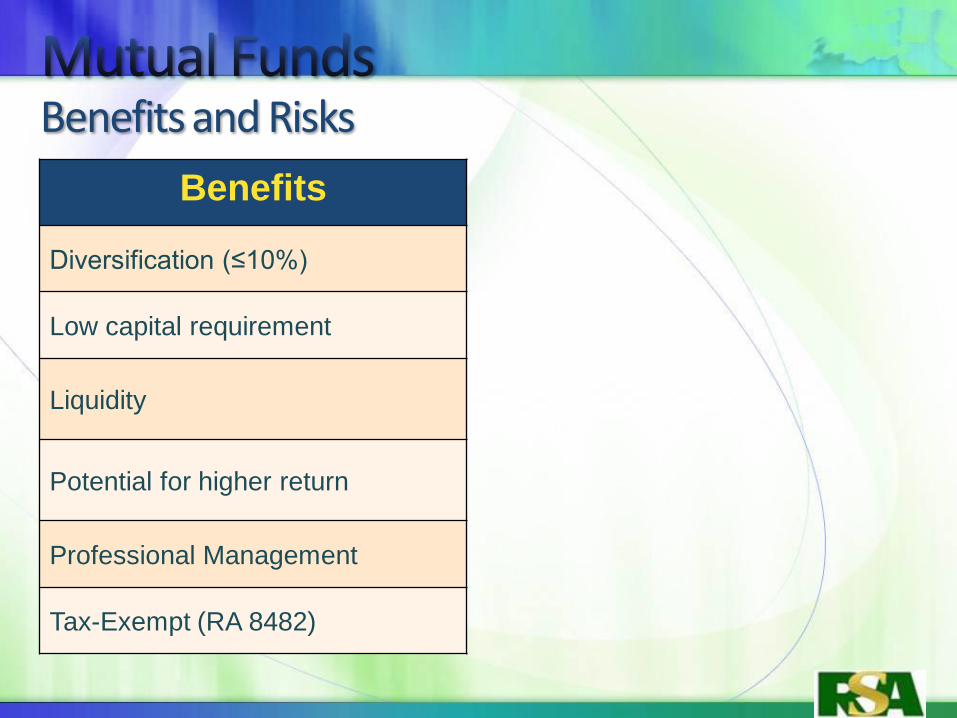
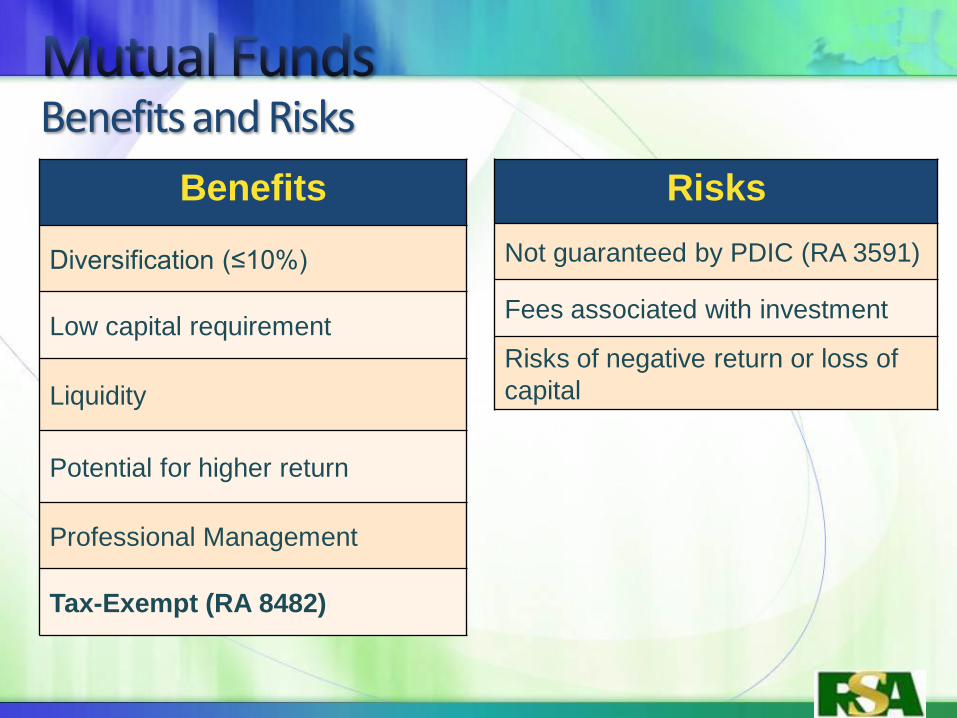
Benefits
Diversification (≤10%)
Low capital requirement
Liquidity
Potential for higher return
Professional Management
Tax-Exempt (RA 8482)
Benefits and Risks
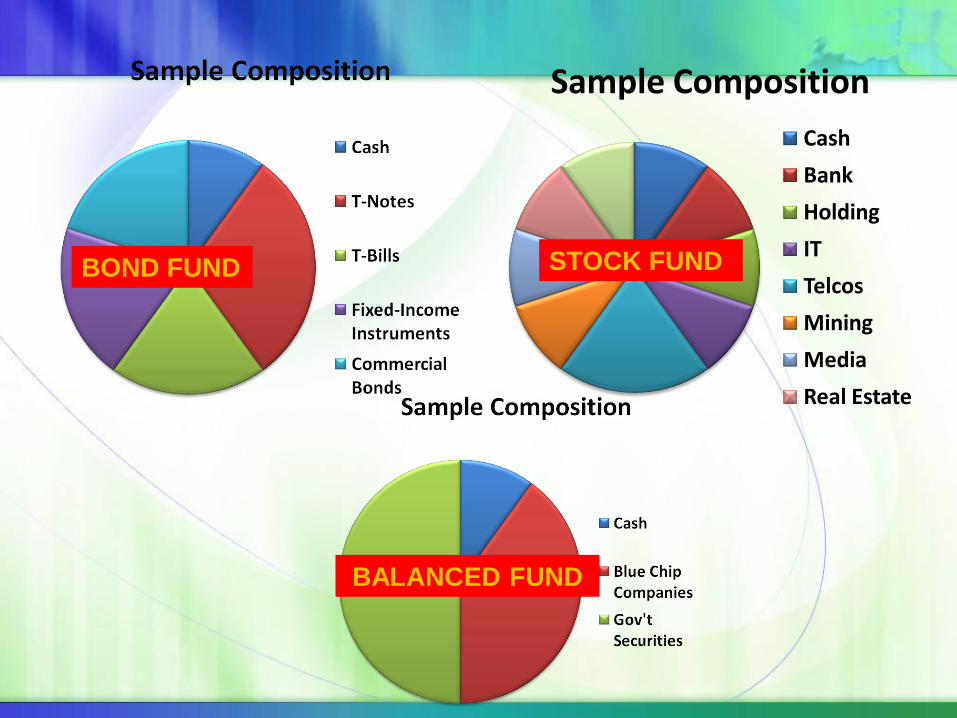
Sample Composition
Cash
Bank
Holding
IT
Telcos
Mining
Media
Real Estate
BOND FUND
BALANCED FUND
STOCK FUND
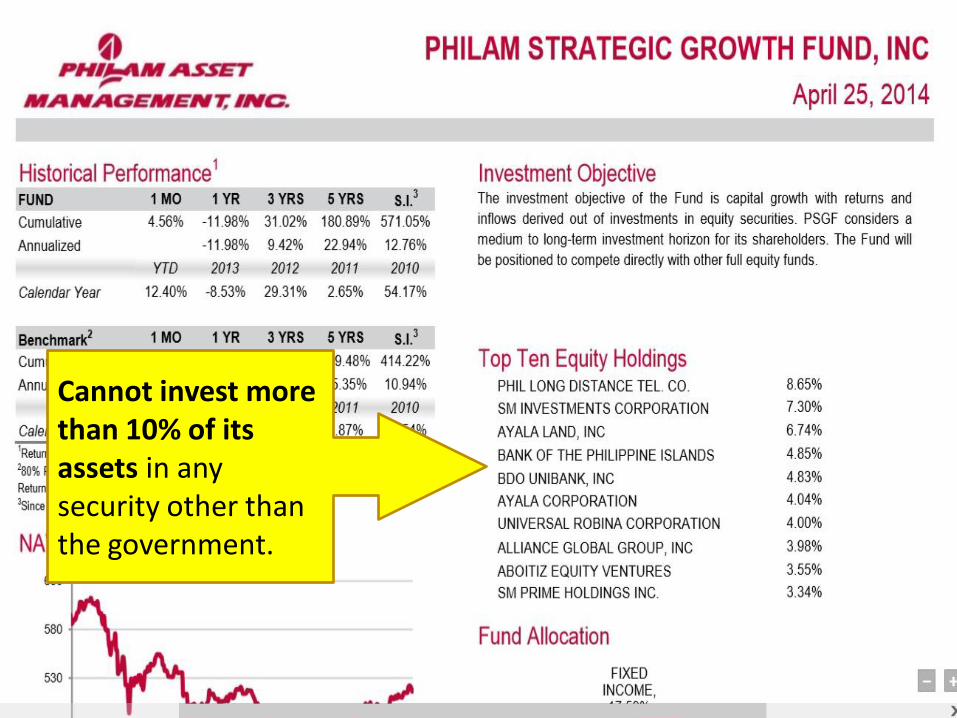
Cannot invest more than 10% of its assets in any security other than the government.
Benefits
Diversification (≤10%)
Low capital requirement
Liquidity
Potential for higher return
Professional Management
Tax-Exempt (RA 8482)
Benefits and Risks
Risks
Not guaranteed by PDIC (RA 3591)
Fees associated with investment
Risks of negative return or loss of
capital
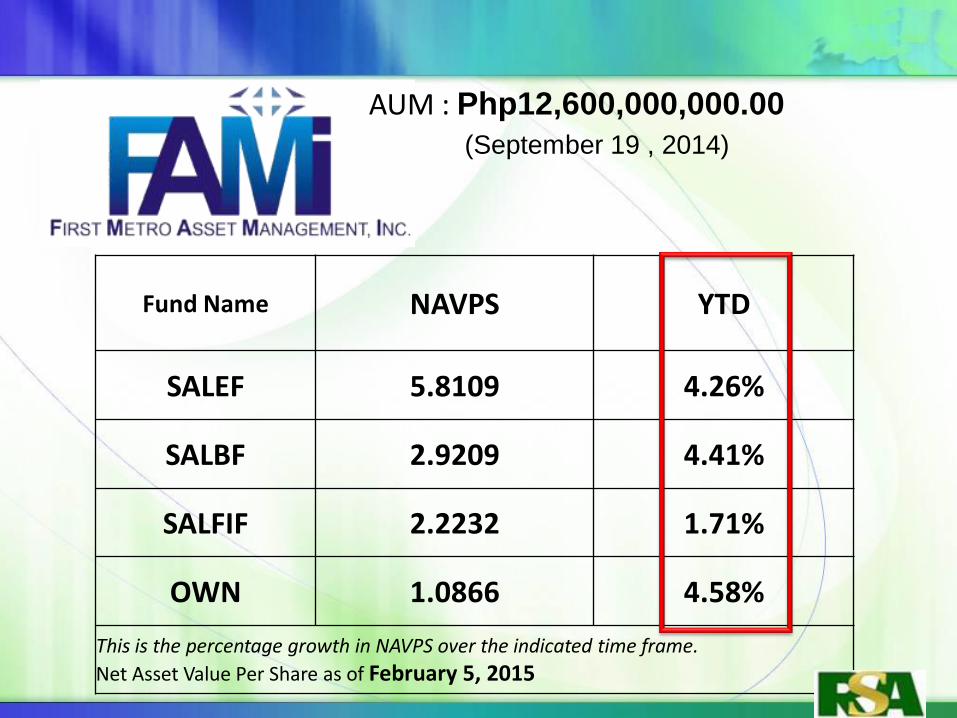
Fund Name NAVPS YTD
SALEF 5.8109 4.26%
SALBF 2.9209 4.41%
SALFIF 2.2232 1.71%
OWN 1.0866 4.58%
This is the percentage growth in NAVPS over the indicated time frame.
Net Asset Value Per Share as of February 5, 2015
AUM : Php12,600,000,000.00
(September 19 , 2014)
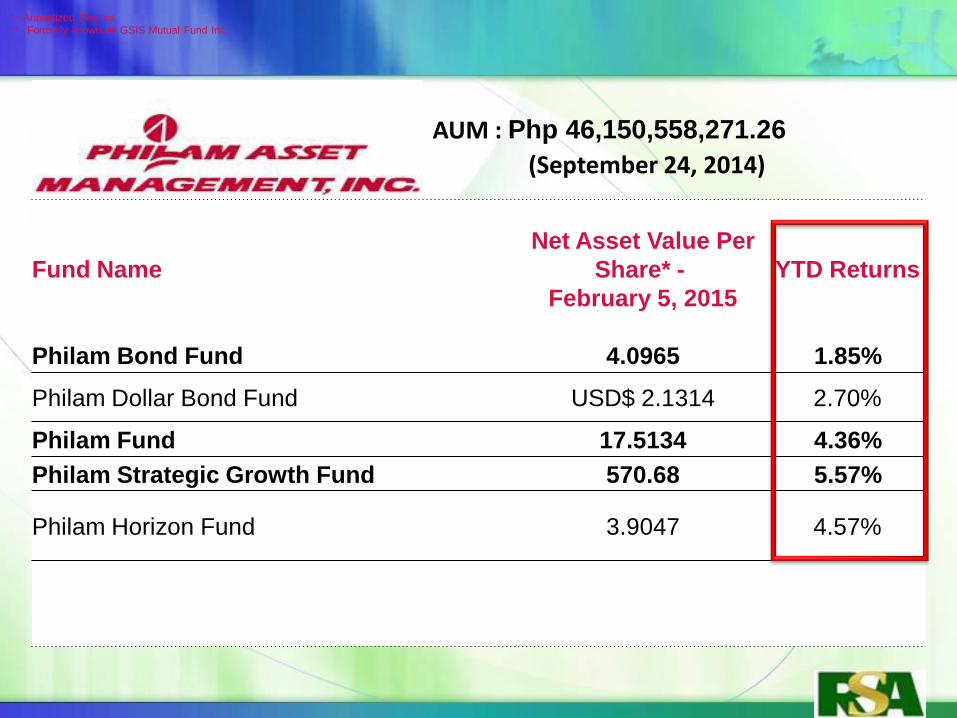
Fund Name
Net Asset Value Per
Share* -
February 5, 2015
YTD Returns
Philam Bond Fund 4.0965 1.85%
Philam Dollar Bond Fund USD$ 2.1314 2.70%
Philam Fund 17.5134 4.36%
Philam Strategic Growth Fund 570.68 5.57%
Philam Horizon Fund 3.9047 4.57%
* - Annualized Returns
** - Formerly known as GSIS Mutual Fund Inc.
AUM : Php 46,150,558,271.26
(September 24, 2014)
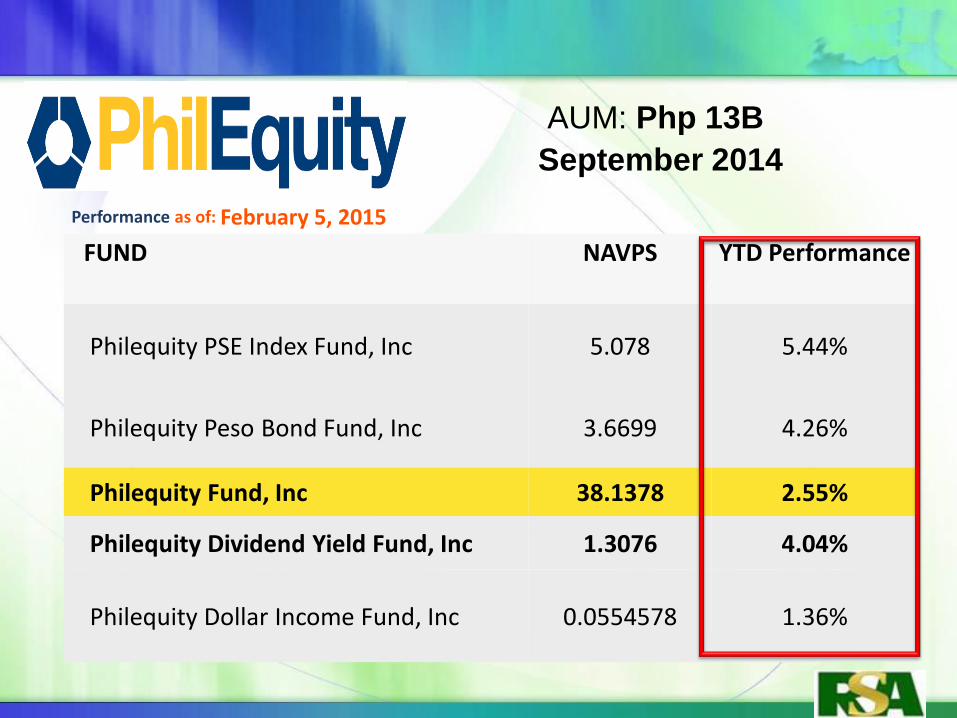
AUM: Php 13B
September 2014
Performance as of: February 5, 2015
FUND NAVPS YTD Performance
Philequity PSE Index Fund, Inc 5.078 5.44%
Philequity Peso Bond Fund, Inc 3.6699 4.26%
Philequity Fund, Inc 38.1378 2.55%
Philequity Dividend Yield Fund, Inc 1.3076 4.04%
Philequity Dollar Income Fund, Inc 0.0554578 1.36%
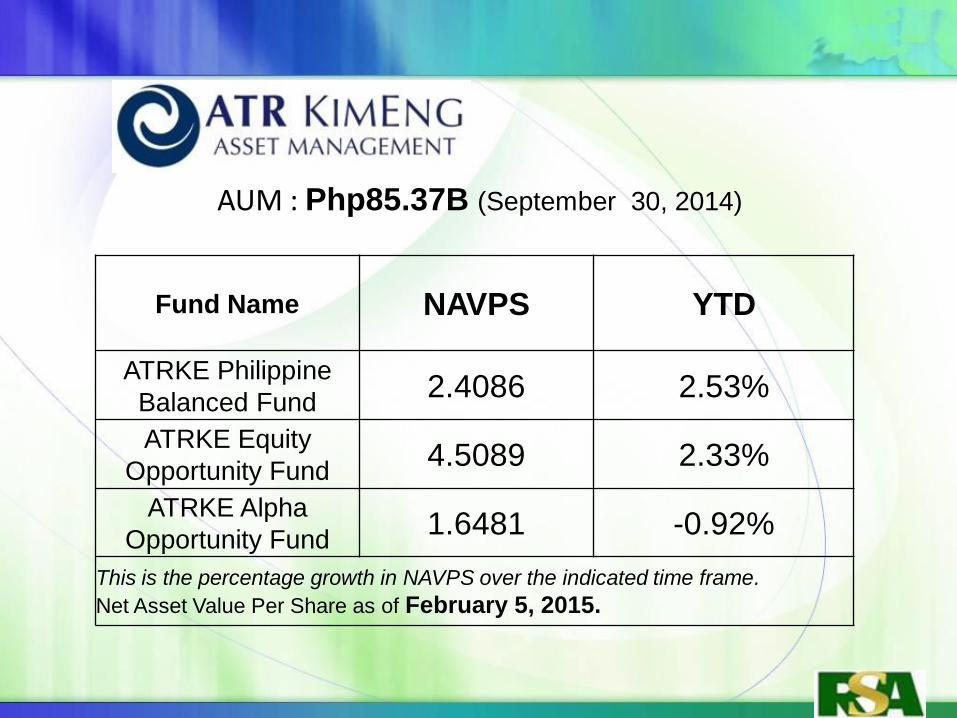
Fund Name NAVPS YTD
ATRKE Philippine
Balanced Fund 2.4086 2.53%
ATRKE Equity
Opportunity Fund 4.5089 2.33%
ATRKE Alpha
Opportunity Fund 1.6481 -0.92%
This is the percentage growth in NAVPS over the indicated time frame.
Net Asset Value Per Share as of February 5, 2015.
AUM : Php85.37B (September 30, 2014)
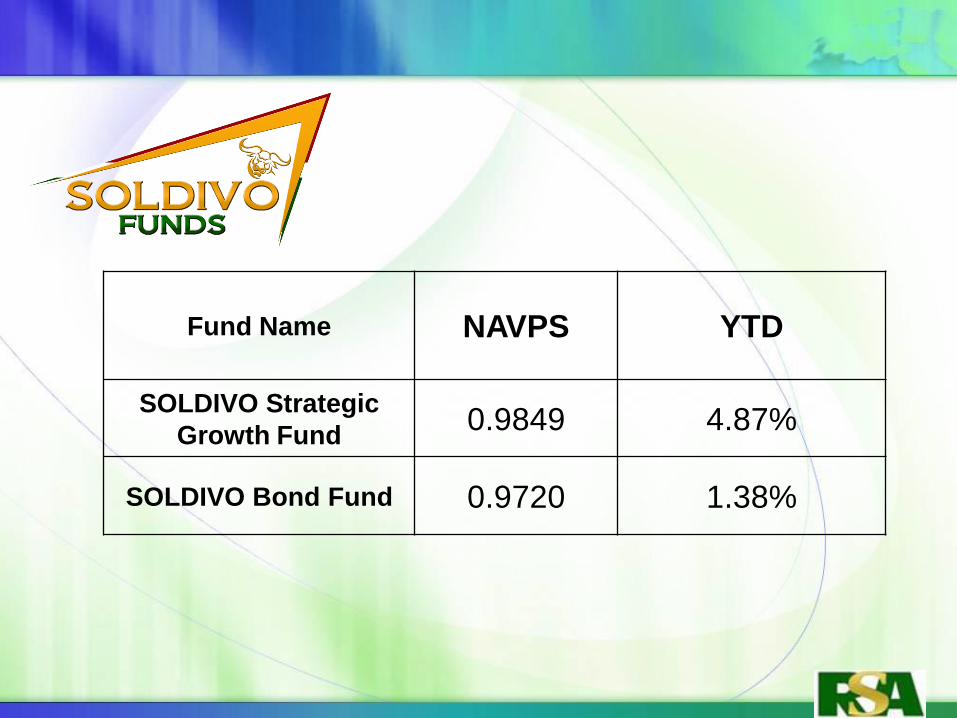
Fund Name NAVPS YTD
SOLDIVO Strategic
Growth Fund 0.9849 4.87%
SOLDIVO Bond Fund 0.9720 1.38%

WHY LONG-TERM?
To maximize the potential return of your investment, you need to let it grow over time.
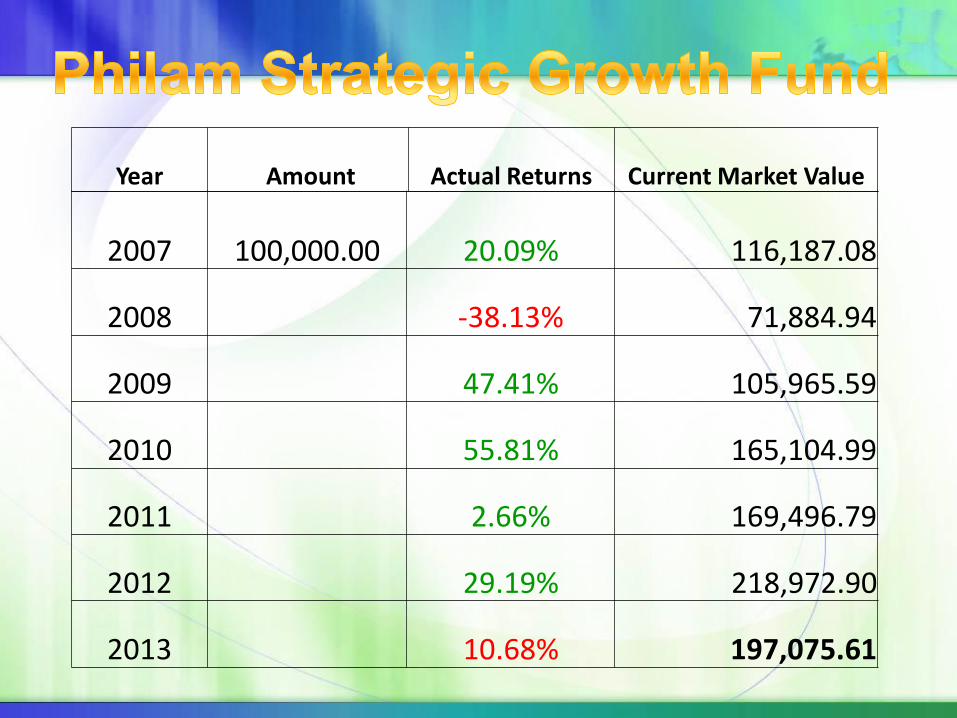
Year Amount Actual Returns Current Market Value
2007
100,000.00 20.09% 116,187.08
2008 -38.13% 71,884.94
2009 47.41% 105,965.59
2010 55.81% 165,104.99
2011 2.66% 169,496.79
2012 29.19% 218,972.90
2013 10.68% 197,075.61
Year Amount Actual Returns Current Market Value
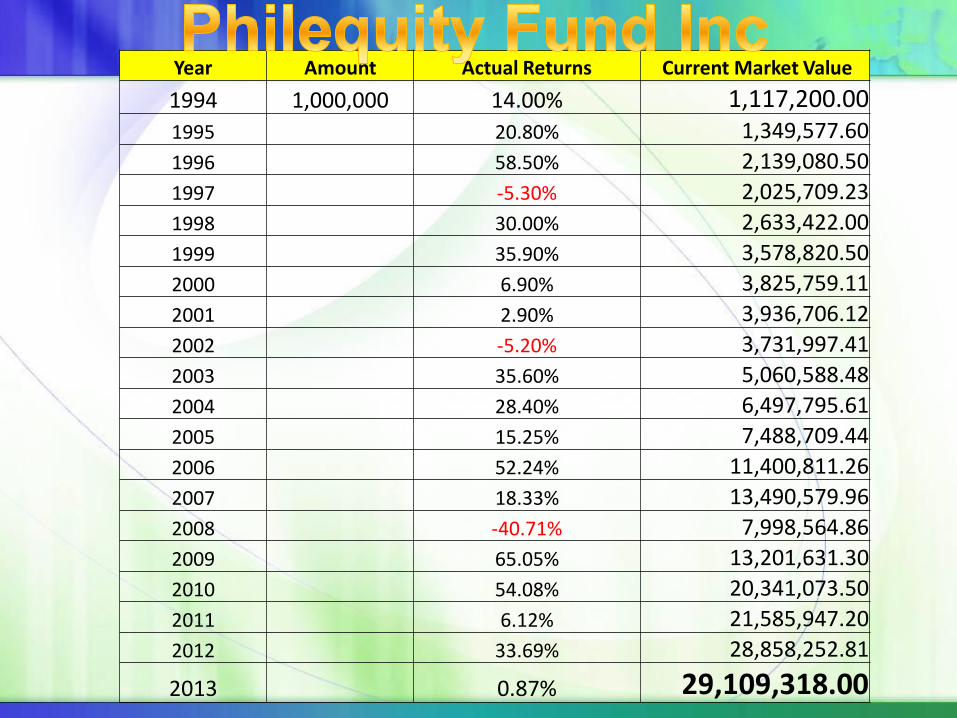
1994 1,000,000 14.00% 1,117,200.00 1995 20.80% 1,349,577.60
1996 58.50% 2,139,080.50
1997 -5.30% 2,025,709.23
1998 30.00% 2,633,422.00
1999 35.90% 3,578,820.50
2000 6.90% 3,825,759.11
2001 2.90% 3,936,706.12
2002 -5.20% 3,731,997.41
2003 35.60% 5,060,588.48
2004 28.40% 6,497,795.61
2005 15.25% 7,488,709.44
2006 52.24% 11,400,811.26
2007 18.33% 13,490,579.96
2008 -40.71% 7,998,564.86
2009 65.05% 13,201,631.30
2010 54.08% 20,341,073.50
2011 6.12% 21,585,947.20
2012 33.69% 28,858,252.81
2013 0.87% 29,109,318.00
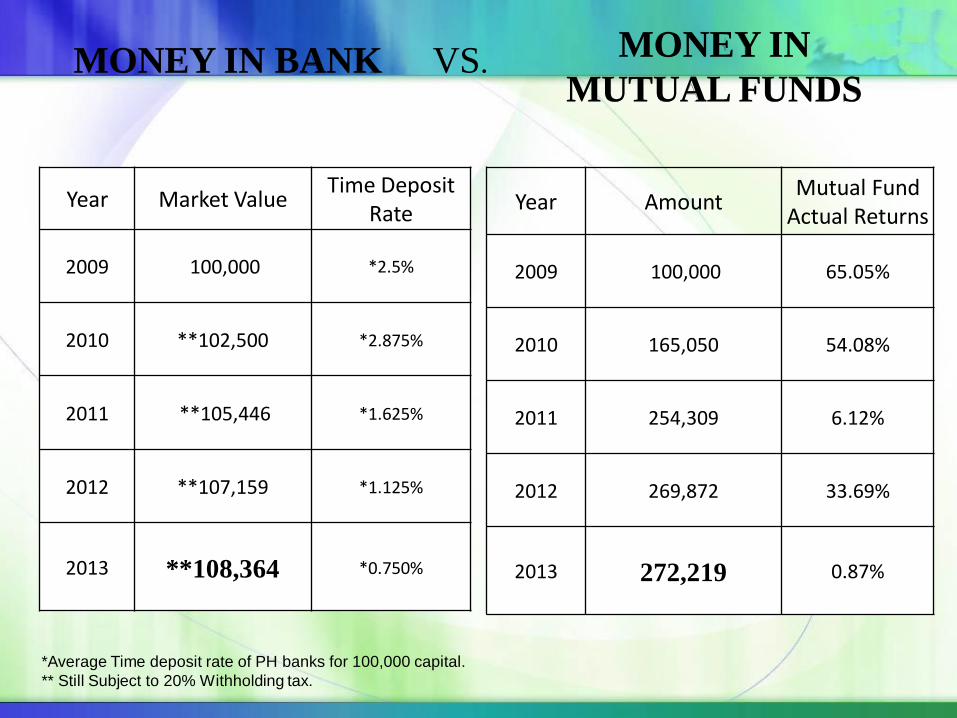
MONEY IN BANK VS. MONEY IN
MUTUAL FUNDS
Year Amount Mutual Fund
Actual Returns
2009 100,000 65.05%
2010 165,050 54.08%
2011 254,309 6.12%
2012 269,872 33.69%
2013 272,219 0.87%
Year Market Value Time Deposit
Rate
2009 100,000 *2.5%
2010 **102,500 *2.875%
2011 **105,446 *1.625%
2012 **107,159 *1.125%
2013 **108,364 *0.750%
*Average Time deposit rate of PH banks for 100,000 capital.
** Still Subject to 20% Withholding tax.

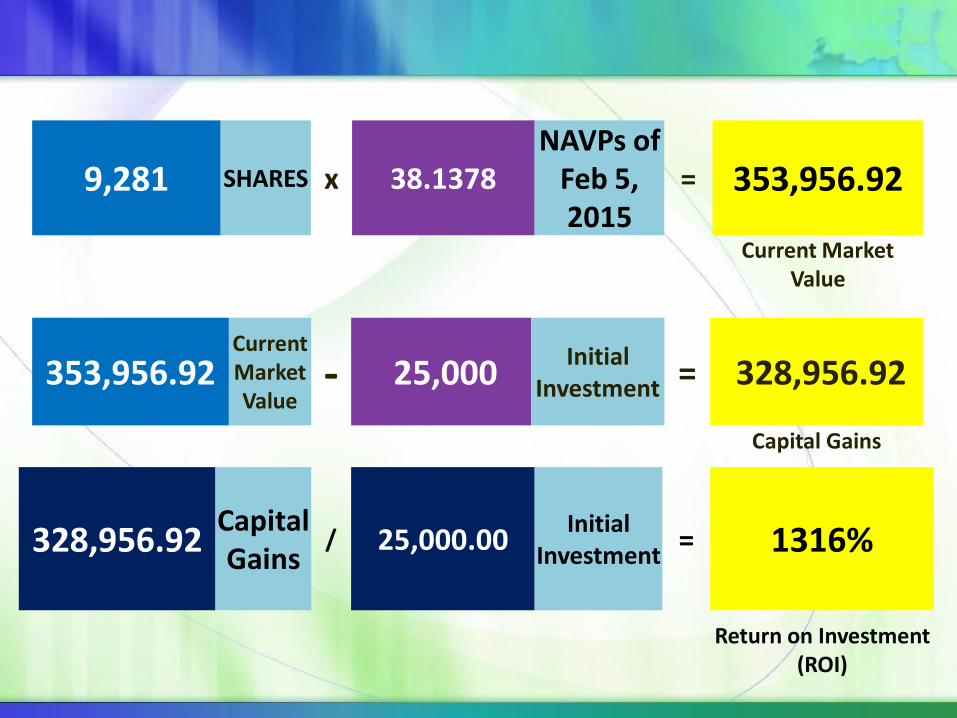
9,281 SHARES x 38.1378 NAVPs of
Feb 5, 2015
= 353,956.92
Current Market Value
353,956.92 Current Market Value
- 25,000 Initial
Investment = 328,956.92
Capital Gains
328,956.92
Capital Gains
/ 25,000.00 Initial
Investment = 1316%
Return on Investment (ROI)
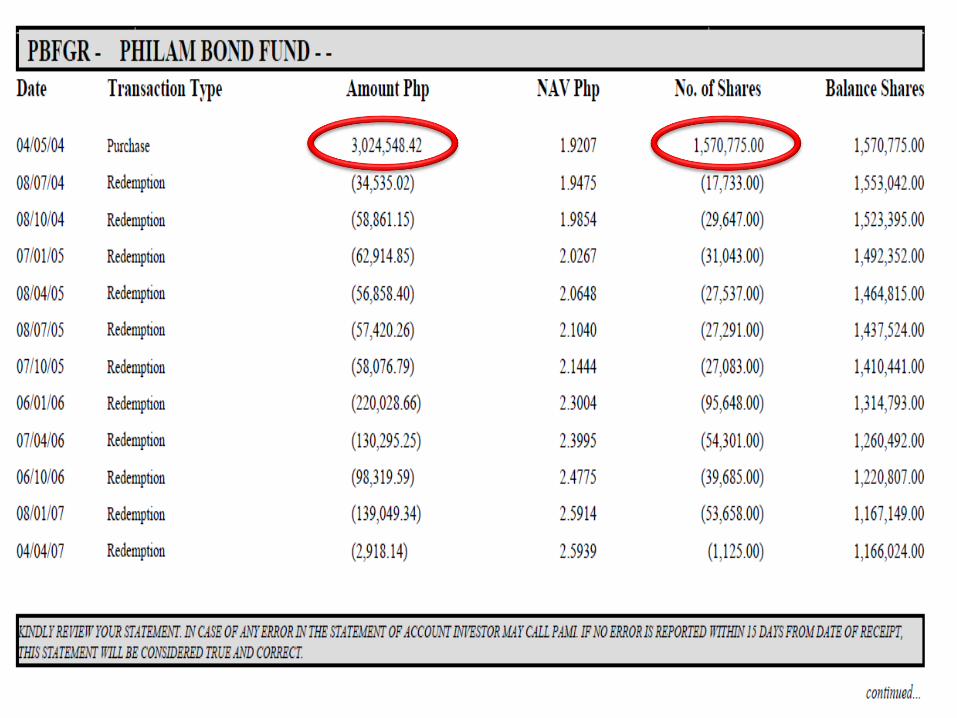
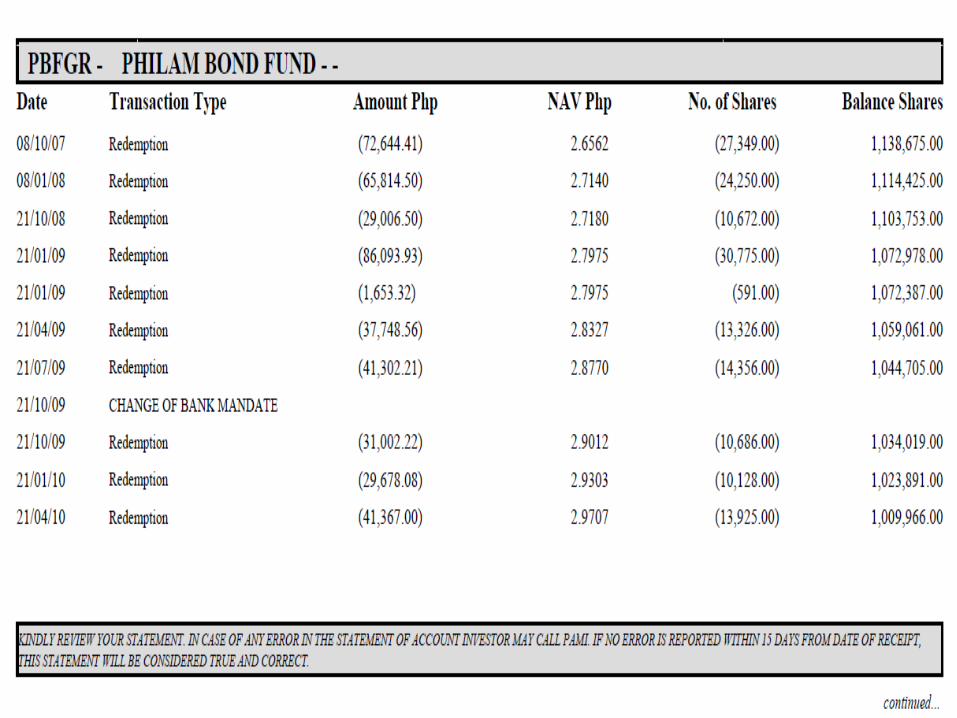
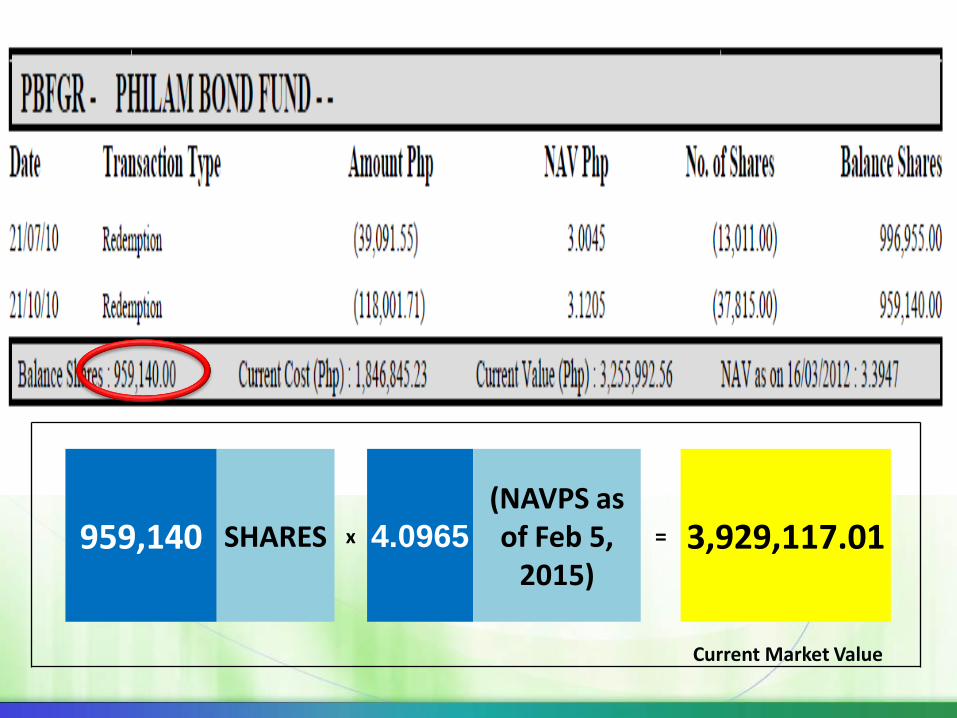
959,140
SHARES x 4.0965
(NAVPS as of Feb 5,
2015)
= 3,929,117.01
Current Market Value
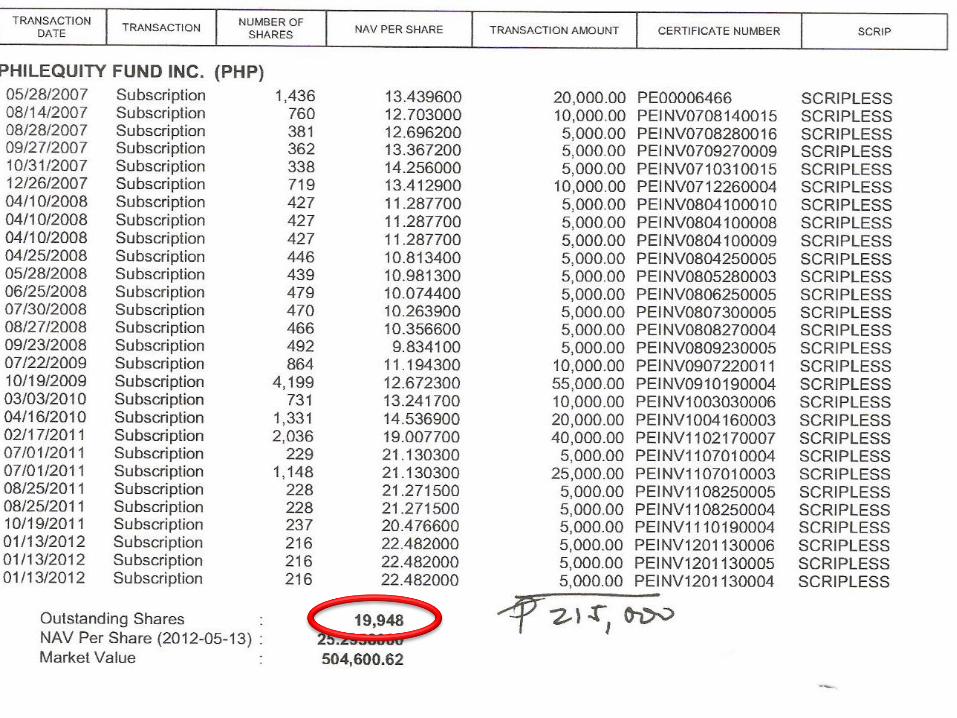
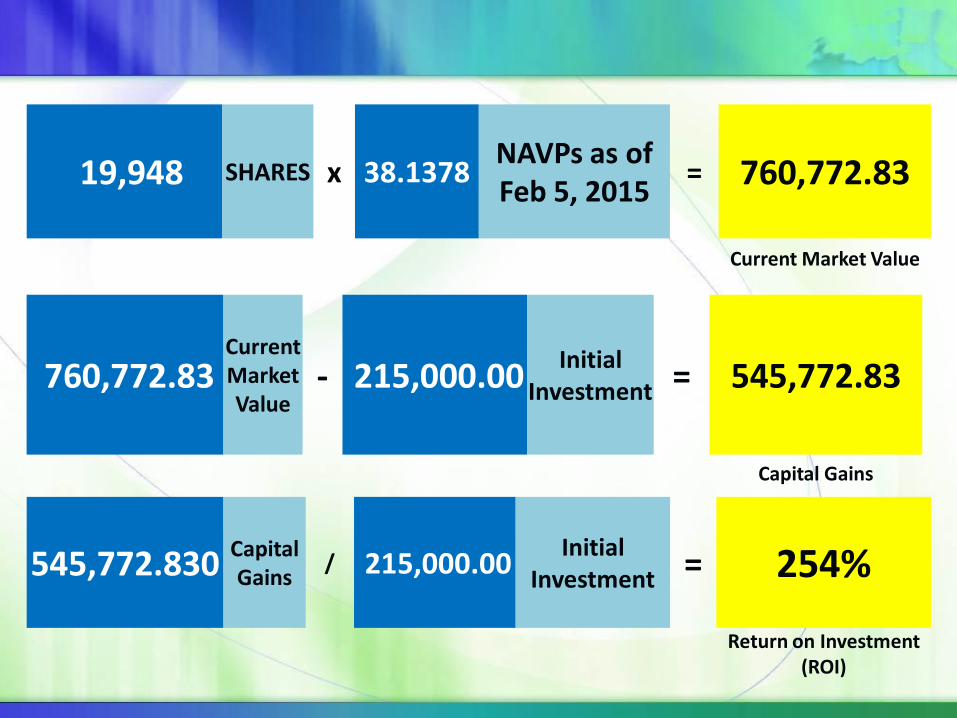
19,948 SHARES x 38.1378 NAVPs as of Feb 5, 2015
= 760,772.83
Current Market Value
760,772.83 Current Market Value
- 215,000.00 Initial
Investment = 545,772.83
Capital Gains
545,772.830 Capital Gains
/ 215,000.00 Initial
Investment = 254%
Return on Investment (ROI)
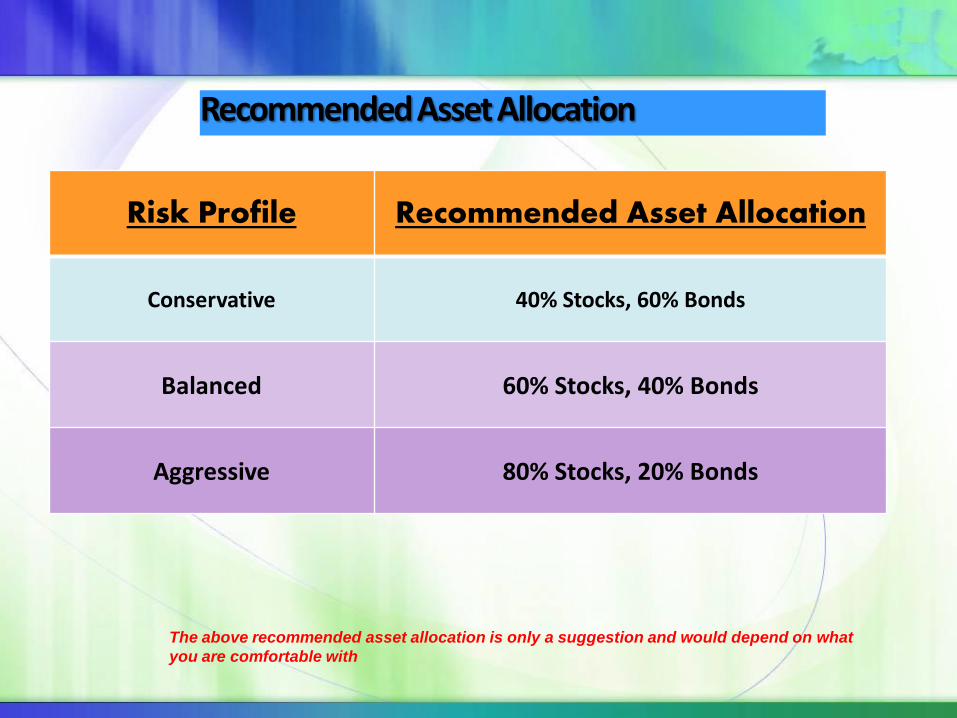
Recommended Asset Allocation
Risk Profile Recommended Asset Allocation
Conservative 40% Stocks, 60% Bonds
Balanced 60% Stocks, 40% Bonds
Aggressive 80% Stocks, 20% Bonds
The above recommended asset allocation is only a suggestion and would depend on what
you are comfortable with

End of Slide.