Embed Size (px)
Citation preview

Chapter 17Natural Resource and Energy Economics
Copyright © 2015 McGraw-Hill Education. All rights reserved. No reproduction or distribution without the prior written consent of McGraw-Hill Education.

17-2
Resource Supplies: Doom or Boom?
• Population increased from 1 to 7 billion• Standard of living is 12 times higher• Consumption of resources is much higher
LO1
17-3
Population Growth
• Thomas Malthus (1798) predictions• Replacement rate• Total fertility rate• Modernization• Death rates fall• Fertility rate falls below replacement rate
LO1
17-4
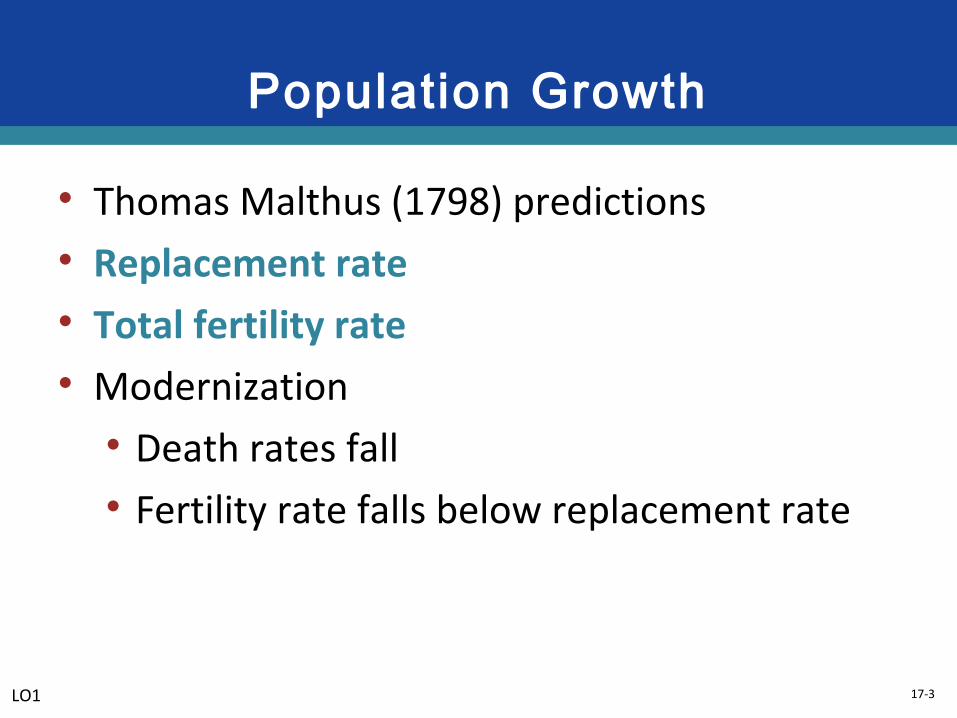
Total Ferti l i ty Rates, 2012Country Total Fertility Rate
Australia 1.77
Canada 1.59
China 1.55
France 2.08
Germany 1.41
Hong Kong 1.09
Italy 1.40
Japan 1.39
Russia 1.61
South Korea 1.23
Sweden 1.67
United States 2.06
Source: The World Factbook, www.cia.gov. Data are 2012 estimates.LO1

17-5
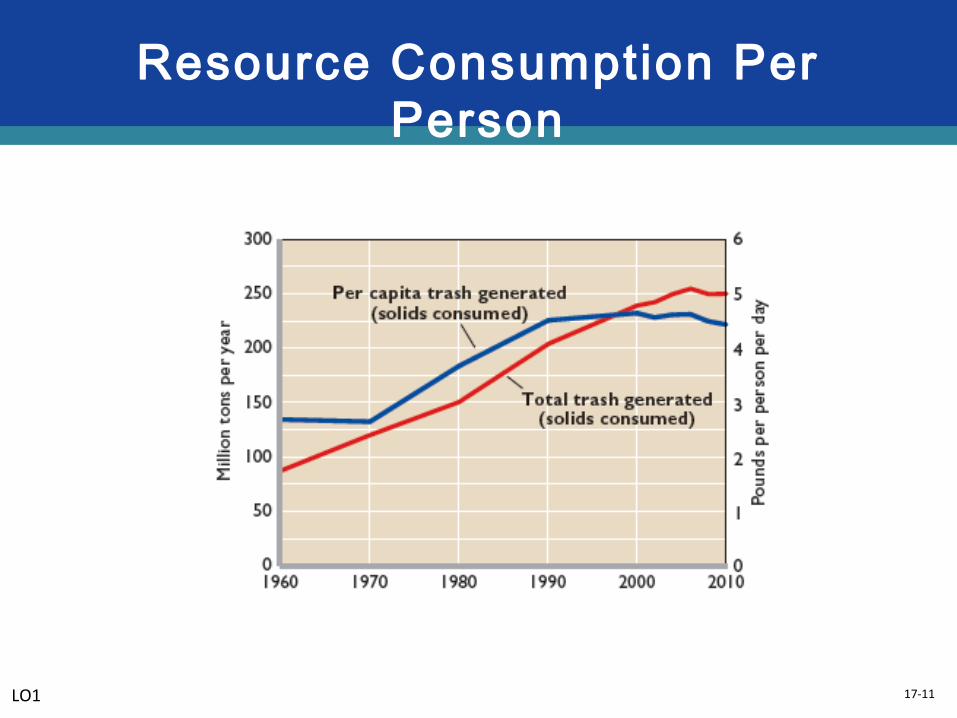
Resource Consumption Per Person
• Increasing commodity demand• Population growth• Rising consumption per person• Commodity supply has risen faster than
demand• Commodity prices are falling
LO1

17-6
Resource Consumption Per Person
LO1

17-7
Resource Consumption Per Person
• Will resource supplies be sustainable in the future?
• Prospects are hopeful• Demand for resources will reach a peak and
decline with falling birthrates• Resource consumption per capita leveled
off or is decreasing
LO1

17-8
Resource Consumption Per Person
LO1
17-9
Resource Consumption Per Person
• Leveled off in the rich countries• Demand will increase in poorer countries• Challenge is to move resource supplies from
their place of origin to places of need
LO1

17-10
Resource Consumption Per Person
LO1
17-11
Resource Consumption Per Person
LO1
17-12
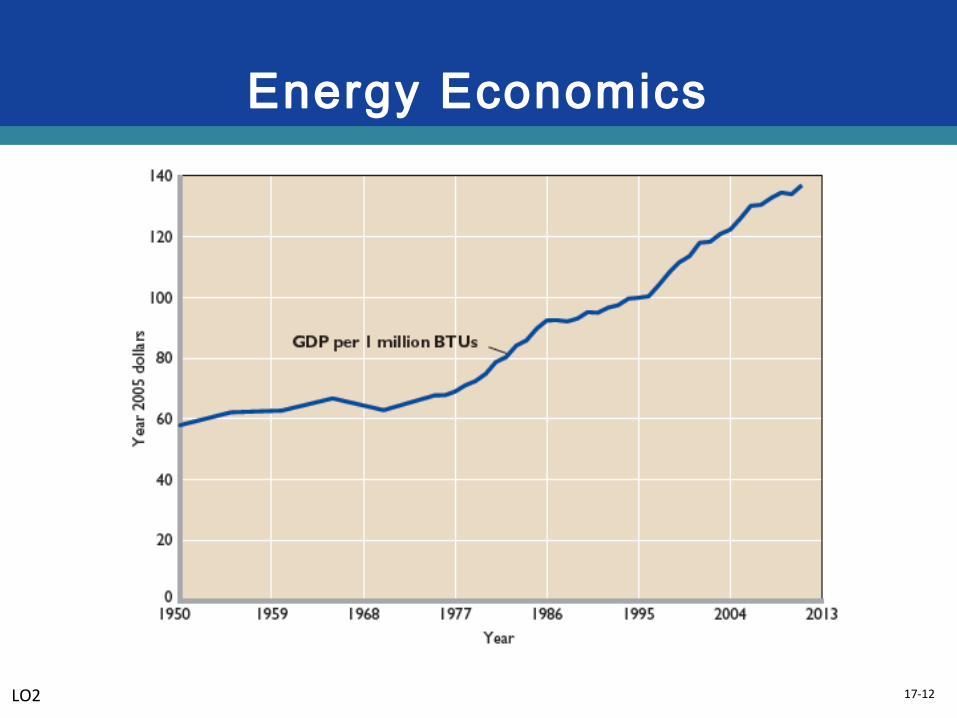
Energy Economics
LO2

17-13
Efficient Electricity Use
• The Challenge: Highly Variable Demand•Variations in fixed costs •Daily variations in demand•Different types of generation technology
LO2

17-14
Efficient Energy Use
Source: United States Energy Information Administration, www.eia.doe.gov.LO2

17-15
Running Out of Energy?
• No likelihood of running out of energy• Running out of cheap energy
• Multiple sources of supply• Environmental impacts
LO3

17-16
Running Out of Energy?
Sources: Cambridge Energy Research Associates, www.cera.com; The Economist, April 22, 2006,
www.economist.com.LO3

17-17
Natural Resource Economics
• Policies for extracting resources to maximize net benefits
• Present vs. future consumption• Present value
• Renewables vs. Nonrenewables• Renewable natural resources• Nonrenewable natural resources
LO4
17-18
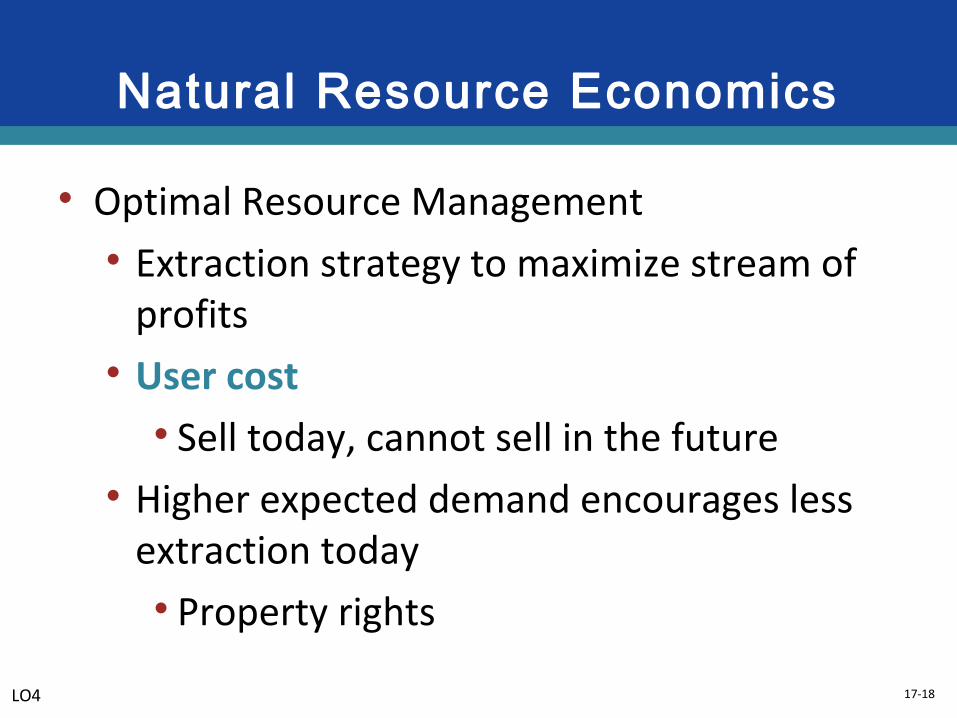
Natural Resource Economics
• Optimal Resource Management • Extraction strategy to maximize stream of
profits• User cost
• Sell today, cannot sell in the future• Higher expected demand encourages less
extraction today• Property rights
LO4

17-19
Natural Resource Economics
AB
TC = EC + UC
EC
Q0Q1Q20
First-year quantity extracted
Do
llar
s
P
UC
LO4

17-20
Natural Resource Economics
TC = EC + UC0
EC
Q0Q10
First-year quantity extracted
Dol
lars
P
UC
TC = EC + UC1
LO4
17-21
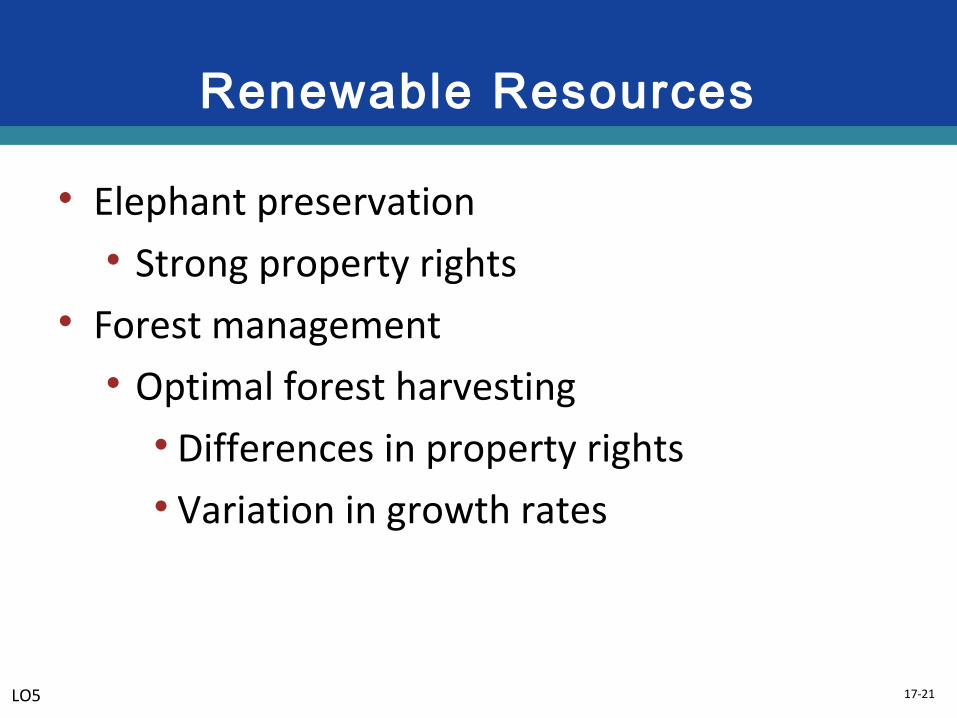
Renewable Resources
• Elephant preservation• Strong property rights
• Forest management• Optimal forest harvesting
• Differences in property rights• Variation in growth rates
LO5

17-22
Global Perspective
LO5

17-23
Optimal Forest Harvesting
LO5

17-24
Renewable Resources
• Optimal fisheries management• Difficult to assign property rights• Policies to limit catch sizes• Total allowable catch (TAC)• Individual transfer quota (ITQs)
LO5

17-25
Renewable Resources
Fishery Market Value of CatchSea scallop $455,693,743
Lobster 399,476,190
Walleye pollock 282,399,223
Sockeye salmon 278,646,491
Pacific halibut 206,958,364
White shrimp 191,608,324
Blue crab 189,784,233
Pacific cod 146,940,754
Brown shrimp 144,592,574
Dungeness crab 140,443,133
LO5

17-26
Renewable Resources
LO5

17-27
Is Economic Growth Bad for the Environment?
• Richer countries:• Produce and consume more• Spend more to maintain the environment• Earn higher scores on measures of
environmental quality (EPIs)