Embed Size (px)
Citation preview

NETWORK WAITAKI LIMITED
LINES BUSINESS
FINANCIAL STATEMENTS
For the Year Ended 31 March 2002
Prepared for the Purposes of the Electricity (Information Disclosure)Regulations 1999 (as amended).
IMPORTANT NOTEThe financial information presented is for the ‘line business’ activity ofNetwork Waitaki Limited as described within the Electricity (InformationDisclosure) Regulations. Additional activities of the Company, that are notrequired to be reported under the Regulations, have been excluded.
This information should not be used for any other purposes than thatintended under the Regulations. The Regulations require the information tobe disclosed in the manner it is presented.

Network Waitaki Limited (Lines)
Statement of Financial Performance for the Year Ended 31 March 2002
REVENUE Note 2002 2001$ $
Operating revenueRevenue from line/access charges 7,385,600 8,861,138Revenue returned as Customer Discount (2,165,542) (1,963,784) Revenue from "Other" business for services carried out by the line business 0 0Interest on cash, bank balances and short term investments 355,442 371,631AC loss-rental rebates 434,495 427,655Other revenue not listed above
Capital Contributions 246,832 155,680Use of Money Interest 0 0Other 0 0
246,832 155,680
Total operating revenue 6,256,827 7,852,320
EXPENDITURE 2002 2001$ $
Operating expenditurePayment for transmission charges 2,050,764 2,897,659Transfer payments to the "Other" business for
Asset maintenance 3 685,205 480,543Consumer disconnection/reconnection services 0 0Meter data 0 0Consumer-based load control services 0 0Royalty and patent expenses 0 0Avoided transmission charges on account of own generation 0 0Other goods and services 0 0Total transfer payment to the "Other" business 685,205 480,543
Expense to entities that are not related parties forAsset maintenance 74,173 88,709Consumer disconnection/reconnection services 0 0Meter data 0 0Consumer-based load control services 0 0Royalty and patent expenses 0 0Total of specified expenses to non-related parties 74,173 88,709
Employee salaries, wages and redundancies 0 84,504Consumer billing and information system expense 19,200 37,633Depreciation on
System fixed assets 1,394,886 1,478,450Other assets 15,467 34,112Total depreciation 1,410,353 1,512,562
Amortisation ofGoodwill 0 0Other intangibles 0 0Total amortisation of intangibles 0 0
Corporate and administration 714,889 666,230Human resource expenses 0 19,366Marketing/advertising 7,756 3,700Merger and acquisition expenses 0 0Takeover defence expenses 0 0Research and development expenses 0 0Consultancy and legal expenses 5,992 30,837Donations 0 0Directors' fees 41,727 50,000Auditors' fees
Audit fees paid to principal auditors 11,056 19,000Audit fees paid to other auditors 0 0Fees paid for other services provided by principal and other auditors 0 0Total auditors' fees 11,056 19,000
Page 1

Statement of Financial Performance for the Year Ended 31 March 2002 - Continued
Note 2002 2001$ $
Costs of offering creditBad debts written off 0 0Increase in estimated doubtful debts 0 0Total cost of offering credit 0 0
Local authority rates expense 0 0AC loss-rentals (distribution to retailers/customers) expense 0 0Rebates to consumers due to ownership interest 0 0Subvention payments 0 0Unusual expenses 0 0Other expenditure not listed above 67,227 49,223Total operating expenditure 5,088,342 5,939,966
Operating surplus before interest and income tax 1,168,486 1,912,354
Interest expenseInterest expense on borrowings 0 0Financing charges related to finance leases 0 0Other interest expense 0 10,890Total interest expense 0 10,890
Operating surplus before income tax 1,168,486 1,901,464
Income tax 5 769,560 1,063,997
Net surplus after tax 398,926 837,467
Network Waitaki Limited (Lines)
Statement of Movements in Equity for the Year Ended 31 March 2002
Note 2002 2001$ $
Equity at the Beginning of the Year 43,739,990 42,887,368
Net Surplus (Deficit) for the Period 398,926 837,467Revaluation (1,560,000) 125,155Total Recognised Revenue and Expenses (1,161,075) 962,622Dividends Paid (45,000) (110,000)
Equity at the End of the Year 42,533,916 43,739,990
Page 2

Network Waitaki Limited (Lines)
Statement of Financial Position as at 31 March 2002
Note 2002 2001$ $
Current assetsCash and bank balances 431,651 230,613Short-term investments 6,250,000 5,070,000Inventories 91,258 135,634Accounts receivable 342,202 879,780GST 346 158,681Provisional Tax 319,971 276,029Other current assets 8,306 626
Total current assets 7,443,734 6,751,363
Fixed assetsSystem fixed assets 38,511,744 39,768,268Consumer billing and information system assets 0 0Motor vehicles 0 0Office equipment 0 0Land and buildings 0 0Capital works under construction (system fixed assets) 98,411 282,648Other fixed assets 14,904 25,285
Total fixed assets 38,625,059 40,076,201
Other tangible assets not listed above 0 0
Total tangible assets 46,068,793 46,827,564
Intangible assetsGoodwill 0 0Other intangibles 0 0
Total intangible assets 0 0
Total assets 46,068,793 46,827,564
Current liabilitiesBank overdraft 0 0Short-term borrowings 0 0Payables and accruals 996,733 851,510Provision for dividends payable 0 0Provision for taxation 0 0GST 0 0Other current liabilities 0 0
Total current liabilities 996,733 851,510
Non-current liabilitiesPayables and accruals 0 0Borrowings 0 0Deferred tax 6 2,538,144 2,236,064Other non-current liabilities 0 0
Total non-current liabilities 2,538,144 2,236,064
EquityShareholders' equity
Share capital 7,368,870 7,368,870Retained earnings 6,381,900 6,027,974Reserves 28,783,146 30,343,146
Total Shareholders' equity 42,533,916 43,739,990Minority interests in subsidiaries 0 0Total equity 42,533,916 43,739,990Capital notes 0 0Total capital funds 42,533,916 43,739,990
Total equity and liabilities 46,068,793 46,827,564
Page 3

Network Waitaki Limited (Lines)
Statement of Cash Flows for the Year Ended 31 March 2002
Note 2002 2001$ $
CASH FLOWS FROM OPERATING ACTIVITIESCash was provided from:
Receipts from Customers 8,581,470 9,406,454Interest 355,442 371,631GST 234,202 0Income Tax 0 0
Cash was disbursed to:Customer Discounts (2,165,542) (1,963,784)Payments to Suppliers (3,548,902) (3,867,877)Employees 0 (84,504)Income Tax (511,422) (1,043,408)GST 0 (247,481)FBT 0 (4,623)Interest Paid 0 (10,890)
NET CASH FLOWS FROM OPERATING ACTIVITIES 7 2,945,248 2,555,518
CASH FLOWS FROM INVESTING ACTIVITIESCash was provided from:
Proceeds from sales of Fixed Assets 0 230,307Collection on Loans 0 0
Cash was applied to:Cash Outflows for Fixed Assets (1,519,210) (1,619,199)Investments 0 0
NET CASH FLOWS FROM INVESTING ACTIVITIES (1,519,210) (1,388,892)
CASH FLOWS FROM FINANCING ACTIVITIESCash was provided from:
Loan transferred from other activities 0 0Cash was applied to:
Dividend paid (45,000) (110,000)Loan repaid 0 0
NET CASH FLOWS FROM FINANCING ACTIVITIES (45,000) (110,000)
NET INCREASE (DECREASE) IN CASH HELD 1,381,038 1,056,626Add Opening Cash Brought Forward 5,300,613 4,243,987Equity Transferred From (To) Other 0 0
ENDING CASH CARRIED FORWARD 6,681,651 5,300,613
Page 4

Page 5
Network Waitaki Limited (Lines)
Notes to and Forming Part of the Financial Statementsfor the Year Ending 31 March 2002
1. Statement of Accounting Policies
a) Reporting Entity(i) The Financial Statements presented here are for the Line Business of Network
Waitaki Limited.(ii) The Financial Statements have been prepared in accordance with the Companies Act
1993 and the Financial Reporting Act 1993.(iii) These financial statements have been prepared for the purpose of complying with the
requirements of the Electricity (Information Disclosure) Regulations 1999, asamended by the Electricity (Information Disclosure) Amendment Regulations 2000and the Electricity (Information Disclosure) Amendment Regulations 2001.
(iv) The Line Business operates a line business activity, as defined by Regulation 2 of theElectricity (Information Disclosure) Regulations, in the Waitaki area.
b) Measurement Base(i) The Financial Statements have been prepared on the basis of Historical Cost with the
exception of certain items for which specific accounting policies are identified.(ii) Accrual accounting is used to match expenses and revenues.(iii) Reliance is placed on the fact that the Company is a going concern.
c) Accounting Policies(i) Accounts Receivable are shown at expected realisable value after providing for
doubtful debts.(ii) Inventories are valued at the lower of cost or net realisable value. Serial numbered
stock is recorded at the appropriate individual value, while other stock is recorded atweighted average cost.
(iii) Fixed assets• The network system assets are revalued at least every three years by
independent valuers to Optimised Deprival Value (ODV) – the lower of OptimisedDepreciated Replacement Cost and Economic Value. The last revaluation wasundertaken as at 31 March 2001.
• All other assets are valued at cost less accumulated depreciation:Radio Equipment 15 yrs SL Buildings 40-100 yrs SLDistribution System 40-70 yrs SL Office Equipment 12%-50% DVSubstation Transformers etc 50 yrs SL Plant & Machinery 10%-50% DVSubstation Load Control 20 Yrs SLDistribution Transformers 40 yrs SL
(iv) These accounts are exclusive of GST except for Accounts Receivable and AccountsPayable.
(v) Income tax expense has been calculated using the liability method. Tax effectaccounting is applied on a comprehensive basis to all timing differences. A debitbalance in the deferred tax account, arising from timing differences or income taxbenefits from income tax losses, is recognised only if there is virtual certainty ofrealisation.
(vi) Investments are stated at cost.(vii) Contributions received toward Capital Works are recorded in the Statement of
Financial Performance and shown as income earned in the year in which they arereceived.
d) Changes in Accounting Policy: There have been no changes in accounting policies.e) Methodology of Separation of Business: The basis of allocation adopted is the avoidable
cost methodology.

Page 6
2. Commitments and Contingent Liabilities
There were capital commitments at 31 March 2002 of $298,120 (2001 $103,046). The LinesBusiness has no contingent liabilities at the end of the period (2001 Nil).
3. Related Party TransactionsAssociated Entity: Networks South Limited
Networks South Limited is 50% owned by Network Waitaki Limited and providedadministrative, engineering and planning functions for the network from 1 April 2001 to 31March 2002. These services are charged on a fixed contract basis.During the period, this charge totalled $712,501. The outstanding amount as at 31 March2002 was $235 payable on normal commercial terms.No debts were written off or forgiven and no transactions took place at nil or nominal value.Transactions do not relate to the categories specified in the Disclosure Regulations.
Associated Entity: NetCon LimitedNetCon is wholly owned by Networks South Limited and provided asset maintenance andconstruction services for the network from 1 April 2001 to 31 March 2002. Services werecharged on both a fixed price basis or “time and materials” basis.During the period, this charge totalled $1,434,621. The outstanding amount as at 31 March2002 was $266,903 payable on normal commercial terms.No debts were written off or forgiven and no transactions took place at nil or nominal value.During the period capital construction transactions totalled the following:
Year to31/3/2002
9 Months to31/3/2001
Subtransmission assets $10,901 $10,368Zone substations $49,300 $67,956Distribution lines $310,861 $307,989Medium voltage switchgear $96,735 $137,834Distribution transformers $7,554 $0Distribution substations $49,842 $38,934Low voltage lines $149,041 $41,486Other System Fixed Assets $75,182 $64,893
Other transactions totalled:Maintenance of System Fixed Assets $685,205 $316,256Cost of customer connections and disconnections $0 $0
Internal Division: Network Waitaki Contracting (for prior year comparison only)Network Waitaki Limited operated an internal contracting division that provided assetmaintenance and construction services for the period to 30 June 2000 and it was dissolvedon this date. Services were charged on both a fixed price basis or “time and materials”basis.During the period capital construction transactions totalled the following:
3 Months to30/6/2000
Subtransmission assets $0Zone substations $7,285Distribution lines $204,259Medium voltage switchgear $0Distribution transformers $68,085Distribution substations $3,884Low voltage lines $5,411Other System Fixed Assets $27,125
Maintenance of System Fixed Assets $164,287Cost of customer connections and disconnections $0
Page 7
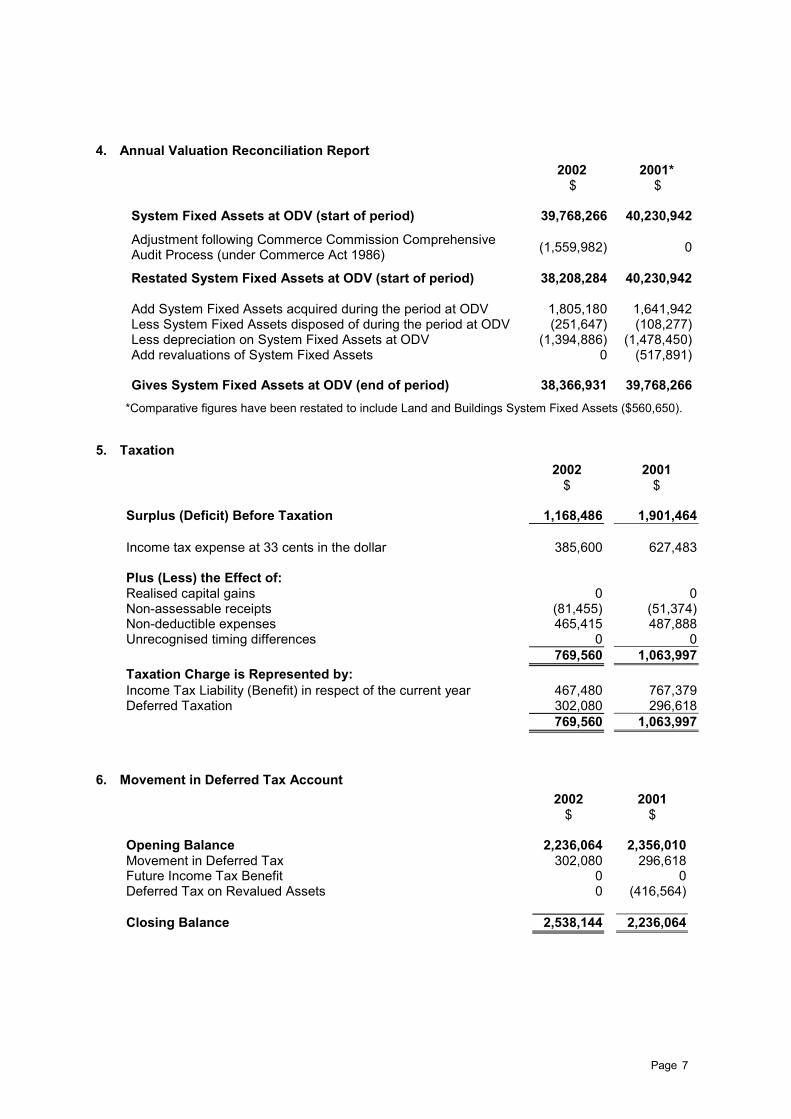
4. Annual Valuation Reconciliation Report2002 2001*
$ $
System Fixed Assets at ODV (start of period) 39,768,266 40,230,942
Adjustment following Commerce Commission ComprehensiveAudit Process (under Commerce Act 1986) (1,559,982) 0
Restated System Fixed Assets at ODV (start of period) 38,208,284 40,230,942
Add System Fixed Assets acquired during the period at ODV 1,805,180 1,641,942Less System Fixed Assets disposed of during the period at ODV (251,647) (108,277)Less depreciation on System Fixed Assets at ODV (1,394,886) (1,478,450)Add revaluations of System Fixed Assets 0 (517,891)
Gives System Fixed Assets at ODV (end of period) 38,366,931 39,768,266*Comparative figures have been restated to include Land and Buildings System Fixed Assets ($560,650).
5. Taxation2002 2001
$ $
Surplus (Deficit) Before Taxation 1,168,486 1,901,464
Income tax expense at 33 cents in the dollar 385,600 627,483
Plus (Less) the Effect of:Realised capital gains 0 0Non-assessable receipts (81,455) (51,374)Non-deductible expenses 465,415 487,888Unrecognised timing differences 0 0
769,560 1,063,997Taxation Charge is Represented by:Income Tax Liability (Benefit) in respect of the current year 467,480 767,379Deferred Taxation 302,080 296,618
769,560 1,063,997
6. Movement in Deferred Tax Account2002 2001
$ $
Opening Balance 2,236,064 2,356,010Movement in Deferred Tax 302,080 296,618Future Income Tax Benefit 0 0Deferred Tax on Revalued Assets 0 (416,564)
Closing Balance 2,538,144 2,236,064

Page 8
7. Reconciliation of Net Surplus (Deficit) after Taxation with Net Cash Flow from OperatingActivities
2002 2001$ $
Surplus after Taxation 398,926 837,467
Add Non-cash ItemsDepreciation 1,410,353 1,512,562Asset Revaluation 0 0Deferred Tax 302,080 296,618Transfers 0 0
1,712,433 1,809,180
Add (Less) Movements in Working Capital ItemsAccounts Receivable 529,898 (38,019)Inventories 44,376 (83,804)GST 158,335 (247,481)Tax Asset (43,942) (276,029)Other Current Assets 0 968Payables and Accruals 145,222 582,652Other Current Liabilities 0 (29,416)
833,889 (91,129)
2,945,248 2,555,518

Network Waitaki Limited (Lines)
Financial Performance Measures - 31 March2002 2001 2000 1999
Accounting return on funds 2.09% 3.79% 6.39% 2.93%
Accounting return on equity 0.93% 1.94% 4.14% 1.72%
Accounting return on investments 4.20% 0.28% 4.38% 1.77%
Efficiency Performance Measures - 31 March2002 2001 2000 1999
Direct line costs per kilometre $717.43 $676.30 $640.25 $525.45
Direct expenditure $1,370,989 $1,285,824 $1,212,534 $990,589System length (km) 1,910.98 1,901.27 1,893.85 1,885.22
Indirect line costs per consumer* $22.60 $21.45 $42.21 $41.18
Indirect expenditure $256,336 $243,921 $481,522 $468,786Total consumers 11,341 11,372** 11,409** 11,385**
Energy Delivery Efficiency Performance Measures - 31 March2002 2001 2000 1999
Load Factor (= a/b/c x 100) 70.41% 63.50% 70.28% 64.25%
a = kWh of electricity entering system 179,024,561 174,420,448* 177,930,085* 168,982,164*b = Maximum Demand (kW) 29,026 31,356* 28,824* 30,024*c = Total number of hours 8,760 8,760 8,784 8,760
Loss Ratio (= a/b x 100) 6.28% 7.89% 5.65% 6.12%
a = Total Electricity lost in the Network (kWh) 11,239,979 13,762,867 10,060,459 10,341,540b = Total Electricity entering the Network before losses (kWh) 179,024,561 174,420,448* 177,930,085* 168,982,164*
Capacity Utilisation (= a/b x 100) 23.20% 25.98% 24.52% 25.57%
a = Maximum Demand (kW) 29,026 31,356* 28,824* 30,024*b = Transformer Capacity (kVA) 125,113 120,693 117,570 117,428
* Demand and usage levels have been re-stated based on actual metered amounts.** Comparative figures have been re-stated based on 'total consumers' rather than 'total connections' (which included de-energised connections).
Page 9

Network Waitaki Limited (Lines)
Network Statistics - 31 March2002 2001 2000 1999
33kV 138.13 138.12 138.12 138.12Total System Length (kms) 11kV 1,554.33 1,543.61 1,538.00 1,530.01
230/400 V 218.52 219.54 217.73 217.09Total 1,910.98 1,901.27 1,893.85 1,885.2233kV 137.85 137.84 137.84 137.84
Overhead Circuit Length (kms) 11kV 1,522.80 1,515.06 1,518.52 1,510.61230/400 V 192.36 193.37 187.53 187.57Total 1,853.00 1,846.27 1,843.89 1,836.0233kV 0.28 0.28 0.28 0.28
Underground Circuit Length (kms) 11kV 31.54 28.56 19.49 19.40230/400 V 26.16 26.17 30.20 29.52Total 57.98 55.00 49.96 49.20
Transformer Capacity (kVA) 11,000/400V 124,988 120,568 117,445 117,30333,000/400V 125 125 125 125Total 125,113 120,693 117,570 117,428
Maximum Demand (kW) 29,026 31,356* 28,824* 30,024*
Total Electricity entering the Network- before losses (kWh)
175,814,935 179,024,561* 174,420,448* 177,930,085*
Retailer A 134,961,945 122,868,367^ 134,251,417^ 151,970,389^Retailer B 13,792,718 25,881,199^ 24,331,042^ 13,683,664^Retailer C 0 0 0 679,530^Retailer D 0 0 0 1,156,898^Retailer E 10,695,532 10,429,825^ 3,056,287^ 98,064^Retailer F 3,616,764 5,319,863^ 2,627,240^ 0Retailer G 1,120,555 755,202^ 94,003^ 0Retailer H 387,442 7,238^ 0 0Total 164,574,956 165,261,694 164,359,989 167,588,545
Total number of Consumers Number 11,341 11,372** 11,409** 11,385**
^ Restated to exclude losses
Amount of electricity supplied from the system (kWh)
** Number of Consumers has been re-stated to exclude sites that were de-energised.* Demand and usage levels have been re-stated based on actual metered amounts.
Page 10

Network Waitaki Limited (Lines)
Reliability and Performance Measures
Interruptions Class2003/07(Target)
2003(Target)
2002 2001 2000 1999
Number of InterruptionsClass A 0 0 0 0 0 0
Planned Interruptions Class B 24 24 70 28 9 8Unplanned Interruptions Class C 80 80 75 79 49 76
Class D 0 0 0 0 0 0Class E - I 0 0 0 0 0 0
Total 104 104 145 107 58 84
Proportion of Total Class C Interruptions not restored:Within 3 Hours 8.1% 5.1% 6.1% 7.9%
Within 24 Hours 0.0% 0.0% 0.0% 0.0%
Faults Voltage2003/07(Target)
2003(Target)
2002 2001 2000 1999
Overall SystemFaults per 100 circuit kilometres of prescribed voltage electric line
0.84 0.84 4.43 4.70 2.92 4.56
33kV 0.72 0.72 0.72 0.72 0.00 0.7211kV 0.85 0.85 4.76 5.05 3.19 4.90
OverheadFaults per 100 circuit kilometres of prescribed voltage electric line
4.46 4.78 2.90 4.49
33kV 0.73 0.73 0.00 0.7311kV 4.79 5.15 3.16 4.83
UndergroundFaults per 100 circuit kilometres of prescribed voltage electric line
3.14 0.00 5.06 10.16
33kV 0.00 0.00 0.00 0.0011kV 3.17 0.00 5.13 10.31
Faults per 100 circuit kilometres
Faults per 100 circuit kilometres
Faults per 100 circuit kilometres
Page 11

Network Waitaki Limited (Lines)
Reliability and Performance Measures
System Average Interruption Duration Index (SAIDI)*
Class2003/07(Target)
2003(Target)
2002 2001 2000 1999
SAIDI for total number of interruptions Overall 80 80 78.1 72.2 46.1 63.3
Class A 0.0 0.0 0.0 0.0Class B 30 30 34.6 16.7 1.9 12.7Class C 50 50 43.5 55.5 44.2 50.6Class D 0.0 0.0 0.0 0.0
Class E - I 0.0 0.0 0.0 0.0
Class A 0 0 0 0Class B 330,000 336,000 392,644 189,510 21,820 144,362Class C 550,000 560,000 493,454 631,089 504,490 576,081Class D 0 0 0 0
Class E - I 0 0 0 0
b = Total Consumers 11,000 11,200 11,341 11,372 11,409 11,385
System Average Interruption Frequency Index (SAIFI)*
Class2003/07(Target)
2003(Target)
2002 2001 2000 1999
SAIFI for total number of interruptions Overall 0.95 0.95 1.00 1.03 0.86 1.39
Class A 0.00 0.00 0.00 0.00 0.00 0.00Class B 0.12 0.12 0.20 0.12 0.01 0.06Class C 0.83 0.83 0.80 0.90 0.85 1.32Class D 0.00 0.00 0.00 0.00 0.00 0.00
Class E - I 0.00 0.00 0.00 0.00
Class A 0 0 0 0 0 0Class B 1,320 1,344 2,293 1,380 169 711Class C 9,130 9,296 9,019 10,279 9,663 15,057Class D 0 0 0 0 0 0
Class E - I 0 0 0 0
b = Total Consumers 11,000 11,200 11,341 11,372 11,409 11,385
Connection Average Interruption Duration Index (CAIDI)*
Class2003/07(Target)
2003(Target)
2002 2001 2000 1999
CAIDI for total number of interruptions Overall 84 84 78.33 70.38 53.53 45.69
Class A 0.00 0.00 0.00 0.00Class B 250 250 171.24 137.33 129.14 202.94Class C 60 60 54.71 61.40 52.21 38.26Class D 0.00 0.00 0.00 0.00
Classes E-I 0.00 0.00 0.00 0.00
* Comparative figures have been re-stated based on 'total consumers' rather than 'total connections' (which included de-energised connections).
SAIDI for total number of interruptions within each interruption class (= a/b)
a = sum of interruption duration factors for all interruptions within the particular interruption class
SAIFI for total number of interruptions within each interruption class (= a/b)
a = sum of electricity consumers affected by all interruptions
CAIDI for total number of interruptions within each interruption class
Page 12

Network Waitaki Limited (Lines)FORM FOR THE DERIVATION OF FINANCIAL PERFORMANCE MEASURES FROM FINANCIAL STATEMENTS
Derivation TableInput and
CalculationsSymbol
Operating surplus before interest and income tax from financial statements 1,168,486
Operating surplus before interest and income tax adjusted pursuant to regulation 18 (OSBIIT) 1,168,486
Interest on cash, bank balances, and short-term investments (ISTI) 355,442
OSBIIT minus ISTI 813,044 a 813,044 813,044
Net surplus after tax from financial statements 398,926
Net surplus after tax adjusted pursuant to regulation 18 (NSAT) 398,926 n 398,926
Amortisation of goodwill and amortisation of other intangibles 0 g add 0 add 0 add 0
Subvention payment 0 s add 0 add 0 add 0
Depreciation of SFA at BV (x) 1,394,886
Depreciation of SFA at ODV (y) 1,394,886
ODV depreciation adjustment 0 d add 0 add 0 add 0
Subvention payment tax adjustment 0 s*t deduct 0 deduct 0
Interest tax shield 0 q deduct 0
Revaluations 1,560,000 r add 1,560,000
Income tax 769,560 p deduct 769,560
Numerator 813,044 398,926 1,603,484
OSBIITADJ = a + g + s + d NSATADJ = n + g + s - s*t + d OSBIITADJ = a + g - q + r + s + d - p - s*tFixed assets at end of previous financial year (FA0) 40,076,201
Fixed assets at end of current financial year (FA1) 38,625,059
Adjusted net working capital at end of previous financial year (ANWC0) 323,211
Adjusted net working capital at end of current financial year (ANWC1) -554,621
Average total funds employed (ATFE) 39,234,925 c 39,234,925 39,234,925
Total equity at end of previous financial year (TE0) 43,739,990
Total equity at end of current financial year (TE1) 42,533,916
Average total equity 43,136,953 k 43,136,953
WUC at end of previous financial year (WUC0) 282,648
WUC at end of current financial year (WUC1) 98,411
Average total works under construction 190,530 e deduct 190,530 deduct 190,530 deduct 190,530
Revaluations 1,560,000 r
Half of revaluations 780,000 r/2 deduct 780,000
Intangible assets at end of previous financial year (IA0) 0
Intangible assets at end of current financial year (IA1) 0
Average total intangible asset 0 m add 0
Subvention payment at end of previous financial year (S0) 0
Subvention payment at end of current financial year (S1) 0
Subvention payment tax adjustment at end of previous financial year 0
Subvention payment tax adjustment at end of current financial year 0
Average subvention payment & related tax adjustment 0 v add 0
System fixed assets at end of previous financial year at book value (SFAbv0) 39,768,268
System fixed assets at end of current financial year at book value (SFAbv1) 38,511,744
Average value of system fixed assets at book value 39,140,006 f deduct 39,140,006 deduct 39,140,006 deduct 39,140,006
System Fixed assets at year beginning at ODV value (SFAodv0) 39,768,266
System Fixed assets at end of current financial year at ODV value (SFAodv1) 38,366,931
Average value of system fixed assets at ODV value 39,067,599 h add 39,067,599 add 39,067,599 add 39,067,599
Denominator 38,971,988 42,874,016 38,191,988
ATFEADJ = c - e - f + h Ave TEADJ = k - e - m + v - f + h ATFEADJ = c - e - ½r - f + h
Financial Performance Measure: 2.09 0.93 4.20
ROF = OSBIITADJ/ATFEADJ x 100 ROE = NSATADJ/ATEADJ x 100 ROI = OSBIITADJ/ATFEADJ x 100
ROF ROE ROI
t = maximum statutory income tax rate applying to corporate entities bv = book value ave = average odv = optimised deprival valuation subscript '0' = end of the previous financial yearsubscript '1' = end of the current financial year ROF = return on funds ROE = return on equity ROI = return on investment
Page 13

Explanation of Terms
Generalkm kilometreskV kilovoltskVA kilovolt ampereskW kilowattskWh kilowatt hours (also referred to as units)
ODV Optimised Deprival ValuationGXP Grid Exit Point
Reliability and Performance MeasuresClass A planned interruptions by Transpower.Class B planned interruptions by Network Waitaki.Class C unplanned interruptions by Network Waitaki.Class D unplanned interruptions by Transpower.Class E unplanned interruptions on ‘generation’ lines used by Network Waitaki.Class F unplanned interruptions on ‘generation’ lines used by another line owner.Class G unplanned interruptions caused by another line owner.Class H planned interruptions caused by another line owner.Class I an interruption not referred to in Classes A to H.

Certificate of Financial Statements, Performance Measures, and StatisticsDisclosed by Line Owners other than Transpower
We, Lindsay Mitchell Malcolm and Anthony John Brady, Directors of Network Waitaki Limited certifythat, having made all reasonable enquiry, to the best of our knowledge,
(a) the attached audited financial statements of Network Waitaki Limited prepared for thepurposes of regulation 6 of the Electricity (Information Disclosure) Regulations 1999comply with the requirements of those regulations; and
(b) the attached information, being the derivation table, financial performance measures,efficiency performance measures, statistics, and reliability performance measures inrelation to Network Waitaki Limited, and having been prepared for the purpose ofregulations 15, 16, 21, and 22 of the Electricity (Information Disclosure) Regulations1999 comply with the requirements of those regulations.
The valuations on which those financial performance measures are based are as at 31 March 2001.
Lindsay Mitchell Malcolm Anthony John Brady
12 August 2002

Certification of Valuation Report of Line Owners(Adjusted following Commerce Commission Comprehensive Audit Process
under the Commerce Act 1986)
We, Lindsay Mitchell Malcolm and Anthony John Brady, Directors of Network Waitaki Limited certifythat, having made all reasonable enquiry, to the best of our knowledge,
(a) the attached valuation report of Network Waitaki Limited, prepared for the purposes ofregulation 20 of the Electricity (Information Disclosure) Regulations 1999, complieswith the requirements of those regulation; and
(b) the replacement cost of the line business system fixed assets of Network Waitaki is$77,601,604; and
(c) The depreciated replacement cost of the line business system fixed assets of NetworkWaitaki is $38,919,769; and
(d) The optimised depreciated replacement cost of the line business system fixed assetsof Network Waitaki is $38,208,284; and
(e) The optimised deprival valuation of the line business system fixed assets of NetworkWaitaki is $38,208,284; and
(f) The values in paragraphs (b) through to (e) have been prepared in accordance withthe ODV Handbook.
These valuations are as at 31 March 2001.
Lindsay Mitchell Malcolm Anthony John Brady
12 August 2002


Auditors’ Opinion of Performance Measures
Network Waitaki Limited – Lines Business
We have examined the attached information, being –
(a) the derivation table in regulation 16; and(b) the annual ODV reconciliation report in regulation 16A; and(c) the financial performance measures in clause 1 of Part 3 of Schedule 1; and(d) the financial components of the efficiency performance measures in clause 2 of Part 3 of Schedule 1, -
that were prepared by Network Waitaki Limited – Lines Business and dated 9 August 2002 for the purposesof regulation 15 of the Electricity (Information Disclosure) Regulations 1999 (as amended).
In our opinion, having made all reasonable enquiry, to the best of our knowledge, that information has beenprepared in accordance with the Electricity (Information Disclosure) Regulations 1999 (as amended).

Auditors’ ReportTo the readers of the financial statements of Network Waitaki Limited – Lines Business
We have audited the accompanying financial statements of Network Waitaki Limited – Lines Business. Thefinancial statements provide information about the past financial performance and cash flows of NetworkWaitaki Limited – Lines Business and its financial position as at 31 March 2002. This information is stated inaccordance with the accounting policies set out in the Statement of Accounting Policies.
Directors’ ResponsibilitiesThe Electricity (Information Disclosure) Regulations 1999 require the Directors to prepare financial statementswhich give a true and fair view of the financial position of Network Waitaki Limited – Lines Business as at 31March 2002, and the results of operations and cash flows for the year then ended.
Auditor’s ResponsibilitiesIt is our responsibility to express an independent opinion on the financial statements presented by the Directorsand report our opinion to you.
Basis of OpinionAn audit includes examining, on a test basis, evidence relevant to the amounts and disclosures in the financialstatements. It also includes assessing –• the significant estimates and judgements made by the Directors in the preparation of the financial statements;
and• whether the accounting policies are appropriate to Network Waitaki Limited – Lines Business’
circumstances, consistently applied and adequately disclosed.
We conducted our audit in accordance with generally accepted auditing standards in New Zealand. We plannedand performed our audit so as to obtain all the information and explanations which we considered necessary toprovide us with sufficient evidence to give reasonable assurance that the financial statements are free frommaterial misstatements, whether caused by fraud or error. In forming our opinion we also evaluated the overalladequacy of the presentation of information in the financial statements.
Other than in our capacities as auditors we have no relationship with or interests in Network Waitaki Limited.
Unqualified OpinionWe have obtained all the information and explanations we have required.
In our opinion:(a) proper accounting records have been kept by Network Waitaki Limited as far as appears from our
examination of those records; and(b) the financial statements referred to above:
(i) comply with generally accepted accounting practice; and (ii) give a true and fair view of the financial position of Network Waitaki Limited – Lines Business as
at 31 March 2002 and the results of its operations and cash flows for the year then ended; and(iii) comply with the Electricity (Information Disclosure) Regulations 1999.
Our audit was completed on 9 August 2002 and our unqualified opinion is expressed as at that date.