Embed Size (px)
Citation preview

Markets Insight Opportunities in Water Technologies October 2015 Samrat P. Karnik Managing Director

Macro Review

Introduction and Executive Summary This water sector review focuses on the opportunities within the water technologies / solutions sectors
The key themes developed in the following pages are as follows:
- Price of water will be an enabler: Price will continue to migrate towards true cost of delivery and help investment
- All water sub-sectors are not equal: Demand dynamics, customer pain points, mode of delivery, etc. carry greater weight
- Industrial and AG markets preferred longer term: Expect better growth, absorption of new technologies and profit margins
- Fundamentals are strong: EBITDA margins are at record levels and revenue growth returning to long-term averages
- Performance drives value creation: Strong correlation to sub-sector growth, margins and long-term value creation
- Innovation expected to be robust: Focus will be on water reuse, desalination, “smart water” and nutrient recovery
- Institutional capital will play a role: While VCs have severely dialed back investment activity, dedicated water PE funds and individuals with interest in water will continue to play a role with firms such as Excellere Partners posting big successes
- M&A to play a key role in corporate growth: Development of new technologies by emerging companies, the need to expand geographic footprints and/or expand product /solution portfolios to offer comprehensive solutions to customers, and the need to consolidate fragmented subsectors will be key drivers for M&A activity
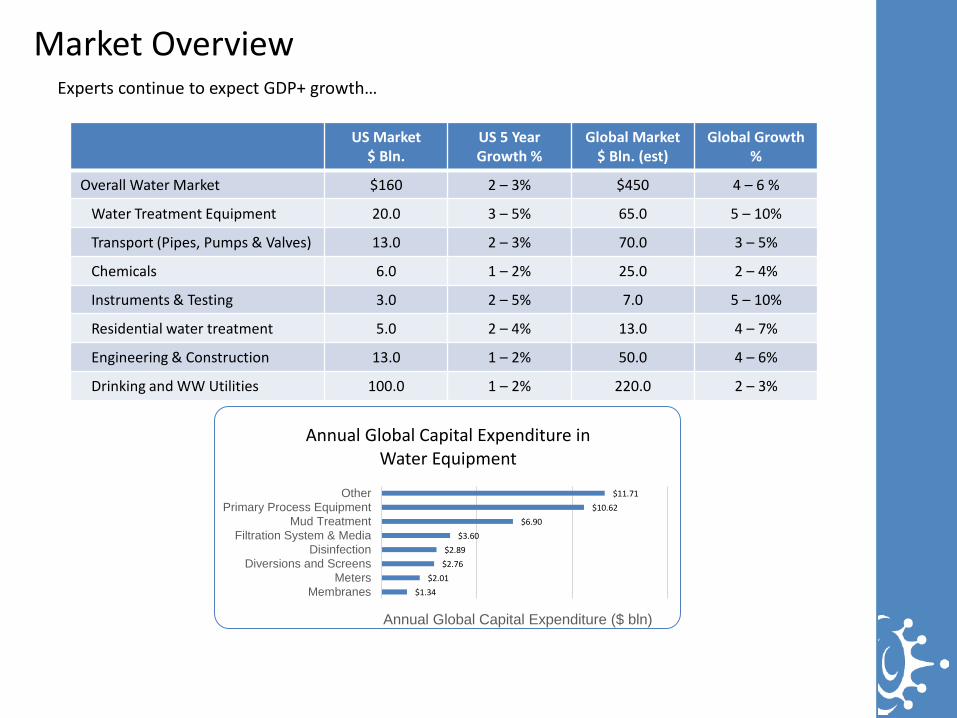
Market Overview Experts continue to expect GDP+ growth…
US Market $ Bln.
US 5 Year Growth %
Global Market $ Bln. (est)
Global Growth %
Overall Water Market $160 2 – 3% $450 4 – 6 %
Water Treatment Equipment 20.0 3 – 5% 65.0 5 – 10%
Transport (Pipes, Pumps & Valves) 13.0 2 – 3% 70.0 3 – 5%
Chemicals 6.0 1 – 2% 25.0 2 – 4%
Instruments & Testing 3.0 2 – 5% 7.0 5 – 10%
Residential water treatment 5.0 2 – 4% 13.0 4 – 7%
Engineering & Construction 13.0 1 – 2% 50.0 4 – 6%
Drinking and WW Utilities 100.0 1 – 2% 220.0 2 – 3%
$1.34 $2.01
$2.76 $2.89
$3.60 $6.90
$10.62 $11.71
MembranesMeters
Diversions and ScreensDisinfection
Filtration System & MediaMud Treatment
Primary Process EquipmentOther
Annual Global Capital Expenditure ($ bln)
Annual Global Capital Expenditure in Water Equipment

Four Key Demand Drivers for Technology
3.0x
to 4
.0x
Incr
ease
In W
ater
Tech
nolo
gy /
Sol
utio
ns
Mar
ket?
2013 2030
It is conceivable that the c. $150 billion global market for water technologies and solutions could grow at over 5.0% CAGR over the next couple of decades given baseline volume growth of 3.0% supplemented by gradual transition to market price, regulation, and stress on efficiency to reduce energy and O&M costs.
$150 Bln. Est. Mrkt. for Water
Technology

Investment “Heat Map” for Technology Companies
Engineering Transport & Storage Treatment Test, Monitoring &
Control
Design
Engineer
Build
Own
Operate
Transport
Storage
Pumps
Valves
Screens
Pipes
Absorbents
Tanks
Harvesting
Drinking Water
Waste water
Applied Water
Primary
Membranes
UV & Ozone
Chemicals
RO / Barrier
Desalination
Recovery
Oil & Gas
Industrial
Bld. / HVAC
Irrigation
Bio-mimicry
Field Sampling
Online
Laboratory
Automation / Control
Asset Inspection
Remote Monitoring
SaaS
Growth companies
Legend On Investment Types
In-line; mature companies
Flat or at risk segments
High growth / emerging

Key Non-Municipal Growth End-Markets
Agriculture Marine – Ballast H20 Power Generation Produced Water
Water to oil ratio (WOR) expected to increase from 2.5x to 5.0x on the back of unconventional production
Equipment portion expected to grow from $0.7 Bln to $2.9 Bln. by 2025, as part of a $10 billion market
More legislation on water use and treatment expected (Prop 6 in TX)
Largely a logistics business opportunity
Given water is the biggest cost component, technologies that reduce water costs should benefit
However, strong near-term headwinds
~ 40% of water consumption for industrial applications in OECD countries is for energy generation (it is the second largest user after ag)
In contrast, in developing countries, only 8.0% is used in power production
Sets the stage for large demand growth
Regulation driven: Significant focus on curtailing use and improving the quality of returned water
Increased regulations with three rules being proposed by the EPA
70% to 80% use Gravity feeding highly
inefficient resulting in excess water, fertilizer use, and lower crop yield
In Asia, only 4% land is micro- or drip- irrigated vs. nearly 40% in the US and 14% on a global basis
Immense opportunity as farms convert
Countries like India showing success
Focus on curtailing use and pollutants
However, some products have been commoditized
Opportunity created by regulation to protect marine life
If fully put into effect, potential $34B dollar opportunity from 2010 to 2020 (over 57,000 vessels) to convert all ships
Proposed IMO requires ships to treat ballast water before returning it to the ocean

Sector Performance
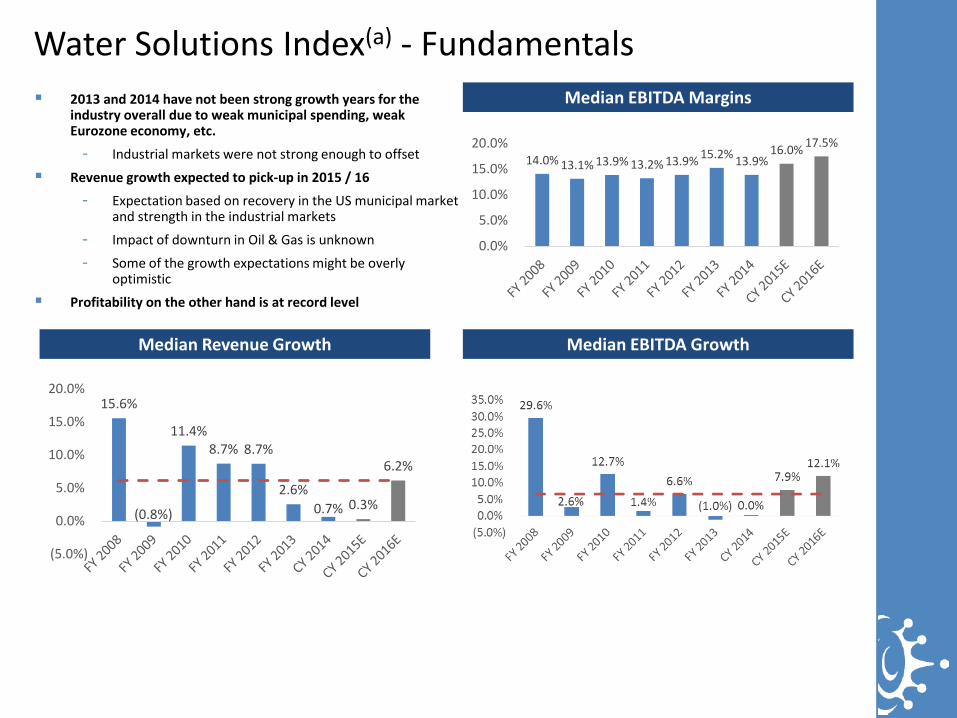
Water Solutions Index(a) - Fundamentals
2013 and 2014 have not been strong growth years for the industry overall due to weak municipal spending, weak Eurozone economy, etc.
- Industrial markets were not strong enough to offset
Revenue growth expected to pick-up in 2015 / 16
- Expectation based on recovery in the US municipal market and strength in the industrial markets
- Impact of downturn in Oil & Gas is unknown
- Some of the growth expectations might be overly optimistic
Profitability on the other hand is at record level
Median EBITDA Margins
Median EBITDA Growth Median Revenue Growth
14.0% 13.1% 13.9% 13.2% 13.9% 15.2% 13.9% 16.0% 17.5%
0.0%
5.0%
10.0%
15.0%
20.0%
15.6%
(0.8%)
11.4% 8.7% 8.7%
2.6% 0.7% 0.3%
6.2%
(5.0%)
0.0%
5.0%
10.0%
15.0%
20.0%

Water Solutions Index – Valuation Performance
The S&P Global Water Index has by and large kept pace with the industrial and S&P 500 benchmarks - Municipal spending issues in North America and
Europe have negatively impacted sales growth Valuation on both revenue and EBITDA basis are either at
or above pre-recession levels - This is in part due to general market bullishness seen in
2013 and 2014; and - In part due to a persistent sense of optimism in the
investor community about the growth potential of the water sector (despite near term earnings issues)
3 Year Water Index Performance
Median EV/EBITDA Median EV / Revenue

Water Technology Valuation Continuum
While the graphic provides a directional sense, company specific factors such as size, IP, end-markets, growth expectations, profitability, management, etc. are overriding factors
LOW < ----- Technology Differentiation, Cost of Failure, ROI and Expected Growth --- > HIGH
Tank
s
5 x
10 x
15 x Pi
pes
Prim
ary
Equi
p.
Pum
ps Au
tom
atio
n
Test
/ In
stru
men
ts
Desa
linat
ion
Mem
bran
es /
RO
Disin
fect
ion
Valv
es
Chem
ical
s
EV /
EBIT
DA
Smar
t Wat
er

Investment Activity

Desalination and Brackish Water
Intensification of Treatment
Resource and Nutrient Recovery
Reduced Chemical Use
Smart Water
Water for Unconventional
Oil & Gas
New Business Models and Partnerships
Extensive focus on reducing energy consumption of the process, which is the largest cost Two traditional technologies (evaporation and RO) reaching theoretical maximum Expect innovations from inside and outside the industry, and use of renewable energy
Urban density will require plants to handle greater flow rates with ever smaller footprints
Large market opportunities in densely packed Asian cities where growth is the strongest
One of the best options to reduce compliance costs and increase asset ROIs Recovery of nutrients and / or gas are the two areas most advanced New delivery / service models similar to the solid waste or power industry emerging
For both compliance and cost purposes Primarily for municipal and in applied water Focus mainly in OECD countries
Enabling technology to manage demand, reduce energy consumption, increase supply, curtail O&M costs, prevent system failures and reduce asset intensity
Investment and adoption necessary to improve ROI and prevent system failure Most likely to fundamentally alter how water infrastructure is managed
Regulatory mandates on contaminants and level of use to drive treatment and re-use Companies focused on applying desalination for brackish water and / or water reuse
New models evolving that help reduce use, lower capital costs, and manage risks Areas where new business models are most likely are in (i) nutrient recovery, (ii) energy
recovery, (iii) monitoring / remote data collection, and (iv) risk mitigation / management
Key Focus Areas for Innovation in Water

CY 2014 witnessed modest water sector M&A activity with eight transactions for roughly $600 million in enterprise value
Some of the notable transactions were:
- Kurita Water’s acquisition of B.K. Giulini’s Performance Products business for c. $300 million:
- The acquisition enables Kurita to strengthen its overseas business platform mainly in Europe - Kurita expects to generate synergy, with its technologies and products and those of the acquired business
- LG Chem’s acquisition of NanoH2O for $200 million:
- Accelerates the delivery of innovative and energy-efficient membrane technologies to the desalination industry by benefiting from LG Chem’s distribution and capital resources
- Strengthens LG Chem’s IP for desalination and RO membranes
10 Year Water Solutions M&A Activity (excludes Water Utilities)
$566
$1,497
$25
$8,989
$51 $398 $268
$1,554
$12,702
$7,434
$4,455
0
2
4
6
8
10
12
14
$0
$2,000
$4,000
$6,000
$8,000
$10,000
$12,000
$14,000
Deal
Vol
ume
Mill
ions
Source: CleanTech Group
Water Sector M&A Activity

NanoH2O (VC) U.S. Water Service (PE)
• Date: March 14, 2014
• Transaction Value: $200 million; estimated at over 10.0x actual revenue
• Buyer Description: LG Chem is a diversified chemical company
• Seller Description: NanoH20 provides advanced reverse osmosis (RO) membranes that lower the cost of desalination
• Rationale
• Strengthened LG Chem’s IP for desalination and RO membranes
• Provides LG an immediately strengthened position in the high-growth desalination market through ownership of a leading, emerging technology company
• Provided a c. 2.0x return on total invested VC capital; not the greatest in the land of venture capital investments by a far stretch, but a rare example of a successful exit for a VC investment in the water sector
• Date: January 27, 2015
• Transaction Value: $190 million
• Buyer description: Allete is an American utility and energy company
• Seller description: US Water Service provides integrated water management for industrial processes / applications
• Under Excellere’s ownership, the company had grown c. 3.5x in revenues and c. 4.0x in EBITDA through seven acquisitions and 20% year-on-year organic growth
• Rationale:
• Allete wanted to diversity into unregulated businesses to increase shareholder returns
• Viewed US Water Services as a service centric, stable cash flow, growth platform; and
• Cultural fit with management and financial wherewithal to allow management to continue to grow the business
Private Capital (VC and PE) Success Stories

Appendix

Client Clearwater OptiRTC JWC Environmental
Marsh McBirney Trojan Technologies
Buyer Type Strategic Financial Financial Strategic Strategic
Business Provides non-chemical water
treatment system for cooling water that prevents scale and
biofilm
Opti integrates sensors, forecasts, and environmental
information to actively control
water and environmental infrastructure
Specializes in design and supply of
wastewater solids reduction equipment
Provides flow and level water monitoring instruments
Leading provider of UV disinfection
systems for water treatment
Process Type Broad Auction; Distressed Sale
Capital Raise
Buy-side Transaction Targeted Auction Targeted Auction
Headwaters’ Water Technology Transaction Experience

Samrat P. Karnik, Managing Director Mr. Karnik has extensive middle-market corporate finance advisory experience across the full spectrum of advisory assignments such as mergers & acquisitions, private financing of debt and growth equity, joint ventures and strategic alternatives assessments. He has completed over 25 M&A, LBO, shareholder defense and general corporate advisory mandates for entrepreneur-owned, private and public companies. He joined HeadwatersMB in 2014 with a focus on working with industrial technology companies, in particular those in instrumentation & sensors, automation & advanced manufacturing technologies, energy efficiency and environmental technology sectors where he has considerable legacy experience.
Prior to joining HeadwatersMB, Mr. Karnik was a senior banker in the M&A and Industrial groups of both Duff & Phelps and Houlihan Lokey where he was responsible for covering and providing investment banking advisory services to companies in the Industrial and Environmental Technologies sectors. Prior to Houlihan Lokey, he was an Associate at The Nassau Group, and began his investment banking career at Berenson Minella & Co. a premier M&A and restructuring advisory firm.
Mr. Karnik’s significant clients have included companies such as Babcock & Wilcox, CIRCOR, Crest Ultrasonic, Flow International, Mitsui & Co., Robbins & Myers, Standex Corporation, and Trojan Technologies and sponsors such as ACAS, Carlyle Group, and Littlejohn among other public and private corporations and private equity firms. In addition, his extensive work with entrepreneur led and family-owned companies has established a robust appreciation for understanding, anticipating and handling issues that need to be navigated successfully to lead these companies through their milestone transactions.
Mr. Karnik graduated from New York University’s Leonard N. Stern School of Business where he was on the Dean’s Honors List and Beta Gamma Sigma Honor Society. Mr. Karnik is also a co-founder and Chief Strategy Officer for Dreambox Emergence Benefit, LLC, a social enterprise focused on deploying 3D printing / additive manufacturing technologies for the benefit of rural, underdeveloped communities.