Embed Size (px)
Citation preview


Mission: Providing a forum for training, education, and peer learning that supports and accelerates the growth of women owned business and strengthens their impact upon the economy.

Services: Providing in-depth business counseling, classroom training, and peer-to-peer learning to help entrepreneurs start, expand, and successfully manage their businesses.

History: Launched in 2015 as 1 of 6 new centers nationally. Funded in part by the US Small Business Administration.

Connect With Us Online:
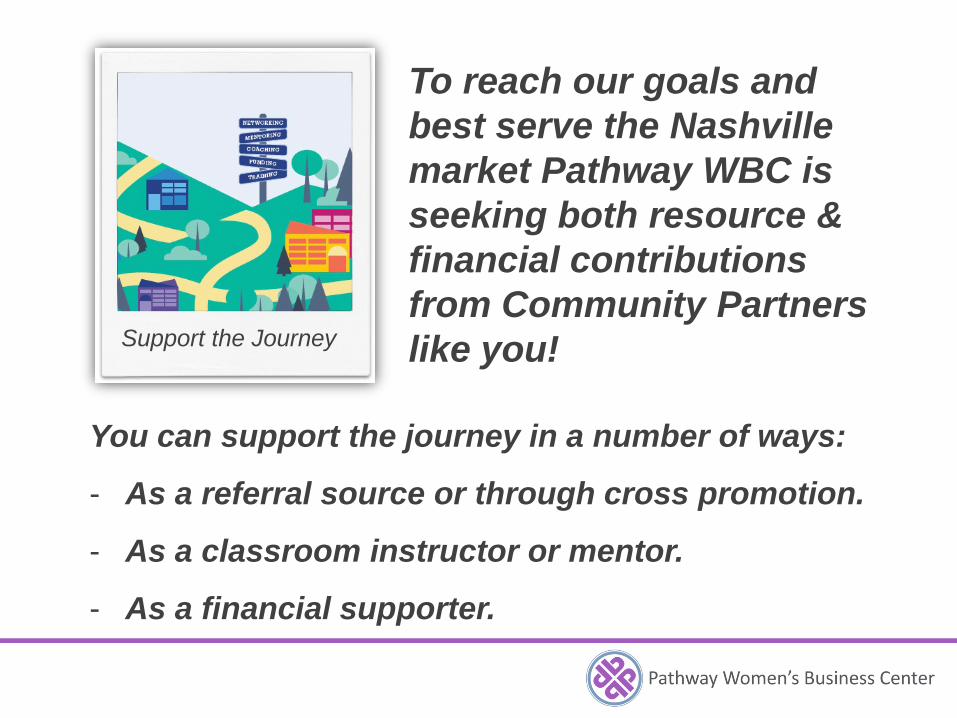
Support the Journey
To reach our goals and best serve the Nashville market Pathway WBC is seeking both resource & financial contributions from Community Partners like you!
You can support the journey in a number of ways:
- As a referral source or through cross promotion.
- As a classroom instructor or mentor.
- As a financial supporter.

A Big Thanks to our Founding Supporters
Regions Bank & Regions Foundation
A Big Thanks to today’s Fed Forum Supporters
A Big Thanks to our other Supporters

Join Us with Mayor Karl Dean on April 22, 2015 for our Ribbon
Cutting Event
The outlook for the economy and the state of small business lending Galina Alexeenko April 2015
The views expressed are mine, and not necessarily those of the Atlanta Fed or the Federal Reserve System.
The Fed’s Dual Mandate
• The Federal Reserve System (the Fed) is the central bank of the United States.
• The Fed is pursuing two objectives as given to us by Congress — maximum employment and price stability.
2

Presentation Outline
1. The current economic environment and outlook
2. The state of small business lending
3. Atlanta Fed’s Small Business Credit Survey and its findings
3

GDP Growth: the economy has recently slowed.
4
-4
-2
0
2
4
6
2012 2013 2014
quarterly, percent, seasonally adjusted annualized rate
Real GDP
Source: Bureau of Economic Analysis through Q4-14

Consumer Spending: retail sales were hit by harsh winter weather.
5
-12
-6
0
6
12
2000 2002 2004 2006 2008 2010 2012 2014
year-over-year percent change, seasonally adjusted
Total Retail Sales: February 2015=1.7
Source: U.S. Census Bureau through February 2015

Housing Market: residential investment has slowed following a strong rebound in 2012-2013.
6
-20%
-15%
-10%
-5%
0%
5%
10%
15%
20%
2000 2002 2004 2006 2008 2010 2012 2014
monthly index, year-over-year percent change
CoreLogic® National House Price Index (including distressed properties, sa)S&P/Case-Shiller Home Price Index: (20-city composite, sa)
Sources: FHFA, S&P/Case-Shiller, CoreLogic through December 2014
5.07% 4.50%
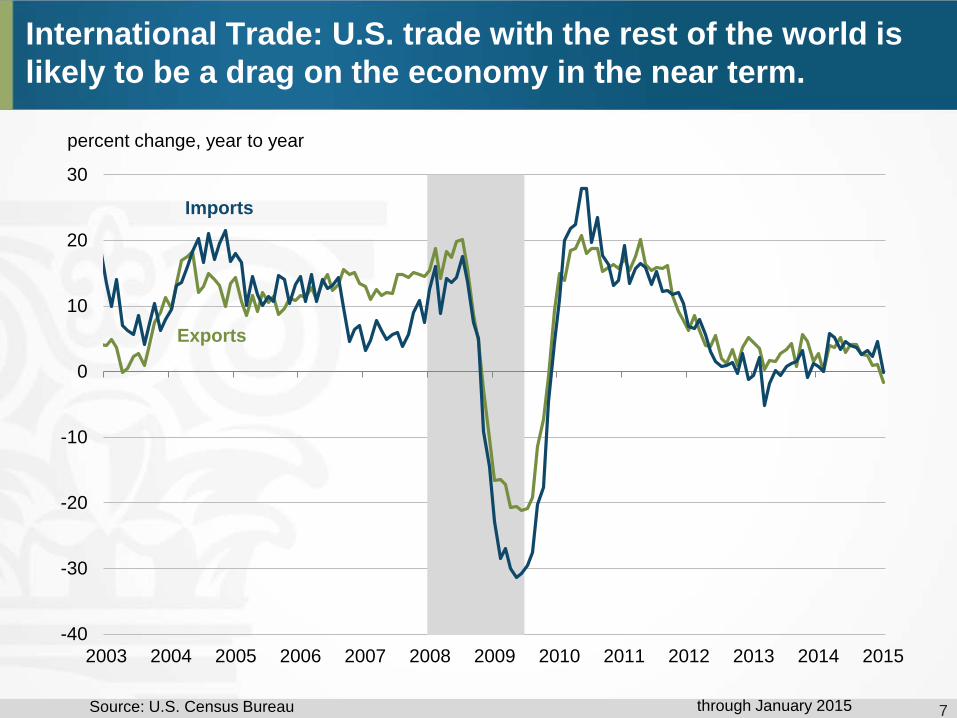
International Trade: U.S. trade with the rest of the world is likely to be a drag on the economy in the near term.
7
-40
-30
-20
-10
0
10
20
30
2003 2004 2005 2006 2007 2008 2009 2010 2011 2012 2013 2014 2015
percent change, year to year
Imports
Exports
Source: U.S. Census Bureau through January 2015

8
Fed’s Economic Projections: GDP growth will strengthen.
Source: Federal Reserve Board of Governors Note: Numbers reflect the upper and lower bound central tendency projections and not the range of projection.
-1
0
1
2
3
4
2010 2011 2012 2013 2014 2015 2016 2017
Longer Run
Central tendency of projection
Range of projection 2.7 2.7
2.4 2.3
2.3 2.3 2.0 2.0

275
295
-1000
-800
-600
-400
-200
0
200
400
600
08 09 10 11 12 13 14
12-month average
Monthly change
seasonally adjusted, thousands of jobs
Source: Bureau of Labor Statistics through February 2015 9
Payroll Employment: payroll growth has improved notably.
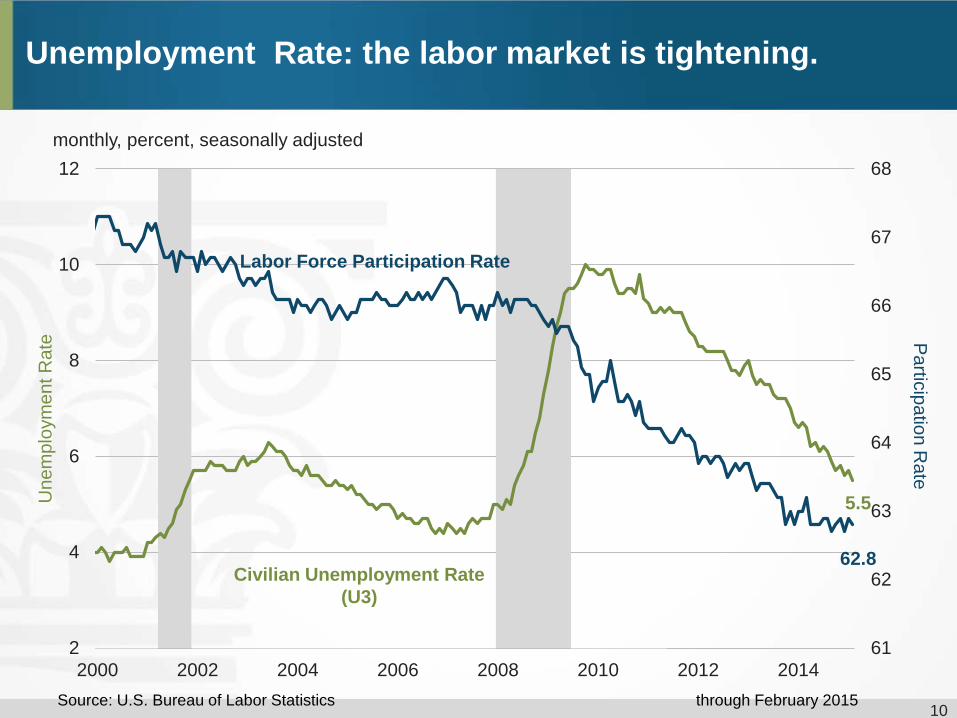
61
62
63
64
65
66
67
68
2
4
6
8
10
12
2000 2002 2004 2006 2008 2010 2012 2014
monthly, percent, seasonally adjusted
Source: U.S. Bureau of Labor Statistics
Une
mpl
oym
ent R
ate P
articipation Rate
through February 2015
62.8
5.5
Civilian Unemployment Rate (U3)
Labor Force Participation Rate
Unemployment Rate: the labor market is tightening.
10

11
Wage Measures: the drop in the unemployment rate has not yet translated into stronger wage growth.
1.0%
1.5%
2.0%
2.5%
3.0%
3.5%
4.0%
07 08 09 10 11 12 13 14
year-over-year change, seasonally adjusted
Average Hourly Earnings
Employment Cost Index
Source: Bureau of Labor Statistics ECI data through Q4 2014, AHE data through February 2015

12
FOMC Objective
PCE Price Index: consumer inflation has been below Fed’s objective for several years.
-2
-1
0
1
2
3
4
5
2000 2002 2004 2006 2008 2010 2012 2014
year-over-year percent change, monthly Headline Core
Sources: Bureau of Economic Analysis through February 2015

13
Business Inflation Expectations: firms’ year-ahead inflation expectations have not changed much.
Source: Atlanta Fed Business Inflation Expectations Survey For more information, visit: http://www.frbatlanta.org/research/inflationproject/bie/
1.7
0
0.5
1
1.5
2
2.5
3
Oct-11 Apr-12 Oct-12 Apr-13 Oct-13 Apr-14 Oct-14
year-ahead unit cost expectations percent, monthly
February 2015

1. Economic growth has moderated, but the outlook is positive.
2. Labor market conditions have improved notably.
3. Inflation has declined further below the Fed’s objective. Inflation
expectations appear stable.
What about Tennessee?
14
Conclusion

15
Tennessee’s Economy: the state’s economic performance largely mirrors that of the United States.
95
98
100
103
105
108
110
113
115
118
120
123
125
2001 2002 2003 2004 2005 2006 2007 2008 2009 2010 2011 2012 2013 2014 2015
Coincident Economic Indicator December 2014
United States
Tennessee
Jan 2001 = 100
Source: Federal Reserve Bank of Philadelphia

16
Tennessee’s Economy: employment momentum is expanding in most metropolitan areas.
Sources: Bureau of Labor Statistics, Federal Reserve Bank of Atlanta
-1
0
1
2
3
4
5
6
-3 -2 -1 0 1 2 3 4 5
3-m
onth
ave
rage
ann
ualiz
ed p
erce
nt c
hang
e
Year-over-year percent change
Employment Momentum by Metro Area: Tennessee
Memphis
Nashville
Johnson City Chattanooga
Clarksville
Expanding Improving
Contracting Slipping
Cleveland
Kingsport-Bristol
February 2015

The state of small business lending

NFIB members report improvement in the ability to borrow, but credit is still tighter than before the recession.
18
15
20
25
30
35
40
2000 2001 2002 2003 2004 2005 2006 2007 2008 2009 2010 2011 2012 2013 2014
Perc
ent
Credit Access Improving
Net percent reporting borrowing needs satisfied during past three months
Source: National Federation of Independent Businesses through December 2014

Banks have been focusing more on large loans.
19
0
100,000
200,000
300,000
400,000
500,000
600,000
700,000
800,000
900,000
Mill
ions
Amount of C&I Loans at FDIC Insured Institutions, by size of loan
Less than $100 thousand Greater than $1 million
Source: Federal Deposit Insurance Corporation through September 2014

Small firms have fewer community bank options than in the past.
20 Source: “State of Small Business Lending”, Karen Mills and Braydon McCarthy Federal Deposit Insurance Corporation, Call Report Data

The Small Business Credit Survey (SBCS)
• Joint effort between Federal Reserve Banks of Atlanta, Cleveland, New York and Philadelphia
• Approximately 2,000 small business respondents
• Questions about business and financing conditions
21

• The ability to obtain credit from banks continues to improve, but it’s still more difficult than before the recession.
• Small banks are an important source of credit for small businesses.
• Online lenders are becoming increasingly important.
22
Access to Credit

22% of survey respondents applied for credit, and 54% of applying firms received at least some financing.
Sources Application rate
Approval rate
Large national bank 35% 31%
Large regional bank 41% 45%
Small regional or community bank 34% 59%
Online lender 18% 38%
Product Application rate
Approval rate
SBA line of credit 10% 31%
Debt consolidation loan or refinance 15% 48%
SBA Loan 23% 38%
Line of Credit 46% 54%
Business Loan 64% 39%
• Approval rates were highest at smaller banks. • Lines of credit had the highest approval rate.
Source: 2014 Joint Small Business Survey, Federal Reserve Bank of Atlanta, New York, Cleveland, and Philadelphia 23

Where firms apply matters significantly.
Startup
(Less than five years in business)
Mature (More than five years in business, more than 10 employees, holds debt)
All Firms
N=598 N=431 N=2014
Credit Outcomes Approval Rate
Received at least some financing 38% 93% 54%
Approval Rate by Source received at least some financing
Large National Bank 17% 87% 31% Large Regional Bank 5% 94% 45% Small Regional or Community Bank 34% 85% 59% Online lender 27% 49% 38% Note: "N" indicates the number of survey respondents.
Source: Joint Small Business Credit Survey Report, 2014 | Federal Reserve Banks of New York, Atlanta, Cleveland and Philadelphia
24

Online lenders are becoming increasingly important – 18% of small businesses sought credit from online lenders.
25 Source: “State of Small Business Lending”, Karen Mills and Braydon McCarthy July 22, 2014

Men rely more on external sources of financing than women to expand their business.
26
Uses of Capital for Expansion by Demographic (employer firms) Male-
owned Female-owned
Business loan from a bank or financial institution 20.70% 14.93%
Business loan from federal, state, or local government 0.89% 0.93%
Business loan/investment from family/friends 1.81% 1.84%
Government-guaranteed business loan from a bank or financial institution 0.67% 0.80%
Grants 0.15% 0.30%
Investment by venture capitalist(s) 0.29% 0.10%
Other source(s) of capital 0.98% 0.90%
Personal/business credit card(s) 13.67% 17.48%
Personal/family assets other than savings of owner(s) 4.50% 4.85%
Personal/family home equity loan 6.48% 7.37%
Personal/family savings of owner(s) 25.91% 27.33%
Business profits and/or assets 19.19% 15.79%
Did not have access to capital 0.71% 0.90%
Did not expand or make capital improvement(s) 38.75% 42.02%
Don't know 4.86% 3.75%
External Sources
2007 Survey of Business Owners, US Census Bureau
Personal Sources

Questions?