Embed Size (px)
Citation preview
PHARMACEUTICAL PRICING IN EUROPEAN COUNTRIES
Valérie Paris – OECD Health Division
Madrid, January 22, 2015
• Ensure affordable and equitable access to effective medicines
• Contain cost growth to sustainable levels
• Ensure efficient use of resources today & encourage innovation for the future
European countries share common goals in pharmaceutical policies
2
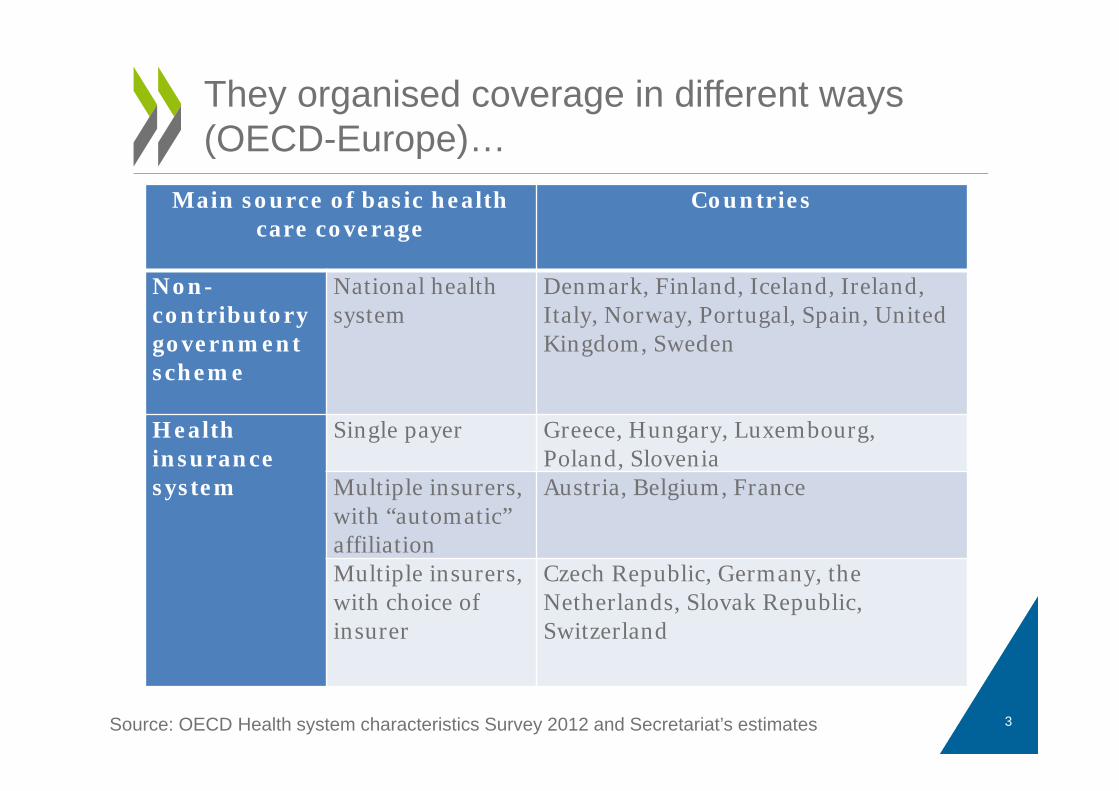
Main source of basic health care coverage
Countries
Non-contributory government scheme
National health system
Denmark, Finland, Iceland, Ireland, Italy, Norway, Portugal, Spain, United Kingdom, Sweden
Health insurance system
Single payer Greece, Hungary, Luxembourg, Poland, Slovenia
Multiple insurers, with “automatic” affiliation
Austria, Belgium, France
Multiple insurers, with choice of insurer
Czech Republic, Germany, the Netherlands, Slovak Republic, Switzerland
They organised coverage in different ways(OECD-Europe)…
Source: OECD Health system characteristics Survey 2012 and Secretariat’s estimates 3
• Benefit basket of medicines defined at central level for drugs used in outpatient care (NHS, single SHI or several health insurers).
• Most countries define « positive lists » of reimbursable drugs. Exceptions: the UK, Germany
• Almost all countries impose user charges with exemptions for vulnerable population and caps on copayments
• User charges are usually higher than for other types of health services
… but have similar ways to define which drugs are covered by public schemes
4
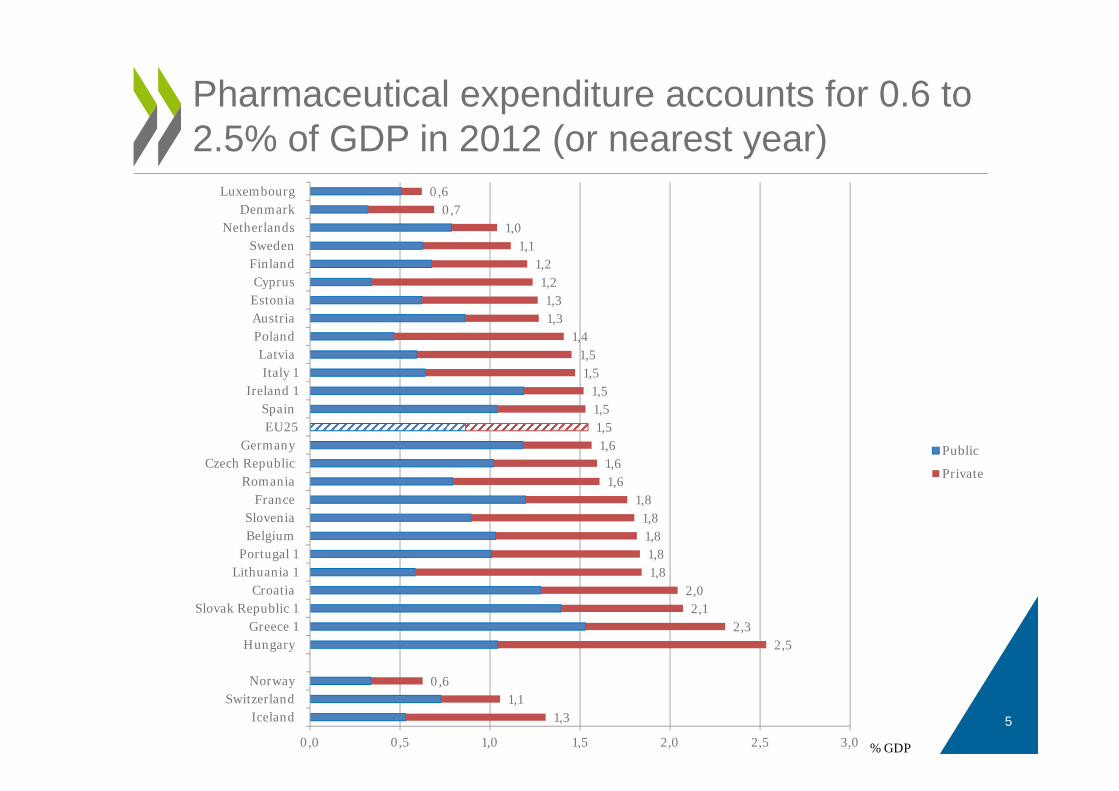
Pharmaceutical expenditure accounts for 0.6 to 2.5% of GDP in 2012 (or nearest year)
51,31,1
0,6
2,52,3
2,12,0
1,81,81,81,8
1,81,61,6
1,61,51,51,5
1,51,5
1,41,31,3
1,21,2
1,11,0
0,70,6
0,0 0,5 1,0 1,5 2,0 2,5 3,0
IcelandSwitzerland
Norway
HungaryGreece 1
Slovak Republic 1Croatia
Lithuania 1Portugal 1
BelgiumSlovenia
FranceRomania
Czech RepublicGermany
EU25Spain
Ireland 1Italy 1
LatviaPolandAustriaEstoniaCyprus
FinlandSweden
NetherlandsDenmark
Luxembourg
Public
Private
% GDP
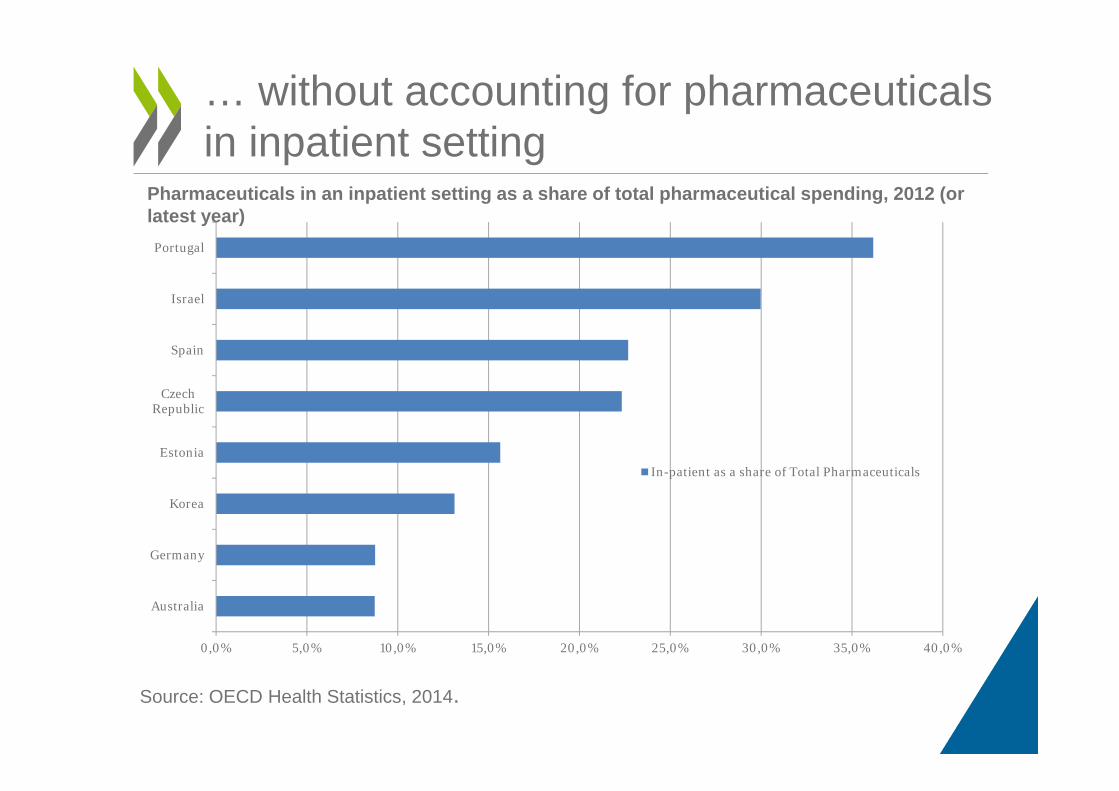
… without accounting for pharmaceuticals in inpatient setting
Source: OECD Health Statistics, 2014.
0,0% 5,0% 10,0% 15,0% 20,0% 25,0% 30,0% 35,0% 40,0%
Australia
Germany
Korea
Estonia
CzechRepublic
Spain
Israel
Portugal
In-patient as a share of Total Pharmaceuticals
Pharmaceuticals in an inpatient setting as a share of total pharmaceutical spending, 2012 (or latest year)
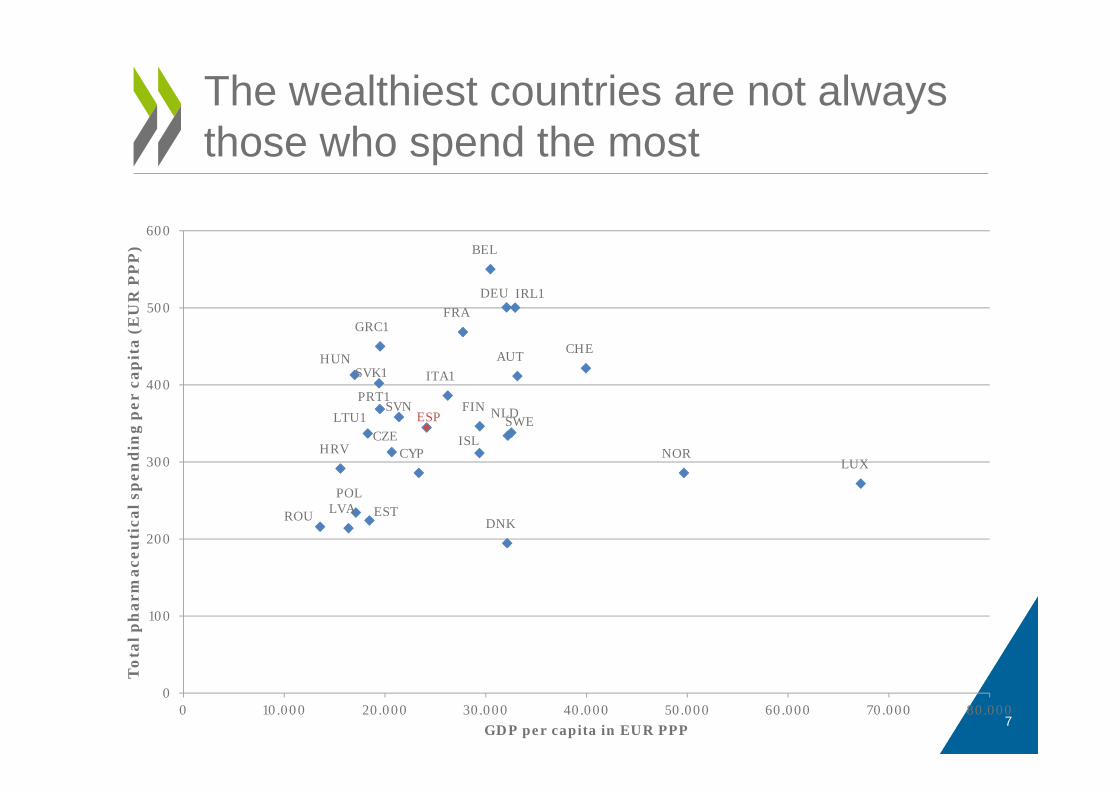
The wealthiest countries are not always those who spend the most
7
AUT
BEL
HRV CYPCZE
DNKEST
FIN
FRADEU
GRC1
HUN
ISL
IRL1
ITA1
LVA
LTU1
LUX
NLD
NOR
POL
PRT1
ROU
SVK1
SVNESP SWE
CHE
0
100
200
300
400
500
600
0 10.000 20.000 30.000 40.000 50.000 60.000 70.000 80.000
Tot
al p
har
mac
euti
cal s
pen
din
g p
er c
apit
a (E
UR
PP
P)
GDP per capita in EUR PPP
8
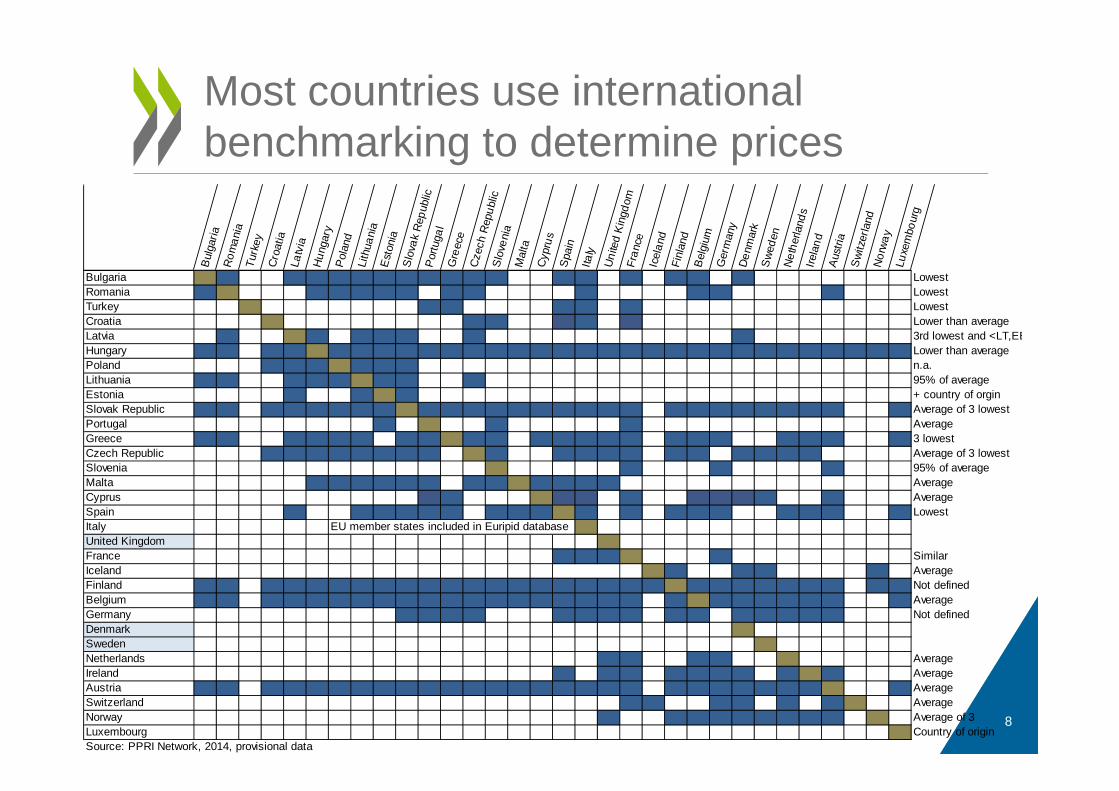
Most countries use international benchmarking to determine prices
Bul
garia
Rom
ania
Turk
eyC
roat
iaLa
tvia
Hun
gary
P
olan
dLi
thua
nia
Est
onia
S
lova
k Re
publ
ic P
ortu
gal
Gre
ece
Cze
ch R
epub
licS
love
nia
Mal
taC
ypru
sS
pain
Italy
Uni
ted
Kin
gdom
Fran
ceIc
elan
dFi
nlan
dB
elgi
umG
erm
any
Den
mar
kS
wede
nN
ethe
rland
sIre
land
Aus
tria
Swi
tzer
land
Nor
way
Luxe
mbo
urg
Bulgaria LowestRomania LowestTurkey LowestCroatia Lower than averageLatvia 3rd lowest and <LT,EEHungary Lower than averagePoland n.a.Lithuania 95% of averageEstonia + country of orginSlovak Republic Average of 3 lowestPortugal AverageGreece 3 lowestCzech Republic Average of 3 lowestSlovenia 95% of averageMalta AverageCyprus AverageSpain LowestItalyUnited KingdomFrance SimilarIceland AverageFinland Not definedBelgium AverageGermany Not definedDenmarkSwedenNetherlands AverageIreland AverageAustria AverageSwitzerland AverageNorway Average of 3Luxembourg Country of originSource: PPRI Network, 2014, provisional data
EU member states included in Euripid database
• United Kingdom: PPRS 2014 = cap on return on sales (6%) and return on capital (21%) for NHS sales + value-based pricing (flexible price, patient access schemes)
• Denmark: free pricing but reimbursement status can be denied if the price is « unreasonable » by comparison to the price of comparator drugs.
• Sweden: free pricing but medicines must be cost-effective to be covered (central decision not binding for county councils)
Only 3 European countries do not look at what other countries’ prices
9
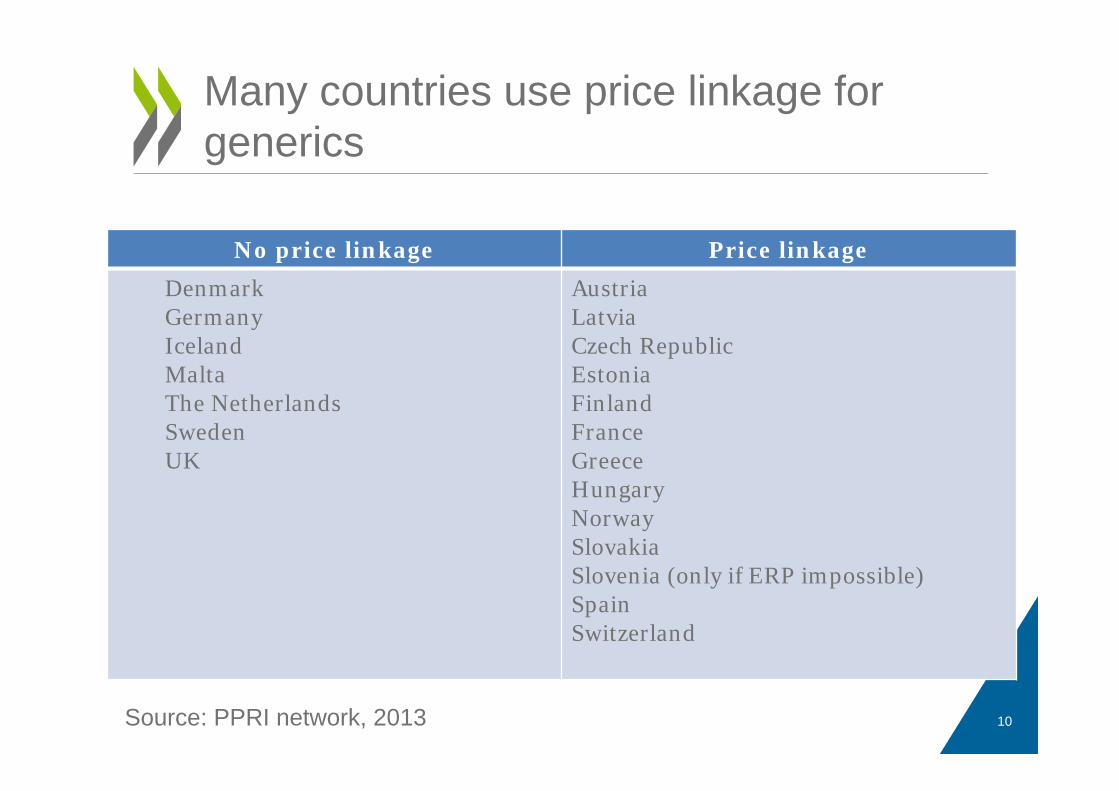
Many countries use price linkage for generics
10
No price linkage Price linkageDenmarkGermanyIcelandMaltaThe NetherlandsSwedenUK
AustriaLatvia Czech RepublicEstoniaFinlandFranceGreeceHungaryNorwaySlovakiaSlovenia (only if ERP impossible)SpainSwitzerland
Source: PPRI network, 2013
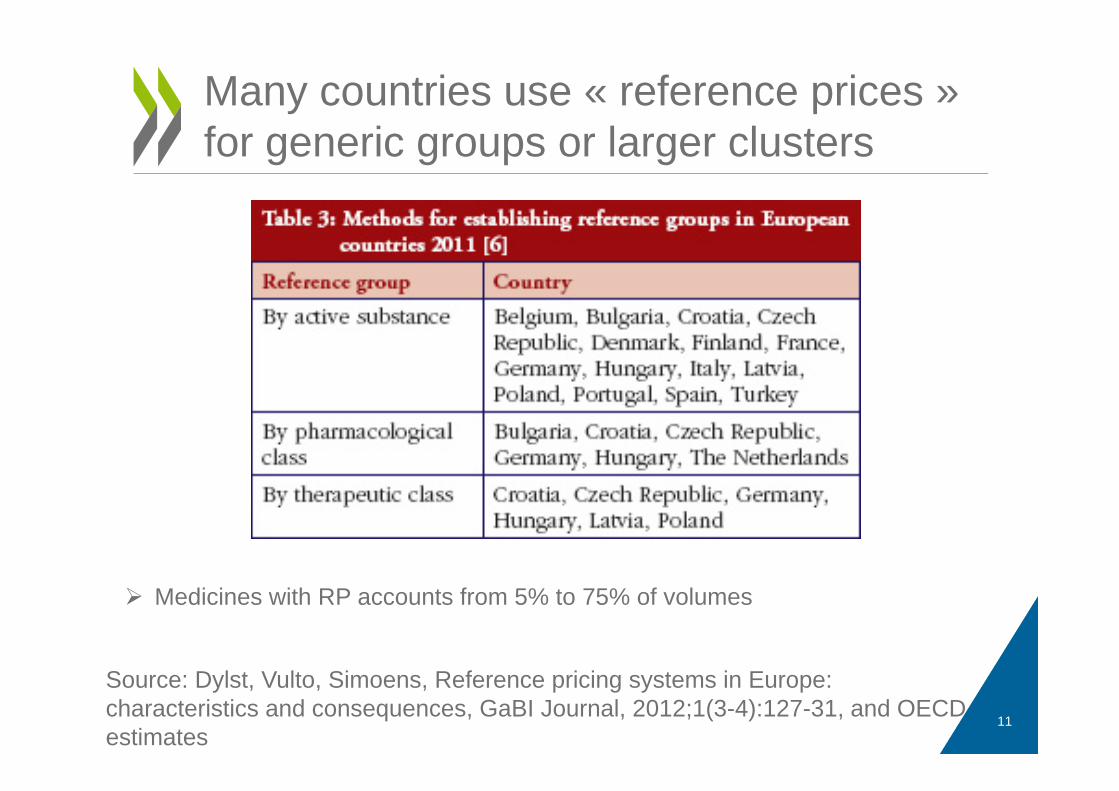
Many countries use « reference prices » for generic groups or larger clusters
11
Source: Dylst, Vulto, Simoens, Reference pricing systems in Europe: characteristics and consequences, GaBI Journal, 2012;1(3-4):127-31, and OECD estimates
Medicines with RP accounts from 5% to 75% of volumes
WHERE ARE WE WITH “VALUE-BASED PRICING”?
-CONCLUSIONS OF THE OECD 2013 STUDY
12
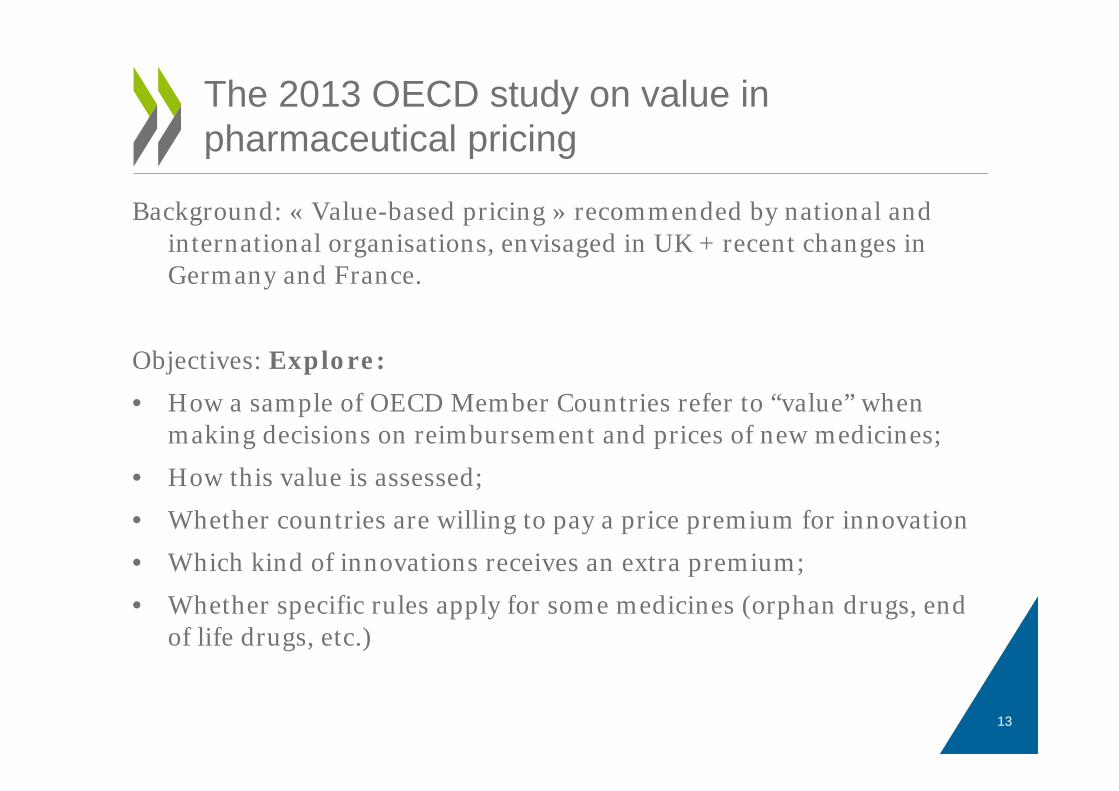
Background: « Value-based pricing » recommended by national and international organisations, envisaged in UK + recent changes in Germany and France.
Objectives: Explore:• How a sample of OECD Member Countries refer to “value” when
making decisions on reimbursement and prices of new medicines;
• How this value is assessed;
• Whether countries are willing to pay a price premium for innovation
• Which kind of innovations receives an extra premium;
• Whether specific rules apply for some medicines (orphan drugs, end of life drugs, etc.)
The 2013 OECD study on value in pharmaceutical pricing
13
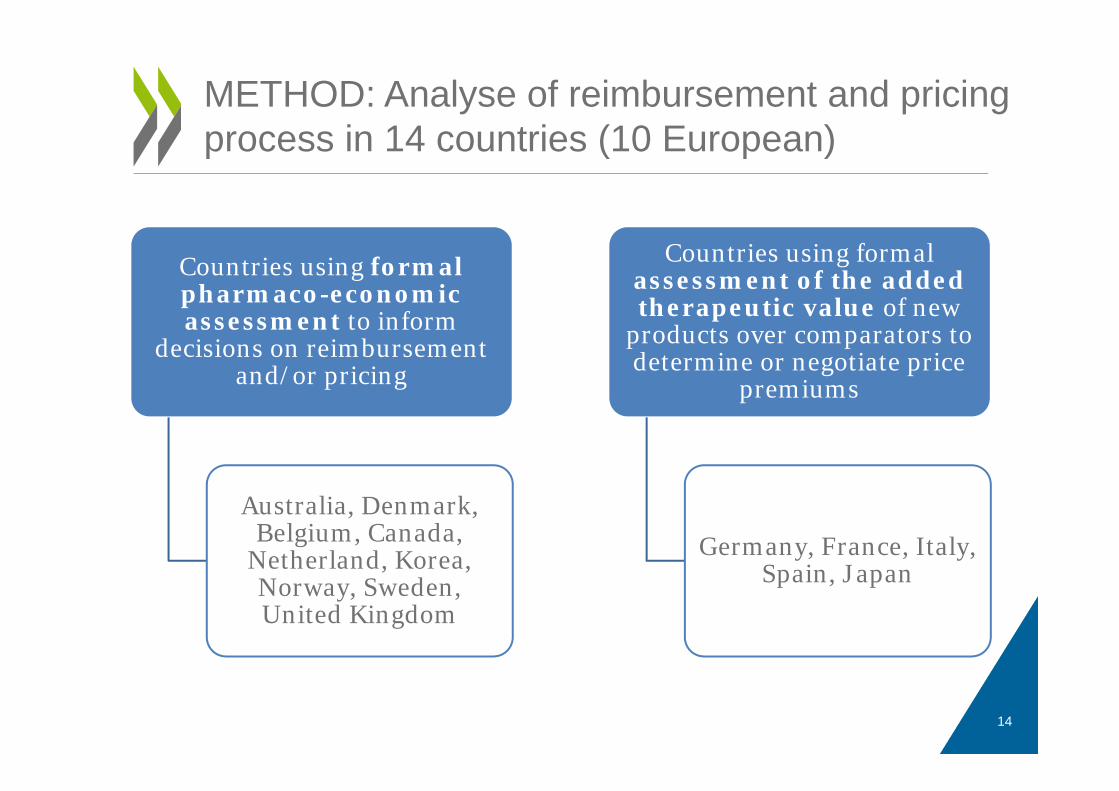
Countries using formal pharmaco-economic assessment to inform
decisions on reimbursement and/or pricing
Australia, Denmark, Belgium, Canada,
Netherland, Korea, Norway, Sweden, United Kingdom
Countries using formal assessment of the added therapeutic value of new
products over comparators to determine or negotiate price
premiums
Germany, France, Italy, Spain, Japan
14
METHOD: Analyse of reimbursement and pricing process in 14 countries (10 European)
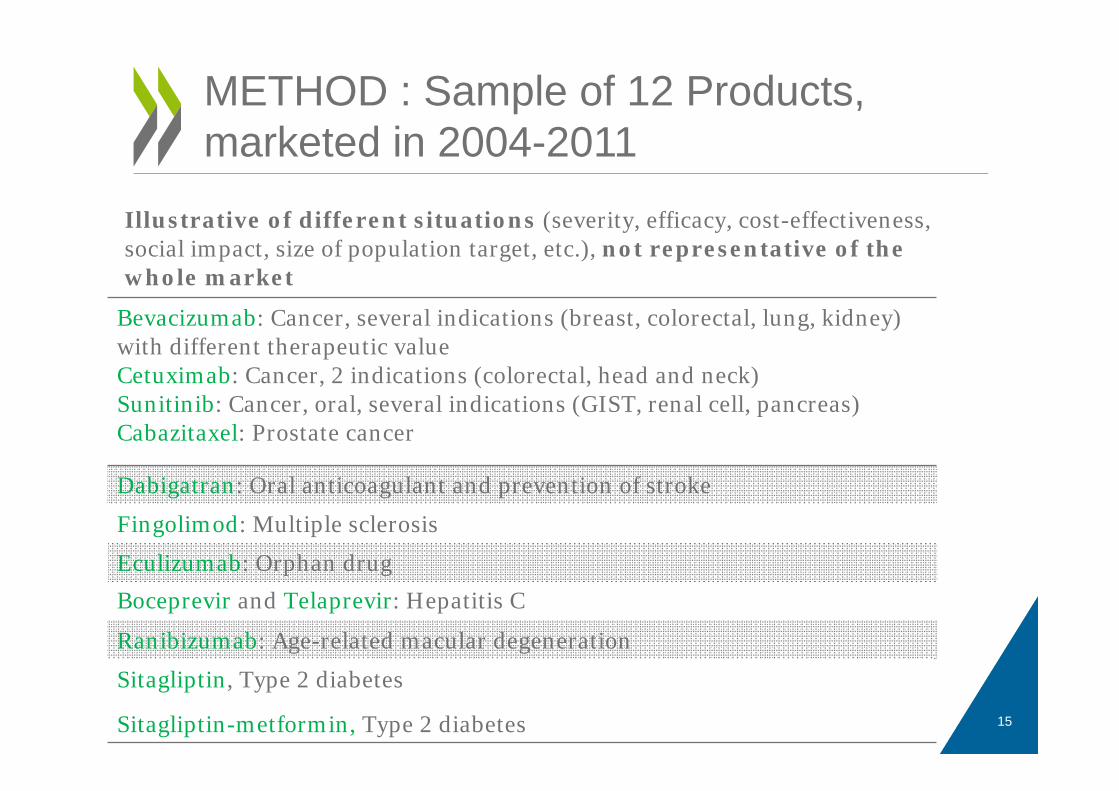
METHOD : Sample of 12 Products, marketed in 2004-2011
Bevacizumab: Cancer, several indications (breast, colorectal, lung, kidney) with different therapeutic valueCetuximab: Cancer, 2 indications (colorectal, head and neck)Sunitinib: Cancer, oral, several indications (GIST, renal cell, pancreas)Cabazitaxel: Prostate cancer
Dabigatran: Oral anticoagulant and prevention of stroke
Fingolimod: Multiple sclerosis
Eculizumab: Orphan drug
Boceprevir and Telaprevir: Hepatitis C
Ranibizumab: Age-related macular degeneration
Sitagliptin, Type 2 diabetes
Sitagliptin-metformin, Type 2 diabetes
Illustrative of different situations (severity, efficacy, cost-effectiveness, social impact, size of population target, etc.), not representative of the whole market
15
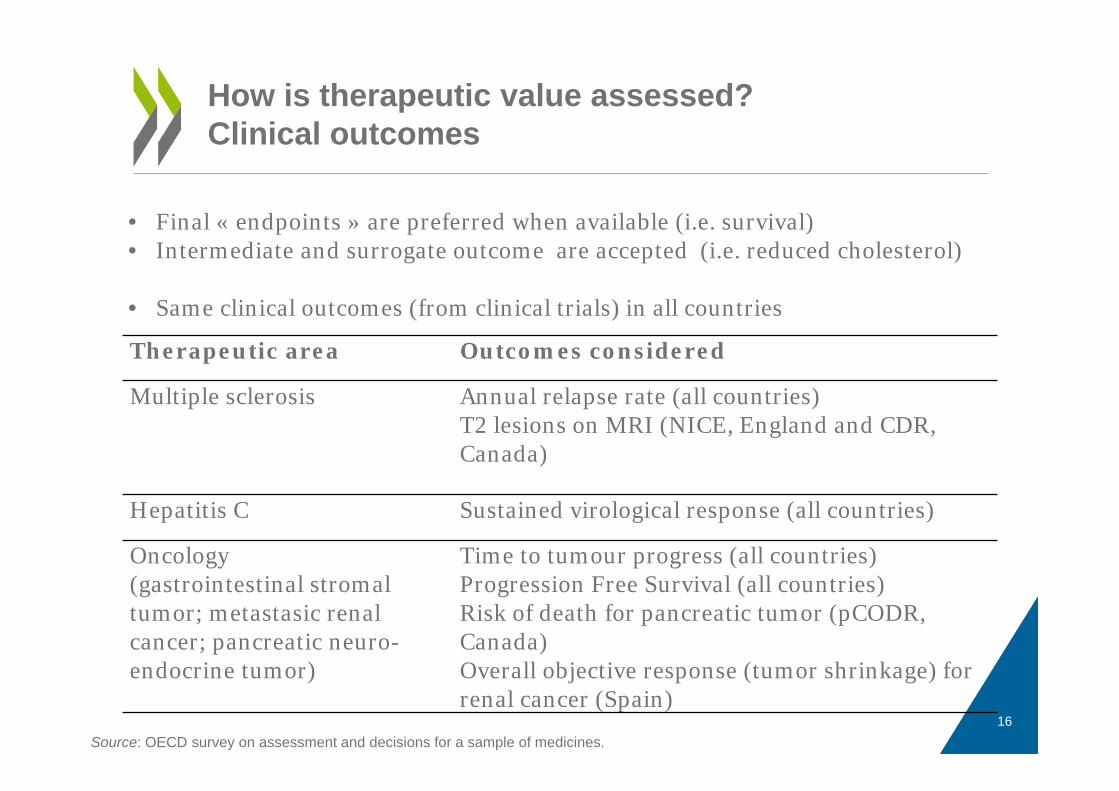
How is therapeutic value assessed?Clinical outcomes
Therapeutic area Outcomes considered
Multiple sclerosis Annual relapse rate (all countries)T2 lesions on MRI (NICE, England and CDR, Canada)
Hepatitis C Sustained virological response (all countries)
Oncology (gastrointestinal stromaltumor; metastasic renal cancer; pancreatic neuro-endocrine tumor)
Time to tumour progress (all countries)Progression Free Survival (all countries)Risk of death for pancreatic tumor (pCODR, Canada)Overall objective response (tumor shrinkage) for renal cancer (Spain)
Source: OECD survey on assessment and decisions for a sample of medicines.
• Final « endpoints » are preferred when available (i.e. survival) • Intermediate and surrogate outcome are accepted (i.e. reduced cholesterol)
• Same clinical outcomes (from clinical trials) in all countries
16
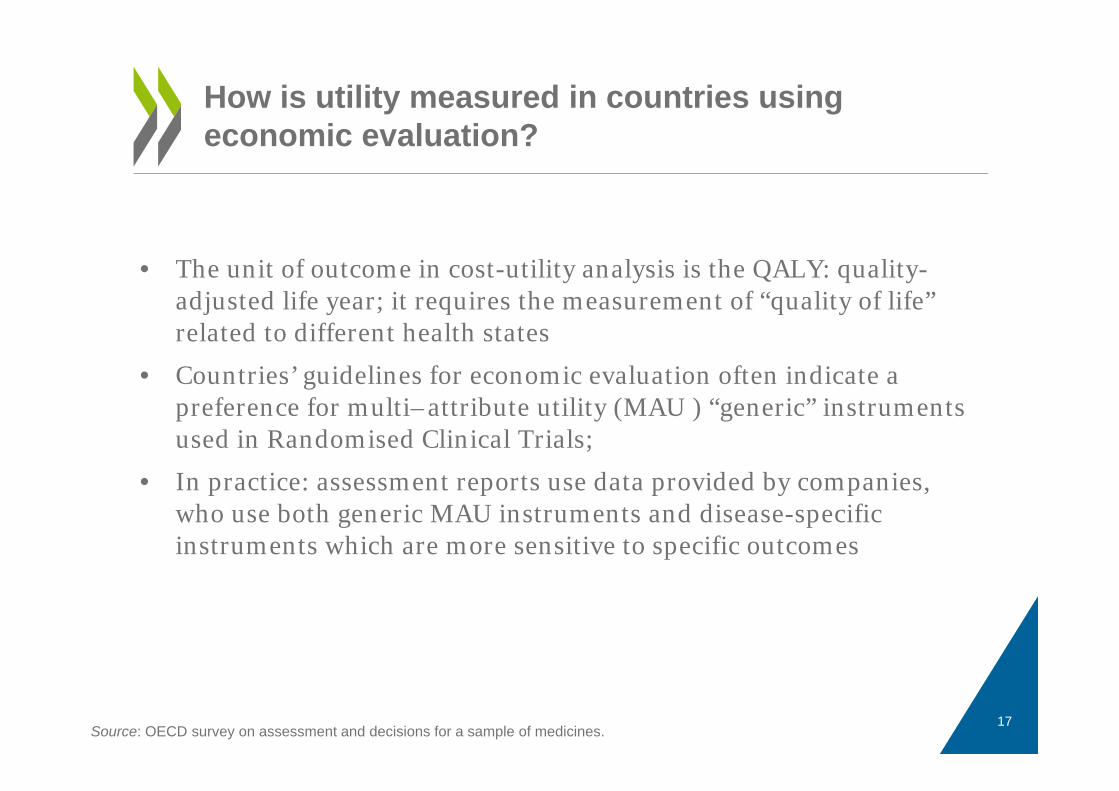
• The unit of outcome in cost-utility analysis is the QALY: quality-adjusted life year; it requires the measurement of “quality of life” related to different health states
• Countries’ guidelines for economic evaluation often indicate a preference for multi–attribute utility (MAU ) “generic” instruments used in Randomised Clinical Trials;
• In practice: assessment reports use data provided by companies, who use both generic MAU instruments and disease-specific instruments which are more sensitive to specific outcomes
How is utility measured in countries using economic evaluation?
Source: OECD survey on assessment and decisions for a sample of medicines.17
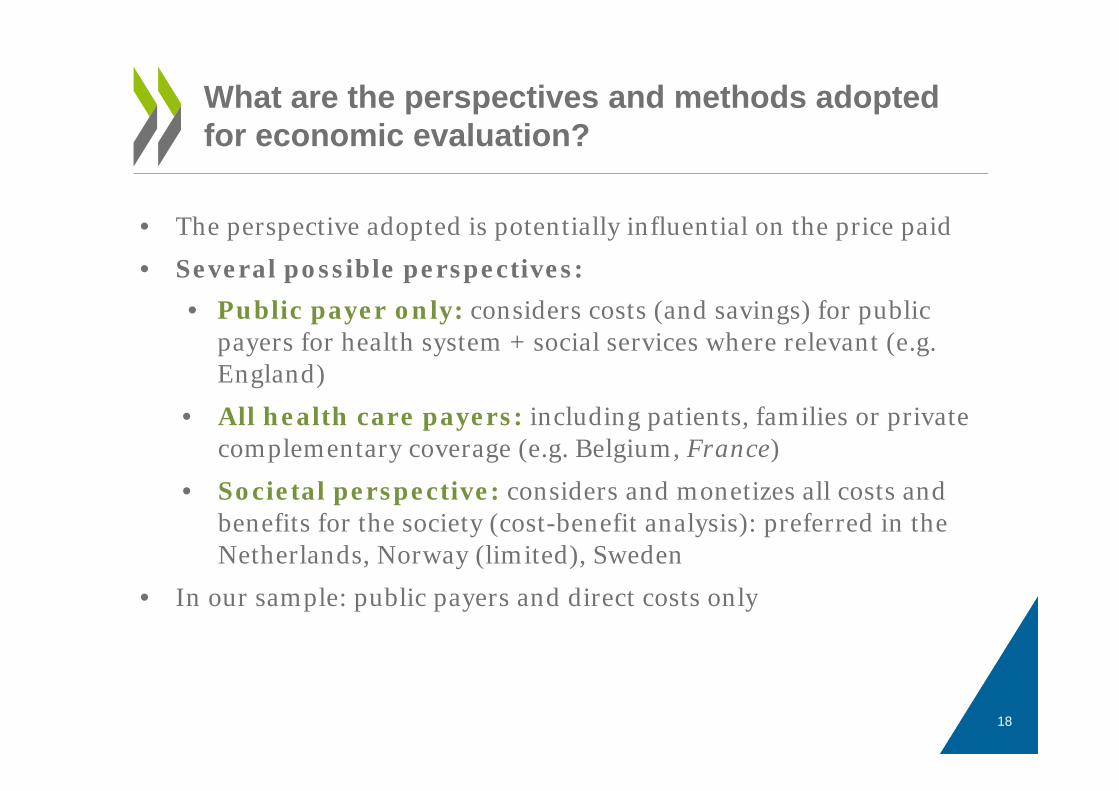
• The perspective adopted is potentially influential on the price paid
• Several possible perspectives:• Public payer only: considers costs (and savings) for public
payers for health system + social services where relevant (e.g. England)
• All health care payers: including patients, families or private complementary coverage (e.g. Belgium, France)
• Societal perspective: considers and monetizes all costs and benefits for the society (cost-benefit analysis): preferred in the Netherlands, Norway (limited), Sweden
• In our sample: public payers and direct costs only
What are the perspectives and methods adopted for economic evaluation?
18
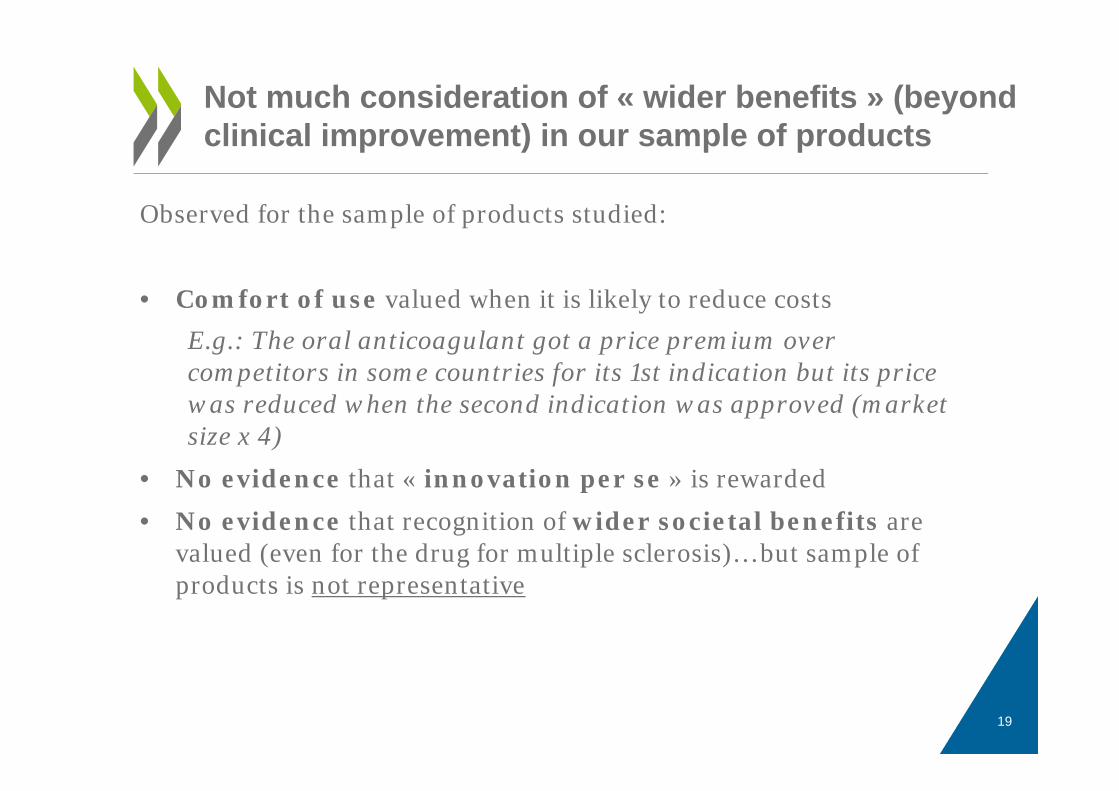
Observed for the sample of products studied:
• Comfort of use valued when it is likely to reduce costs E.g.: The oral anticoagulant got a price premium over competitors in some countries for its 1st indication but its price was reduced when the second indication was approved (market size x 4)
• No evidence that « innovation per se » is rewarded
• No evidence that recognition of wider societal benefits are valued (even for the drug for multiple sclerosis)… but sample of products is not representative
Not much consideration of « wider benefits » (beyond clinical improvement) in our sample of products
19
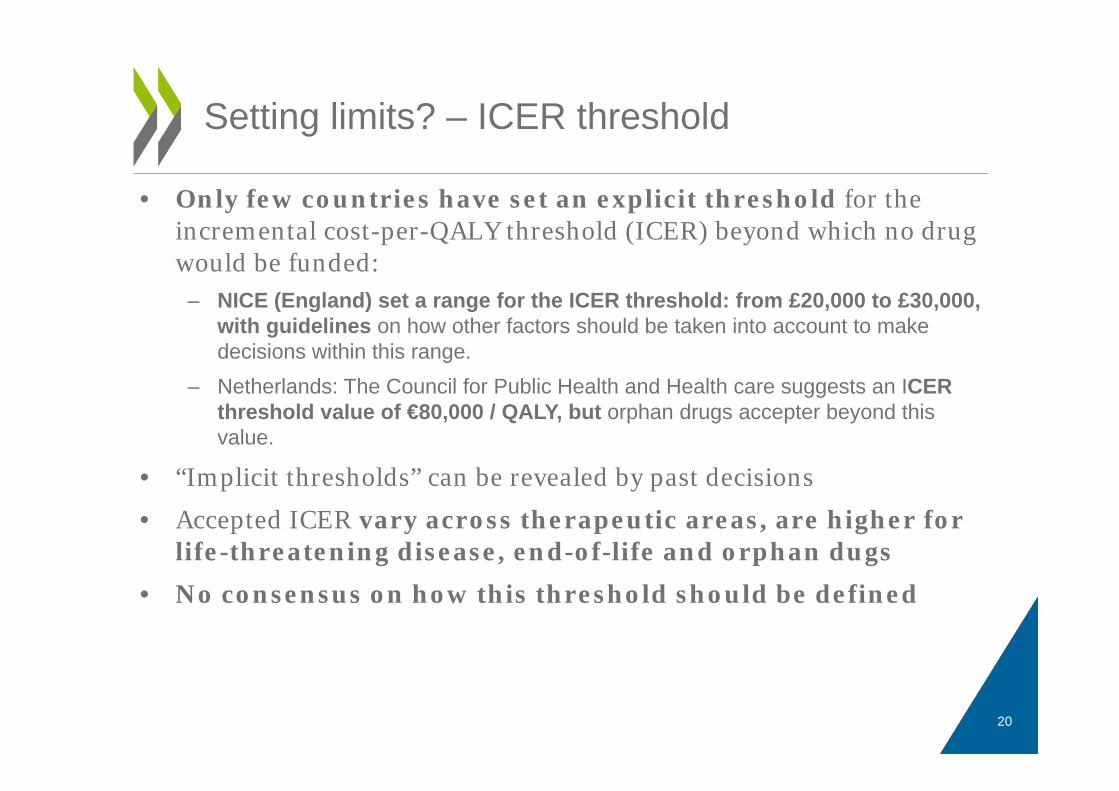
• Only few countries have set an explicit threshold for the incremental cost-per-QALY threshold (ICER) beyond which no drug would be funded:
– NICE (England) set a range for the ICER threshold: from £20,000 to £30,000, with guidelines on how other factors should be taken into account to make decisions within this range.
– Netherlands: The Council for Public Health and Health care suggests an ICER threshold value of €80,000 / QALY, but orphan drugs accepter beyond this value.
• “Implicit thresholds” can be revealed by past decisions
• Accepted ICER vary across therapeutic areas, are higher for life-threatening disease, end-of-life and orphan dugs
• No consensus on how this threshold should be defined
Setting limits? – ICER threshold
20
Setting limits? – budget impact
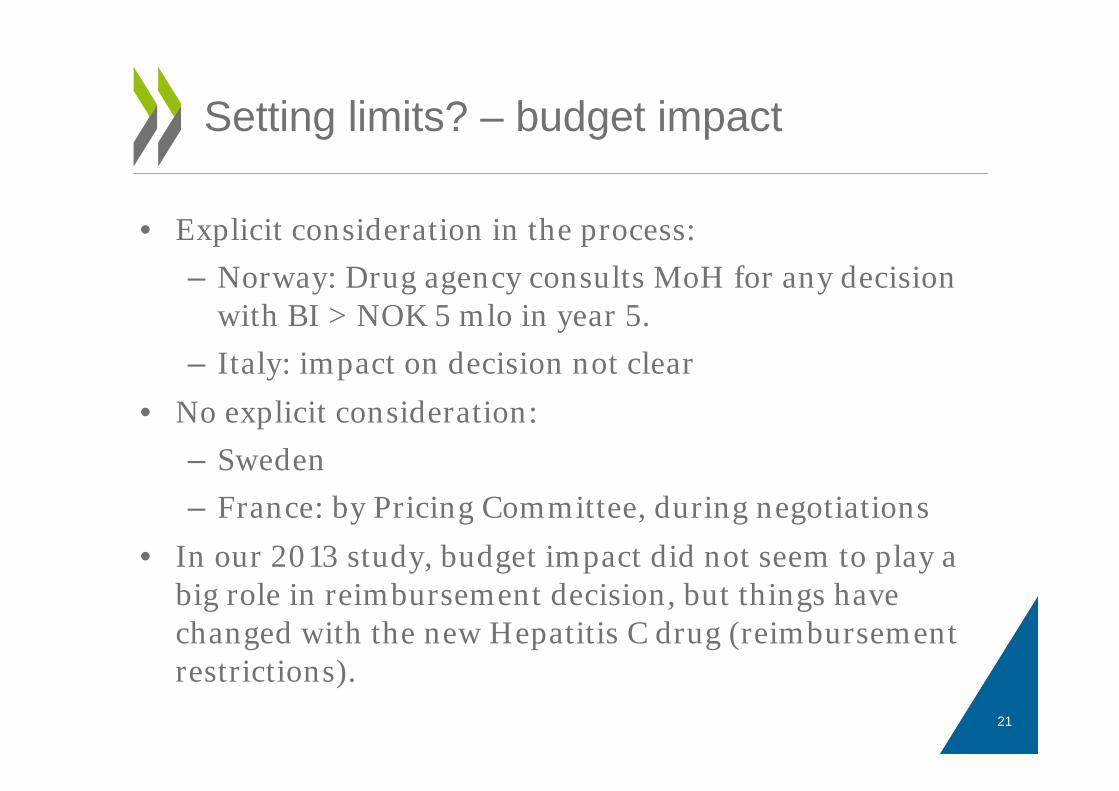
• Explicit consideration in the process:– Norway: Drug agency consults MoH for any decision
with BI > NOK 5 mlo in year 5.– Italy: impact on decision not clear
• No explicit consideration:– Sweden– France: by Pricing Committee, during negotiations
• In our 2013 study, budget impact did not seem to play a big role in reimbursement decision, but things have changed with the new Hepatitis C drug (reimbursement restrictions).
21
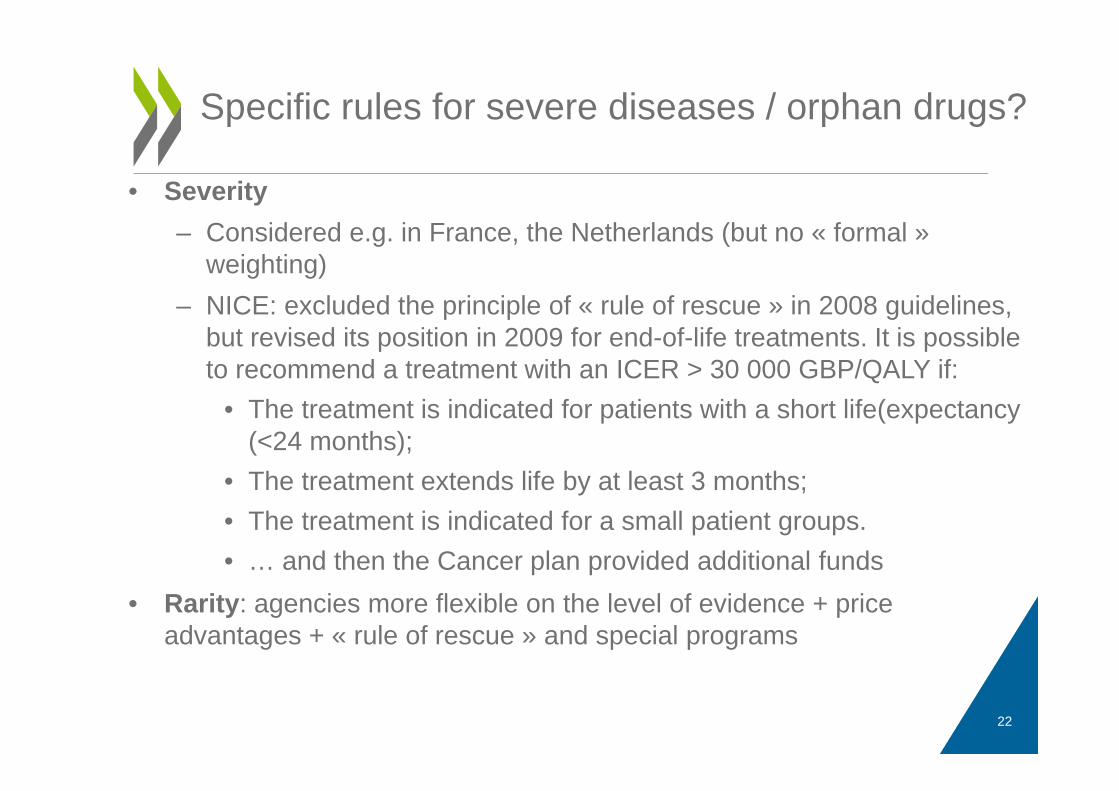
Specific rules for severe diseases / orphan drugs?
• Severity– Considered e.g. in France, the Netherlands (but no « formal »
weighting)– NICE: excluded the principle of « rule of rescue » in 2008 guidelines,
but revised its position in 2009 for end-of-life treatments. It is possible to recommend a treatment with an ICER > 30 000 GBP/QALY if:
• The treatment is indicated for patients with a short life(expectancy (<24 months);
• The treatment extends life by at least 3 months;• The treatment is indicated for a small patient groups.• … and then the Cancer plan provided additional funds
• Rarity: agencies more flexible on the level of evidence + price advantages + « rule of rescue » and special programs
22
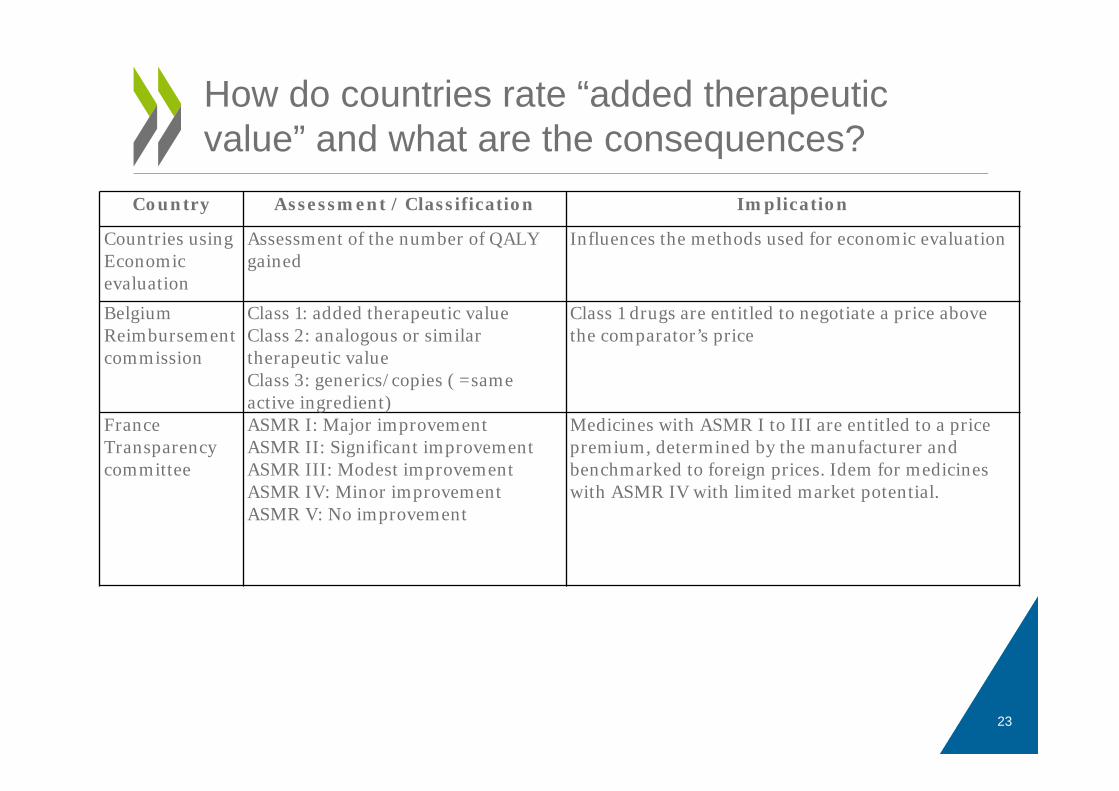
How do countries rate “added therapeutic value” and what are the consequences?
Country Assessment / Classification Implication
Countries using Economic evaluation
Assessment of the number of QALY gained
Influences the methods used for economic evaluation
BelgiumReimbursementcommission
Class 1: added therapeutic valueClass 2: analogous or similartherapeutic valueClass 3: generics/copies ( =sameactive ingredient)
Class 1 drugs are entitled to negotiate a price above the comparator’s price
FranceTransparencycommittee
ASMR I: Major improvementASMR II: Significant improvementASMR III: Modest improvementASMR IV: Minor improvementASMR V: No improvement
Medicines with ASMR I to III are entitled to a price premium, determined by the manufacturer and benchmarked to foreign prices. Idem for medicines with ASMR IV with limited market potential.
23
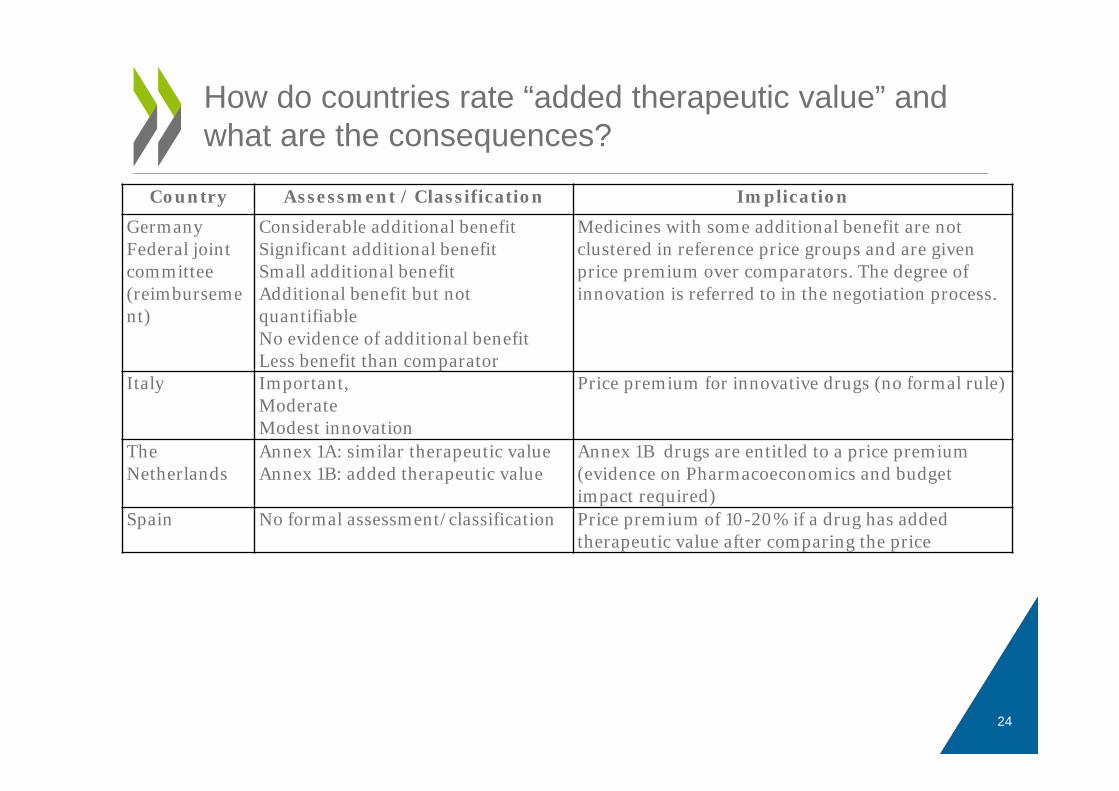
How do countries rate “added therapeutic value” and what are the consequences?
Country Assessment / Classification Implication
GermanyFederal joint committee (reimbursement)
Considerable additional benefitSignificant additional benefitSmall additional benefitAdditional benefit but not quantifiableNo evidence of additional benefitLess benefit than comparator
Medicines with some additional benefit are not clustered in reference price groups and are given price premium over comparators. The degree of innovation is referred to in the negotiation process.
Italy Important,ModerateModest innovation
Price premium for innovative drugs (no formal rule)
The Netherlands
Annex 1A: similar therapeutic valueAnnex 1B: added therapeutic value
Annex 1B drugs are entitled to a price premium (evidence on Pharmacoeconomics and budget impact required)
Spain No formal assessment/classification Price premium of 10-20% if a drug has added therapeutic value after comparing the price
24
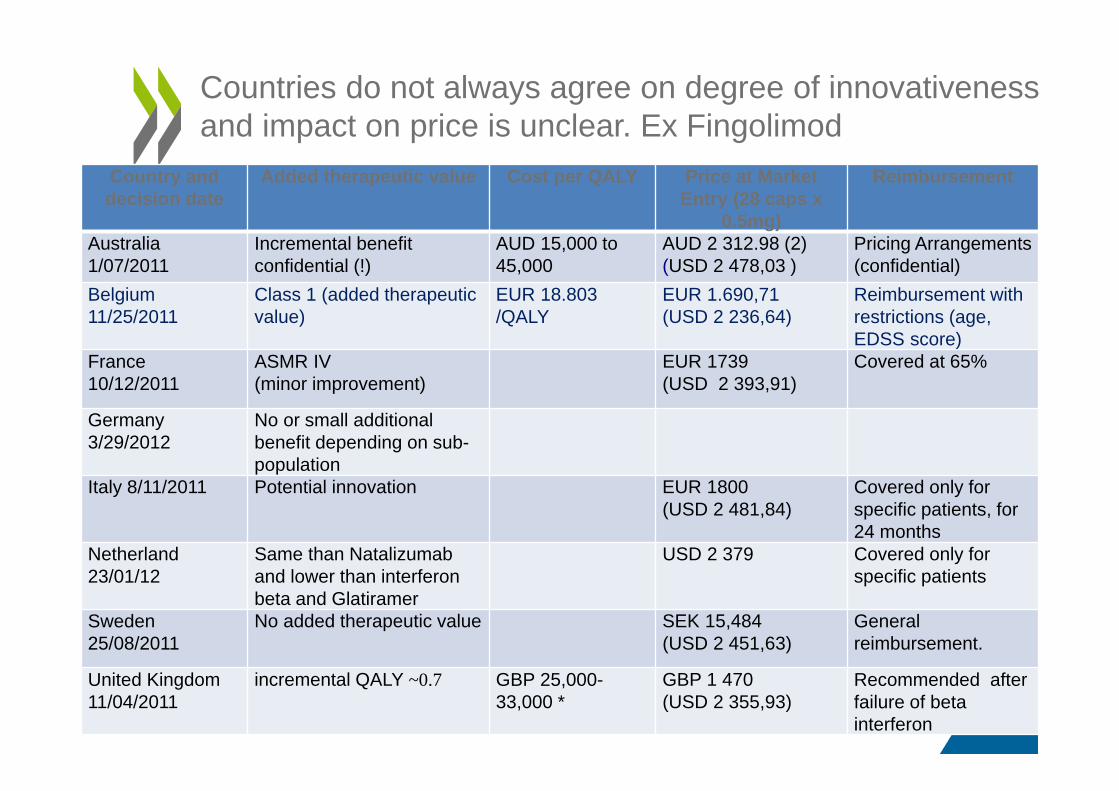
Countries do not always agree on degree of innovativenessand impact on price is unclear. Ex Fingolimod
Country and decision date
Added therapeutic value Cost per QALY Price at Market Entry (28 caps x
0.5mg)
Reimbursement
Australia1/07/2011
Incremental benefit confidential (!)
AUD 15,000 to 45,000
AUD 2 312.98 (2)(USD 2 478,03 )
Pricing Arrangements (confidential)
Belgium 11/25/2011
Class 1 (added therapeutic value)
EUR 18.803 /QALY
EUR 1.690,71 (USD 2 236,64)
Reimbursement with restrictions (age, EDSS score)
France 10/12/2011
ASMR IV(minor improvement)
EUR 1739(USD 2 393,91)
Covered at 65%
Germany 3/29/2012
No or small additional benefit depending on sub-population
Italy 8/11/2011 Potential innovation EUR 1800(USD 2 481,84)
Covered only for specific patients, for 24 months
Netherland 23/01/12
Same than Natalizumaband lower than interferon beta and Glatiramer
USD 2 379 Covered only for specific patients
Sweden 25/08/2011
No added therapeutic value SEK 15,484(USD 2 451,63)
General reimbursement.
United Kingdom 11/04/2011
incremental QALY ~0.7 GBP 25,000-33,000 *
GBP 1 470(USD 2 355,93)
Recommended after failure of beta interferon
• Used to address:– Uncertainties about clinical efficacy or effectiveness:
e.g. coverage with evidence development, registries– Uncertainties about cost-effectiveness : performance-based
agreements, linking price to actual performance (for individuals or for a group of patients treated)e.g. Company must pay back part or all costs of treatment in case of failure or pays the first cycles of treatment whose continuation is publicly funded in case of success
– Uncertainties about budget impact : financial agreements aiming to control budget impact and ensure value-based pricinge.g.: cap on spending per patient or dose-capping.
• Also used for cancer medicines with variable ICER / by indication(price discrimination across indications)
• Italy and the UK are big users
Countries use “product-specific agreements” for some drugs or indications
26
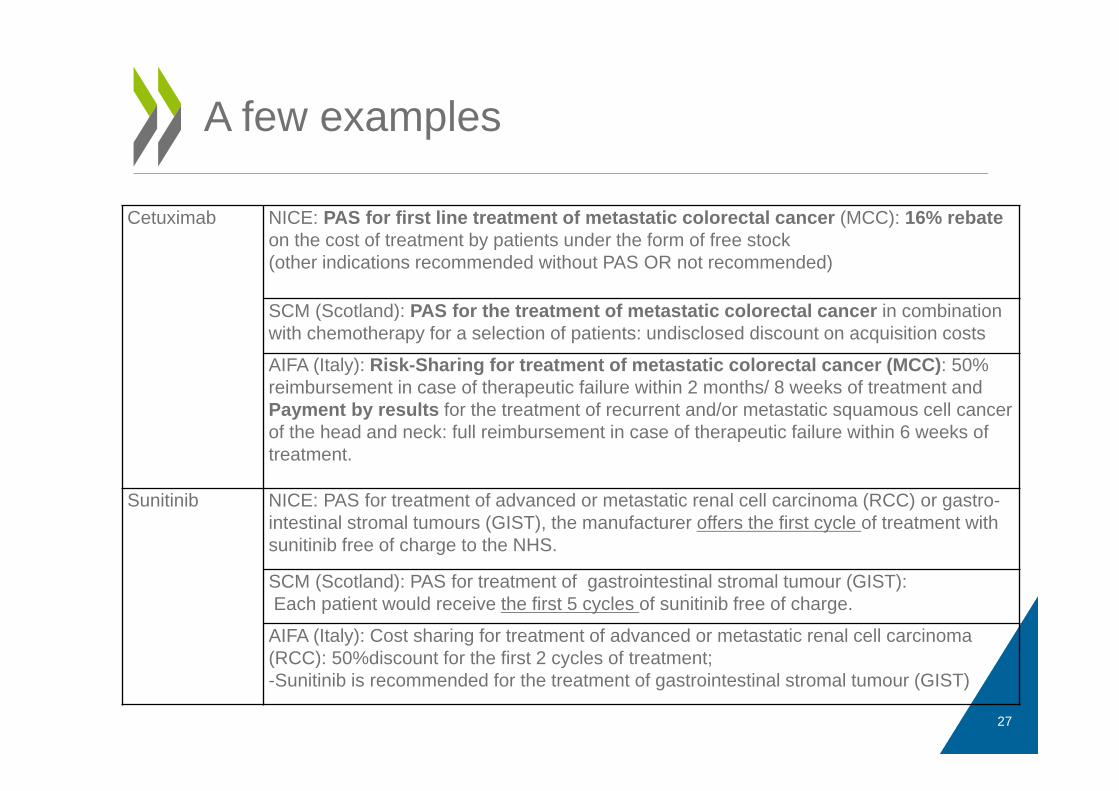
A few examples
Cetuximab NICE: PAS for first line treatment of metastatic colorectal cancer (MCC): 16% rebate on the cost of treatment by patients under the form of free stock(other indications recommended without PAS OR not recommended)
SCM (Scotland): PAS for the treatment of metastatic colorectal cancer in combination with chemotherapy for a selection of patients: undisclosed discount on acquisition costs
AIFA (Italy): Risk-Sharing for treatment of metastatic colorectal cancer (MCC): 50% reimbursement in case of therapeutic failure within 2 months/ 8 weeks of treatment and Payment by results for the treatment of recurrent and/or metastatic squamous cell cancer of the head and neck: full reimbursement in case of therapeutic failure within 6 weeks of treatment.
Sunitinib NICE: PAS for treatment of advanced or metastatic renal cell carcinoma (RCC) or gastro-intestinal stromal tumours (GIST), the manufacturer offers the first cycle of treatment with sunitinib free of charge to the NHS.
SCM (Scotland): PAS for treatment of gastrointestinal stromal tumour (GIST):Each patient would receive the first 5 cycles of sunitinib free of charge.
AIFA (Italy): Cost sharing for treatment of advanced or metastatic renal cell carcinoma (RCC): 50%discount for the first 2 cycles of treatment;-Sunitinib is recommended for the treatment of gastrointestinal stromal tumour (GIST)
27
• In principle, the answer is « yes » but payers have to make sure they are:– appropriately used (to address uncertainty and/or
risks and not just to obtain discounts on list prices)– well designed (low adm. costs, collection of
information on use and outcomes).• Observed information on use and health outcomes
should be public.• Public funding of medicines through MEAs is very
difficult to “reverse” unless serious adverse effects are observed (public “loss aversion). Do they reduce payers’ purchasing power?
Can “managed entry agreements” help to move towards value-based pricing?
28
• There seems to be a link between the price premium granted and added therapeutic value but it is impossible to say “how much does a QALY worth” – even within a given country
• Countries do not always agree on the level of “innovativeness” of new products
• The price of a QALY (or ICER accepted) varies across therapeutic areas
• Benefits « beyond the health sector » are most often not considered
• International benchmarking and volumes are important determinants of prices
Conclusions: are prices determined by the “value” of new products?
29
Conclusions: are prices determined by the value of new products?
• There seems to be a link between the price premium granted and added therapeutic value but it is impossible to say “how much does a QALY worth” – even within a given country
• Countries do not always agree on the level of “innovativeness” of new products
• The price of a QALY (or ICER accepted) varies across therapeutic areas
• International benchmarking and volumes are important determinants of price
• Benefits « beyond the health sector » are most often not considered
31
Contact: [email protected]
Read more about our work Follow us on Twitter: @OECD_Social
Website: www.oecd.org/healthNewsletter: http://www.oecd.org/health/updatePharma working paper:http://www.oecd.org/health/valueinpharmaceuticalpricing.htm
Thank you!
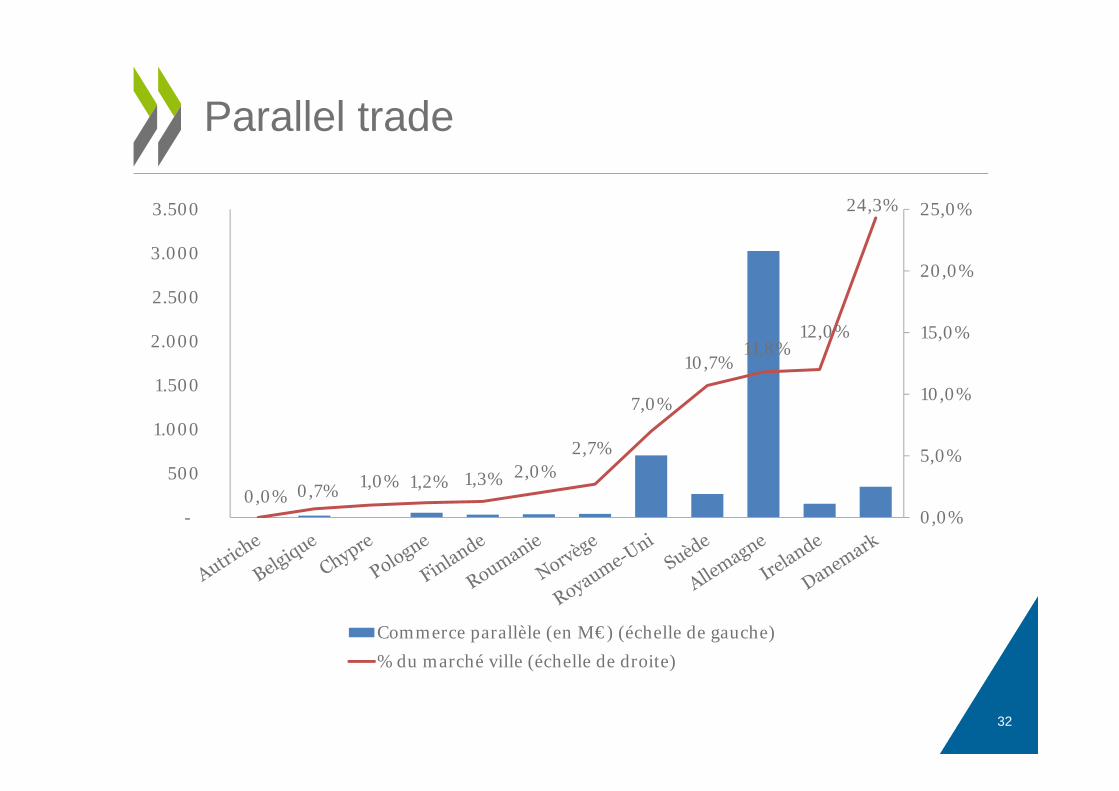
Parallel trade
32
0,0% 0,7% 1,0% 1,2% 1,3% 2,0%2,7%
7,0%
10,7%11,8%
12,0%
24,3%
0,0%
5,0%
10,0%
15,0%
20,0%
25,0%
-
500
1.000
1.500
2.000
2.500
3.000
3.500
Commerce parallèle (en M€) (échelle de gauche)% du marché ville (échelle de droite)
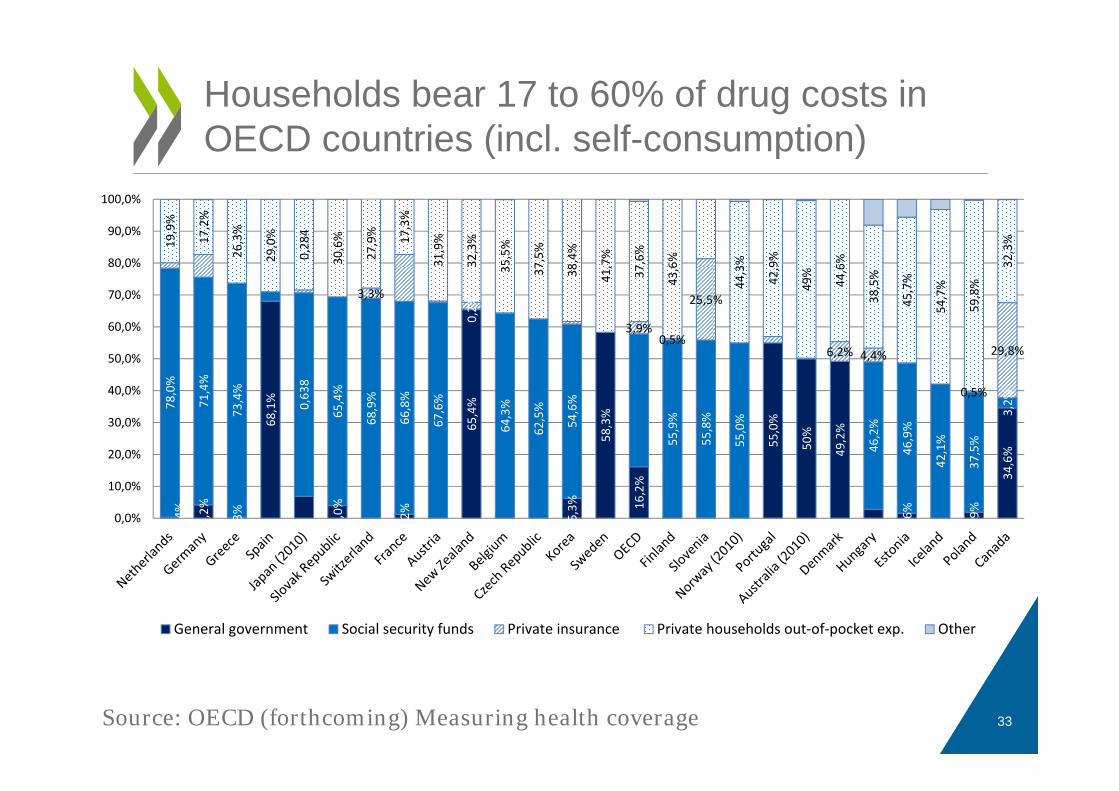
Households bear 17 to 60% of drug costs in OECD countries (incl. self-consumption)
0,4% 4,2%
0,3%
68,1%
4,0%
1,2%
65,4%
6,3%
58,3%
16,2%
55,0%
50%
49,2%
1,6%
1,9%
34,6%
78,0%
71,4%
73,4%
0,63
8
65,4%
68,9%
66,8%
67,6%
0,2%
64,3%
62,5%
54,6%
55,9%
55,8%
55,0%
46,2%
46,9%
42,1%
37,5%
3,2%
3,3%
3,9%0,5%
25,5%
6,2% 4,4%
0,5%
29,8%
19,9%
17,2%
26,3%
29,0%
0,28
4
30,6%
27,9% 17,3%
31,9%
32,3%
35,5%
37,5%
38,4%
41,7%
37,6%
43,6%
44,3%
42,9%
49%
44,6%
38,5%
45,7%
54,7%
59,8%
32,3%
0,0%
10,0%
20,0%
30,0%
40,0%
50,0%
60,0%
70,0%
80,0%
90,0%
100,0%
General government Social security funds Private insurance Private households out‐of‐pocket exp. Other
Source: OECD (forthcoming) Measuring health coverage 33
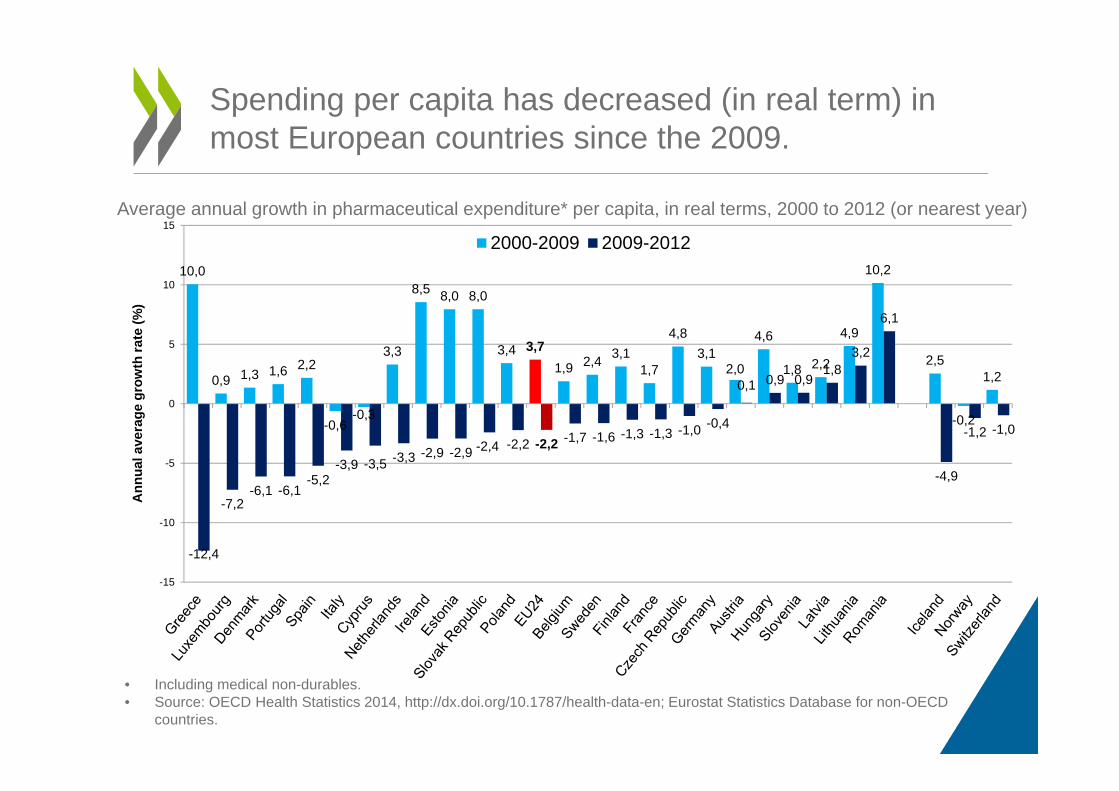
Spending per capita has decreased (in real term) in most European countries since the 2009.
10,0
0,9 1,3 1,6 2,2
-0,6-0,3
3,3
8,5 8,0 8,0
3,4 3,71,9 2,4 3,1
1,7
4,83,1
2,0
4,6
1,8 2,2
4,9
10,2
2,5
-0,2
1,2
-12,4
-7,2-6,1 -6,1
-5,2-3,9 -3,5 -3,3 -2,9 -2,9 -2,4 -2,2 -2,2 -1,7 -1,6 -1,3 -1,3 -1,0 -0,4
0,1 0,9 0,91,8
3,2
6,1
-4,9
-1,2 -1,0
-15
-10
-5
0
5
10
15
2000-2009 2009-2012
Ann
ual a
vera
ge g
row
th ra
te (%
)
• Including medical non-durables.• Source: OECD Health Statistics 2014, http://dx.doi.org/10.1787/health-data-en; Eurostat Statistics Database for non-OECD
countries.
Average annual growth in pharmaceutical expenditure* per capita, in real terms, 2000 to 2012 (or nearest year)