Embed Size (px)
Citation preview
Greatest Lessons of the Great Recession
August 2013
Portfolio Perspectives
By Joni Clark, CFA, CFP® Chief Investment Officer, Loring Ward
Last month we began a three-part series on the Greatest Lessons of the Great Recession, and this month we continue. To read Part One, click here.
Lesson Three Active Managers Have Not Outperformed in Bear Markets (or Bull Markets)
Every January, USA Today asks top investment strategists to offer up their outlook for the year ahead, including where they think the S&P 500 will end the year. Ahead of the calamitous market declines and economic turmoil just around the corner, all of the strategists’ forecasts at the beginning of 2008 were predicting an up year in the markets.
Similarly, at the end of 2007, New York newspaper Newsday sampled “eight major Wall Street Securities firms” and came out with an average price target for the S&P 500 by the year-end 2008 of 1,653, representing a 12% rise on the previous year.1
We now know the S&P 500 Index declined by 37% for the year 2008. None of USA Today’s or Newsday’s strategists even predicted
the down direction of the market correctly. Also unforeseen, the bankruptcy or sale of many of these strategists’ own firms.
If experts can’t even predict recessions or the direction of the markets, how can we expect active managers to successfully pick individual stocks whose performance is so sensitive to economic and market conditions?
Active managers attempt to outperform an index, such as the S&P 500 Index, by actively trading individual stocks and/or engaging in market timing — deciding when to be in and out of the market. Many investors believe that active managers earn their keep in bear markets, because they avoid losses by hand-picking superior individual stocks or by shifting out of stocks altogether before steep market declines occur.
Standard and Poor’s has been measuring the performance of active managers against their index counterparts for several years now. Their May 2009 Indices Versus Active Funds Study spe-cifically focused on the bear market of 2008 and concluded that “the belief that bear markets favor active management is a myth.” In aggregate in 2008, actively managed funds underperformed the S&P 500 Index by an average of 1.67%.2
Since 2008, these same studies continue to show that the major-ity of active managers fail to beat their benchmarks. As you can see from the chart below, from 2008 – 2012, the S&P 500 Index outperformed 78% of actively managed large cap mutual funds, and the S&P Small Cap 600 Index outperformed 80% of actively managed small cap funds.
PART TWO
1 2008 Outlook for Investors’, Newsday, (December 31, 2007)2 Standard and Poor’s May 2009 Indices Versus Active Funds Study
Portfolio Perspectives
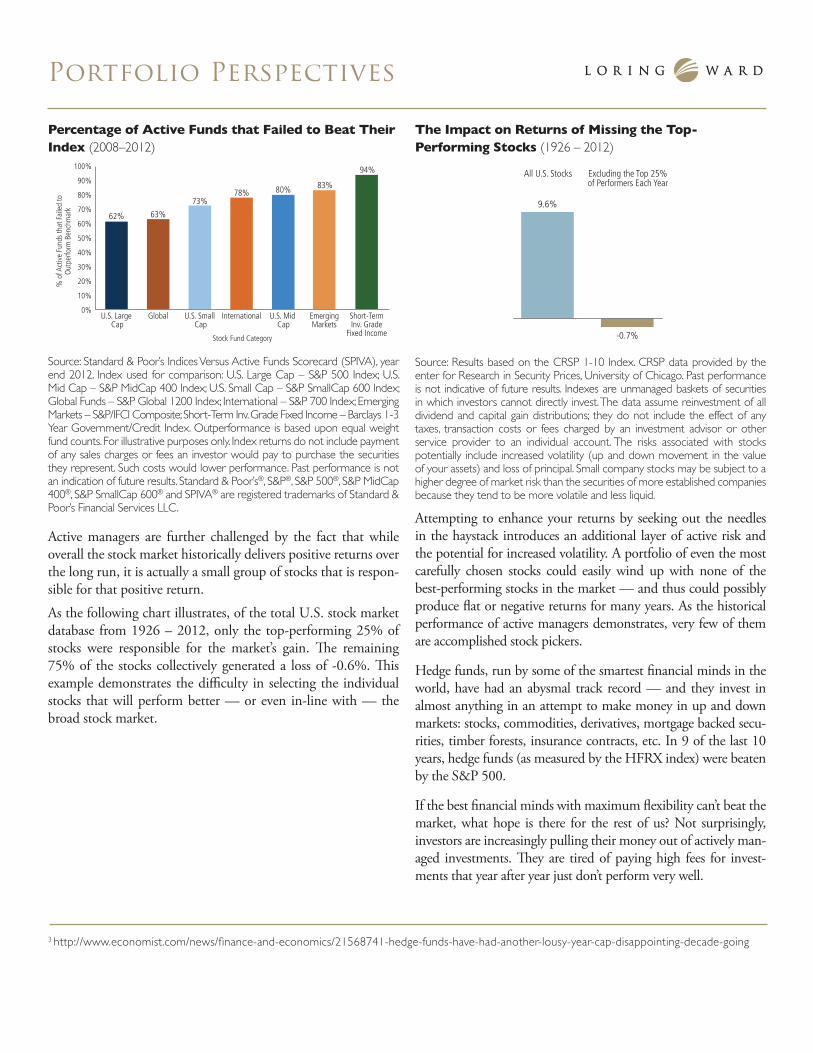
Percentage of Active Funds that Failed to Beat Their Index (2008–2012)
U.S. Large Cap
62%
U.S. Mid Cap
80%
U.S. Small Cap
73%
Global
63%
International
78%
EmergingMarkets
83%
Short-TermInv. Grade
Fixed Income
94%100%
90%
80%
70%
60%
50%
40%
30%
20%
10%
0%
Stock Fund Category
% o
f Act
ive
Fund
s th
at F
aile
d to
O
utpe
rform
Ben
chm
ark
Source: Standard & Poor’s Indices Versus Active Funds Scorecard (SPIVA), year end 2012. Index used for comparison: U.S. Large Cap – S&P 500 Index; U.S. Mid Cap – S&P MidCap 400 Index; U.S. Small Cap – S&P SmallCap 600 Index; Global Funds – S&P Global 1200 Index; International – S&P 700 Index; Emerging Markets – S&P/IFCI Composite; Short-Term Inv. Grade Fixed Income – Barclays 1-3 Year Government/Credit Index. Outperformance is based upon equal weight fund counts. For illustrative purposes only. Index returns do not include payment of any sales charges or fees an investor would pay to purchase the securities they represent. Such costs would lower performance. Past performance is not an indication of future results. Standard & Poor’s®, S&P®, S&P 500®, S&P MidCap 400®, S&P SmallCap 600® and SPIVA® are registered trademarks of Standard & Poor’s Financial Services LLC.
Active managers are further challenged by the fact that while overall the stock market historically delivers positive returns over the long run, it is actually a small group of stocks that is respon-sible for that positive return.
As the following chart illustrates, of the total U.S. stock market database from 1926 – 2012, only the top-performing 25% of stocks were responsible for the market’s gain. The remaining 75% of the stocks collectively generated a loss of -0.6%. This example demonstrates the difficulty in selecting the individual stocks that will perform better — or even in-line with — the broad stock market.
The Impact on Returns of Missing the Top- Performing Stocks (1926 – 2012)
All U.S. Stocks Excluding the Top 25% of Performers Each Year
9.6%
-0.7%
Source: Results based on the CRSP 1-10 Index. CRSP data provided by the enter for Research in Security Prices, University of Chicago. Past performance is not indicative of future results. Indexes are unmanaged baskets of securities in which investors cannot directly invest. The data assume reinvestment of all dividend and capital gain distributions; they do not include the effect of any taxes, transaction costs or fees charged by an investment advisor or other service provider to an individual account. The risks associated with stocks potentially include increased volatility (up and down movement in the value of your assets) and loss of principal. Small company stocks may be subject to a higher degree of market risk than the securities of more established companies because they tend to be more volatile and less liquid.
Attempting to enhance your returns by seeking out the needles in the haystack introduces an additional layer of active risk and the potential for increased volatility. A portfolio of even the most carefully chosen stocks could easily wind up with none of the best-performing stocks in the market — and thus could possibly produce flat or negative returns for many years. As the historical performance of active managers demonstrates, very few of them are accomplished stock pickers.
Hedge funds, run by some of the smartest financial minds in the world, have had an abysmal track record — and they invest in almost anything in an attempt to make money in up and down markets: stocks, commodities, derivatives, mortgage backed secu-rities, timber forests, insurance contracts, etc. In 9 of the last 10 years, hedge funds (as measured by the HFRX index) were beaten by the S&P 500.
If the best financial minds with maximum flexibility can’t beat the market, what hope is there for the rest of us? Not surprisingly, investors are increasingly pulling their money out of actively man-aged investments. They are tired of paying high fees for invest-ments that year after year just don’t perform very well.
3 http://www.economist.com/news/finance-and-economics/21568741-hedge-funds-have-had-another-lousy-year-cap-disappointing-decade-going
Portfolio Perspectives
Past performance does not guarantee future results and the principal value of an investment will fluctuate so that an investor’s shares, when redeemed, may be worth more or less than their original cost.Diversification neither assures a profit nor guarantees against loss in a declining market.All investments involve risk, including the loss of principal and cannot be guaranteed against loss by a bank, custodian, or any other financial institution.© 2013 LWI Financial Inc. All rights reserved. LWI Financial Inc. (“Loring Ward”) is an investment adviser registered with the Securities and Exchange Commission. Securities transactions are offered through its affiliate, Loring Ward Securities Inc., member FINRA/SIPC. R 13-260 (Exp 7/15)
Lesson Four Diversification Still Works
Diversification has long been considered an essential tool for investors.
We believe that the Great Recession provided a powerful example of the true benefits of diversification.
If you had been invested in just one asset class, such as the S&P 500 in 2008, your net worth may have been down about 37%. However, if you diversified and built a portfolio that included bonds and cash, asset classes which both experienced positive returns in 2008, you would have been in better shape.
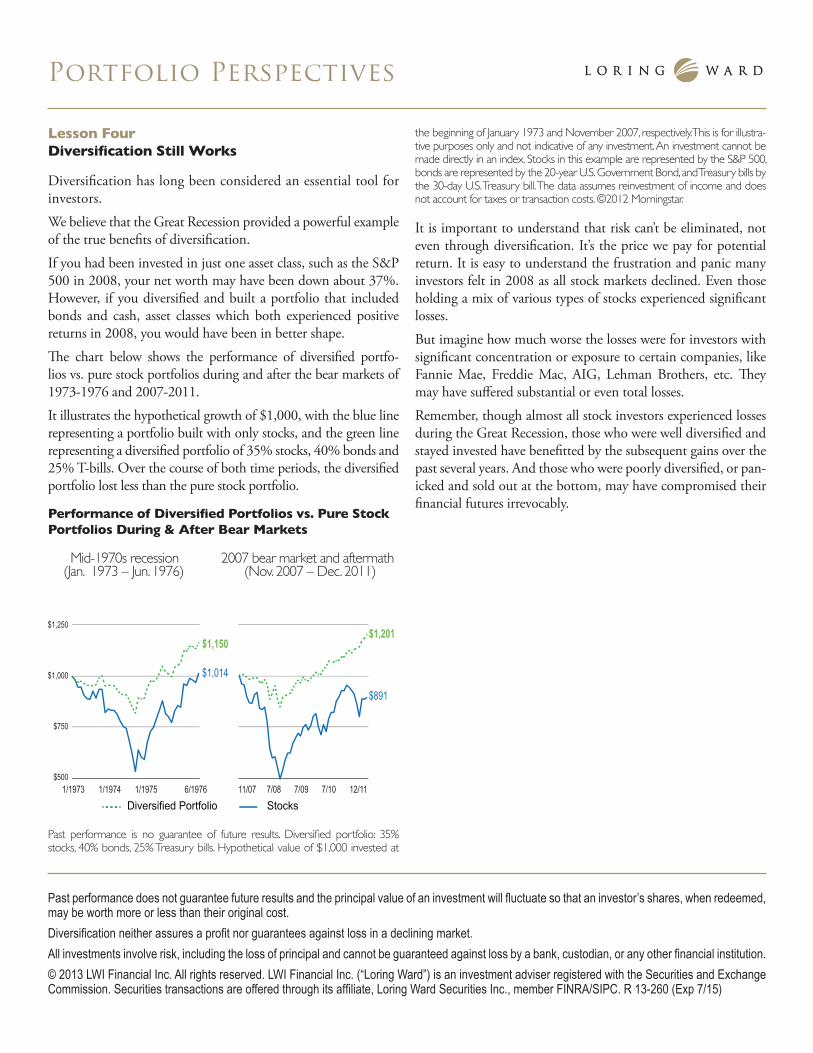
The chart below shows the performance of diversified portfo-lios vs. pure stock portfolios during and after the bear markets of 1973-1976 and 2007-2011.
It illustrates the hypothetical growth of $1,000, with the blue line representing a portfolio built with only stocks, and the green line representing a diversified portfolio of 35% stocks, 40% bonds and 25% T-bills. Over the course of both time periods, the diversified portfolio lost less than the pure stock portfolio.
Performance of Diversified Portfolios vs. Pure Stock Portfolios During & After Bear Markets
Mid-1970s recession 2007 bear market and aftermath (Jan. 1973 – Jun. 1976) (Nov. 2007 – Dec. 2011)
Past performance is no guarantee of future results. Diversified portfolio: 35% stocks, 40% bonds, 25% Treasury bills. Hypothetical value of $1,000 invested at
the beginning of January 1973 and November 2007, respectively. This is for illustra-tive purposes only and not indicative of any investment. An investment cannot be made directly in an index. Stocks in this example are represented by the S&P 500, bonds are represented by the 20-year U.S. Government Bond, and Treasury bills by the 30-day U.S. Treasury bill. The data assumes reinvestment of income and does not account for taxes or transaction costs. ©2012 Morningstar.
It is important to understand that risk can’t be eliminated, not even through diversification. It’s the price we pay for potential return. It is easy to understand the frustration and panic many investors felt in 2008 as all stock markets declined. Even those holding a mix of various types of stocks experienced significant losses.
But imagine how much worse the losses were for investors with significant concentration or exposure to certain companies, like Fannie Mae, Freddie Mac, AIG, Lehman Brothers, etc. They may have suffered substantial or even total losses.
Remember, though almost all stock investors experienced losses during the Great Recession, those who were well diversified and stayed invested have benefitted by the subsequent gains over the past several years. And those who were poorly diversified, or pan-icked and sold out at the bottom, may have compromised their financial futures irrevocably.
1/1973 1/1974 1/1975 11/07 7/08 7/09 7/10
$500
$750
$1,000
$1,250
StocksDiversified Portfolio
$1,201
$891
$1,150
$1,014
12/116/1976