Embed Size (px)
Citation preview

Private Debt, Public Virtues
On the relationship between welfare and household debt.
Martino Comelli [email protected]
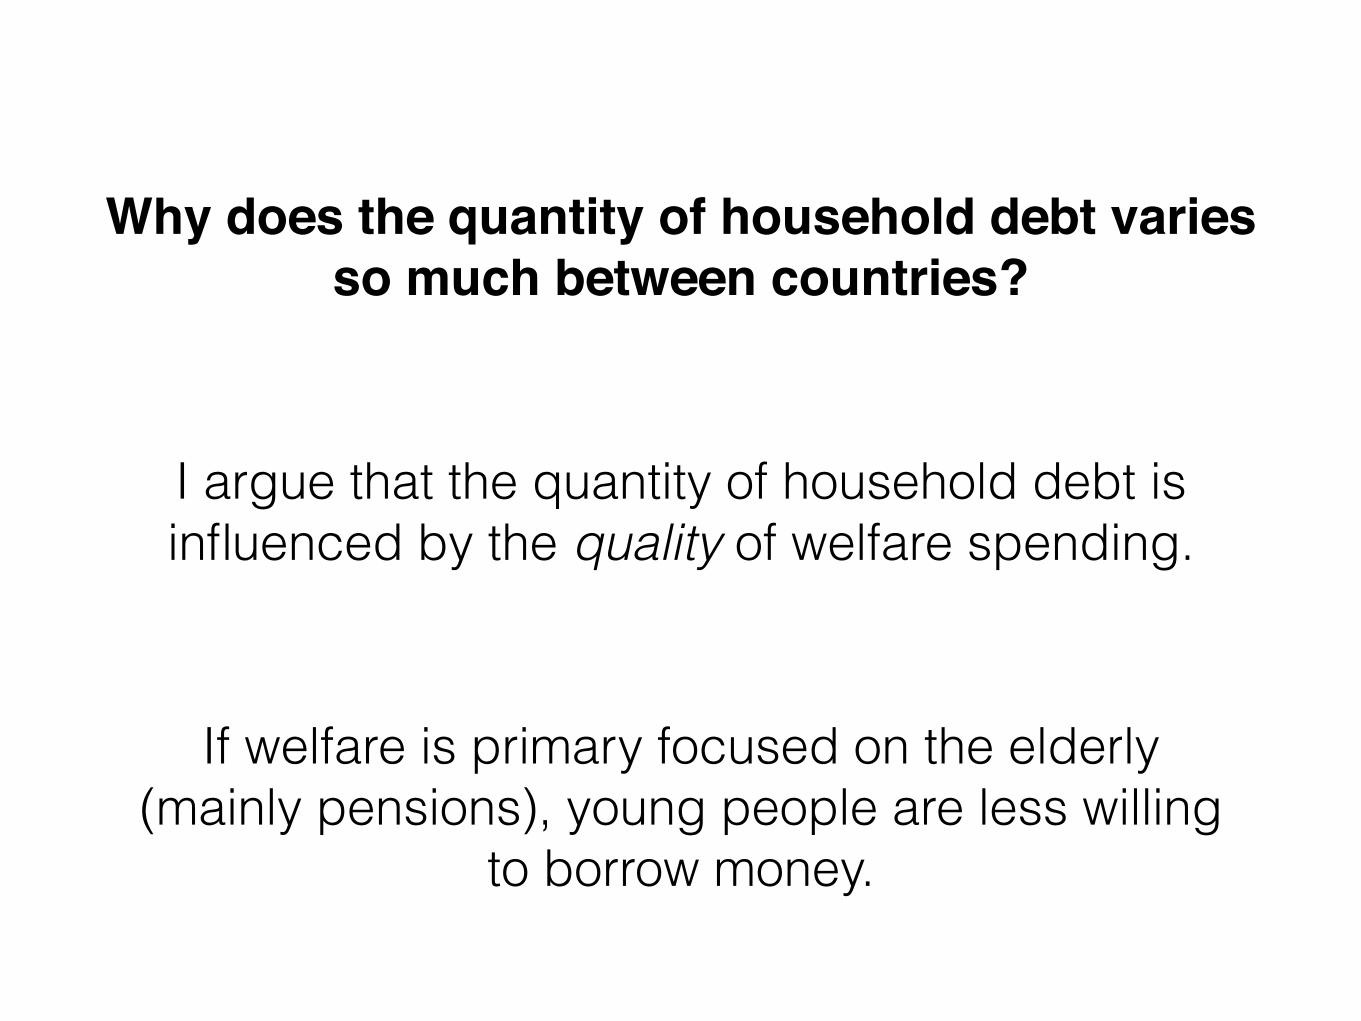
Why does the quantity of household debt varies so much between countries?
If welfare is primary focused on the elderly (mainly pensions), young people are less willing
to borrow money.
I argue that the quantity of household debt is influenced by the quality of welfare spending.

Structure• What the current literature is saying, and what is missing:
• Substitutive relationship
• Complementary relationship
• An alternative explanation:
• How is household debt is distributed in Europe between citizens?
• How is household debt is distributed in Europe between countries?
• How does welfare programs influence that distribution?
• Patterns of Welfare and Debt.
But first…
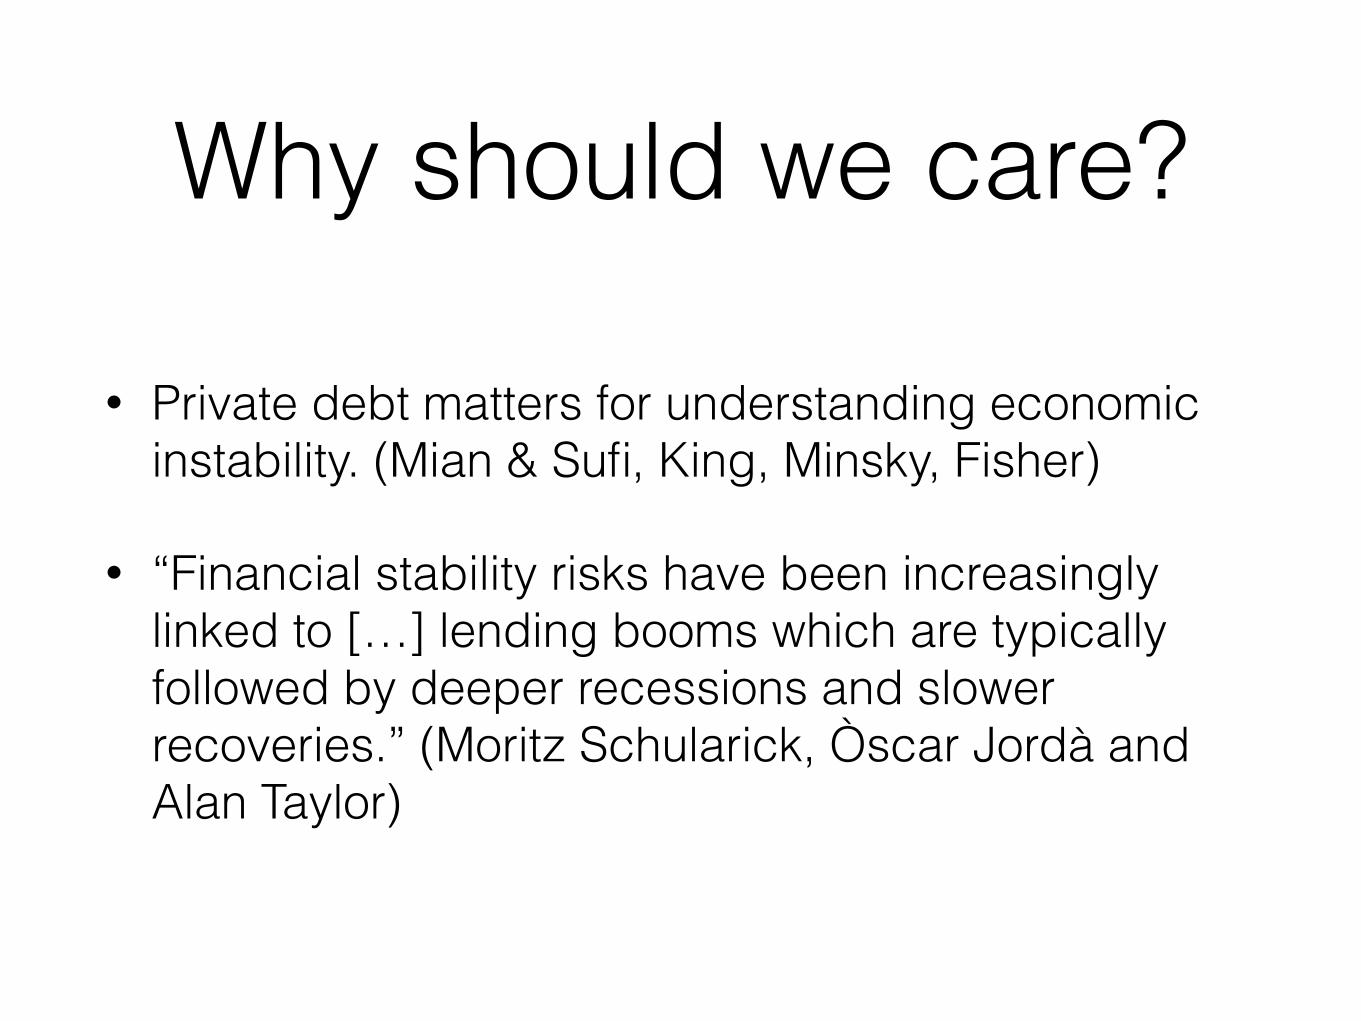
Why should we care?
• Private debt matters for understanding economic instability. (Mian & Sufi, King, Minsky, Fisher)
• “Financial stability risks have been increasingly linked to […] lending booms which are typically followed by deeper recessions and slower recoveries.” (Moritz Schularick, Òscar Jordà and Alan Taylor)
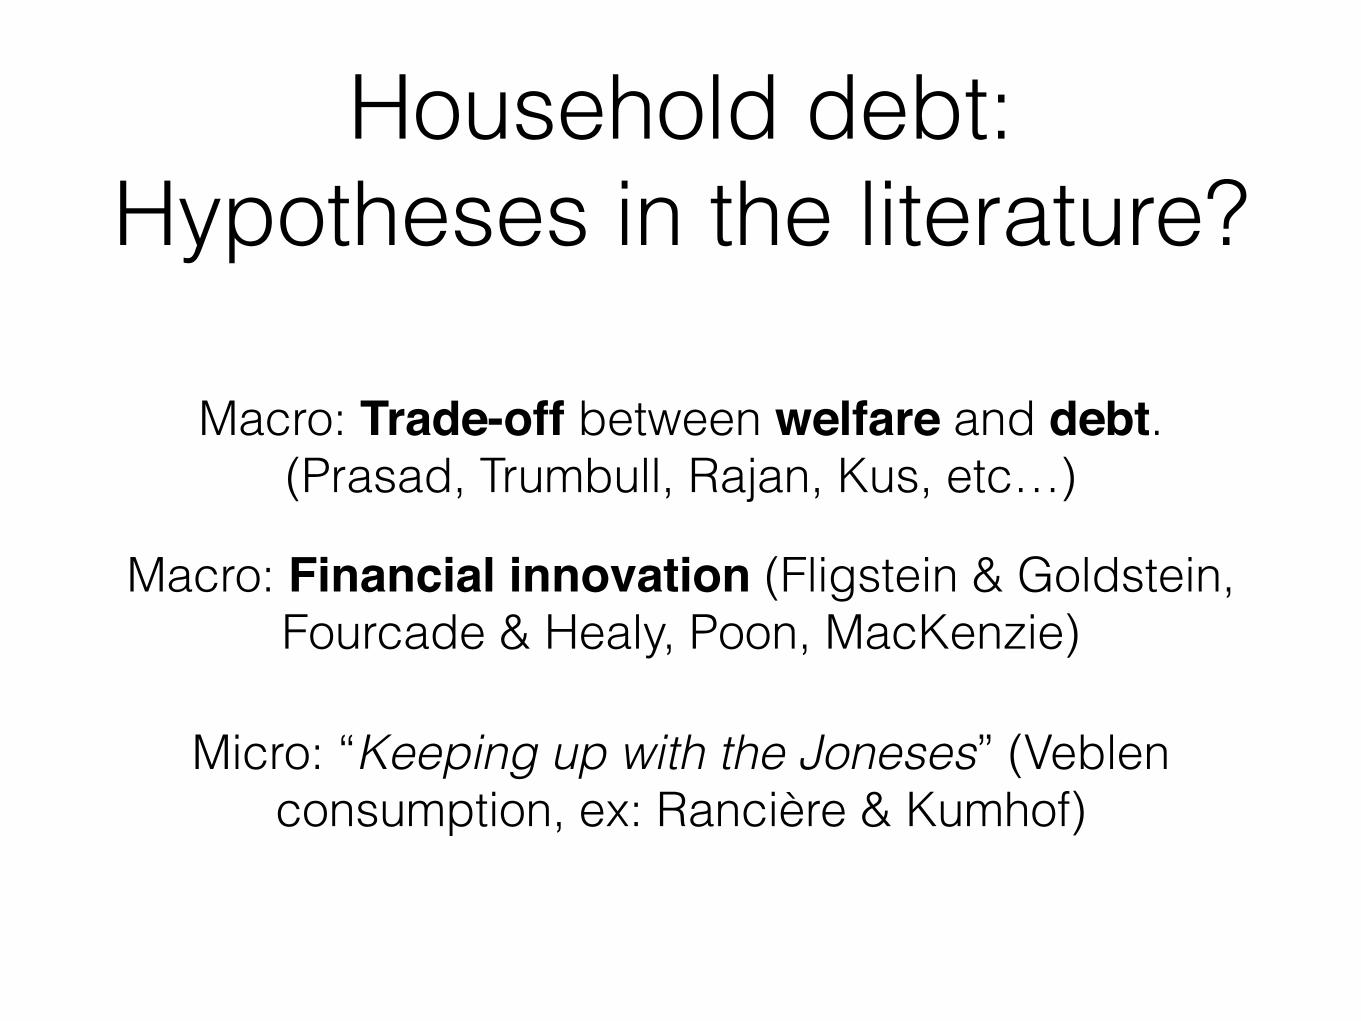
Macro: Trade-off between welfare and debt. (Prasad, Trumbull, Rajan, Kus, etc…)
Household debt: Hypotheses in the literature?
Micro: “Keeping up with the Joneses” (Veblen consumption, ex: Rancière & Kumhof)
Macro: Financial innovation (Fligstein & Goldstein, Fourcade & Healy, Poon, MacKenzie)
http://www2.asanet.org/sectionchs/secure/prasad.pdf
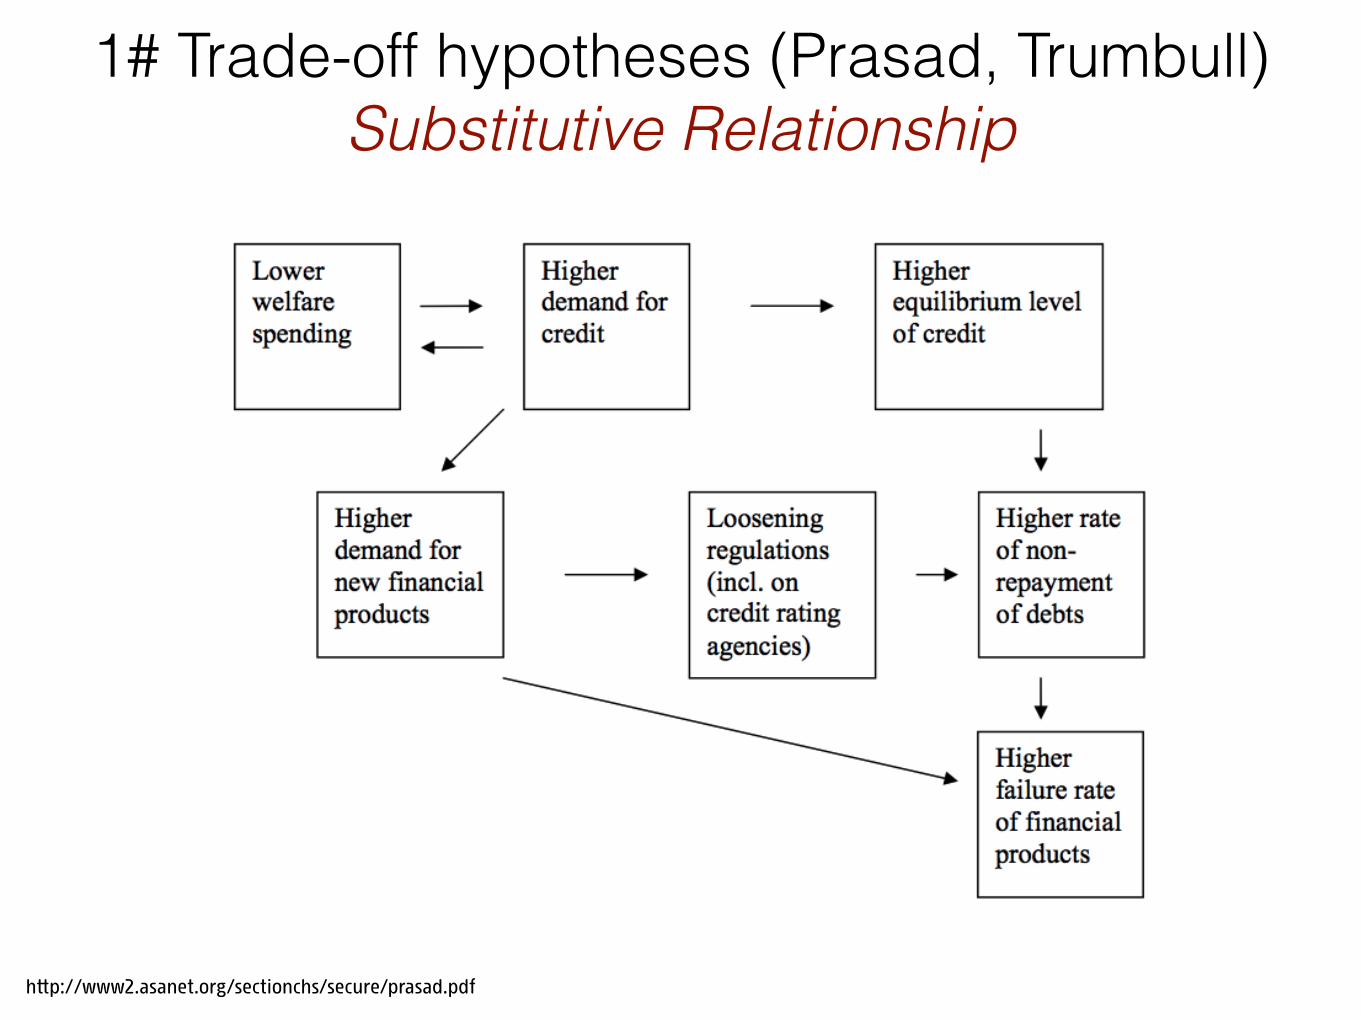
1# Trade-off hypotheses (Prasad, Trumbull) Substitutive Relationship
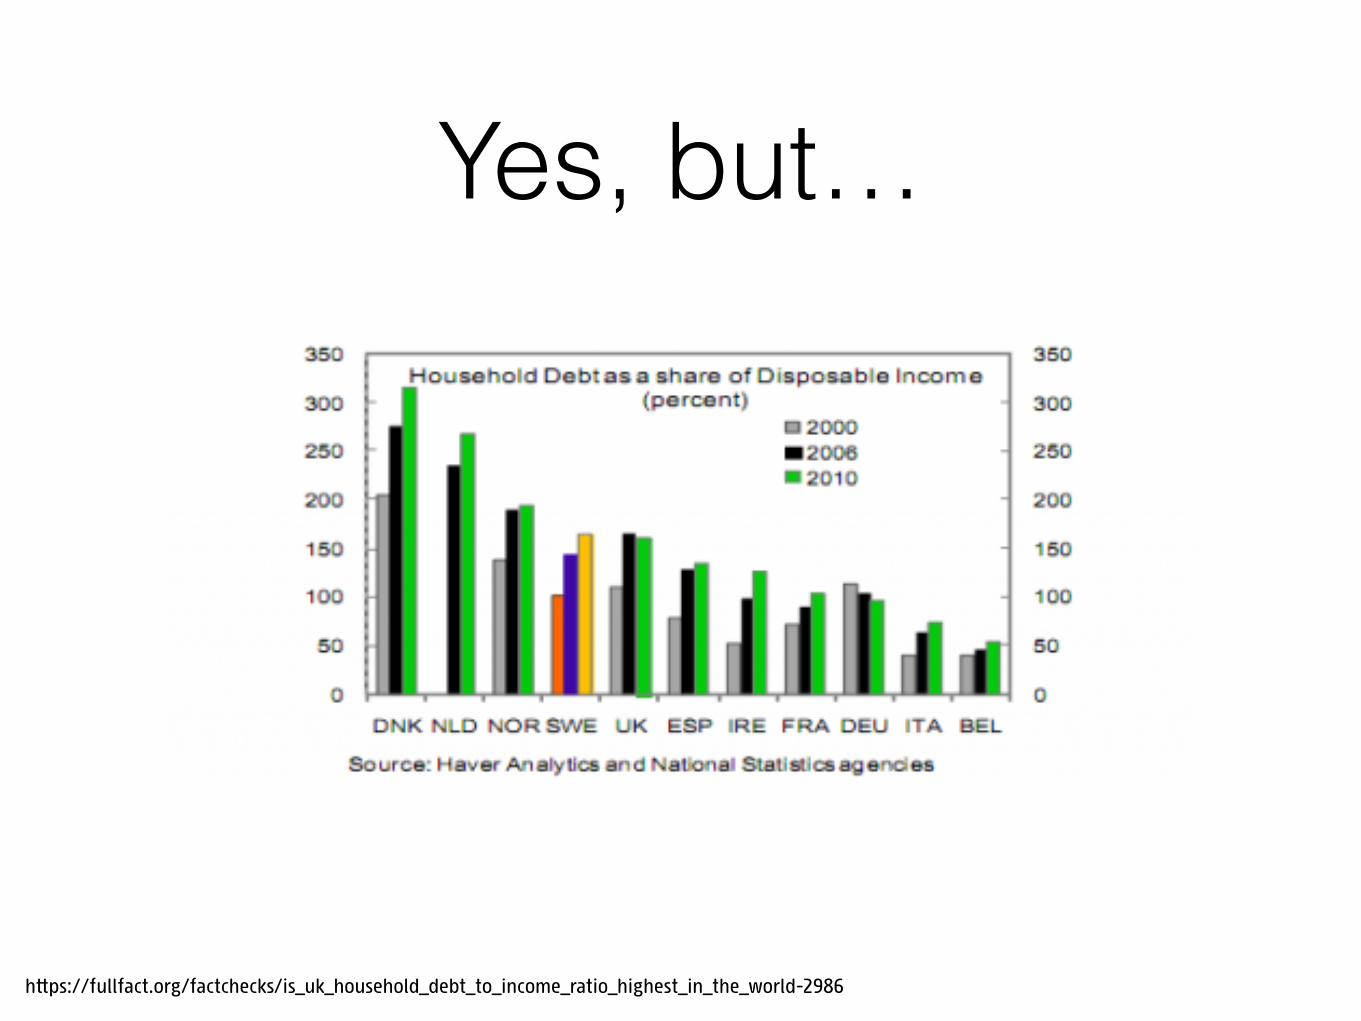
Yes, but…
https://fullfact.org/factchecks/is_uk_household_debt_to_income_ratio_highest_in_the_world-2986
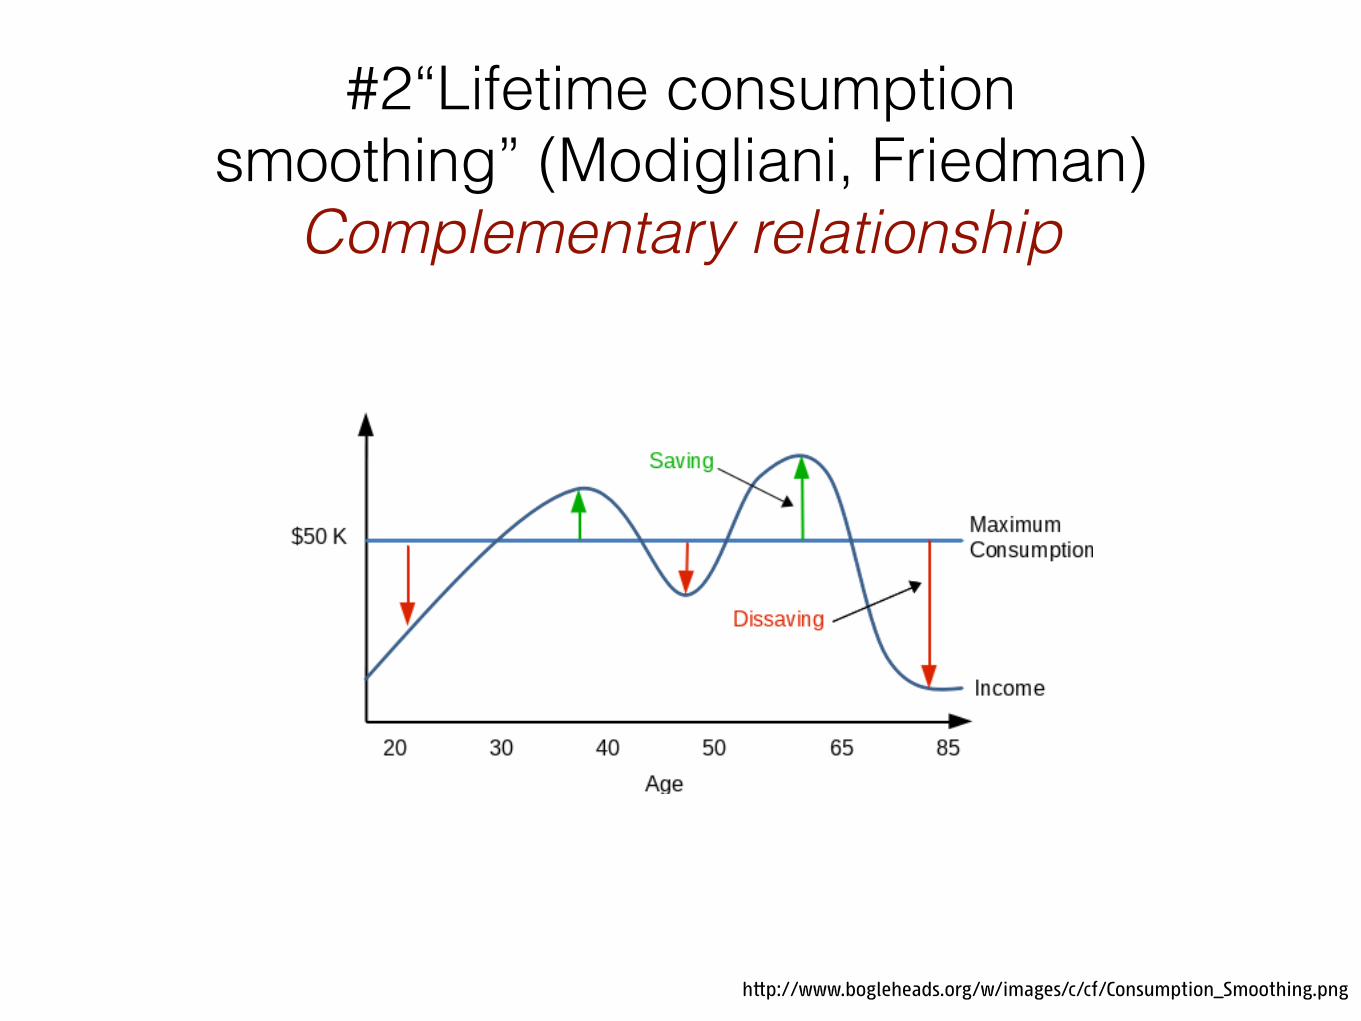
#2“Lifetime consumption smoothing” (Modigliani, Friedman)
Complementary relationship
http://www.bogleheads.org/w/images/c/cf/Consumption_Smoothing.png

10
TABLE 4: Probability of Household Debt(Probit estimations)
Age35-4445-5455-64>65
EducationSecondary>= Tertiary
Income Quintiles2345
Relative PovertyPoor
Household SizeTwoThreeFour5 or more.
Household typeSingle ParentCouple, No ChildrenCouple, With Children5 or more.
ImmigrationImmigrant
HealthDisabled
Working StatusEmployedMainly employedUnemployed
Constant
No. Of ObservationsPseudo R^2
Source: LIS dataset 2004.
Country dummies are included. (***) coefficient is significantly different from zero at the 1% (**) 5% (*) 10%.
Model 1
0.1710.048-0.42-1.03
0.2250.324
-0.791
1831010.197
(***)(**)(***)(***)
(***)(***)
(***)
Model 2
0.177-0.007-0.472-1.029
0.1020.091
0.3110.57
0.6730.869
-0.311
-1.13
1824790.224
(***)
(***)(***)
(***)(***)
(***)(***)(***)(***)
(***)
(***)
Model 3
0.1680.013
-0.362-0.823
0.130.151
0.3070.5560.6560.845
-0.269
0.0340.0930.3030.293
-0.0130.3150.407
(omitted)
-1.581
1824790.244
(***)
(***)(***)
(***)(***)
(***)(***)(***)(***)
(***)
(**)(***)(***)
(***)(***)
(***)
Model 4
0.06-0.121-0.421-0.892
0.0230.117
0.1530.3340.4770.691
-0.368
0.20.1820.3980.382
-0.0230.1170.252
(omitted)
-0.162
-0.038
-1.217
881030.22
(***)(***)(***)
(**)
(***)(***)(***)(***)
(***)
(*)(**)(***)(***)
(***)
(**)
(***)
Model 5
0.061-0.122-0.404-0.789
0.0440.128
0.1320.3110.4510.568
-0.306
0.180.1610.3950.387
-0.0280.1210.236
(omitted)
-0.16
-0.05
0.0270.016-0.18
-1.229
615540.119
(**)(***)(***)
(**)
(**)(***)(***)(***)
(***)
(*)(*)(***)(***)
(***)
(**)
(**)
(***)
Luxembourg Income Studies (2004)
11
Young, rich, educated. (demographic, economic, social reasons…)
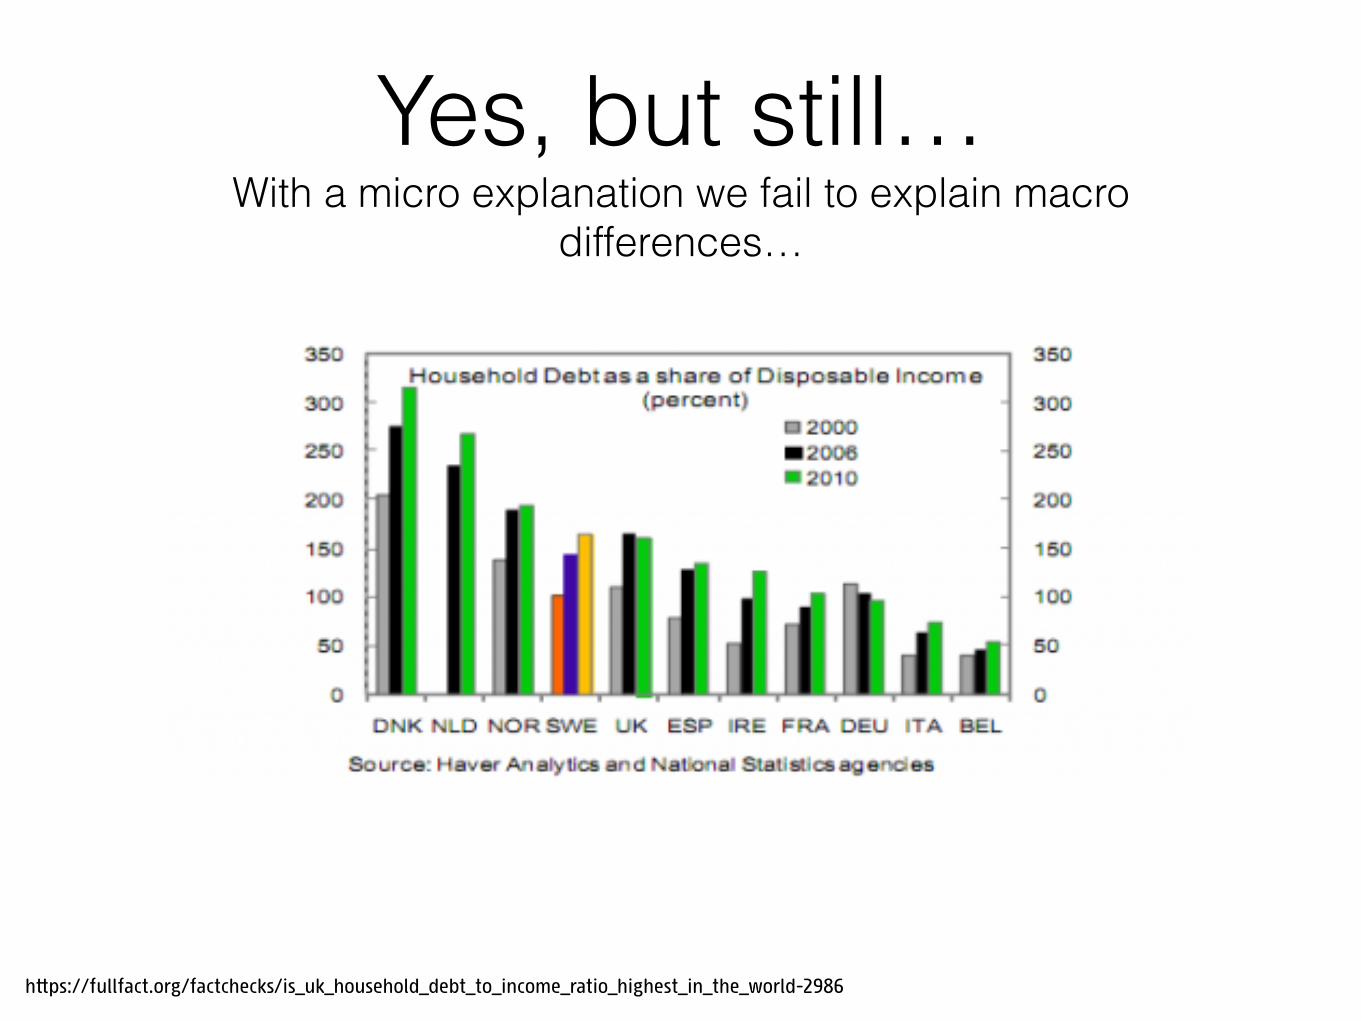
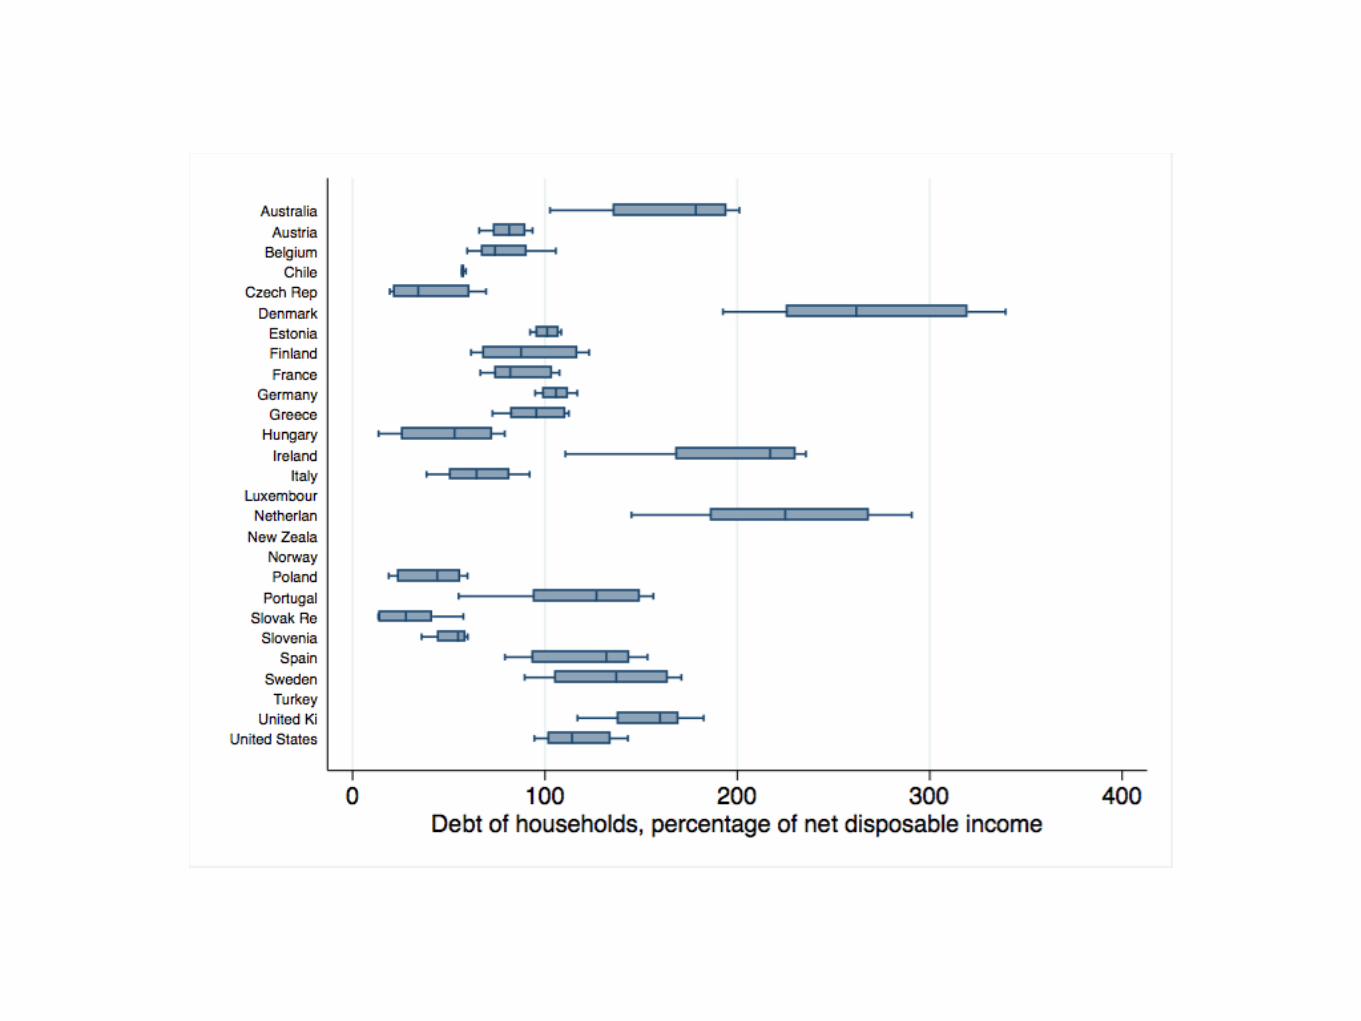
Yes, but still… With a micro explanation we fail to explain macro
differences…
https://fullfact.org/factchecks/is_uk_household_debt_to_income_ratio_highest_in_the_world-2986
13
We need a sociological explanation!
14
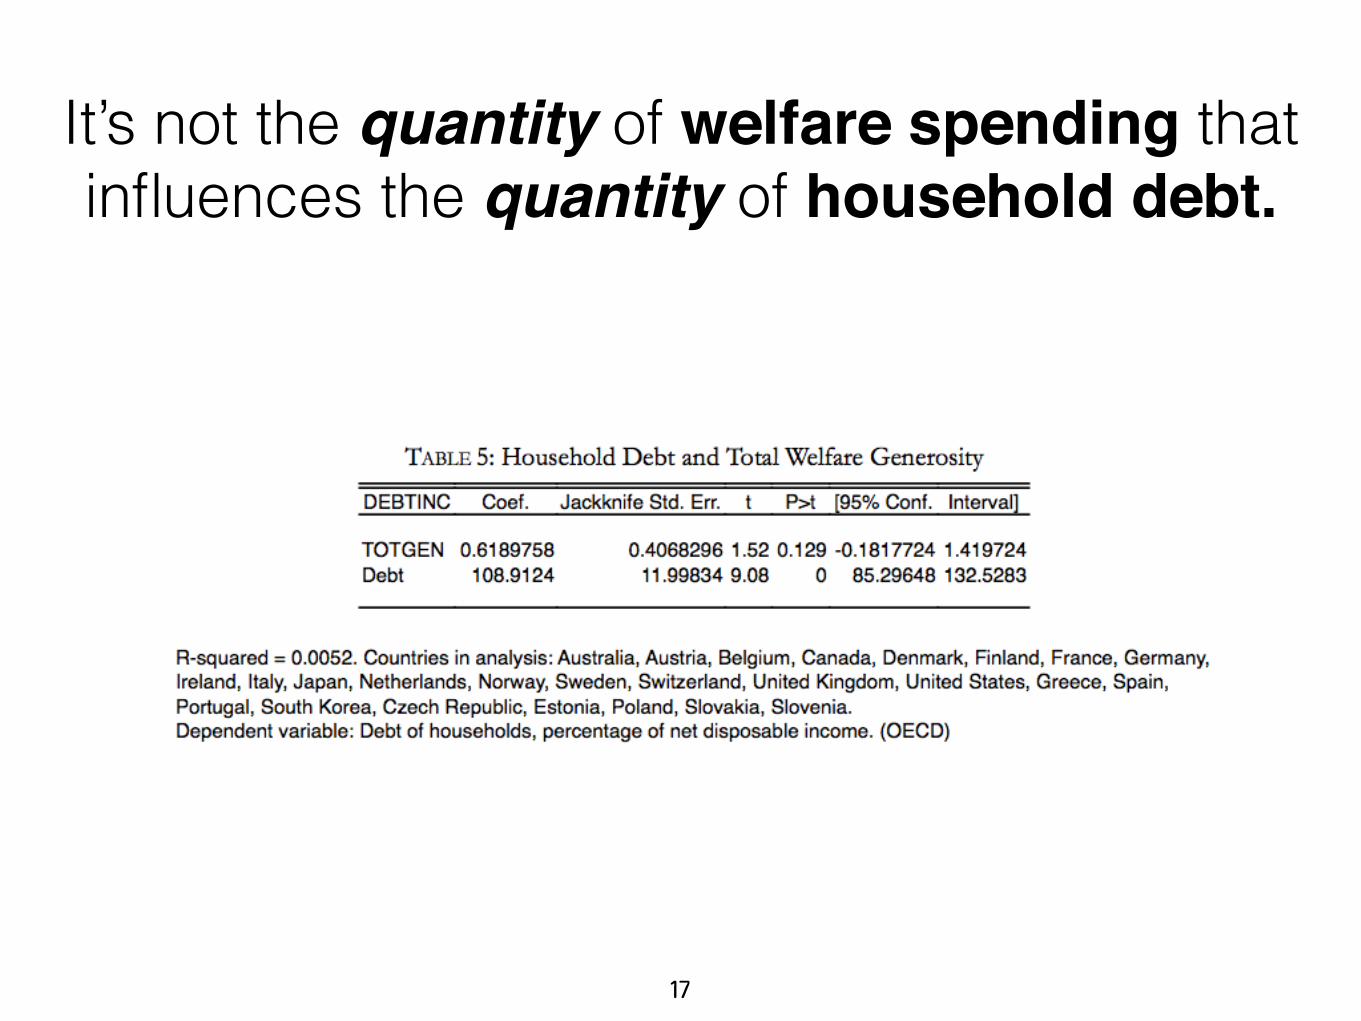
It’s not the quantity of welfare spending that
influences the quantity of household debt.
15
…but the quality of welfare spending that influences the quantity of household
debt.
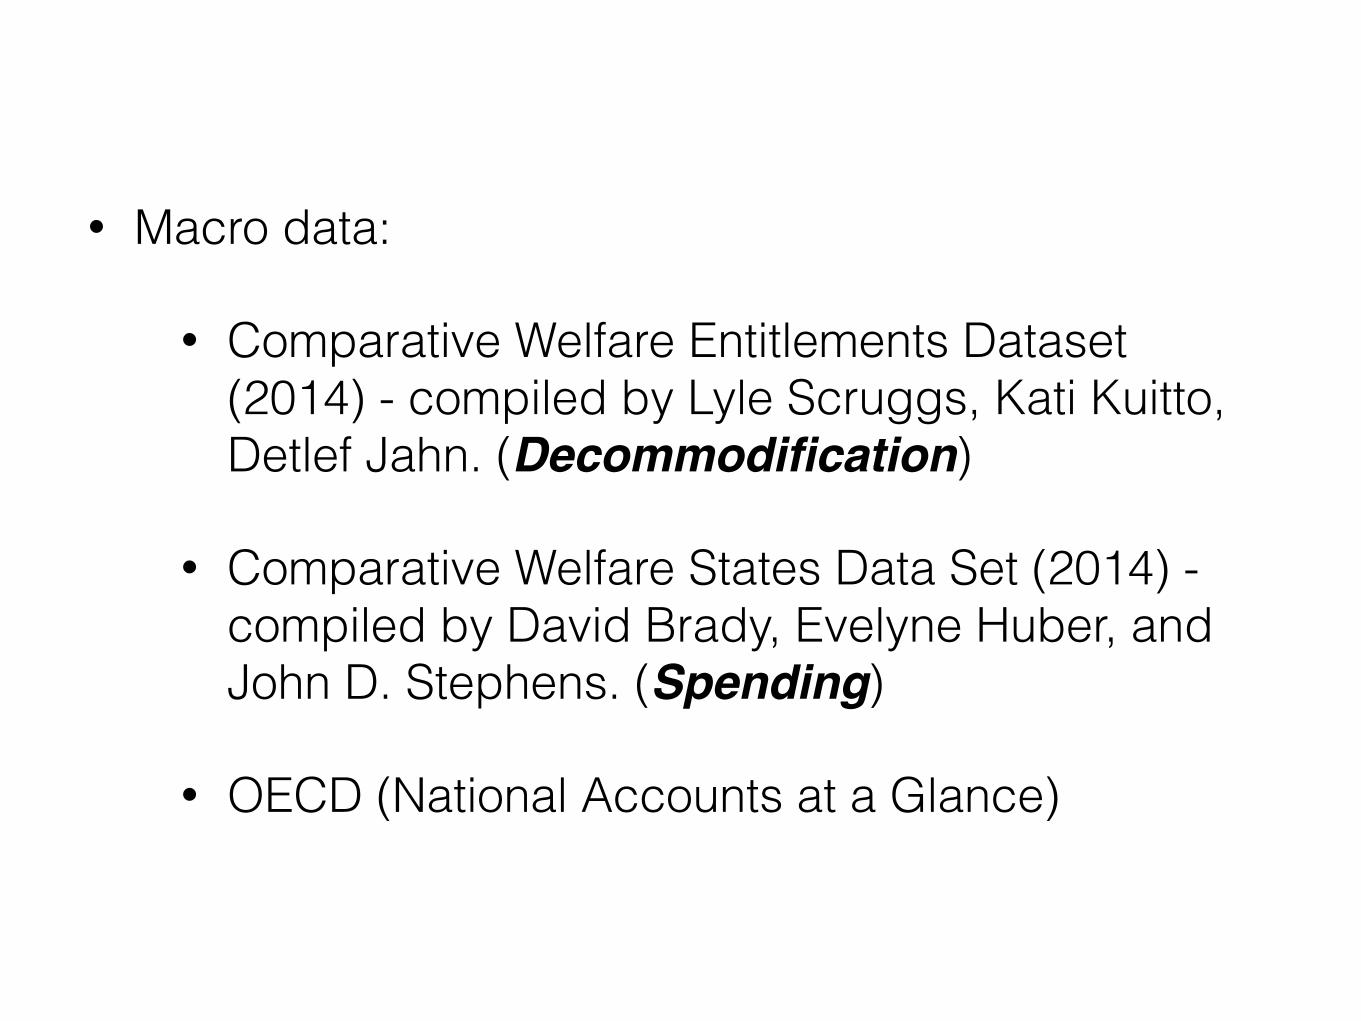
• Macro data:
• Comparative Welfare Entitlements Dataset (2014) - compiled by Lyle Scruggs, Kati Kuitto, Detlef Jahn. (Decommodification)
• Comparative Welfare States Data Set (2014) - compiled by David Brady, Evelyne Huber, and John D. Stephens. (Spending)
• OECD (National Accounts at a Glance)
17
It’s not the quantity of welfare spending that influences the quantity of household debt.
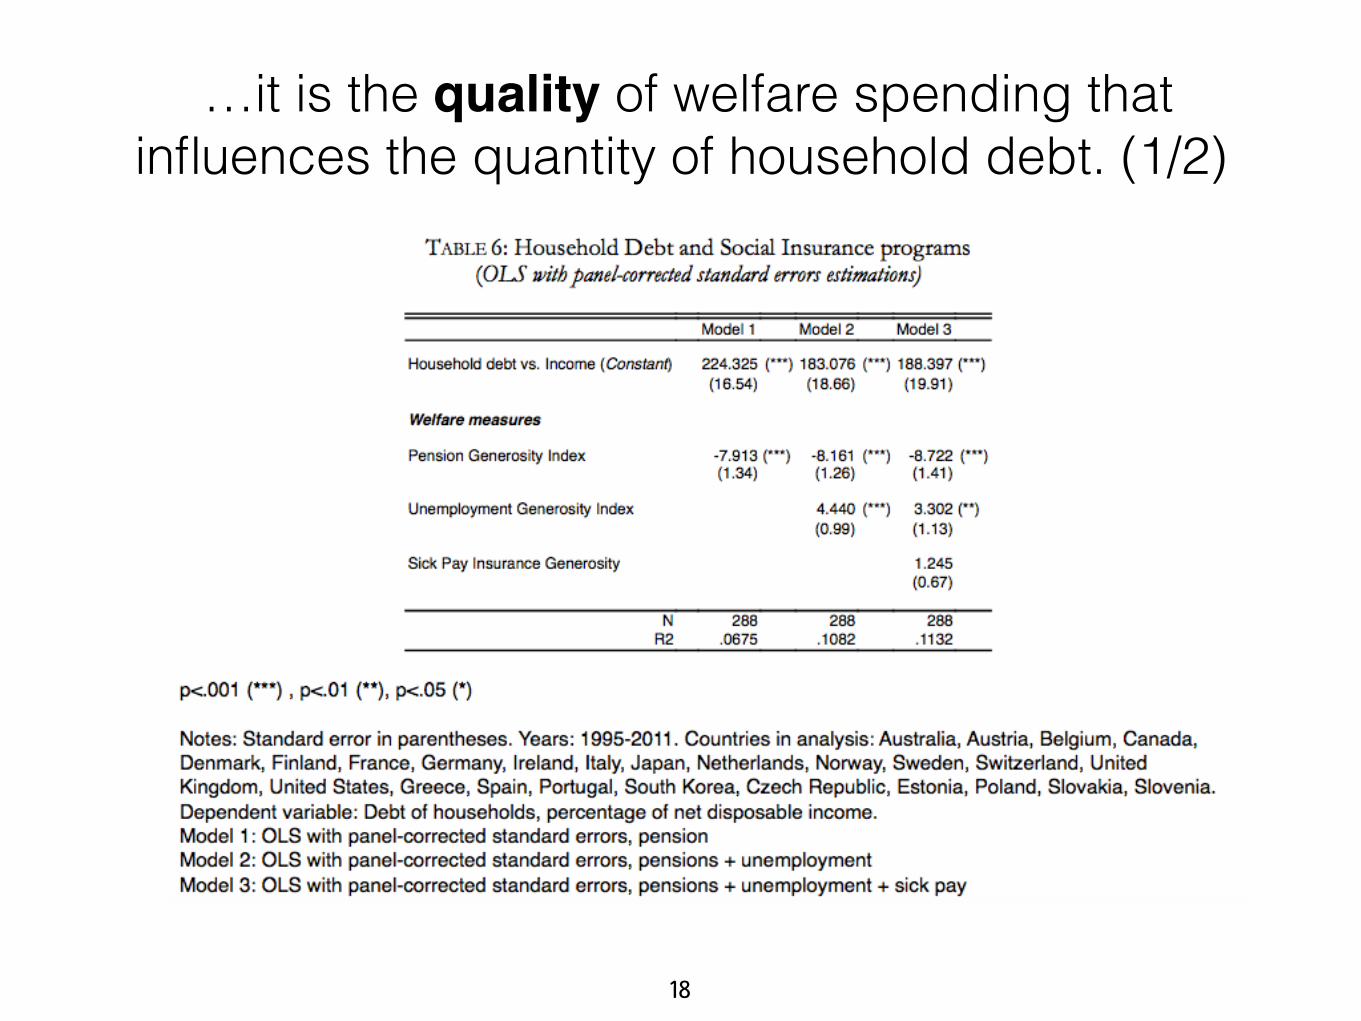
18
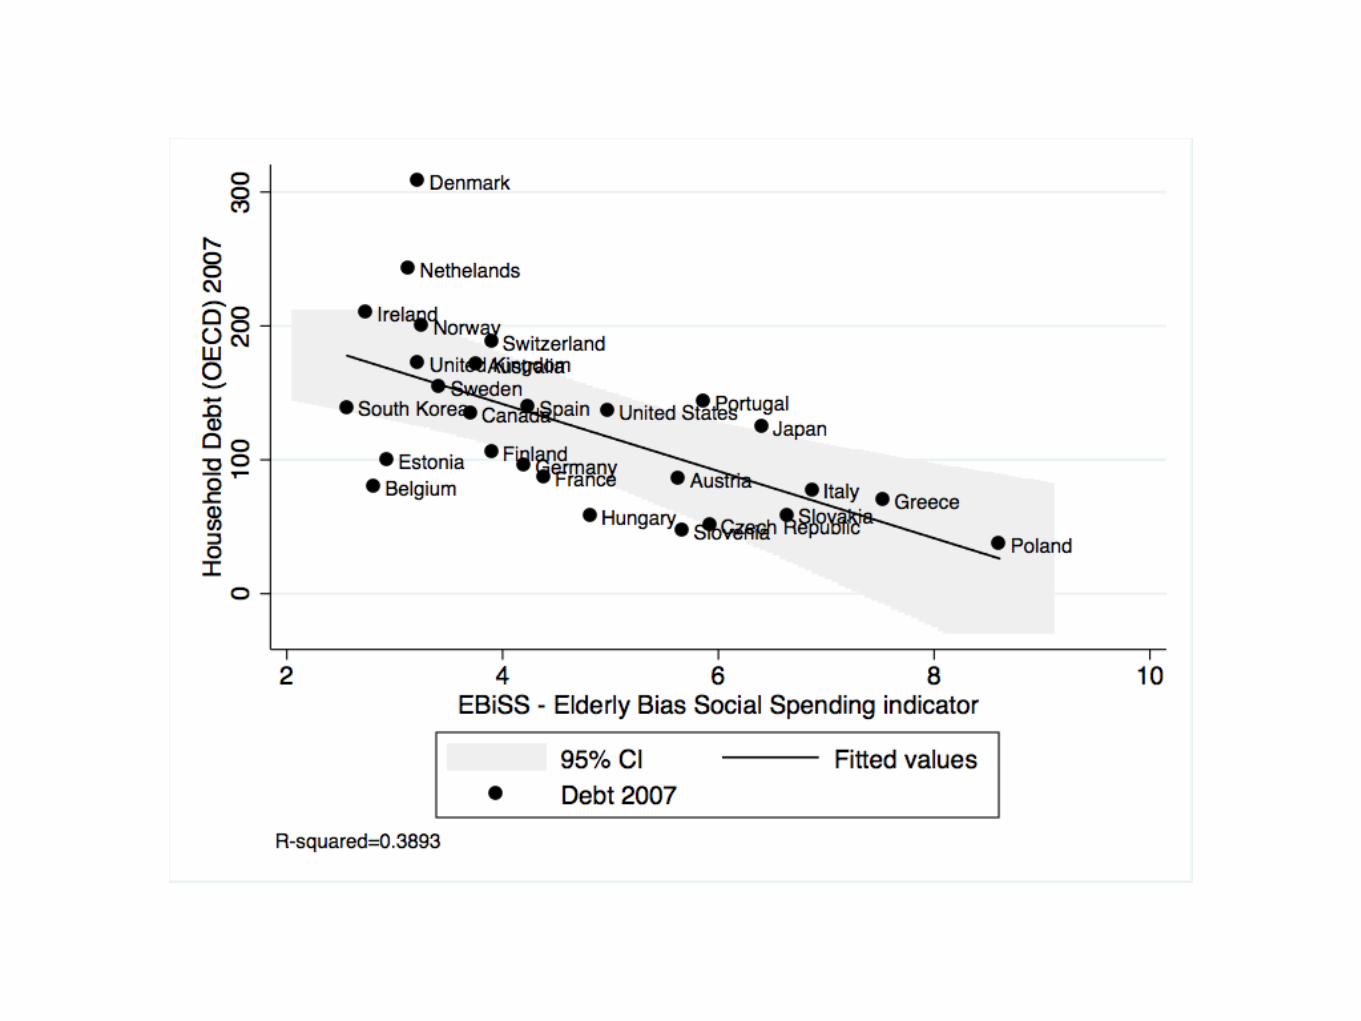
…it is the quality of welfare spending that influences the quantity of household debt. (1/2)
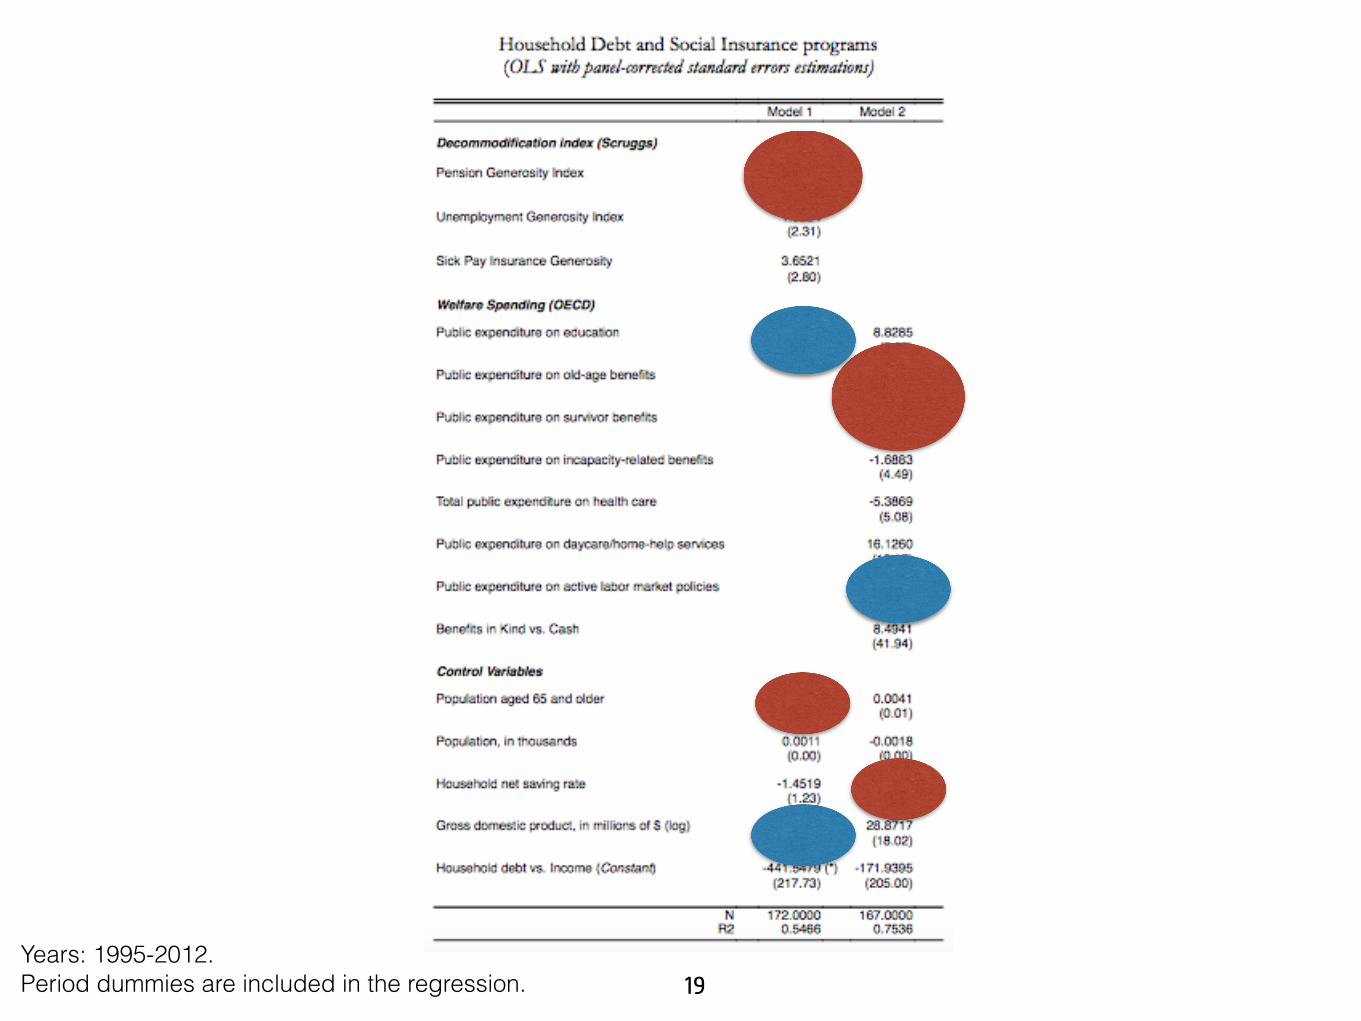
19Years: 1995-2012. Period dummies are included in the regression.

Elderly-oriented spending (numerator) / Non-elderly oriented spending (denominator)
Pieter Vanhuysse, Intergenerational Justice in Aging Societies, http://www.bertelsmann-stiftung.de/fileadmin/system/flexpaper/rsmbstpublications/download_file/3359/3359_26.pdf

22
It is the quality of welfare spending that influences the quantity of household debt…
…and by quality I mean who gets welfare money and services.


24
Ok, but do you have a theory?
• The expectation that personal finances will be stable makes people less risk averse.
• That’s why the rich borrow more in general.
• Northern welfare states facilitate the expectation that personal / household finances will be stable, especially for youth.
• That’s why Scandinavians borrow more in general.
• Continental welfare states fail to guarantee stable financial expectations, especially for youth.
• That’s why continentals borrow less.
25
Do you have a (research) agenda?
• Stable financial perspectives make people less risk averse.
• That’s why Scandinavians have an higher fertility rate.
• …and that’s why continental Europe (with the exception of France) has a very low fertility rate.
• Babies and families are like debt: a long term risk.
• Debt, children, startups, etc…
26
…How does the quality of welfare spending influences the quality of household debt?
(Mary Caplan & Me)
But what about short term risks? And in particular short term debt?
Consumer credit
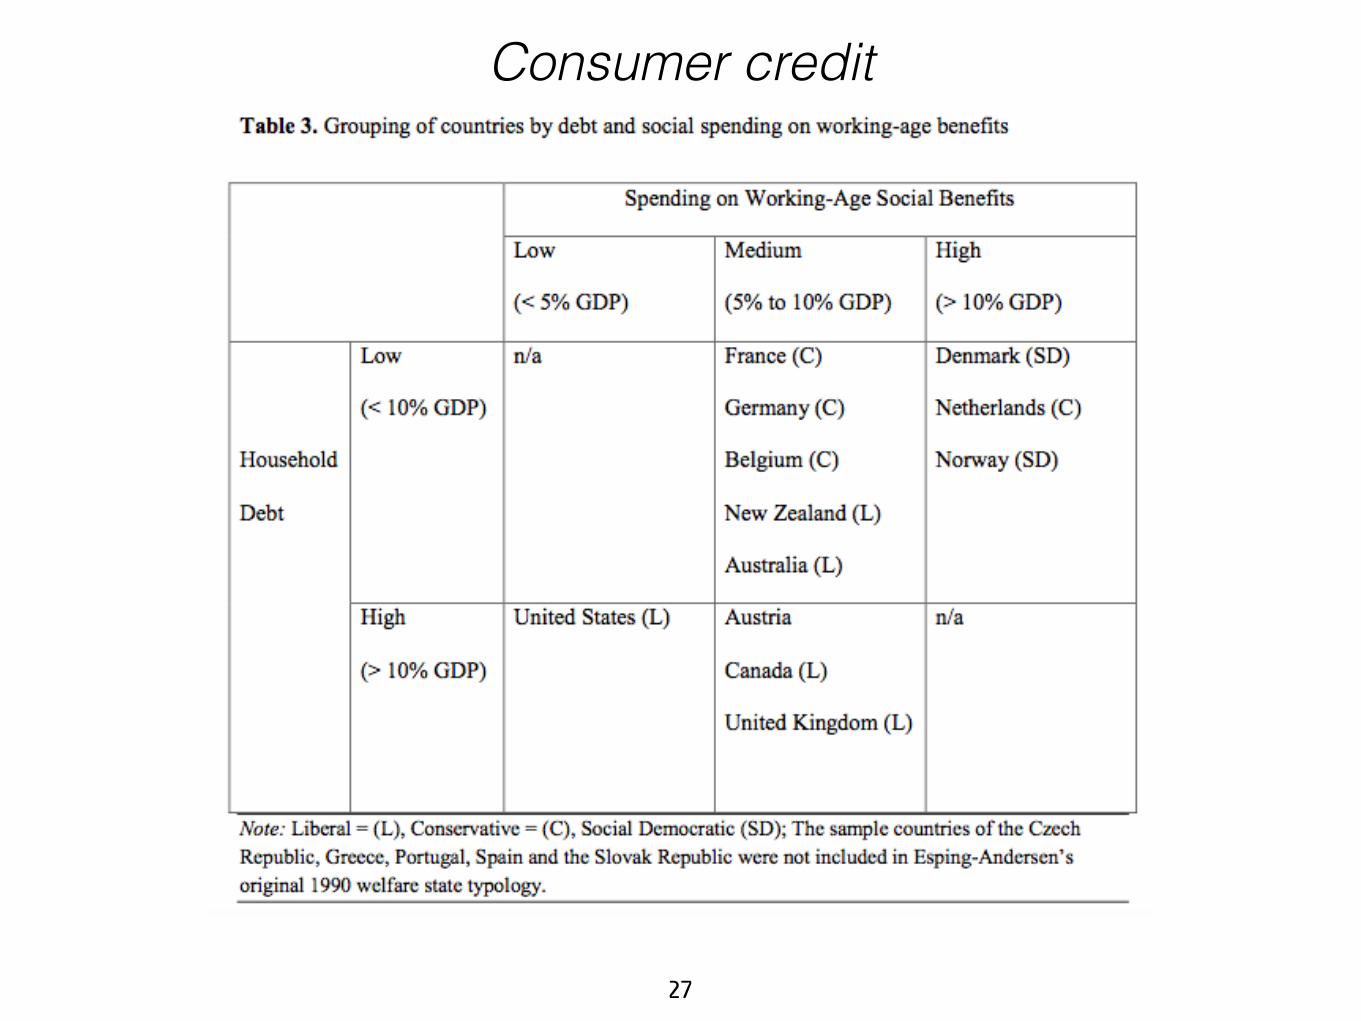
27
Consumer credit

28
The Three Worlds of Debtfare Capitalism
Welfare /Debt Continental Universal Liberal
Short term(Consumer
credit)Low Low High
Long Term(Mortgages) Low High Medium
29
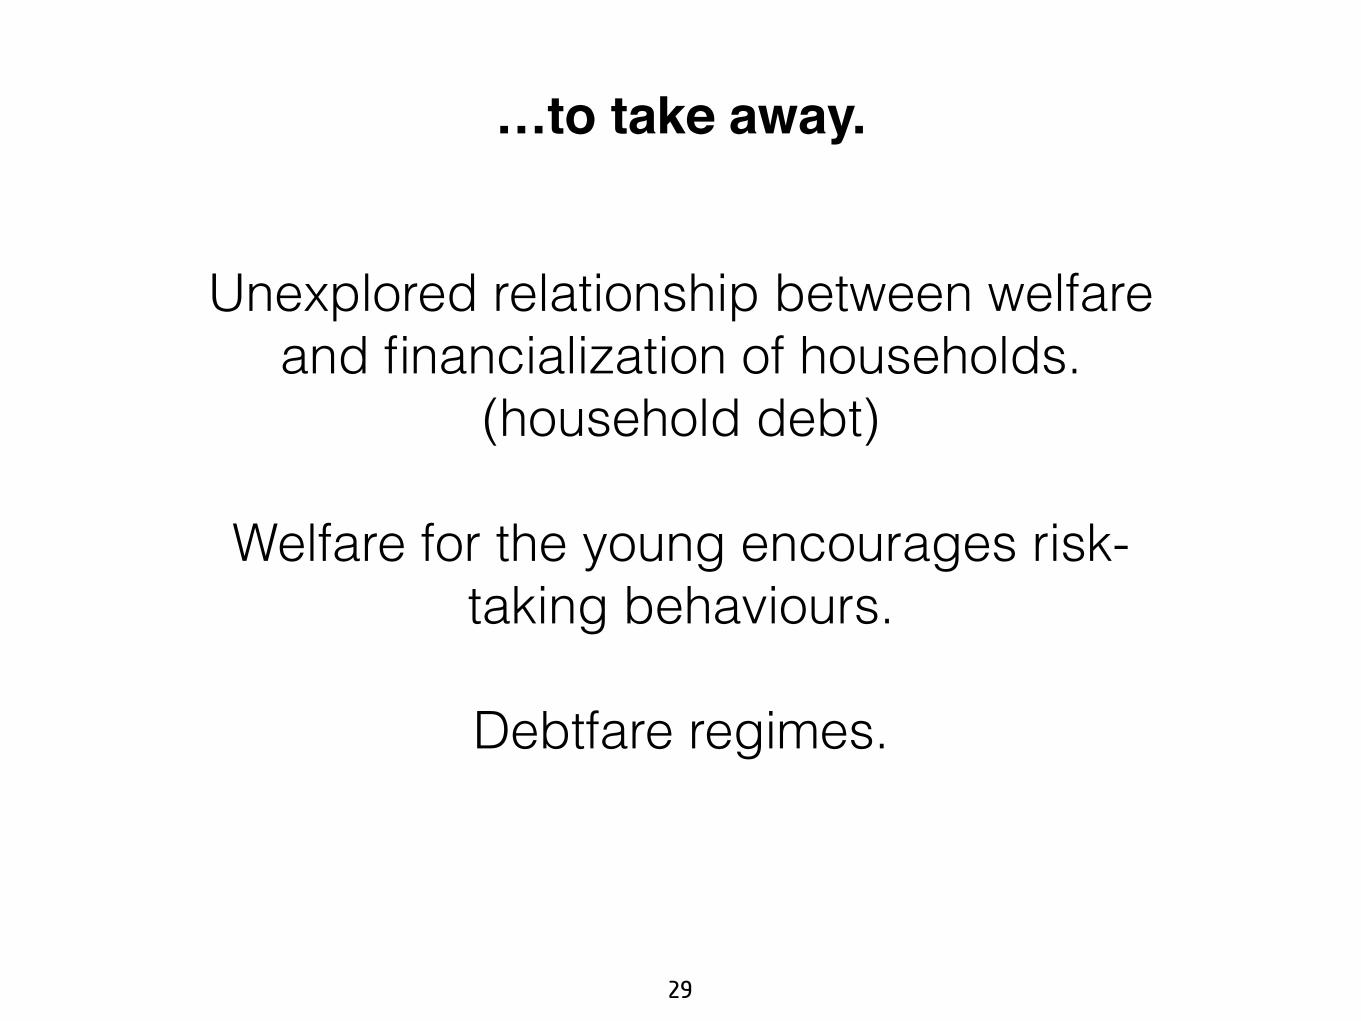
…to take away.
Unexplored relationship between welfare and financialization of households.
(household debt)
Welfare for the young encourages risk-taking behaviours.
Debtfare regimes.

I’m done!
31
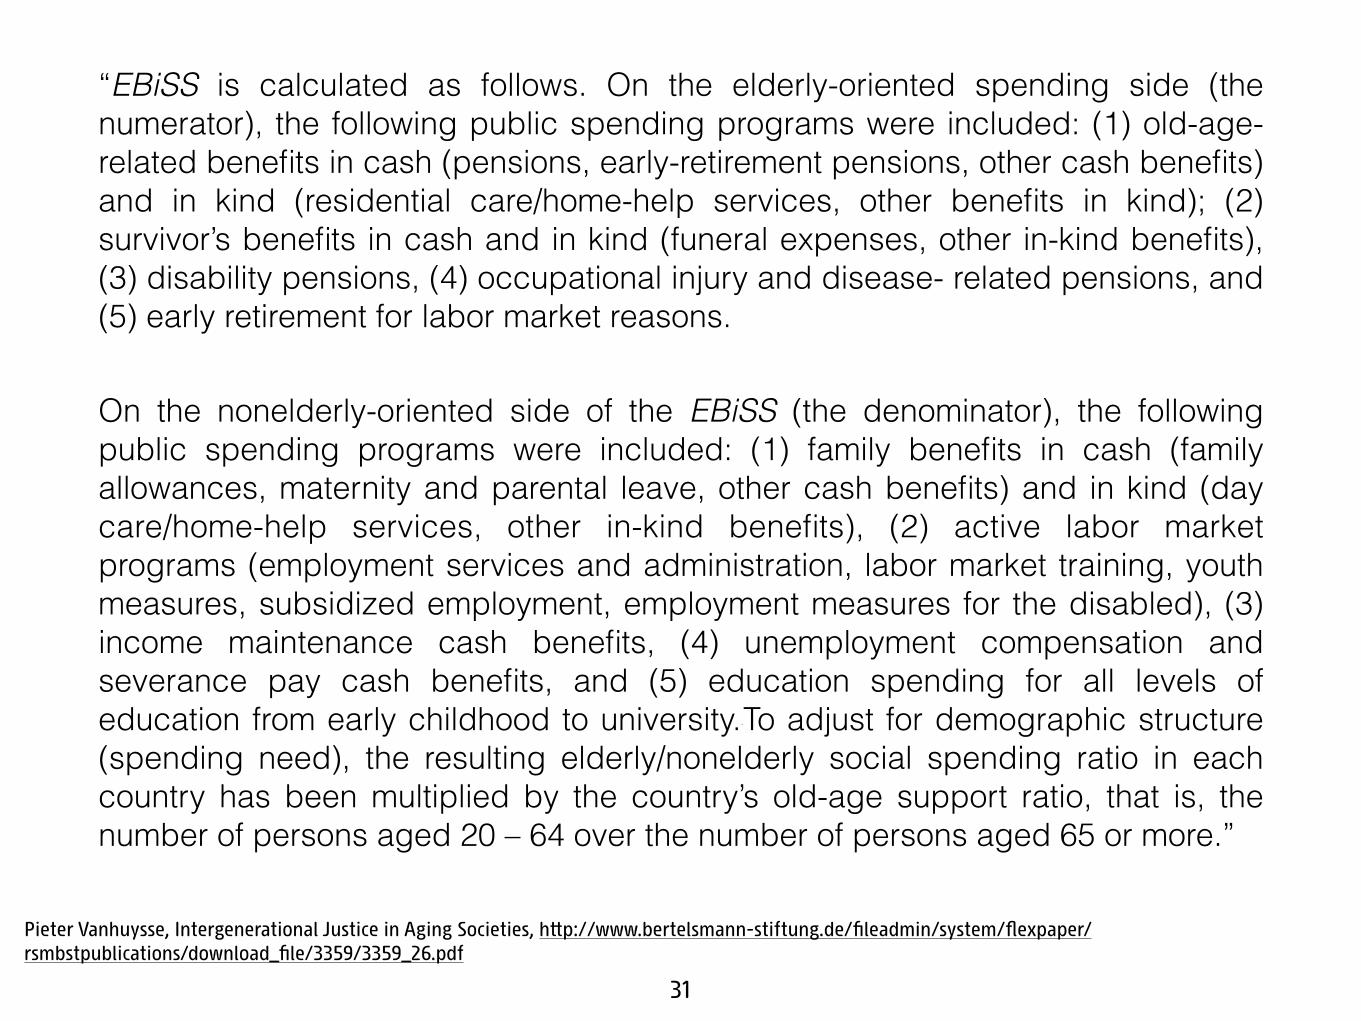
“EBiSS is calculated as follows. On the elderly-oriented spending side (the numerator), the following public spending programs were included: (1) old-age-related benefits in cash (pensions, early-retirement pensions, other cash benefits) and in kind (residential care/home-help services, other benefits in kind); (2) survivor’s benefits in cash and in kind (funeral expenses, other in-kind benefits), (3) disability pensions, (4) occupational injury and disease- related pensions, and (5) early retirement for labor market reasons.
On the nonelderly-oriented side of the EBiSS (the denominator), the following public spending programs were included: (1) family benefits in cash (family allowances, maternity and parental leave, other cash benefits) and in kind (day care/home-help services, other in-kind benefits), (2) active labor market programs (employment services and administration, labor market training, youth measures, subsidized employment, employment measures for the disabled), (3) income maintenance cash benefits, (4) unemployment compensation and severance pay cash benefits, and (5) education spending for all levels of education from early childhood to university.29 To adjust for demographic structure (spending need), the resulting elderly/nonelderly social spending ratio in each country has been multiplied by the country’s old-age support ratio, that is, the number of persons aged 20 – 64 over the number of persons aged 65 or more.”
Pieter Vanhuysse, Intergenerational Justice in Aging Societies, http://www.bertelsmann-stiftung.de/fileadmin/system/flexpaper/rsmbstpublications/download_file/3359/3359_26.pdf