Embed Size (px)
Citation preview

MERGERS & ACQUISITIONS REVIEWREUTERS / Brendan McDermid
MERGERS & ACQUISITIONS REVIEWFINANCIAL ADVISORS
Full Year 2014
Any New Zealand Involvement Announced (AD39)
Any New Zealand Involvement Completed (AF46)
Japan M&A
Americas Deals Intelligence
M&A Financial Advisory ReviewFull Year 2014 | Mergers & Acquisitions | Financial Advisors
1
Japan Deals Intelligence
Any European Involvement Announced (AD21) 17
17
18
18
Global M&A
Global Deals Intelligence
Scorecard: Worldwide Announced M&A
Scorecard: Worldwide Completed M&A
Top Fifteen Worldwide Announced Deals
Any German Involvement Announced (AD35)
Americas M&A Any Spanish Involvement Completed (AF41)
Any UK Involvement Announced (AD32)
Any UK Involvement Completed (AF39)
Any European Involvement Completed (AF3) 10
12
12
Any French Involvement Announced (AD33)
Worldwide Completed (AF1)
Top Ten Japanese Involvement Announced Deals
19
Any French Involvement Completed (AF40)
Any Japanese Involvement Completed (AF23)
19
Any Spanish Involvement Announced (AD34)3
3
6
6
11
12
11
Worldwide Announced (AD1)
20
10
18
Any Japanese Involvement Announced (AD19)
2
2
Table of Contents
1
20
2
11
Fairness Opinion Rankings
Worldwide Announced Fairness Opinion
11
Any Americas Involvement Announced (AD49) 7
US Target Completed (AF2)
6
US Target Announced (AD2) 7
Any Americas Involvement Completed (AF55)
13
12
Any Italian Involvement Announced (AD36)
Any Nordic Involvement Announced (AD37)
Any Italian Involvement Completed (AF43)
20
20
Top Ten US Announced Deals20
15
Mergers & Acquisitions Criteria Summary
Any EMEA Involvement Announced (AD47)
European Deals Intelligence
Any Benelux Involvement Announced (AD40)
8
8
7
Any German Involvement Completed (AF42)
16
Any Canadian Involvement Completed (AF49)
Any Australian Involvement Completed (AF31)
10
9
Any Canadian Involvement Announced (AD42)
16
Any Asia (ex-Japan) Involvement Completed (AF32)
Any EMEA Involvement Completed (AF53)
Any Benelux Involvement Completed (AF47)
10
Any US Involvement Completed (AF48)
Top Ten Any Asia (ex-Japan) Involvement Announced Deals 15
7
8
9EMEA M&A
Any US Involvement Announced (AD41)
Any Japanese Announced Fairness Opinion13
Asia Pacific (ex-Japan) M&A
Asia Pacific (ex-Japan) Deals Intelligence
20
21
21
22
21
20
13
13
Regional Contacts
Criteria Summary
Any EMEA Announced Fairness Opinion
14
Any Asia Pacific Announced Fairness Opinion
8
16
16Any Australian Involvement Announced (AD24)
9
Top Ten European Involvement Announced Deals
Thomson Reuters Soultions for the Deal the Deal Making Community
Any Asia (ex-Japan) Involvement Announced (AD25)
20
15
Worldwide Announced Fairness Opinion
Any Americas Announced Fairness Opinion
Any USAnnounced Fairness Opinion
14
Any Nordic Involvement Completed (AF44)
https://www.thomsonone.com
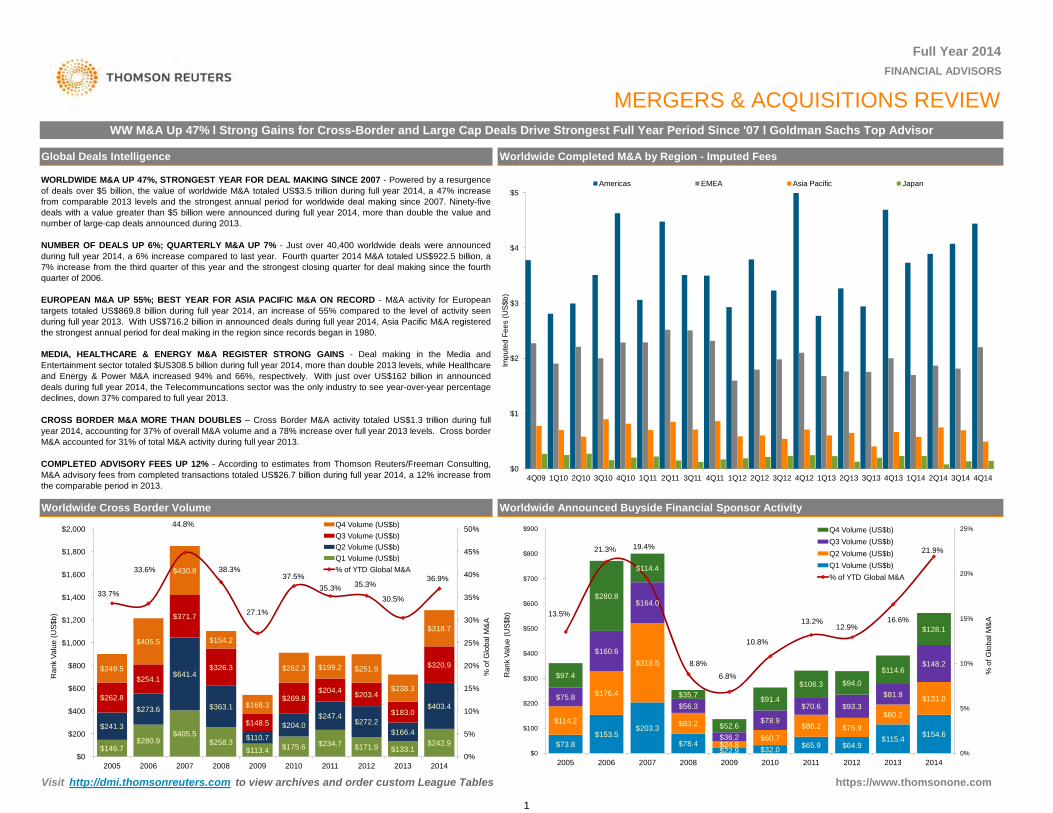
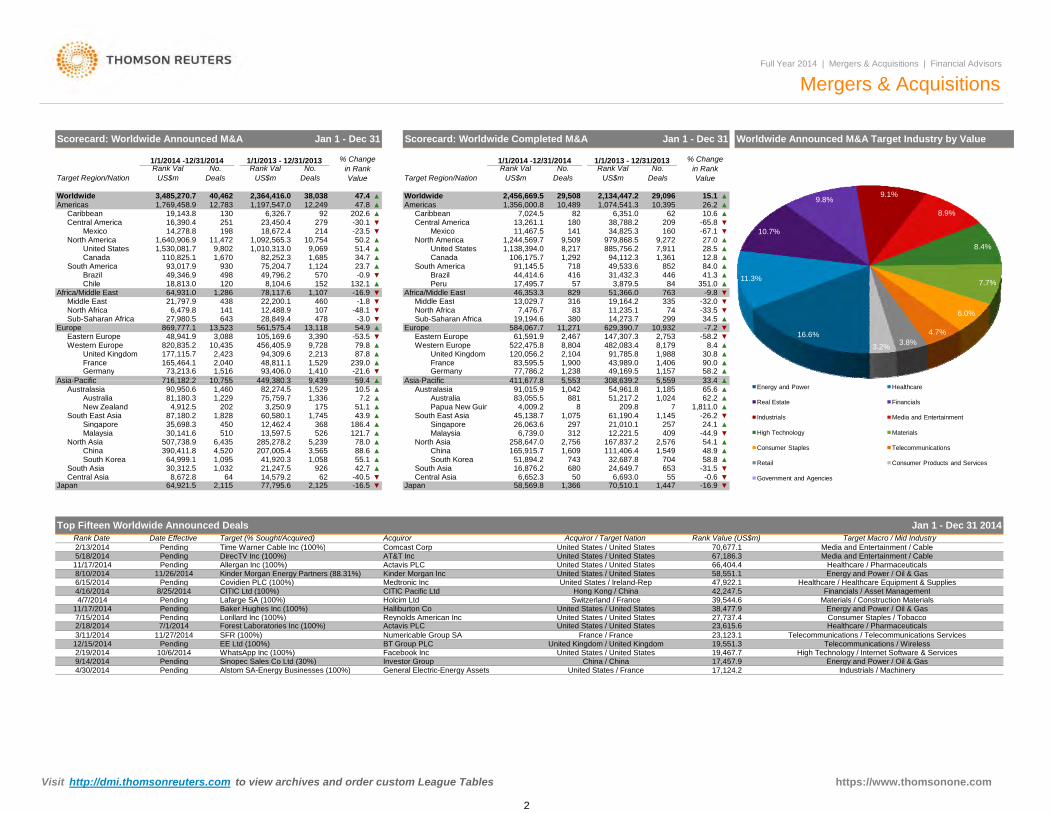
WORLDWIDE M&A UP 47%, STRONGEST YEAR FOR DEAL MAKING SINCE 2007 - Powered by a resurgenceof deals over $5 billion, the value of worldwide M&A totaled US$3.5 trillion during full year 2014, a 47% increasefrom comparable 2013 levels and the strongest annual period for worldwide deal making since 2007. Ninety-fivedeals with a value greater than $5 billion were announced during full year 2014, more than double the value andnumber of large-cap deals announced during 2013.
NUMBER OF DEALS UP 6%; QUARTERLY M&A UP 7% - Just over 40,400 worldwide deals were announcedduring full year 2014, a 6% increase compared to last year. Fourth quarter 2014 M&A totaled US$922.5 billion, a7% increase from the third quarter of this year and the strongest closing quarter for deal making since the fourthquarter of 2006.
EUROPEAN M&A UP 55%; BEST YEAR FOR ASIA PACIFIC M&A ON RECORD - M&A activity for Europeantargets totaled US$869.8 billion during full year 2014, an increase of 55% compared to the level of activity seenduring full year 2013. With US$716.2 billion in announced deals during full year 2014, Asia Pacific M&A registeredthe strongest annual period for deal making in the region since records began in 1980.
MEDIA, HEALTHCARE & ENERGY M&A REGISTER STRONG GAINS - Deal making in the Media andEntertainment sector totaled $US308.5 billion during full year 2014, more than double 2013 levels, while Healthcareand Energy & Power M&A increased 94% and 66%, respectively. With just over US$162 billion in announced
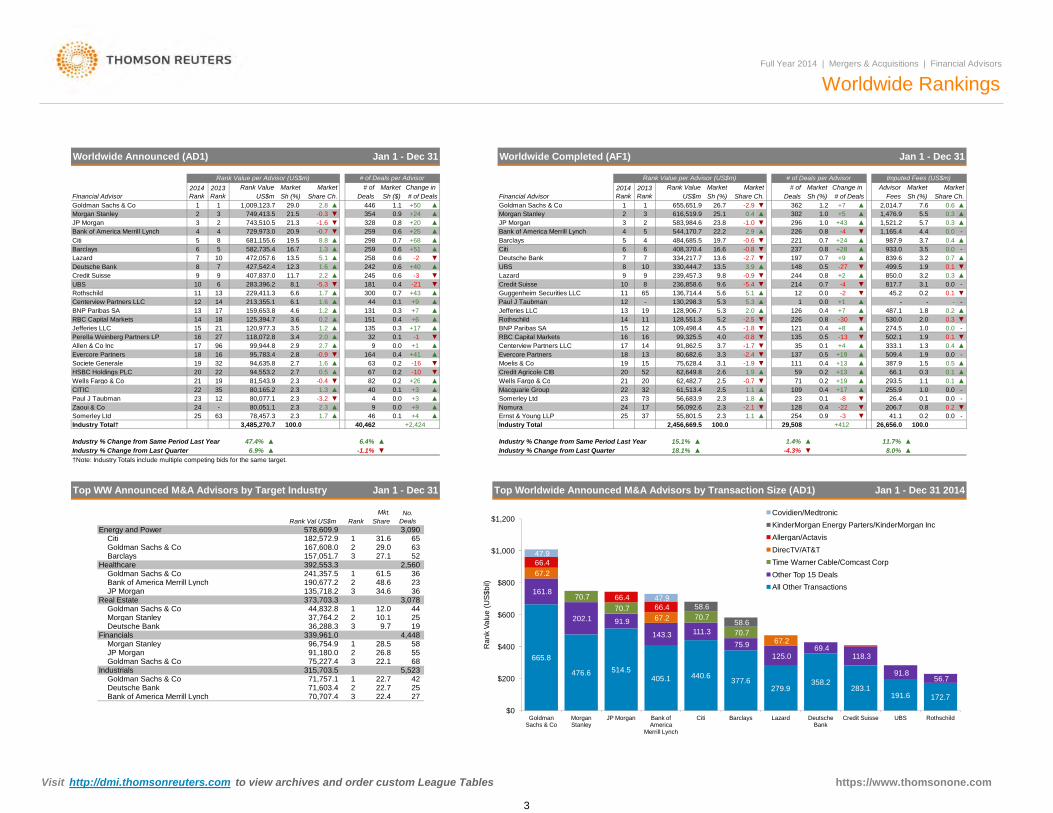
WW M&A Up 47% l Strong Gains for Cross-Border and Large Cap Deals Drive Strongest Full Year Period Since '07 l Goldman Sachs Top Advisor
Global Deals Intelligence Worldwide Completed M&A by Region - Imputed Fees
Full Year 2014 FINANCIAL ADVISORS
MERGERS & ACQUISITIONS REVIEW
$2
$3
$4
$5
Impu
ted
Fees
(US
$b)
Americas EMEA Asia Pacific Japan
gy , p y jdeals during full year 2014, the Telecommuncations sector was the only industry to see year-over-year percentagedeclines, down 37% compared to full year 2013.
CROSS BORDER M&A MORE THAN DOUBLES – Cross Border M&A activity totaled US$1.3 trillion during fullyear 2014, accounting for 37% of overall M&A volume and a 78% increase over full year 2013 levels. Cross borderM&A accounted for 31% of total M&A activity during full year 2013.
COMPLETED ADVISORY FEES UP 12% - According to estimates from Thomson Reuters/Freeman Consulting,M&A advisory fees from completed transactions totaled US$26.7 billion during full year 2014, a 12% increase fromthe comparable period in 2013.
Worldwide Cross Border Volume Worldwide Announced Buyside Financial Sponsor Activity
$73.8$153.5
$203.3
$78.4$22.9 $32.0 $65.9 $64.9
$115.4 $154.6
$114.2
$176.4
$318.5
$83.2
$24.8$60.7
$88.2 $76.9
$80.2
$131.0$75.8
$160.6
$164.0
$56.3
$36.2
$78.9
$70.6 $93.3$81.9
$148.2$97.4
$280.8
$114.4
$35.7
$52.6
$91.4
$106.3 $94.0
$114.6
$128.1
13.5%
21.3% 19.4%
8.8%
6.8%
10.8%
13.2%12.9%
16.6%
21.9%
0%
5%
10%
15%
20%
25%
$0
$100
$200
$300
$400
$500
$600
$700
$800
$900
2005 2006 2007 2008 2009 2010 2011 2012 2013 2014
% o
f Glo
bal M
&A
Ran
k Va
lue
(US
$b)
Q4 Volume (US$b)Q3 Volume (US$b)Q2 Volume (US$b)Q1 Volume (US$b)% of YTD Global M&A
$0
$1
4Q09 1Q10 2Q10 3Q10 4Q10 1Q11 2Q11 3Q11 4Q11 1Q12 2Q12 3Q12 4Q12 1Q13 2Q13 3Q13 4Q13 1Q14 2Q14 3Q14 4Q14
$146.7$280.9
$405.5$258.3
$113.4 $175.6 $234.7 $171.9 $133.1$242.9
$241.3
$273.6
$641.4
$363.1
$110.7$204.0
$247.4$272.2
$166.4
$403.4$262.8
$254.1
$371.7
$326.3
$148.5
$269.8$204.4 $203.4
$183.0
$320.9$249.5
$405.5
$430.8
$154.2
$168.3
$262.3 $199.2 $251.9
$238.3
$318.7
33.7%
33.6%
44.8%
38.3%
27.1%
37.5%35.3% 35.3%
30.5%
36.9%
0%
5%
10%
15%
20%
25%
30%
35%
40%
45%
50%
$0
$200
$400
$600
$800
$1,000
$1,200
$1,400
$1,600
$1,800
$2,000
% o
f Glo
bal M
&A
Ran
k Va
lue
(US
$b)
Q4 Volume (US$b)Q3 Volume (US$b)Q2 Volume (US$b)Q1 Volume (US$b)% of YTD Global M&A
https://www.thomsonone.com Visit http://dmi.thomsonreuters.com to view archives and order custom League Tables
2005 2006 2007 2008 2009 2010 2011 2012 2013 20142005 2006 2007 2008 2009 2010 2011 2012 2013 2014
1
Western Europe
Jan 1 - Dec 31 Scorecard: Worldwide Completed M&A Jan 1 - Dec 31
Full Year 2014 | Mergers & Acquisitions | Financial Advisors
Mergers & Acquisitions
1,670
1/1/2014 -12/31/2014
716 182 2
1,092,565.3
49,796.2
Worldwide12,783
No. Deals
1/1/2014 -12/31/2014 1/1/2013 - 12/31/2013
21416,390.4
18,672.4198279
2,423
Target Region/Nation
Mexico
456,405.9177,115.7
120
21,797.9
8,104.6
1,010,313.0
75,204.7
1,769,458.9
23,450.4
1,197,547.0
Rank Val US$m
82,252.3United States
No. Deals
Rank Val US$m
2,134,447.2
Caribbean
14,278.8
Brazil
110,825.1
Worldwide 40,4623,485,270.7
1,5162,040
Germany
North America
820,835.2
France
Chile 18,813.0
Asia Pacific
United Kingdom
Middle East
27,980.5Sub-Saharan Africa
165,464.1
North Africa
Canada
Western Europe48,941.9
869,777.1
64,931.0
49,346.9
Americas19,143.8
10 755
251
11,472
Central America
South America
1,530,081.7
930498
130
1,640,906.9
93,017.9
9,802
-21.6449 380 3 9 439
93,406.059 4
78,117.6438
Europe
141
Africa/Middle East
12,488.9643
1,286
561,575.4
Middle East
54.913,523478
22,200.16,479.8
28,849.4
1,410
Eastern Europe
1,529
13,118
94,309.648,811.1
73,213.6
9,72810,435105,169.63,088
-3.0Europe
▲
▲
460
79.8
-48.1
3,390
107
2,213
▼239.0
▼
▲United Kingdom87.8
▼-53.5
77,786.283,595.5France▲
522,475.8
▲Germany 1,238
Eastern Europe
120,056.21,900
Asia Pacific 411 677 8
2,467482,083.4 8,179
5 559
2,104
33 4
147,307.310,932
43,989.049,169.5
5 553
▼-58.2
▲
8,804
629,390.7
58.2
11,271▼
▲
74299
91,785.8
2,753
34.5
308 639 2
829
584,067.7 -7.261,591.9
57
11,235.1
51,366.0
83
763
7,476.719,164.2
▼Sub-Saharan AfricaNorth Africa
-32.0
380 14,273.7
335▼ 316
▲
19,194.6
13,029.71,107
Peru-16.9 ▼ 46,353.3
-1.8Africa/Middle East
1,685
17,495.7570
34.7 Canada 106,175.7▲91,145.5
Brazil 44,414.6
▲
152
10,7549,069
▲-0.9
132.1▼
▲
1,124 23.7
29,09629,508
Caribbean202.6
▲
51.4
47.847.4
1,074,541.3 26.2
-65.820962
15.110,395
6,326.7
2,364,416.0
Rank Val US$m
9212,24938,038
No. Deals
821,356,000.8▲
180Central America▼
10,489▲
Americas
38,788.26,351.0
-23.5 Mexico1,244,569.7
16050.2 9,509
▼9,272
2,456,669.5
Rank Val US$m
% Change in Rank Value
South America
8,217
718
-30.1141
Target Region/Nation
North America
84
94,112.3
No. Deals
13,261.17,024.5
11,467.5 34,825.3
1,138,394.0
416
1,292United States 885,756.2
3,879.5
▲7,911
▲
-33.5▼▼▲
▲▼
31,432.385249,533.6
41.3
-9.8351.0
446 ▲
-67.127.0
12.8
10.6
84.0
▼
28.51,361
1/1/2013 - 12/31/2013
979,868.5 ▲▲
▲▲
% Change in Rank Value
▼▲
Worldwide Announced M&A Target Industry by ValueScorecard: Worldwide Announced M&A
1,988
1,157
▲
▲1,406
▲90.030.8
8.416.6%
11.3%
10.7%
9.8%9.1%
8.9%
8.4%
7.7%
6.0%
4.7%3.8%3.2%
South East Asia
11/27/2014
United States / United States 19,467.7
716,182.2
7/1/2014
14,579.2
Actavis PLC
Rank Date Date Effective
Singapore
1,460
Pending
Australia
South Korea
2,115
81,180.3
87,180.2
2/13/2014
Asia-Pacific90,950.6
35,698.3
10,755
Pending
42.7926
Target (% Sought/Acquired)
55.1
Malaysia
4/7/2014Pending
Pending
11/17/2014
11/26/2014
5/18/2014
8/10/2014Pending
11/17/2014
12/15/2014
27,737.4
EE Ltd (100%)23,123.13/11/2014
United States / United StatesActavis PLC2/18/2014Pending United States / United States
10/6/2014
Numericable Group SA
WhatsApp Inc (100%)Pending 19,551.3
General Electric-Energy Assets
Facebook Inc
CITIC Pacific Ltd
Reynolds American Inc
BT Group PLC
39,544.6Switzerland / France
Allergan Inc (100%)
38,477.9
42,247.5
France / France
Halliburton Co
United States / United StatesTime Warner Cable Inc (100%)
United States / United StatesLorillard Inc (100%)
SFR (100%)
Kinder Morgan Energy Partners (88.31%)
23,615.6
Holcim Ltd
▼680
Forest Laboratories Inc (100%)
77,795.6
7/15/2014
DirecTV Inc (100%)66,404.458,551.1
United States / United States
Kinder Morgan Inc
▼
Baker Hughes Inc (100%)
Investor Group
70,677.1AT&T Inc
1,447
United States / United States
Lafarge SA (100%)
United States / United States
Hong Kong / China
4,520
1,229
1,095
▼
Covidien PLC (100%)8/25/2014
30,312.5South AsiaCentral Asia -40.5
1,828450
45,138.7
▼
Australasia
3,5651,058
207,005.4
1,032
3,250.9 Papua New Guin▲▲
South Asia 16,876.2
186.4
▲
202
24,649.7
▲
32,687.81,609
312
175
526 Malaysia
▲75,759.7
60,580.1
7.2
3681,745
12,462.4
51.1
30,141.6
2,125
21,247.5
285,278.2
8,672.8
5,239
41,920.3
5106,435
64
North AsiaChina 390,411.8
507,738.9
64,999.1
Top Fifteen Worldwide Announced Deals
47,922.1
6,693.0
4/16/2014
165,915.7
6,652.364,921.5Japan
62
▲
13,597.5
449,380.3 9,439
1,336
121.7
43.9
1,52959.4
South East Asia
10.583,055.5
▲Australasia
▲91,015.9
1,07584,009.2
881
Asia-Pacific 411,677.81,042▲82,274.5
67,186.3
Central Asia58,569.8
50
Rank Value (US$m)
Japan
Acquiror
Australia
653
▲
-16.5
▲88.678.0 ▲
-16.9
743
-0.6
North Asia
70,510.155
167,837.2
58.8-31.5
1,366
297
51,894.2ChinaSouth Korea
2,576
26,063.6
258,647.0 2,756
Singapore6,739.0
▲48.9111,406.4
21,010.1
704
40912,221.5
1,549
-44.954.1
-26.2
5,559 33.4
51,217.2
24.1
761,190.4 1,145
209.8
257
65.65,553 ▲
62.21,0241,185
308,639.254,961.8
▲
▼
Jan 1 - Dec 31 2014
Medtronic Inc
Pending
6/15/2014
2/19/2014United Kingdom / United Kingdom
Comcast CorpAcquiror / Target Nation
CITIC Ltd (100%)United States / Ireland-Rep
Consumer Staples / TobaccoHealthcare / Pharmaceuticals
United States / France
Energy and Power / Oil & Gas
Materials / Construction Materials
1,811.0
▲
▼▲▲
▲▼
Target Macro / Mid Industry
4,912.5New Zealand
Alstom SA-Energy Businesses (100%)17,457.917,124.2
9/14/20144/30/2014
PendingPending
Sinopec Sales Co Ltd (30%) China / China
Media and Entertainment / CableMedia and Entertainment / Cable
Healthcare / Pharmaceuticals
Healthcare / Healthcare Equipment & SuppliesFinancials / Asset Management
Energy and Power / Oil & Gas
Energy and Power / Oil & GasIndustrials / Machinery
Telecommunications / Telecommunications ServicesTelecommunications / Wireless
High Technology / Internet Software & Services
Energy and Power Healthcare
Real Estate Financials
Industrials Media and Entertainment
High Technology Materials
Consumer Staples Telecommunications
Retail Consumer Products and Services
Government and Agencies
Visit http://dmi.thomsonreuters.com to view archives and order custom League Tables https://www.thomsonone.com
2
UBS
95,783.432Societe Generale
HSBC Holdings PLC 20Wells Fargo & Co
▲120,977.3
2 381 543 9
2.93.4
2.7
RBC Capital Markets
Centerview Partners LLC
▲
1621
▲
2
Credit Suisse7
1411
19
17
Jefferies LLC
Rothschild
BNP Paribas SA 13213,355.1
Deutsche Bank 8
19
12
15
4.60.2
1714 18 125,394.7
Worldwide Announced (AD1)
▲1.2
▼
1.611.7
159,653.8
427,542.4
▲1.6
▲▲
9
13
582,735.4 16.7472,057.6
5
Morgan StanleyGoldman Sachs & Co
31,009,123.7
2013 Rank
Morgan Stanley12
16
Bank of America Merrill LynchJP Morgan+20
▲743,510.5
Market
+24
2.0
2.894,635.8
0.52.794,553.21.6
0 4
▲
▼▲
9+41
2.7164
63▼▲
-0.90.0
0.5+130.259 0.1
387.9
71▼0 7 ▲293 5 1 1 0 1▲8220
0 2-1067 0.2 ▲
0 2▲0.3
2066.162,649.8
62 482 72.62 5
509.4+19▲ 13Moelis & Co
21Credit Agricole CIB
▲0.2 ▼▼
-16 75,628.4▲1.9
Evercore Partners0.4
+19
+130.5
▲ Wells Fargo & Co
▼-1.952
193.380,682.618
111
14 91,862.5
3.11.9 -
0.4
+26
▲1.5
333.1 ▲0.1-13
▲▼ 1.9502.1
+4135
▼ 35137
▼0.11.3
0.5
0.0▼
-1 ▼-1.717
99,325.5-1.8
Centerview Partners LLC+1 ▲ 3.716RBC Capital Markets
▼
19128,551.3 -2.514
13
▼BNP Paribas SA▲ 15
4.0
Rothschild 5.2109,498.4 4.5
115.3128,906.7
530.0487.10.4 ▲
1.0 -226▼
2.0
12▼
0.00.3
1212.0
+7-30 ▼
0.2 ▲
0.4 ▲
0.1-
+80.8
▼
274.5
45.2Paul J Taubman 5.3
▲
0.01
▲▲
126Jefferies LLC
8
0.0130,298.365 5.6
1.8▲
0.2-5.3
9.65.1
-5.4▼
0.712
▼ -
--+1-2
0.0-0.9
▼+2 3.2
817.7214 -4
▼839.6499.5 0.1850.0
▲-2.713.5
▼
▼3.9
+9
▲▲ 0.39.8 244▲ UBS ▼▲ 148
239,457.3▼ 0.8
0.0408,370.43.7▼ +24484,685.5 221
▲0.4▲
3.20.5 -27
▲-
1.9
+28 933.00.80.7
▼197237
0.7-0.8
13.6Citi 16.666
7
▲ 3
334,217.7▼▲
7Deutsche Bank
544,170.7▲0.7
2 583,984.6 ▼
-0.6▲
23.80.81.0
+5
987.9
2014 Rank
Rank Value per Advisor (US$m)
1,165.41,521.2
226 -4
▲
▼
▲
0.0 -2.9
5.5 ▲
Sh (%)
# of Deals per Advisor
Full Year 2014 | Mergers & Acquisitions | Financial Advisors
+70.4616,519.9
▲ ▲
-2.925.1
Fees362
Rank Value MarketShare Ch.
2 326.7 ▼655,651.9
Sh (%)▲
MarketMarketUS$m DealsShare Ch.Sh (%)
# of Deals per Advisor
19.745
▲▲ Barclays 4
5
21.5-1.6
13.5
20.9
2.8
298
446
-0.7
29.0 1US$m
2.2
+25328
181
8.8
0.8
0.70.6
118,072.8
22
Perella Weinberg Partners LP
Evercore Partners
21
18
259
-5.3
▲
3.5
▲
3.6
▲
2796Allen & Co Inc 99,944.8
1.2
283,396.2
19.5681,155.6
LazardBarclays
Bank of America Merrill Lynch
6
3
Citi45
▼259
# of
22.2
354▼
▲
▼
10
12.3
21.3
7 10
8
5.1
4 729,973.0
Rank ValueFinancial Advisor
296-1.0
1Goldman Sachs & Co# of Deals+50
Jan 1 - Dec 31
749,413.5 -0.3 0.9
2014 Rank
Rank Value per Advisor (US$m)
1.11 ▲Sh ($)
Change in Market
Jan 1 - Dec 31
Worldwide Rankings
2013 RankFinancial Advisor
JP Morgan
15
-0.8
-2.4
407,837.09
229,411.3 1.76
0.4
151
9
135 0.3
236,858.6
12136,714.4
10
▲0.1 -
0.6
131
0.6
0.40.6
330,444.7109-3 Lazard
▲▲0.4
+9+70.3
+68
8.1
6.1300
44
16
1.3
▼
32 0.1
+51
0.7
245
0.6
-21
+17+6
▲
-2
Guggenheim Securities LLC
8+40
11+43Credit Suisse
+431.0302 1,476.9
Change in
1.2# of Deals
Market Advisor
▲ 2,014.7 ▲Share Ch.Sh (%)
7.6Deals
# of
Worldwide Completed (AF1)
MarketImputed Fees (US$m)
0.6
Market
3.1
3.5
4.4
0.35.7 0.3
▲
242258
6.6
†Note: Industry Totals include multiple competing bids for the same target.
* tie
Goldman Sachs & Co
Jan 1 - Dec 31 2014
44
Goldman Sachs & Co
Goldman Sachs & Co2
23
373,703.31
190,677.2JP Morgan
10.1Morgan Stanley12.0
Barclays
Somerley Ltd
241,357.5
37,764.2
Bank of America Merrill Lynch
Industry Total†
Wells Fargo & Co
25Zaoui & Co
2.3
80,077.1
2.381,543.93522CITIC19
▲+3
1.32.3 -3.2
80,165.2-0.4
2.3
80,051.1▲▲
78,457.32.32.3
▼+3
440
▼0.1
63
3,090
9
Top WW Announced M&A Advisors by Target Industry
47.4%
463,485,270.7
1.7
Rank
▲
0.0
No. Deals
▲▼18.1%
15.1%
100.0
578,609.9
167,608.0
▲
40,462
ShareMkt.
▲
Jan 1 - Dec 31
Energy and Power
22Macquarie Group
▲▲
Industry % Change from Same Period Last Year
Somerley Ltd 2324
▲
25Industry Total+2,424
▼
Top Worldwide Announced M&A Advisors by Transaction Size (AD1)
-4.3%▲
2540.0 +9 Nomura0.1 +4
▲
Ernst & Young LLP2,456,669.5
327317
55,801.537
61,513.4
56,092.656,683.9
2.5
2.3 1.1 ▲-2.1
0.9
▲2.3 ▼
+412
▲▲1.4%
29,508
11.7%
26,656.00.0
-
-3 0.2-22
41.1▼100.0
▼-
0.20.10.80.4 ▼ 206.7
26.4230.4109 255.9
-8 ▼
71
0.1+17
0.01.8▲ ▲▼-0.7
-▲293.5 1.1
1.00.1▲0.0
82 0.21.1
0.220 62,482.7 2.521 +19▲ Wells Fargo & Co+26
Citi
21
24
6.9%
Paul J Taubman
28.5
315,703.5
1Morgan StanleyJP Morgan
375,227.45,523
22.722.72
68
25 42 71,757.1
Rank Val US$m
2
Industrials
71,603.4
61.5
1
339,961.036,288.3
96,754.9
392,553.3Healthcare
FinancialsDeutsche Bank
182,572.9
44,832.8
135,718.2
Industry % Change from Same Period Last Year
157,051.7
Real Estate
Goldman Sachs & Co
Industry % Change from Last Quarter
63100.0
23 12-
1
91,180.0
Bank of America Merrill Lynch 70,707.4 3
19 9.73
52
3,078
32,560
36 34.6
58
25
22.4
4,448
55 26.822.1
36
27
Industry % Change from Last Quarter 8.0%
Goldman Sachs & CoDeutsche Bank
48.6
21
27.1
-1.1%6.4%
65 31.629.0
2.3128
▲
23
665.8
476.6 514.5405.1 440.6 377.6
279.9358.2
283.1191.6 172.7
161.8
202.1 91.9
143.3 111.3
75.9 125.0
69.4 118.3
91.8 56.7
70.7 70.7
70.7
70.7
67.2
67.2
67.2
66.4
66.4 66.4 58.6
58.6
47.9
47.9
$0
$200
$400
$600
$800
$1,000
$1,200
Goldman Sachs & Co
Morgan Stanley
JP Morgan Bank of America
Merrill Lynch
Citi Barclays Lazard Deutsche Bank
Credit Suisse UBS Rothschild
Ran
k Va
lue
(US
$bil)
Covidien/MedtronicKinderMorgan Energy Parters/KinderMorgan IncAllergan/ActavisDirecTV/AT&TTime Warner Cable/Comcast Corp Other Top 15 DealsAll Other Transactions
https://www.thomsonone.com Visit http://dmi.thomsonreuters.com to view archives and order custom League Tables
3
Jan 1 - Dec 312014 UP
2014 DOWN 2013
Full Year 2014 | Mergers & Acquisitions | Financial Advisors
EMEAAmericas
Worldwide M&A Matrix
Canada
11.2x
Exit Multiple Matrix - Average Rank Value / EBITDA
19.8x
Japan
13.0x
Asia ex. JapanEurope
12.1x
10.7x
9.7x
5.9x
9.8x11.9x
18.4x
14.2x
11.5x
USA
12.6x26.9x
15.5x14.6x
Telecommunications
Real Estate
Media and Entertainment
Retail
11.4x
12.2x
13.0x
6.3x
10.0x
12.7x
10.9x
14.6x
--
-
12.8x
Industrials
14.5x
World
16.6x
UK
15.5x
10.7x
10.0x23.1x
10.7x 11.1x15.3x
10.7x
6.4x
11.8x10.6x11.1x
24.0x
13.7x 12.2x10.6x12.2x
-
13.4x12.0x
25.2x 24.3x 13.0x16.1x 14.6x
19.3x
7.0x
19.3x
14.6x14.7x15.5x
10.8x12.4x8.6x
-
12.7x12.7x 9.5x
16.3x 12.4x
13.4x13.4x16.7x
11.4x9.6x11.4x
9.0x5.7x 5.7x
14.5x
10.1x
12.9x
9.1x
9.9x
11.9x10.7x
14.2x11.1x 11.9x
9.5x
12.0x
9.2x
15.5x 15.5x16.7x
12.5x
13.3x 11.7x
13.7x
8.1x
5.9x16.4x7.6x 9.8x7.6x25.7x
16.6x14.0x
12.2x13.8x 15.6x
6.5x 11.9x10.8x
11.1x17.1x
19.8x21.5x
10.3x11.8x
10.8x
13.7x
8.5x
10.6x
11.6x16.5x
10.6x 9.2x
15.0x
13.1x
6.0x 12.4x11.2x
11.3x14.5x16.6x
13.7x
14.4x 12.7x
9.0x18.2x 9.0x8.6x
14.0x
13.0x
13.3x 9.6x
8.1x9.3x
11.1x
Materials
12.0x
9.2x
11.4x
8.1x10.2x
16.6x11.0x
18.3x
11.2x
11.8x
16.4x
10.9x
13.7x
32.6x19.9x
10.3x 11.0x12.0x
11.7x 13.8x 12.6x 11.4x
9.6x
30.2x
10.8x 9.9x
11.9x 10.0x
25.7x
9.6x
20.6x 26.9x11.3x
11.5x
13.3x
18.9x
13.0x
12.9x
12.8x
18.5x
8.5x
14.7x
Energy and Power
14.6x
12.0x
Healthcare
13.7x
High Technology
12.7x
10.6x
13.1x
Consumer Staples
Consumer Products and Services
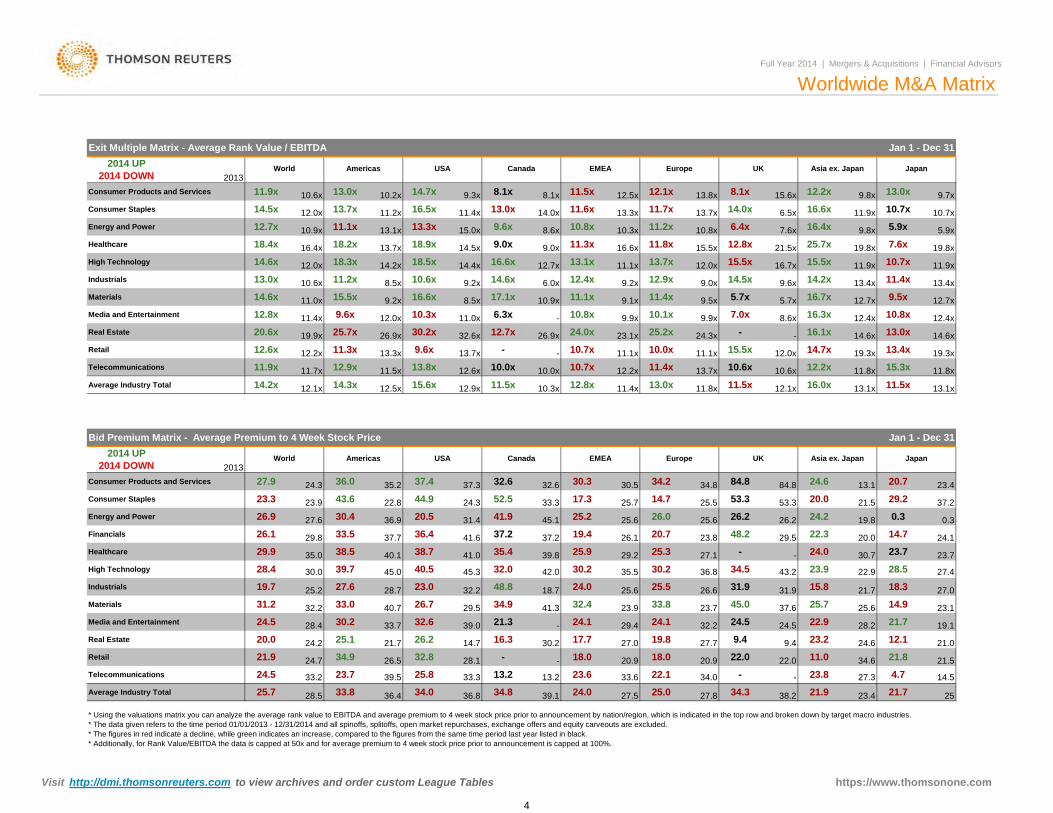
* Using the valuations matrix you can analyze the average rank value to EBITDA and average premium to 4 week stock price prior to announcement by nation/region, which is indicated in the top row and broken down by target macro industries. * The data given refers to the time period 01/01/2013 - 12/31/2014 and all spinoffs, splitoffs, open market repurchases, exchange offers and equity carveouts are excluded. * The figures in red indicate a decline, while green indicates an increase, compared to the figures from the same time period last year listed in black. * Additionally, for Rank Value/EBITDA the data is capped at 50x and for average premium to 4 week stock price prior to announcement is capped at 100%.
Bid Premium Matrix - Average Premium to 4 Week Stock Price Jan 1 - Dec 31
26.127.6
37.7
World
35.2Consumer Staples
30.229.2
35.5
36.4
26.2
30.3
Canada
14.5
23.438.2 21.7
29.5 45.0
20.9 18.0 22.0
24.5
25.034.0 23.8 27.3
12.124.6
27.8
25.7
26.5
26.1
25.6
32.425.6
39.0 24.5
27.0
22.9
33.6 22.1 - -
22.020.9
29.4
34.6
34.327.5 21.9
9.421.811.0
4.7
25
33.79.4
26.7
23.0
34.9
21.7
28.4
2014 UP 2014 DOWN
27.9
12.5x
Retail
31.2
39.7
21.740.7 23.9
30.2
28.7
45.0
23.2
21.5
14.7
32.6
25.219.730.0
23.7
20.0
24.7
25.1
27.6
33.8
Media and Entertainment
32.2
Telecommunications 24.5
Materials
24.5
34.9
25.7
33.0
Average Industry Total
29.9
24.2
High Technology
Industrials
33.2
21.9
35.0
28.5
28.4
23.3
Healthcare
Consumer Products and Services
40.1
24.3
22.826.9
Financials
Energy and Power
EMEA
38.5
30.4
36.0
38.7
33.5
43.6
41.6
24.3
32.637.4
29.8
14.3x
36.9
Americas
33.3
37.3
20.5
52.5
USA
23.9
Average Industry Total
41.0
19.445.131.4
35.437.2
41.9
12.8x14.2x 11.5x
20.7
21.5
24.0 23.7
19.8
23.7
14.7
0.3
30.7
24.120.022.326.2
37.2
84.8
0.3
29.2
34.2
11.4x
20.0
Asia ex. Japan
11.5x
24.2
34.8
13.0x
34.5
26.2
31.9
53.317.3
37.2
39.8
25.225.7
25.329.5
-
25.6
-27.1
48.223.825.9
32.219.8
24.0
27.7
25.5
24.123.7
36.8
26.6
20.7
23.9
37.6
26.025.5
Europe
11.8x
33.8
-
39.5
16.3
34.8
32.8
15.8
24.039.1
18.0
31.9
34.033.3
-
-
32.2
36.4
30.2
36.8
13.2 13.2
30.2
24.1
17.7
40.5
18.7
32.0
48.8
21.3
45.3 42.0
14.9 23.1
28.2
18.3
25.6
25.8 23.6
21.7
41.3
28.1
28.543.2
14.730.5 24.6
21.0
22.9
19.1
27.4
27.0
Japan
13.184.8 23.4
12.1x 13.1x16.0x 13.1x10.3x12.1x 12.9x 11.5x
2013
44.9 53.3
UK
32.6
Real Estate
15.6x
Visit http://dmi.thomsonreuters.com to view archives and order custom League Tables https://www.thomsonone.com
4
Full Year 2014 | Mergers & Acquisitions | Financial Advisors
Worldwide Announced Rankings* - A Decade in Review
1
2
3
4
1
2
3
4
Goldman Sachs & Co
Morgan Stanley
JP Morgan
Bank of America Merrill Lynch
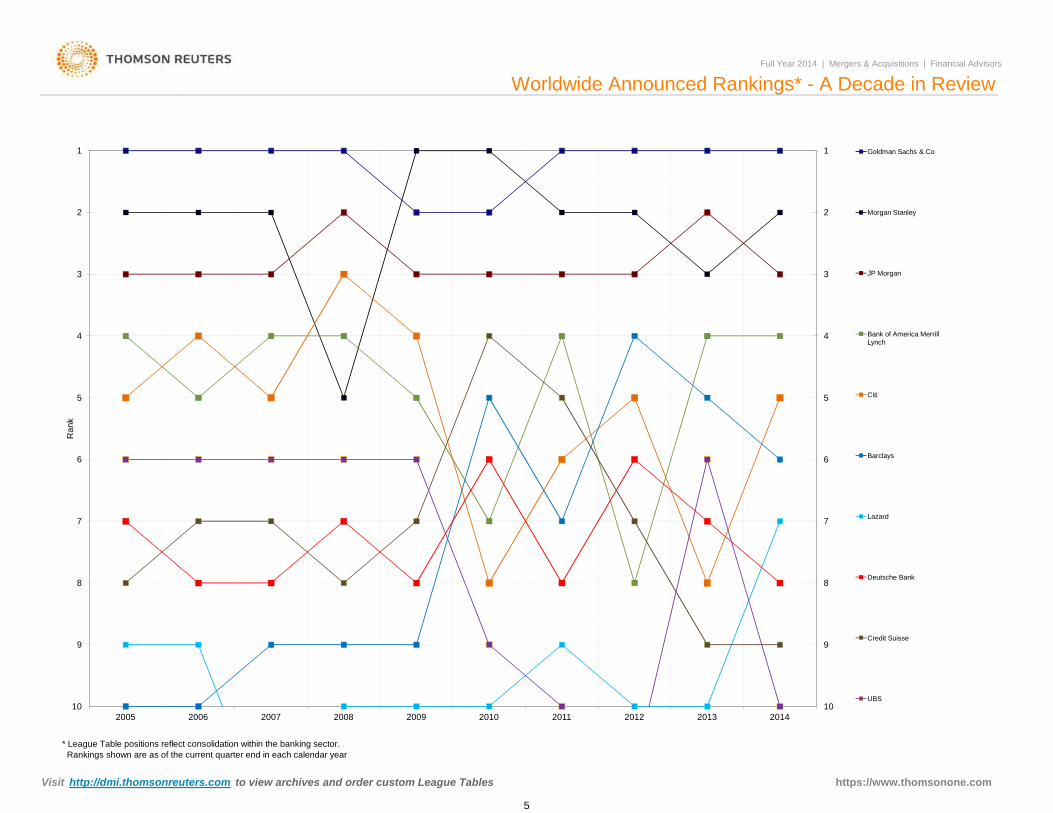
* League Table positions reflect consolidation within the banking sector. Rankings shown are as of the current quarter end in each calendar year
5
6
7
8
9
102005 2006 2007 2008 2009 2010 2011 2012 2013 2014
5
6
7
8
9
10
Ran
k
Citi
Barclays
Lazard
Deutsche Bank
Credit Suisse
UBS
Visit http://dmi.thomsonreuters.com to view archives and order custom League Tables https://www.thomsonone.com
5
Real EstateWells Fargo & Co 22,478.0 1
Citi 16,764.1 3
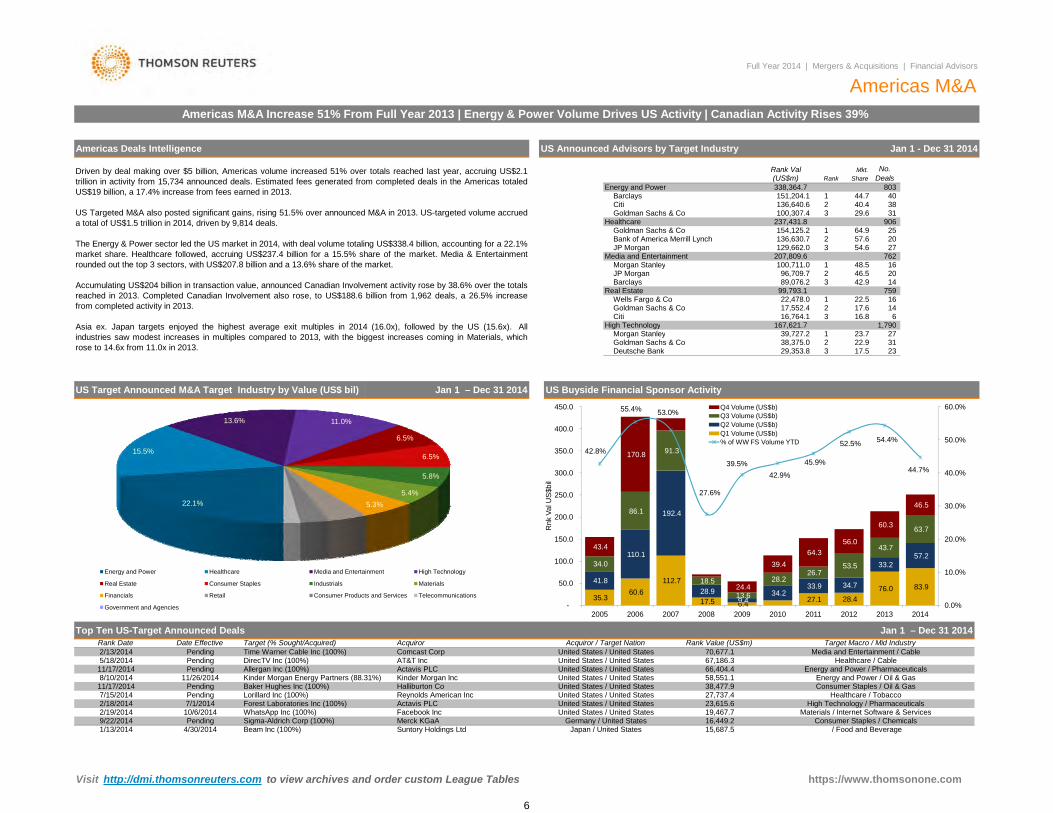
US Announced Advisors by Target Industry Jan 1 - Dec 31 2014Americas Deals Intelligence
Energy and Power
Healthcare
Media and Entertainment
High Technology
Barclays
Goldman Sachs & CoDeutsche Bank
Rank Val (US$m)338,364.7 151,204.1136,640.6Citi
Goldman Sachs & Co
JP MorganBarclays
Goldman Sachs & CoBank of America Merrill LynchJP Morgan
Morgan Stanley
100,307.4237,431.8 154,125.2136,630.7129,662.0
207,809.6 100,711.096,709.7
99,793.1 89,076.2
12
1
Rank
123
Mkt.
803
No. Deals
40.431 38
20
762 54.63
2
20
759
23.731
14
22.9
1,79027
Share
44.7
42.9346.5
29.6
167,621.7 39,727.238,375.029,353.8
23
1Morgan Stanley
40
906 64.9
27
16
Americas M&AFull Year 2014 | Mergers & Acquisitions | Financial Advisors
Americas M&A Increase 51% From Full Year 2013 | Energy & Power Volume Drives US Activity | Canadian Activity Rises 39%
25 57.6
Driven by deal making over $5 billion, Americas volume increased 51% over totals reached last year, accruing US$2.1trillion in activity from 15,734 announced deals. Estimated fees generated from completed deals in the Americas totaledUS$19 billion, a 17.4% increase from fees earned in 2013.
US Targeted M&A also posted significant gains, rising 51.5% over announced M&A in 2013. US-targeted volume accrueda total of US$1.5 trillion in 2014, driven by 9,814 deals.
The Energy & Power sector led the US market in 2014, with deal volume totaling US$338.4 billion, accounting for a 22.1%market share. Healthcare followed, accruing US$237.4 billion for a 15.5% share of the market. Media & Entertainmentrounded out the top 3 sectors, with US$207.8 billion and a 13.6% share of the market.
Accumulating US$204 billion in transaction value, announced Canadian Involvement activity rose by 38.6% over the totalsreached in 2013. Completed Canadian Involvement also rose, to US$188.6 billion from 1,962 deals, a 26.5% increasefrom completed activity in 2013.
Asia ex. Japan targets enjoyed the highest average exit multiples in 2014 (16.0x), followed by the US (15.6x). Allindustries saw modest increases in multiples compared to 2013, with the biggest increases coming in Materials, whichrose to 14.6x from 11.0x in 2013.
48.5
23 17.5
14 6 16.8
22.5 16 Goldman Sachs & Co 17,552.4 2 17.6
US Target Announced M&A Target Industry by Value (US$ bil) Jan 1 – Dec 31 2014
Acquiror / Target NationTop Ten US-Target Announced Deals
Target Macro / Mid IndustryJan 1 – Dec 31 2014
11/26/201466,404.4United States / United States
Target (% Sought/Acquired) Acquiror Rank Value (US$m)
Pending70,677.1
9/22/2014
PendingKinder Morgan Energy Partners (88.31%)
2/18/2014
Baker Hughes Inc (100%)
Facebook Inc
AT&T Inc
Date Effective
11/17/2014 Allergan Inc (100%)
Pending Time Warner Cable Inc (100%)2/13/2014Rank Date
5/18/2014 DirecTV Inc (100%)
11/17/2014
Forest Laboratories Inc (100%)
Pending Sigma-Aldrich Corp (100%)
8/10/2014Pending
7/1/2014
Halliburton Co
Actavis PLCUnited States / United States
United States / United StatesKinder Morgan IncUnited States / United States
27,737.438,477.9
Germany / United States
67,186.3
19,467.7United States / United States16,449.2
United States / United StatesActavis PLC 23,615.6
Merck KGaA
Pending
WhatsApp Inc (100%)
US Buyside Financial Sponsor Activity
Suntory Holdings Ltd
2/19/2014
15,687.5
10/6/2014
United States / United States
1/13/2014 4/30/2014 Beam Inc (100%) Japan / United States
7/15/2014
Comcast Corp
Reynolds American IncLorillard Inc (100%)
Media and Entertainment / CableHealthcare / Cable
Healthcare / TobaccoUnited States / United States
58,551.1Energy and Power / Pharmaceuticals
Energy and Power / Oil & GasConsumer Staples / Oil & Gas
/ Food and Beverage
High Technology / PharmaceuticalsMaterials / Internet Software & Services
Consumer Staples / Chemicals
22.1%
15.5%
13.6% 11.0%
6.5%
6.5%
5.8%
5.4%5.3%
Energy and Power Healthcare Media and Entertainment High Technology
Real Estate Consumer Staples Industrials Materials
Financials Retail Consumer Products and Services Telecommunications
Government and Agencies35.3
60.6 112.7
17.5 6.4 27.1 28.4 76.0 83.9
41.8
110.1
192.4
28.9 9.4
34.2 33.9 34.7
33.2 57.2
34.0
86.1
91.3
18.5
13.6
28.2 26.7
53.5
43.7
63.7
43.4
170.8
27.4
24.4
39.4 64.3
56.0
60.3
46.5
42.8%
55.4% 53.0%
27.6%
39.5%42.9%
45.9%
52.5% 54.4%
44.7%
0.0%
10.0%
20.0%
30.0%
40.0%
50.0%
60.0%
-
50.0
100.0
150.0
200.0
250.0
300.0
350.0
400.0
450.0
2005 2006 2007 2008 2009 2010 2011 2012 2013 2014
Rnk
Val
US$
bil
Q4 Volume (US$b)Q3 Volume (US$b)Q2 Volume (US$b)Q1 Volume (US$b)% of WW FS Volume YTD
https://www.thomsonone.com Visit http://dmi.thomsonreuters.com to view archives and order custom League Tables
6
Centerview Partners LLC Lazard
# of Deals per Advisor
Full Year 2014 | Mergers & Acquisitions | Financial Advisors
MarketMarket Change in Deals
Any Americas Involvement Completed (AF55)
Market# of Deals per Advisor Rank Value per Advisor (US$m)
MarketImputed Fees (US$m)
Americas Rankings
Rank Value per Advisor (US$m)2013 Rank
# ofShare Ch.
▲0.4Sh (%)
AdvisorRank ValueFinancial Advisor Sh (%) Share Ch. DealsUS$m
560,853.5 ▼34.6
Rank Value Market2014 Rank
Market
Jan 1 – Dec 31Any Americas Involvement Announced (AD49) Jan 1 – Dec 31
257
# ofFinancial Advisor
Market
+56Sh (%)Sh (%) # of Deals Fees
1,633.0 8.6Share Ch.
2.0# of Deals
2014 Rank
2013 Rank
Change in
2.1 ▲
MarketSh (%)US$m
+221 497,392.526.3 -3.0
Goldman Sachs & Co 1 738,300.5 0.32
1JP Morgan
▲1 ▼31.4Goldman Sachs & Co▲326 -2.1
3 3 546,338.621.4JP Morgan 2 +33 ▲
Morgan Stanley▲1,195.1 0.3▼ 199
1,147.56.3▲
410,920.3 25.9 1.5▲ 19327.4 -3.4433,560.0
34+3623.1
1.6 +43228+14 ▲
2185 1.2-3.4
1.2▼
Citi 4 7 493,272.6Bank of America Merrill Lynch
▲0.5+25
25.9 5.91.5 ▲▲ 6.0
▲5 4 484,430.5
0.5
22.7 -2.1
3Barclays 511.6
▲ Bank of America Merrill Lynch 5 ▲ 168
25.6
▼▲ 182 ▲ 4.41.3 +44 ▲ 826.3410,446.6 167
0.54 399,261.1 25.2 1.9 1.3 +3 ▲Barclays 6 5 457,544.1 21.4
232-0.2 ▼ 196
Morgan Stanley1.2
964.4 ▼1.5 +26 5.1+61 ▲ ▲2.8Citi 6 6 0.0▲ 754.2
12 213,087.6 ▼ 324.0▲298,860.2
7Lazard 7 11 299,249.4-153 1.2 +27 4.0
▲4.7 ▲14.0
18.9-7 ▼147 0.9 UBS ▲
Credit Suisse 8 8 274,815.8 12.9 2.8 0.1▼2.0 531.213.5 6.0 1.7 0.20.5 -2170
8 189,536.7 12.0 -1.5 0.9 -2-1.0
▼ 111168 1.1 +13 ▲ Deutsche Bank 8
10 13 213,267.4 10.0
▲Deutsche Bank 9 10 268,028.9 12.6
2.8 ▲ 42152
10+9 ▲Credit Suisse2.5 ▲ 9
0.3+43 ▲ ▲ 641.1
9 144,813.97 146,605.3 1.1 +15
9.1 -3.3▼ 1459.3 -5.7 3.4 0.0▼ 139 ▼
Jefferies LLC 11 18 119,363.3 5.6 Guggenheim Securities LLC 113.0 0.21.1 -17 ▼ 571.0
▲ 11 0.2 0.340 136,681.8 8.6 7.7 0.1 -3 ▼ 44.6 ▼UBS 12 6 114,398.4 5.4
119 0.8 +18 ▲-9.7 ▼ 88 0.62.1 ▲
Paul J Taubman 12-13 ▼ - 130,298.3 0.0 0.0▲ 1.0▲ 1 0.0 +1 -RBC Capital Markets 13 15 110,891.6 5.2
8.2 8.2+5 ▲140 0.9 16 127,753.8Jefferies LLC 13 ▲
Allen & Co Inc 14 76 99,944.8 4.7 4.4 ▲-0.2 ▼ 8.1 3.1 2.3 0.30.9 +9 ▲ 444.7▲ 110
1.0 -10 2.5 0.3▼ 478.4Centerview Partners LLC 15RBC Capital Markets 14
▼ 325.6 -3.511 95,347.69 0.1 +2 ▲ ▼ 1266.0 -2.0 ▼
Rothschild 15 21 91,769.1 4.3 2.1 ▲ ▲327.3140 0.9106 0.7
Evercore Partners 16 14 84,996.30.3 +2
4.5 -2.54.0▲
-1.7 ▼+18 ▲+37 ▲ Evercore Partners 16
1.7 0.413 71,829.010 89,204.8
▼Perella Weinberg Partners LP 17 42 83,436.0 3.9 2.8 ▲
▼ 119Wells Fargo & Co 17
2.5 0.10.9 +17 ▲ 471.2▼ 70 1.5 0.114 62,482.7 3.9 -1.5 0.5 +18 ▲ 291.5 ▲
Wells Fargo & Co 18 17 81,543.9 3.827 0.2 +1 ▲
-0.7 ▼ 81 0.5 Moelis & Co 18+25 ▲ 15 54,617.1 1.8 0.5▲ 343.6▼ 90 0.7 +16 ▲Paul J Taubman 19 12 80,077.1 3.8
3.5 -1.6+3 ▲4 0.0 18 40,431.1Greenhill & Co, LLC 19 ▼
Greenhill & Co, LLC 20 23 48,010.4 2.3 0.3 ▲-5.4 ▼ 2.6 -1.8 0.7 0.20.1 -13 ▼ 127.8▼ 17
0.4 -3 0.9 0.3▼ 173.9Rothschild 21BMO Capital Markets 20
▼ 772.2 -2.619 37,451.230 0.2 +5 ▲ ▼ 532.4 -1.4 ▼
Houlihan Lokey 21 34 37,732.5 1.8 0.7 ▲ ▼187.830 0.2
173 1.1Tudor Pickering & Co LLC 22 46 36,231.6
0.6 -142.2 0.81.7
▼1.0 ▲
+38 ▲+11 ▲ Scotiabank 22
1.0 0.429 35,087.917 35,354.7
▲BMO Capital Markets 23 32 35,828.5 1.7 0.5 ▲
▲ 33Ernst & Young LLP 23
1.0 0.40.3 +10 ▲ 194.0▲ 68 0.1 0.054 32,034.5 2.0 1.4 0.5 +14 ▲ 15.1 -
Moelis & Co 24 16 35,295.0 1.756 0.4 -1 ▼
-3.7 ▼ 96 0.6 Macquarie Group 24+10 ▲ 34 29,938.3 0.7 0.0▲ 131.6▲ 52 0.4 +11 -Ernst & Young LLP 25 35 35,088.7 1.6
1.9 0.8+6 ▲ ▲0.5 ▲ 70 0.4 44 28,890.6Tudor Pickering & Co LLC 25 301.8 1.0 0.5 0.10.2 +12 ▲ 95.3▲
†Note: Industry Totals include multiple competing bids for the same Target.
Deutsche Bank Jefferies LLC
†Note: Industry Totals include multiple competing bids for the same Target.
77
92
5.1 ▲
29
▲
+27
17+22 16
9,814
Industry % Change from Same Period Last Year
Wells Fargo & Co
Mizuho Financial Group
+33
▲+17+3
Mizuho Financial Group
89
-12
▼
24,335.0 0.101.5
+736
▼
2.01.9
104
1.0
▲
▲0.1
▼ 0.80.9
2356,635.4
0.4
Moelis & Co
▲
197,538.1
▲
RBC Capital Markets0.2
50,685.6
Greenhill & Co, LLC
4 3
▼76
-14.0
16 -1.9
-12.0
-1.218
Industry % Change from Last Quarter
20 43,119.6
2.1 0.7
20
93
▲18
7
20
39,333.6+1
Tudor Pickering & Co LLC
1,138,394.0
+530
1.5
▲0.1
Goldman Sachs & Co 1
Market # ofFinancial Advisor US$m Sh (%) Share Ch.
RBC Capital Markets
Bank of America Merrill Lynch 3
Wells Fargo & Co 16
151129
172.8
JP Morgan 2 2 437,180.9
Citi 4
4.5 -2.4
g , ,gIndustry Total100.0 +86715,734 100.0Industry Total† +2971,584,124.3 12,7712,136,344.0
▼ -2.0%Industry % Change from Same Period Last Year 50.6% ▲ 5.8% ▲
Rank Value per Advisor (US$m) # of Deals per Advisor
▼ 7.9%
Rank Value per Advisor (US$m) # of Deals per Advisor
Industry % Change from Last Quarter -3.2%▲
100.0
-5.6% ▼▲
Imputed Fees (US$m)
▲
18,983.9
Industry % Change from Same Period Last Year 26.1%
US Target Completed (AF2) Jan 1 – Dec 31
2.4% ▲ 17.4% ▲Industry % Change from Last Quarter 47.8%
Sh (%)2013 Rank
Market
US Target Announced (AD2) Jan 1 – Dec 31
MarketRank Value Market2014 Rank Fees
# of Change in 2014 Rank
2013 Rank
Rank Value Market Change in Market# of Deals
Market
36.5 -3.3 ▼US$mDeals Sh (%) Share Ch.Sh (%)
Advisor
1,166.02.1 +48 ▲ Goldman Sachs & Co
MarketShare Ch. Deals Sh (%) # of DealsFinancial Advisor
1 558,300.4 0.18.6156 1.91 1209 ▼28.6 -8.7
+12 ▲385,671.0 33.9 -3.9 ▼▲
3JP Morgan+12▼
+243 413,250.1 27.0 -7.41.5
4.8▲ 1208.75▲959.1 7.1▲
0.10.1654.2
1.732.3 1392 -4.7 ▼367,979.0 ▲
9 407,412.9
+2831.3
▲▼ 1.3
▲1.5 +32 ▲Barclays
14.1 ▲ 1.3 +40127 1.5 +13 ▲26.6 Morgan Stanley 345,243.8 30.3 4.4 1213.829.7Barclays 5 5 378,584.6 337,697.35 4 113 1.4 +7
▲6.6 0.95.4 0.6 ▼
894.1
-3.924.7 -1.4 737.4▼ 1.4 Bank of America Merrill Lynch+47142 ▲
138 Citi 6▲
1.4Morgan Stanley 6 4 351,314.7 23.0 0.27 223,814.8 19.7 2.8 ▲ 567.3▲ 1.3 ▲Lazard 7 11 209,605.1 13.7 2.6 ▲
▼ 4.20.9 -3 UBS 1.9
+22+16 ▲ 10311▼ 0.40.6 017.4 8.8 ▲ 251.548 ▲
Credit Suisse 8 12 199,888.8 13.1-7
11.9 10.6 ▼0.5▲ 8 ▼ 28.40.1 -6 0.2Centerview Partners LLC 9 13 183,121.9
1036
▼
135,143.711.5
▲0.912.0 Paul J Taubman+4
10 17-9
Guggenheim Securities LLC 8 31▲▲
112 1.1▲
▲130,298.3 +1 ▲0.01
1.010.2 ▲11.5 ▲ -1.0 0.0
▼0.22.5343.7 ▲0.0
-8.2 ▼ 0.196 1.2 +26 472.2 3.5▲115,511.810 +104.4 ▲ 85153,088.3 10.0 -1.4 89
11 19 111,990.2 +20 ▲ Credit Suisse▲ 9.22.512 8
7.3 3.5 95 104,595.20.1
1199,944.8 +2 ▼101,189.9 8.9 -4.3 ▼ 0.8666.253 6.5
81
Jefferies LLC0.2▲ Deutsche BankAllen & Co Inc 12
6
UBS 13 6 88,883.9 52 ▼0.5 -5▼▲ 8
0.0-185.8 6.3Lazard+5
10▼
▼▲
-6.4 ▼+968,516.9
342.4372.8
▼4 0.2▲ 14 1213 71,129.1
Evercore Partners 15 14 77,733.5
2.73.1
1.0▲6.0Evercore Partners
▼
▼Paul J Taubman 14 8 80,077.1 5.2 -2.3 ▼
0.7
2.229 ▲-2.1-7.7
-7.3 ▼Centerview Partners LLC 151.114
-3.447,690.2
423.5930.4 +1 295.81.1
▼654.1 17
▲0.39 63,653.6 5.6▲▲63,277.7-0.0-2.5 ▼ ▲
▲ 2.10.84.266,751.4 4.4
2.03.5283.2
16 83 266.7+15▼+11
0.9 +10 ▲▲
0.6311.5 2.30.113
Moelis & Co 20 15 32,026.6
1.0 +1319 15 37,279.1 3.3 ▼-2.8▲19 32 103.1▼34,231.6 2.2 Greenhill & Co, LLCTudor Pickering & Co LLC ▼ 13 0.21.2 0.4▲ 0.3 +10 0.820▼ ▲0.92.1 -5.0 +884 34 28,890.6 2.5 1.3 0.4 +12 ▲
▲ 0.1 ▼10.195.3▲
0.10.7 0.1
▼25,266.1 2.2▼ -114 0.1 21▼Guggenheim Securities LLC 21 7 31,826.4 2.1184.2
12-0.826 31,741.1 1.4
2.0 0.70.2 ▲
5522
Allen & Co Inc 23▲
Houlihan Lokey 23 27 31,025.3+1Stifel/KBW 22 Qatalyst Partners0.9 -5 0.2
0.7▲1.619,867.71.618,981.6 1.7
1531.4
▲3 0.0 -3 ▼ 0.1 ▲0.4
0.154.71.4 ▲
▼ 1120,979.2 1.8▲
281.8
50Ernst & Young LLP
24Sandler O'Neill Partners11▲ +5 ▲▲ 0.1
0.2 ▲1.2 ▲ 90.652 0.6 +16-▲ 0.0 0.03.9
13,609.8 100.0+3▲1.5
+306
28.5% ▲
25 0.1
Industry % Change from Same Period Last Year▲
16,792.7 8
3.9%
132100.0
▲▲22.5%▲
8.5%-4.7%
8,217
46.1%
Industry Total
Industry % Change from Last Quarter-13.8% -2.1%8.1%
100.01,530,533.7
24 64
▲
23,098.5
51.5%
25 58 -
+29
1.2
▲
▼
Industry TotalErnst & Young LLP
https://www.thomsonone.com
* tie
Visit http://dmi.thomsonreuters.com to view archives and order custom League Tables7
Deutsche Bank Guggenheim Securities LLC
Industry TotalScotiabank
100 0 +5241 396 767 6 10 675▲ 16 0.8 0.8 ▲
16 877 0 100 025 39 21,127.1 1.5 0.6
1.10.1 +4 ▲ 126.4
12 0.1 +2 ▲ 186.7 1.10.9 ▲
Qatalyst Partners 24 30 21,178.6 1.5 0.2 ▲ ▲148.91.7 -3.1 ▼ 54 0.923 18 23,882.1 0.5 -15 ▼
20 0.2 +8 ▲ 12.5 0.1▲
Mizuho Financial Group 22 20 25,734.4 1.8 -0.7 ▼ 0.1 ▲95.31.2 ▲ 30 0.6 0.6
20Tudor Pickering & Co LLC 21
0.130,662.1 2.22.1
1.6 ▲▲37 28,890.6
▼ 127.817 0.2 -1349
0.3 +12
0.80.1 ▲57 0.5 +8 ▲ 13.70.8 ▲
2.0 2.0 ▲Greenhill & Co, LLC 19 17 40,431.1 2.9 -2.2 ▼
-1.7 ▼0.8 +15 ▲ 342.3-2.0 ▼ 89
1.7 ▲70 0.7 +18 ▲ 291.5 1.72.0 ▲94 0.9 +7 ▲
▲RBC Capital Markets 16 15 64,155.1 4.6 -1.0 ▼ 343.7 2.0
1.910 87,829.5 6.3 -4.3 1.9327.0▼2.6 2.61.0 +7 ▲ 443.8
3.4 ▲7 116,803.2 1.1 +14 ▲ 566.68.4 -8.0 ▼ 1192.5
▲31 0.3 +2 ▲3.4
▲105 1.0 +10 ▲ 2.5425.40.0 0.0 -
Jefferies LLC 12 16 125,877.4 9.0 3.7 ▲▲ 1.09.3 9.3 ▲ 1- 130,298.3
40.6 0.2136,302.7 9.8 8.8 ▲0.0 +1
0.2 ▲10 0.1 -4 ▼536.7 3.2 3.2 ▲130 1.2 -4 ▼
2.9 2.9 ▲Lazard 9 9 137,408.8 9.8 -2.7 ▼
1.8 1.8 ▲-1.3 ▼ 100 0.9 +4 ▲ 483.6
▼ 297.914.8 6.5 ▲ 6419.2 2.4
206,346.9 0.611 -14▲6 268,388.6 ▲136 1.3 +19 ▲ 689.4 4.1 4.1
▲777.9 ▲
148+35
Bank of America Merrill Lynch 5 4 366,735.9 26.36.9 ▲3.2
5.24.6
2.0 1.4 0▲ 5.2
173 1.6 ▲ 6.4+244 5 392,478.2 154 1.4
Sh (%)Market
Share Ch.Market# of
9.1232 1,527.82.2
Change in
+1 005-5
MarketDeals Sh (%) # of Deals Fees
Goldman Sachs & Co 1 1 465,859.2
25Guggenheim Securities LLC 0.1-10.01.7
32,042.6
Advisor
-3.0 ▼ 182 1.7-1.5 ▲
Share Ch.
+41 ▲
Industry Total 1 896 479 40.70.531,856.9 1.7Stifel/KBW
12 803
28.1
UBSCiti 6
▲15 -1
▲▲
57
95100 0
1.7 ▲0.6▼
Tudor Pickering & Co LLC 1.1-4.435,145.0
Greenhill & Co, LLC 2036
Ernst & Young LLP 23 31Moelis & Co 22
32
2147,674.136,231.6
1.9
201.9
14
2.648,433.5
4.7
▲Perella Weinberg Partners LP0.7 ▲19 21
80,077.1 4.2
0.1RBC Capital Markets 17 88,228.3
18
Wells Fargo & Co 15
17
81,543.9
74,221.711
▲
▲
12 109,630.66
15
5.0
4.316
14
22.422.8
5
▼-11.0
425,050.512
1.5
Allen & Co Inc 13 66 99,944.8 5.3 ▲
169 1.3 +40
UBS11 18
5.8119,117.0
822.5
456,854.25
2
64.5 ▲
▼
14.9
7 24.1
4.3
2.8-6.4
3.9
-1.816Paul J Taubman
71Rothschild2.5
Evercore Partners 81,355.0 1.081
▼
▲
0.4
▼
0.2 ▲0.2
-0.9
1,081.4
-
▲6.4
1,126.2
▲ 4.6▲
884.7
6.7+22 9.1▼
-3.1▼-1.1
▲▼-7.2 202
+50180 1.4203
+5
▲
+8
7
# of Deals per Advisor
137▲
+18
29
93
0.6
0.2 +1
+25
Change in
+28
+23
26
+17
294Deals # of Deals
▲▲
+19 2
# of
1.3
122
-5
Market
2.3Sh (%)
1.6Barclays
▲1.1
+4▲
Jan 1 – Dec 31Any US Involvement Announced (AD41)
Rank Value
11.54
-3.2 ▼
MarketFinancial AdvisorGoldman Sachs & Co 1
27.1
2013 Rank
26.0Bank of America Merrill LynchJP Morgan 3 2 493,028.0
US$m2014 Rank
1 671,135.73 514,434.1
Rank Value per Advisor (US$m)
35.4
Citi
168 30.0▲
6.7JP Morgan
Rank Value MarketImputed Fees (US$m)
0.6 +140.2 Ernst & Young LLP
Rothschild▼ ▼
3024
12 71,559.1 5.1
17
▲
Wells Fargo & Co0.0
▲
+3
104
Jefferies LLC9
18
11411.1
Centerview Partners LLC 910
41 0.313210,929.9211,892.1 11.2
0.3
Morgan Stanley
Lazard 7
431,500.2
108
4
283,320.5Barclays
Credit Suisse 139
6.3137
▲2.9
Paul J Taubman
Deutsche Bank▲+9
1.1
62,482.7 4.53.9
1314 54,535.9▲
▲▲
Moelis & Co
▼-2.5
4
▲
▼
▼
▲
0.7+1
30
+37
Americas Rankings
100+2 Credit Suisse
14+11
1.1
2013 Rank
▲
▲
Jan 1 – Dec 31
12.2230,656.9
Any US Involvement Completed (AF48)
▲
US$m▼
Share Ch.-2.3
MarketFinancial Advisor
Market
8
35
163,227.5
11
392,872.73
Sh (%)
# of Deals per Advisor
+11
+23
11.7
10
2
▲▲ Centerview Partners LLC
15
▲
▲
▼
Evercore Partners
418,487.63
33.4
28.1
Rank Value per Advisor (US$m)
1.6 Morgan Stanley
2014 Rank
+52
Full Year 2014 | Mergers & Acquisitions | Financial Advisors
Sh (%)
8▲
13▲
0.6
9 0.1
0.9
0.8
8 31,951.4
Bank of America Merrill Lynch Lazard
▲
Houlihan LokeyTudor Pickering & Co LLC
26.5%
UBS2.42
1.4▲
▲0
20
0.3
11
Industry Total
10 -2▲
0.4Macquarie Group
1
10,592.4 5.2 -0.9
▲3.28
-4.73.6
2,617
▲
0.1+238
+115.6
1,962Industry Total204,046.4
3.0
+2 ▲
▲ 120.2 ▲
0.0 +20.1-1.1
2.5▼
▲ 0.222.00.2
4.8▲ 30.6 1.2
0.2
-19.9%▲▼
0.1%▼
+1 2,590.6
▲ 5.3%-9.2%15.5%
Industry % Change from Same Period Last Year
2.7 0.12
-8.8%
▼
100.0
23 +1▲3,721.925▲ ▲
GMP Capital Corp-
100.0
2.12.0
▲0.1▲
0.02.9▼▲ 0.20.0 -3
12
▲1
0.644,732.4▲
2.0
3.52.9
26
11 0.4 3,972.8
XMS Capital Partners LLC
24
22 - 5,400.0▲
3.821
7,203.6-
+33.52.7
6,609.120 ▲
▲35.70.0 ▲
0.30.3+10.0
▼
8.40.6▼
19 - 60.411 0.32.30.0▼Credit Suisse
21 26 7,084.3 3.5 ▲+5▲
▲0.1 +925 2.0▲ 51.1 0.911
National Bank of Canada Fin'l 18 34 9,750.55.2
4.813 9,869.816
19 14 9,527.8 4.7 ▼0.80.1 -2 -3.2▲ 18▼
National Bank of Canada Fin'l4.7
17▼ Canaccord Genuity
8,767.1
0.1 1.5 ▼0.0 0.1
▼-1+4
1.8 0.5 ▲1.7
▲
1.238.4▼▲ 44.9
22
US$mAdvisor# of
▼Fees235.1▼0.2
0.1
▲
32,155.2
▲
# of Deals per Advisor
55.6%
Share Ch.
18.2
▲
▲
100.0
▲20.0% ▲
-6.9% 12.0%
+5241,396,767.6
▼
10,675
Industry % Change from Same Period Last Year 28.7% 5.2%
16,877.0 100.0
Industry % Change from Same Period Last Year 54.3% ▲
+1,005Industry Total 1,896,479.4 12,803
-1.7% ▼
100.0
8.5% ▲
23.4
7
18.1
35
26
Credit Suisse
3021
1.9
▲57
8-0.9
11.7
1.02.0
# of
2.2
Industry % Change from Last Quarter
* tie
20 9 7,254.4
▲
3.4%
▼1.0
Tudor Pickering & Co LLCHoulihan Lokey
5,400.0 2.75,902.918
Industry % Change from Same Period Last Year 38.6% ▲
Maxit Capital LP
-9.5%
23-2 19
0.5
100.0
▼▲
45.622 11,971.2Evercore Partners
▲
16▲ 12 6.3 11
TD Securities Inc
Sh (%)MarketMarket
Financial Advisor
17.1
▼
▲
5.1
188,632.2
-1.5
0.1
Industry % Change from Last Quarter
1.2▼-1.5
CIBC World Markets Inc
▲
+6
-1.0-1
+11
9,657.3
Rank Value
11,959.8
1.0
-
▲
Deutsche Bank
0
+9
▲19.6 23
21▲
8 25,951.6
44,439.625
▲
BMO Capital Markets
5Morgan StanleyBarclays
2
4JP MorganRBC Capital Markets
31.3
47,716.8
Deutsche Bank 67Scotiabank
21
112
Sh (%)16.2
+5
3 30,621.8 15.021.8
47,731.623.4 0.8
1 27.4Goldman Sachs & Co 55,969.9Sh (%)
2014 Rank
109.9
Rank Value
6Financial Advisor Deals
Market
+18
Market# of Deals
▲-5.8▲
Barclays-21
+1131.31.3
▼ Industry % Change from Last Quarter
2013 Rank
Rank Value per Advisor (US$m)
Any Canadian Involvement Announced (AD42)
Rank Value per Advisor (US$m)Market
Any Canadian Involvement Completed (AF49)
-11.5%
2013 Rank
Jan 1 – Dec 31
Share Ch.
Industry % Change from Last Quarter
US$m Sh (%) Share Ch.
▲
Market# of Deals
Change in MarketImputed Fees (US$m)
48 1.29.14.2
1.4▲▼
6.52.6
167.4
1 59,106.620.9
+12▲▲
DealsMarket
21
2014 Rank
0.1▼2 28-9.00.1
Sh (%)
Jan 1 – Dec 31
+14 16.3
RBC Capital Markets
34
▼1
Bank of America Merrill Lynch
2-5Goldman Sachs & Co
0.13.386.214.4 ▲
▲5.4▲
1318
0.0 -65
8+830,027.4 15.9 78.8 3.0▲0.1
2.6+6 ▲
▲-2
5Citi 0.00.1
7 27,553.2 14.614.8
▲
142
512.7
TD Securities Inc
25,332.7 12.424,089.5 26,445.1▼ 6Morgan Stanley
11
6.54.3 35
-5-3
BMO Capital Markets1.3
32.34.2
10
53-
Macquarie Group
▼
1.6108.4▲1934
8 3.89
98.524,079.3
Evercore Partners 16 15
8
7 18,290.9
9Citi 1310
# of Deals per Advisor
27,930.06Scotiabank▲ JP Morgan▼
25
▼
3.4
▼▼0.1
0.0102.1
▼
▲0.9
▲
▲
1.6
▲
-▲
67.75.9
▼
-8.714.0
-1.9
0.1
▼
▼
26
0.6-2
152.6▼
7
39,430.4
30,720.1
6.812.8
▲ ▲
+1▲11.321,376.2▼
14 9
▲
42.50.0
0.2-2 ▼ 115.116,760.70.30.09 1.69.510
4.4
20
59.3-4
17,845.4 1.4 ▲9
+1
+20.1
▲
▼0.5+15 ▲7.7Wells Fargo & Co
12
-17.1 -10.74
▼ 41
13,441.54.7 ▲
2
6.4
8.9
2.30.0 0.1
▼ 38 0.1 ▼ 109.1 4.2-1 ▼13 14,585.323 ▼6.0 3.02.0
14,912.3
▼
12,062.719
+171.1-5
▲
▼
2.9
1.9 ▲
-3.9
0.75.9 0.5
3▲ 15
11
22+1
Industry Total
51
14
6,609.1 0.03.2
0
3.9
▲
5.50.1
25XMS Capital Partners LLC+86
-
Rothschild 24-
6,119.1
BNP Paribas SA
23 22
1023,829.3
1215,678.9
2
17,013.0
23,707.6 ▼
▲9.0
11.6 0.50.3
+10.811.8
1.9-4
Change in
0.9▼
+8
9
0.3
0.1▲
▼
7.7
6.6 6.2
-1.8
▲
▼
Canaccord Genuity 17
▼
0.3
46
4.3
-6.0
15
8.3
Nomura14
413LazardCIBC World Markets IncWells Fargo & Co 7.3
16
14
▼
13,384.424
Visit http://dmi.thomsonreuters.com to view archives and order custom League Tables https://www.thomsonone.com
8
EMEA Involvement Announced Advisors by Target Industry Jan 1 - Dec 31 2014
1,223
11 3
6 2
13 23,546.4
1
24.42
15.3
25.3
26,069.1 19.0
1
No. Deals
2
172,272.2
44.376,233.1
959 1
Mkt.ShareRank Val US$m
93,618.1
Rank
Goldman Sachs & Co 54.3
3
3
17
22
8
153,841.8
17.016
20.8
5
39.2
28.7
29,288.5 1,194
21,013.3 68.9
21
12
45,047.2
3
16
4
35,471.4
134,985.5
28.6
61,592.8
Full Year 2014 | Mergers & Acquisitions | Financial Advisors
EMEA M&AEMEA Announced M&A Increases 36% | Healthcare Highest Valued Sector | Financial Sponsor Activity Rises
JP Morgan
Healthcare
Goldman Sachs & Co
49,261.9
Real Estate
14
EMEA Deals Intelligence
Industrials
Bank of America Merrill Lynch
Deutsche Bank
Perella Weinberg Partners LP157,070.2
15
52,641.6
34,203.1
3
1,365
33.5
2,620
MaterialsGoldman Sachs & Co
UBS
149.315,038.6 Morgan Stanley
14,277.8 46.8
140,350.0
Primary Listing of Most Acquisitive EMEA Companies - Top 10 (US$B) Jan 1 -Dec 31 2014
29,169.6
3
Energy and Power
Goldman Sachs & CoDeutsche Bank
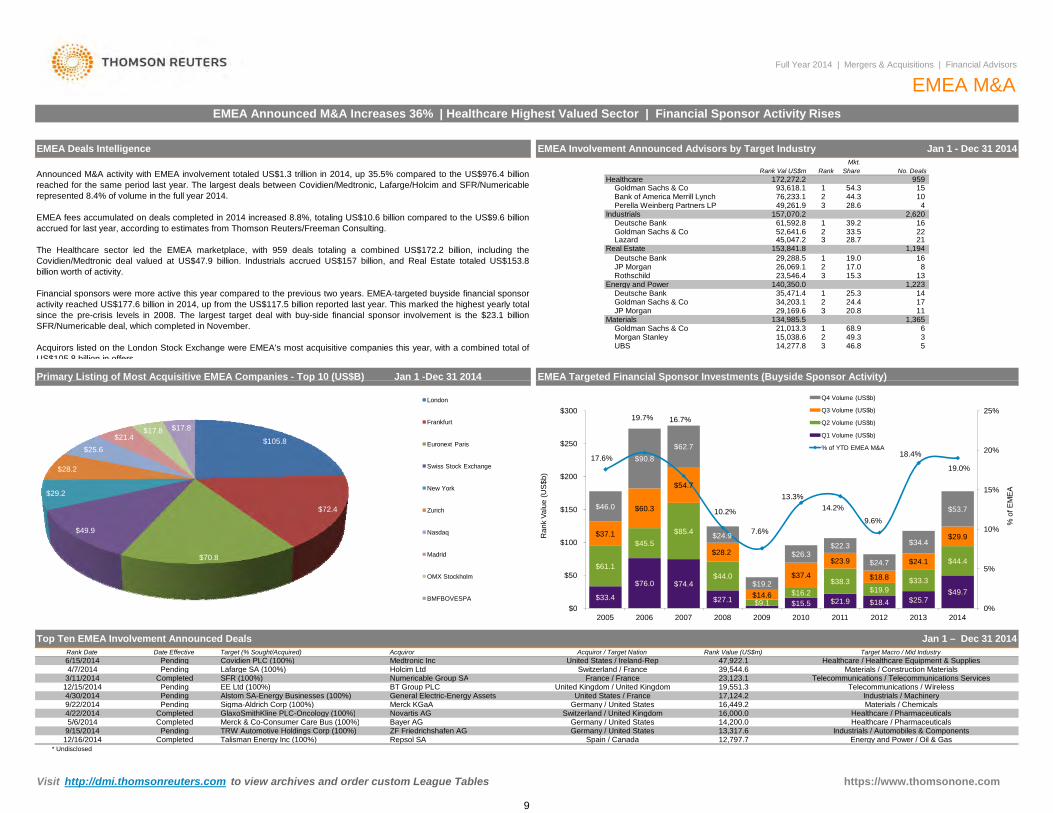
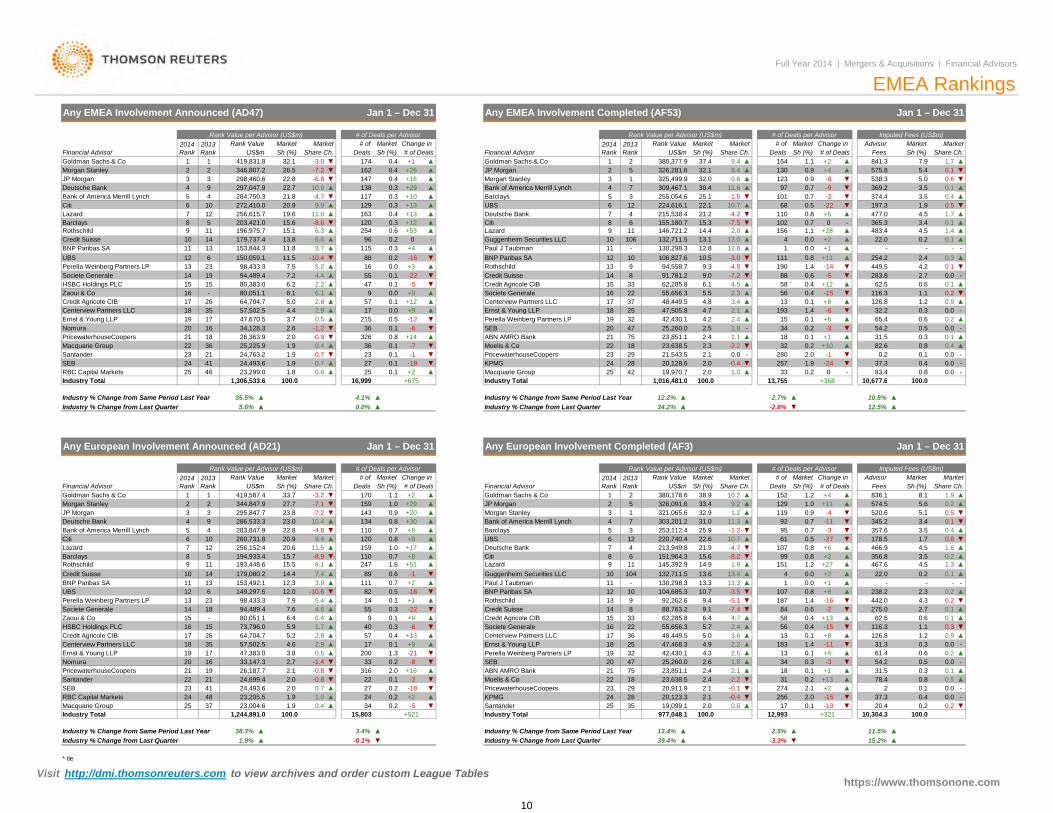
Announced M&A activity with EMEA involvement totaled US$1.3 trillion in 2014, up 35.5% compared to the US$976.4 billionreached for the same period last year. The largest deals between Covidien/Medtronic, Lafarge/Holcim and SFR/Numericablerepresented 8.4% of volume in the full year 2014.
EMEA fees accumulated on deals completed in 2014 increased 8.8%, totaling US$10.6 billion compared to the US$9.6 billionaccrued for last year, according to estimates from Thomson Reuters/Freeman Consulting.
The Healthcare sector led the EMEA marketplace, with 959 deals totaling a combined US$172.2 billion, including theCovidien/Medtronic deal valued at US$47.9 billion. Industrials accrued US$157 billion, and Real Estate totaled US$153.8billion worth of activity.
Financial sponsors were more active this year compared to the previous two years. EMEA-targeted buyside financial sponsoractivity reached US$177.6 billion in 2014, up from the US$117.5 billion reported last year. This marked the highest yearly totalsince the pre-crisis levels in 2008. The largest target deal with buy-side financial sponsor involvement is the $23.1 billionSFR/Numericable deal, which completed in November.
Acquirors listed on the London Stock Exchange were EMEA's most acquisitive companies this year, with a combined total ofUS$105 8 billion in offers
Rothschild
10
JP MorganDeutsche Bank
Lazard
2
EMEA Targeted Financial Sponsor Investments (Buyside Sponsor Activity)
12/16/2014 Completed Talisman Energy Inc (100%)
16,449.2
Healthcare / Pharmaceuticals
17,124.2United Kingdom / United Kingdom
Repsol SA
Telecommunications / Wireless
Healthcare / PharmaceuticalsGermany / United States
47,922.1
Materials / Chemicals
13,317.6 Industrials / Automobiles & Components
19,551.3Industrials / Machinery
23,123.1
Merck KGaA
ZF Friedrichshafen AGEnergy and Power / Oil & Gas12,797.7
United States / France
14,200.0
4/30/2014
Completed Merck & Co-Consumer Care Bus (100%)
* Undisclosed
16,000.0
Completed
Alstom SA-Energy Businesses (100%)
Lafarge SA (100%)
Pending
Pending
BT Group PLCNumericable Group SASFR (100%)3/11/2014
12/15/2014
Date Effective Target (% Sought/Acquired) Rank Value (US$m)
Jan 1 – Dec 31 2014
6/15/2014 Medtronic IncHolcim Ltd
Covidien PLC (100%)Target Macro / Mid Industry
Healthcare / Healthcare Equipment & Supplies
EE Ltd (100%)
Top Ten EMEA Involvement Announced Deals
y g q p p ( $ )
4/7/2014Telecommunications / Telecommunications Services
Rank Date Acquiror / Target NationAcquirorPending
Switzerland / FranceUnited States / Ireland-Rep
Pending
GlaxoSmithKline PLC-Oncology (100%) Switzerland / United KingdomGermany / United States
TRW Automotive Holdings Corp (100%)Bayer AGNovartis AG
Spain / CanadaGermany / United States
Pending Sigma-Aldrich Corp (100%)Pending General Electric-Energy Assets
5/6/20144/22/2014
France / FranceMaterials / Construction Materials39,544.6
9/15/2014
Completed9/22/2014
g p ( y p y)
$33.4
$76.0 $74.4
$27.1 $15.5 $21.9 $18.4 $25.7$49.7
$61.1
$45.5$85.4
$44.0
$9.1$16.2
$38.3$19.9
$33.3
$44.4
$37.1
$60.3
$54.7
$28.2
$14.6
$37.4
$23.9
$18.8
$24.1
$29.9
$46.0
$90.8$62.7
$24.9
$19.2
$26.3$22.3
$24.7
$34.4
$53.7
17.6%
19.7% 16.7%
10.2%
7.6%
13.3%14.2%
9.6%
18.4%
19.0%
0%
5%
10%
15%
20%
25%
$0
$50
$100
$150
$200
$250
$300
2005 2006 2007 2008 2009 2010 2011 2012 2013 2014
% o
f EM
EA
Ran
k Va
lue
(US
$b)
Q4 Volume (US$b)
Q3 Volume (US$b)
Q2 Volume (US$b)
Q1 Volume (US$b)
% of YTD EMEA M&A$105.8
$72.4
$70.8
$49.9
$29.2
$28.2
$25.6$21.4
$17.8 $17.8
London
Frankfurt
Euronext Paris
Swiss Stock Exchange
New York
Zurich
Nasdaq
Madrid
OMX Stockholm
BMFBOVESPA
https://www.thomsonone.com Visit http://dmi.thomsonreuters.com to view archives and order custom League Tables
9
Credit Suisse
RBC Capital Markets 25 46 23,299.0 1.8 25 0.11 306 533 6 100 0
▲0.8
24,763.21.924,493.6
34,128.31716
3547,670.5
25,225.926,363.9
41 ▲
15
57,502.5 4.4
6.180,383.080,051.1-
5.064,704.726
0.1
▲
▼
▲
+675
+90.0
▲
+12
0.1 -18
16 999+2
0.1
0.3
-7
+4
0.10.1 -5
0.5
0.127 ▼
▼
20SEB
Macquarie Group
ABN AMRO Bank
▲
2324
PricewaterhouseCoopers22
29
Industry Total25
▼0.2
-
126.8
82.6
65.4 0.2
0.8
0.0▲
▲▲
449.5
0.8
0.5
32.2 0.3
483.4
0.2
31.5
4.2
83.4
283.8
0.1
1.1
2.7
1.2
▲▲
-14▼
1.40.80.0
12 ▼ 111
2.0
10.512.8
146,721.2 ▲▲
10
132,711.514.4
-3.0- 12.8
106,827.6
13.1130,298.3
10611
15.368215,538.4155,180.7
-4.7 0.3
0.4
+10 Barclays
Citi
11
7
-Lazard 9
10▲
▲ Paul J Taubman
22.8
272,410.021.822.7
20.9
298,460.6
284,750.30.3 30.4
25.122.1
▲0.3 ▲
57
256,615.7 19.6UBS 224,616.1
▼
21.2+13+13
▲ Deutsche Bank -4.26 10.7
▲
4
3.5
4.5
3.5
1.9
▲1.4
-
0.4
0.1
0.1▲
1.7 ▲
4.522.0
0.32.4
▲
0.0
0.0
0.1
0.1
0.6
0.1
62.5116.3
37.3
-▲
-24
-▲
0.4
0.3
▼
▲
▲
0.6 -5
-1
0.654.2
+3680.0
0.4-
-
0.0
-
-100 0
-30.1 0.1+1
▼▲
21,543.5
23,851.1 2.4
42,430.125,260.0
23,638.5
-15
0
18
1.4
34
32280
+10
1.9
56
-
13▼
0.2
-60.115 ▲
2570.2
0.4 ▼0.1
▲
+6
+8
33
193
13 755 10 677 6
-
1 016 481 02.0
2.1
19,970.720,128.6 ▼
▲
▼2.3
0.0-0.4 ▼28
42 1.0100 0
2.0
▼97
3
-1.5
▲
▼
5.0
+12
0.5
88
369.2
0.458
-90.9
3.4
-
0.9
0.0
▲
▼197.3
254.2
0.2-▲
7.9▼
▲
0.6
▼
▲▼
Change in Market
▼
1.70.1
2014 Rank
EMEA Rankings
AdvisorShare Ch.
Full Year 2014 | Mergers & Acquisitions | Financial Advisors
MarketSh (%) # of Deals
Any EMEA Involvement Completed (AF53)
# of Deals per AdvisorMarket
Imputed Fees (US$m)# of2013
RankMarketMarket
Rank Value per Advisor (US$m)
▲Share Ch.
Rank Value# of
0.9▲▲ 1.1
2014 Rank
Jan 1 – Dec 31
841.3 ▲Sh (%)
▼-8
11.6 ▲
+49.4
32.08.4 130
US$m154 +2
-2
JP Morgan 51
4Bank of America Merrill Lynch3
5.4575.80.6
▲
374.4
325,499.9 538.3123
0.7309,467.1
32.1Financial Advisor# of Deals
174 Goldman Sachs & Co21
162 +260.4+1▼ 0.4 37.4
▼▲▲
326,281.6 32.1▲
477.0-
+5-22
0.4▲+29
Morgan Stanley
255,054.6
365.3▲
0.7▼▼
▼
190
1.10.7
+28
0.5
+11
0.8
4
▼156102110
+2+1
91,781.2
1
101
0.0
▲
138
12 ▲ 68
9+3
▲
0
Guggenheim Securities LLC
7.27.5
13.0
-7.5+53
94,489.4
11.51688150,059.1
▲▼
4.4▲98,433.3
+1215.6
▲5.2
3.7
6.3
550.00.2
-22▲
0.3▲▲
0.66.6
2540.2
47
▼ 120
6.2 2.2
SEB
Industry Total
Nomura18
Macquarie Group 2221
Santander 23 21
PricewaterhouseCoopers20
36
24
2.6
6.1
2.0
1.91.9
0.7
2.8
-1.2
-0.7
-0.9
0.52.9
0.4
17
▼▼
326-636
215
-1KPMG
▼
▼0.1
+14
▲▲
▲
579 Societe Generale
▲Ernst & Young LLP+9
-12 Perella Weinberg Partners LP 19
2.1▲▼
3.70.0
19
2.00.2
Centerview Partners LLC
0.836 ▼▼ -2.223
6.162,285.8
3725
75
4.8
4.2
18
47,505.8
14Credit Suisse
21
▲ 1615 4.5
1.8▲2.4
Moelis & Co
9.0Credit Agricole CIB 33
1718
▲-
3247
4.7
5.555,656.348,449.5
22
2.5
9.3
2.1
▲3.4
▼
2.3
▲▲
-7.2▲
12
5
6
10
15.1
4
10
297,047.95
13
2
8
Citi 6Lazard
JP MorganMorgan Stanley
Bank of America Merrill LynchDeutsche Bank
0153,844.3179,737.4
▼▲
13.8 96
-1611511.8
Change in
380,377.9
Market
94,558.7
▲
+16
129
-8.6
-10.4Rothschild
7
9
11
Societe Generale
12
14
Rothschild 914
BNP Paribas SA 11
Ernst & Young LLP
Perella Weinberg Partners LP 13
15
4
12Barclays
19
17
23
18Credit Agricole CIB
UBS
196,975.7
33
Centerview Partners LLC
HSBC Holdings PLC16Zaoui & Co
11.0
14710.9
9.9163
138117
-6.8▲
346,807.2 -7.2 ▼
# of Deals per Advisor
203,421.0
Rank Value Market
419,831.8 -3.0
▲
26.51Goldman Sachs & Co
2013Rank US$m Sh (%)FeesDealsShare Ch.
MarketSh (%)Sh (%) DealsFinancial Advisor
Jan 1 – Dec 31
2
-4.5BNP Paribas SA
Rank Value per Advisor (US$m)
▼
Any EMEA Involvement Announced (AD47)
Credit Suisse Guggenheim Securities LLC
Perella Weinberg Partners LP
2.957▲
2000.5
26
20
5.6%
1,306,533.6
193,448.6194,933.4
Industry % Change from Same Period Last Year
419,587.4
Rothschild
9
Financial Advisor
100.0
33.7Sh (%)
▲2.7
35
14
16
3.84.6
17
15
57,502.5
5.9
18
149,297.5153,492.1
-3.2
0.2
Market
▲
6.1
▲
Market
0.7 27
40
33-1.4
▲
-0.8
3.4%
24
-
98,433.3
1564,704.7 5.2
18
2313
47,383.0
23,205.5
16
179,080.2
73,796.080,051.1
1.7
94,489.45.4
7.4
7.6
-10.6
▲
▼
▲
4.6 ▲
▼
▼
15.5
2.8
6.4 6.4
7.9
+521
14.412.312.0
▲Industry % Change from Last Quarter
100.0 +321
▲
SEB
1,244,891.0
▼
38.3%
-0.8
▲▲
11
55,656.3
92
0.5
3.4
20
+6
▲
0.6
0.6
10,304.3 100.0
-
11.5%
-0.00.178.4
.20.5
▼
▲0.1
0.0
▲
▼0.9
-
▼
-
31.5
0.20.437.3
0.8
0.2 ▼
▲
20.4
▲
▲
22
0.9
+2
0.1
34
▼-2
+675
1.1
Change in
▲
16,999
0.0%
▼+2
Sh (%)
4.1%
# of
▲
Deals
Jan 1 – Dec 31
# of Deals per Advisor
170
▲
▲
1.0
1.6
+9
316-8
0.5
-21
0.7
-6
0.3
0.1
+16
-130.1
BNP Paribas SA
10
▲
▼
▼
▼
Credit Suisse
22
+8+17
+13
+1
1
▲
▲-22
4
13
ABN AMRO Bank
▼▲
2▲
Centerview Partners LLC
Credit Agricole CIB
▲
Rothschild
Societe Generale
+29+20
JP MorganMorgan Stanley
▲
# of Deals Financial Advisor
Industry Total
Goldman Sachs & Co
2013Rank
2
Moelis & Co
Deutsche BankUBS
+2
Industry % Change from Same Period Last Year
12
35
6
Change in
Jan 1 – Dec 31
836.1
-
+4
▲
▲
▼
+1
-3
+11
345.2
0.2
+368
Sh (%)
0.5 ▼
▼
▼
+1
-15
▼
+2
+13-2 ▼
▲
-3+4 ▲
+13
-11
▲
0.5 ▲▼
1.9
▼99
56
▲
183
2.1
0.9▲
95▼
▲
1.4
▲
0.8-4.7
0.7
-8.2 ▼
61
0.8
3
1.231.0
-1.27
2.1
1.8
0.6
0.3
▼18
0.1▲
0.4
34
▲
58
# of Market
0.01.2151
0.8▼187
Rank Value
▲
11.3321,065.6
9.2
Market
▲
213,949.8
Share Ch.152
Deals
▲
▲
15.6
25.9
21.922.6
0.7253,112.4
326,091.6119129
1.21.0
▲107
1
107
32.9▲
10.7
413.614.9
0.0
-16
+2
-27
-11
13.3▲
-3.5
10.7
13.4
84
+2
▲
13
13
0.11.4
+8
+8
0.4
0.118
274256 -15
17
31
2.02.1
▲
12,993
2.5%▼ 15.2%39.4%▼
▼
▲
0.0-0.4
▲-3.3%
0.4
0.3
▲
1.6
▲
▲
0.1
0.1
0.2
-
▲
▲▼
▼
▲
Imputed Fees (US$m)
▲
Share Ch.
▲
4.3
3.5
3.5
0.2
0.2
0.1
1.9
0.5
4.5
-
1.2
2.3
4.5 1.30.2
2.7
0.3
0.2
▲
▲
54.2
116.3
▲
0.0
0.30.2
1.1
61.4
126.8
100.0
10.8%
▲
▲
-
0.8
▲
Market
0.1
5.1
34.2%
Market
2.7%12.5%
13,755
# of Deals per Advisor
▼
Any European Involvement Completed (AF3)
-2.8%▲12.2%
10,677.61,016,481.0
-0.1%
17
11.5 ▲
0.6
▼ 110
0.39
55
12
2.133,147.3
17
11
1.9%
-8.9
Santander
19
Santander
23
▲17
Industry Total 15,80325
SEBPerella Weinberg Partners LP
5
1
19
10.2
Rank Value per Advisor (US$m)
47,468.3
100.0
US$m
220,740.4
303,201.2
▲
38.9Sh (%)
▲
33.4
2014 Rank
380,178.6
Industry % Change from Last Quarter
Industry % Change from Same Period Last Year
Industry Total 100.0977,048.1
2.6
29 2.1
35 2.019,099.1
13.4%
42,430.1
23,638.5
25,260.075
▲
2147
2.5
20,123.3-0.1
4.3
20,911.9
32
23,851.1-2.22.4
2.421 19 26,187.72122 24,699.4 2.0
6
10
111413
57
9
Nomura
Centerview Partners LLCCredit Agricole CIB
PricewaterhouseCoopers
Ernst & Young LLP
Societe GeneraleZaoui & CoHSBC Holdings PLC
UBSBNP Paribas SA
Bank of America Merrill Lynch6
12
10
Barclays 8LazardCiti
1
5 4
Goldman Sachs & Co
Industry Total
Deutsche Bank
Rank Value per Advisor (US$m)
▼Share Ch.
Rank Value
▲
1
35.5%
23.8
Market2013Rank
2295,847.7
Industry % Change from Last Quarter
3
US$m
344,847.9
2014 Rank
▼▼
-4.810.4-7.2
▲
-7.1
286,533.332
JP MorganMorgan Stanley
4
20.9159
260,731.8256,152.4 20.6
283,847.9▲▼ 110
143
+9
1.0159
+301340.7
151,964.38
9.4 +9
Bank of America Merrill Lynch▲0.8
0.8Barclays
120
247▲
412
145,392.96▲
Lazard
7Citi
89
14
111-1
▲
▲82
0.1▼
0.7
▲2.0▼0.2
+91.3
0.4Ernst & Young LLP
27.7
22.8
Any European Involvement Announced (AD21)
23.0
132,711.5▲ 119
▲▼
130,298.3-104
Paul J Taubman10 104,685.3
92,262.6
13.3
▲
▼
2.422
▼9.499.1
-5.1
36
4.7-7.4
6.4
5.0
3388,763.2
2.2183.6
5.7
4.9
14
48,449.5
62,285.88
25
1516
0.1-16
15.7
3.9
+51
▲
▼
22.0
31.3
▲
275.0
238.2
466.9
62.5
467.6
442.0
▼
356.8
▲
▲
▲
Market
▲ 8.1
▼
5.6574.5
357.6
520.6
Advisor
▼
178.5 1.7
Sh (%)# of Deals
▼
Industry % Change from Same Period Last Year
* tie
Industry % Change from Last Quarter ▲
240.2 ▲▲ KPMG-50.4Macquarie Group
24RBC Capital Markets1.937
23 2.024,493.6
25 23,004.6
0.24148 1.0 281.9
PricewaterhouseCoopers-18
Fees
-4
+27
https://www.thomsonone.com Visit http://dmi.thomsonreuters.com to view archives and order custom League Tables
t e
10
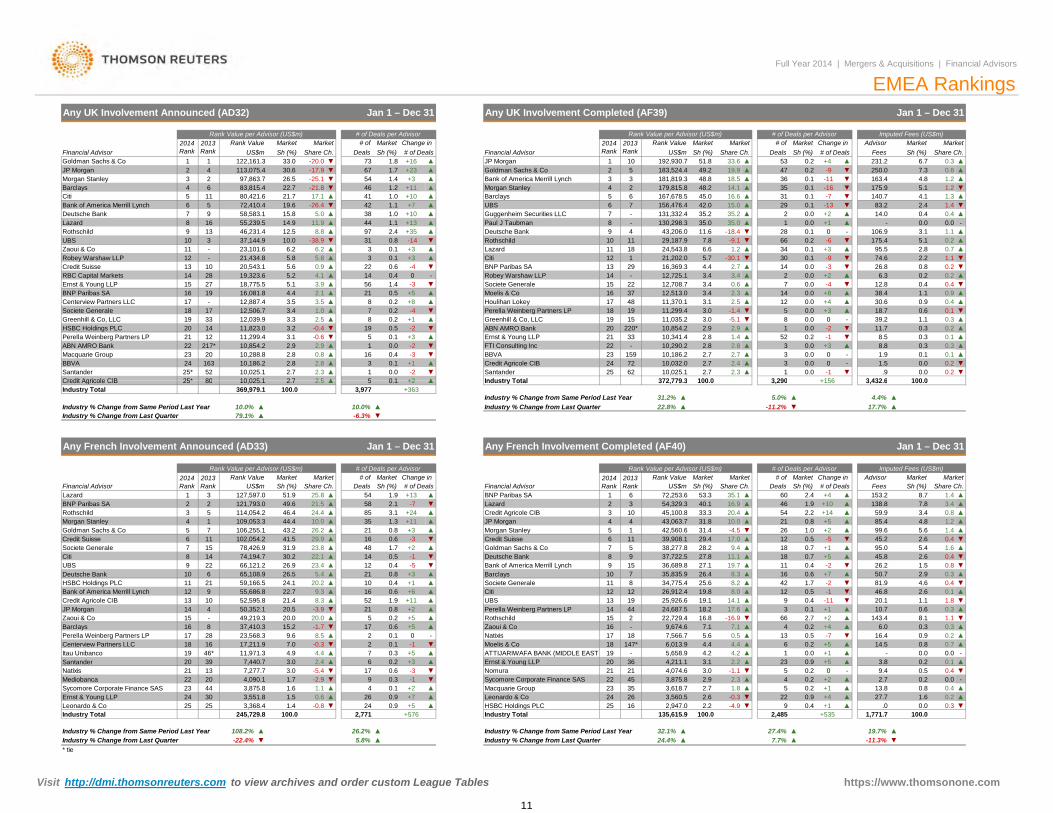
UBS Rothschild
ABN AMRO Bank
Credit Agricole CIB 5 0 1 +2 ▲25* 80 10 025 1 2 7 2 5
0.0
▲ 126.2
▼
5.8▲
10.06.2
-38.9▲8.8
▼1.0
3 290
2.72.7
372 779 3
3 0.0
8▲ 0.0
-1
0.0
0.21
52
▼ 0
+4
2-4
+20.0▲16,369.3
+352.5
0.00.0▲ 12
-1.4 ▼
0.1
3.4
3.4
14
714▲
▲
-30.1
3.4
0.9 ▲
56 12,708.7-3
0.60.4
Societe Generale
13-
BNP Paribas SA14 12,725.1
21,202.0
1429
+3-4
-
0.1▲
5.7
3.4▼
▼+3 1.2 ▲18
0
▲1Citi
11▲
3430
0.1
2.4
3
12.5▼29,187.910
6.624,543.8-9.1
914.9
973 66
23,101.6
130,298.3▲ 4+35
▲
-14
11.946,231.4
0.831
8Deutsche Bank 9
+13
1.041UBS
▲38
1.1
5
449 15.8 ▲
▲19.6 -26.4
17.1
5.0
+10 Barclays
+10
▲
▲+7▲
1.1
-20.0
▼1.2
+3
10+23
+1146 Morgan Stanley1.4
80,421.6 21.7 ▲
1.86754
33.0-17.9
▼30.6 ▼ 1.7
1172,410.4
-21.822.797,863.7
626.5
Lazard13
Bank of America Merrill Lynch
Morgan StanleyBarclays 4
Deutsche Bank 78 16
3
6
-
55,239.5
10
558,583.1
Rothschild
JP Morgan1
2
Sh (%)Market
5.12.1
▲5.6
-0.63.1 ▼
10,288.812.9
21
3.4
24
Perella Weinberg Partners LP
Greenhill & Co, LLC3.2
12,506.73.3
2.910,854.2
20
1.0
5.2
14 -0.412
11,823.0
12,887.416,081.8
12,039.9 2.5
▲
3.54.4
3.9
18
18,775.527
17▲
3.5
52
222023
217*
163
ABN AMRO Bank
20,543.112
RBC Capital Markets 19,323.6
Robey Warshaw LLP 21,434.8
2810
16
Macquarie Group
5.8Credit Suisse
15
1314
-
Ernst & Young LLP
33
Centerview Partners LLC19
19
-Societe Generale
BNP Paribas SA
17
BBVA 10,186.22.8
10,025.1 2.72.8
2.3 1▲▲
0.8
5
▲
▲▲
▼ 19
▲
73
4.1
-25.1
42
113,075.442
122,161.3
83,815.4
37,144.9
Share Ch.2013Rank
Any UK Involvement Announced (AD32)
Santander
32
56
18
1111.6
10,032.0
6
7Paul J TaubmanGuggenheim Securities LLC
20
24
Lazard
Robey Warshaw LLP
2322
15
3.14817
10,290.2 2.810,186.2
11,035.2
2.7
2.8
3.0
-
62
10,854.2
72
100 010,025.1
▲2.42.3 ▲
+38.5
-239.2
3 432 6
1.9-0
Share Ch.
12.86.3
74.6
175.4
0.3
26.8
14.0
163.4
▲
95.5
--
106.9
▼
▲
▼
▼
▼140.7
Change in
83.2
175.9-16▼
▼
-13
231.2
▲
6.7
4.8250.0 0.8
Jan 1 – Dec 31
Rank Value per Advisor (US$m)
Sh (%)Advisor
Fees
Imputed Fees (US$m)Market
1.3
▲1.2
5.1▲
7.3
▼
0.0
1.40.4
▼2.44.1
3.10.0 -
1.1
2.81.1 ▼
▲5.1
0.20.8
▲
0.7
0.2
▲0.2
▼2.2
▼
0.9
▲
0.20.1
0.4
▲0.3
▲
38.4
8.8
▼ 11.70.3
30.6▲ 1.1
18.71.1 0.3
▲
0.1
▼
-▲
-▲
100 00.2
0.5
▲
21
Sh (%) # of Deals
▲
16
▼8
1.4
▼
22
▲
0.4
+3-2
▲▲
+16
Change in
Moelis & Co
Greenhill & Co, LLCPerella Weinberg Partners LP
▲
-1 ▼
0.0
0.0
0
+15613
+4
▼
+3
+2
▲
+8
-7
▲▼
-11
0.10.2
+1
0.00.0
0.0
-60
-9-3
7.8
19.9
0.10.1
4.4
0.1
16.6▲
0.0-18.435.0
0.114.1 35
▲
▲
15.0 29
1
32.8
▲
▲
-5.12.9
2.7
1.4▲
+1
Houlihan Lokey
28
31
▼
Any UK Involvement Completed (AF39)
EMEA RankingsJan 1 – Dec 31
Market# of Deals per Advisor
▲33.6
# ofMarket Market
192,930.7Sh (%)
▲49.2
Deals0.2
Share Ch.Market
Full Year 2014 | Mergers & Acquisitions | Financial Advisors
2014 RankFinancial Advisor
Rank Value2014 Rank
# of Deals per Advisor
-9
Sh (%)
0.2 ▼36
# of Deals
▲4753 ▲
48.2181,819.3 48.8
35.2
0.1
0.0
▲
235.2 ▲
25
35.0
45.0167,678.542.0
131,332.4
159
2.9
3.011,299.4
-
10,341.433
19
.9 ▼1.5
0.6
0.00.0
0.3
0.3
0.4
0.1
0.2 ▲
0.4
▲
▲
0.2
▲
▼
▲
▼
▲0.9
▲
1.2
0.4
0.1
▼-2
22
3
7
3
-
0.00.1
Industry Total
-47 ▼0.2
0.0
+1-3-2
▲8
+5
0.2
0.5+8 ▲0.2
▼
Deals
3
# of
Zaoui & Co 11
Market MarketUS$m
2013Rank
0.1
Santander2.8
25*
HSBC Holdings PLC11,299.4 ▲
FTI Consulting IncBBVACredit Agricole CIB▲
▼
Rank Value per Advisor (US$m)
5 183,524.4
2.3
Ernst & Young LLP
15
43,206.0
16
18.5
51.8
▼
2.7
0.6
21220*
37▼
11,370.119
12,513.0
US$m
Citi
Goldman Sachs & Co 1Financial Advisor
Bank of America Merrill Lynch
JP Morgan
Rank Value
156,476.4
179,815.84
1Goldman Sachs & Co 2
Credit Agricole CIB
* tie
Deutsche Bank Barclays
Santander
5 0.1 +2 ▲25 80 10,025.1 2.7 2.5
0.4 +1
Market
1
5-0.3
▲1
5
4.223
9
1.822
▲▼
Market
▼
Jan 1 – Dec 31
Market
17.7%
Rank Value per Advisor (US$m)
Any French Involvement Completed (AF40)
▲
Market
Industry % Change from Last QuarterIndustry % Change from Same Period Last Year
3,290
31.2%22.8% -11.2%
372,779.3
0.8
11
2
7,566.7
5,658.94.4
4.2
2.2 -4.9
JP Morgan
Lazard 3
4.4
7
10.0%
25
-
-3
4
6
▼
+1354
+5
Lazard
2013Rank
BNP Paribas SA
Industry % Change from Last Quarter
Rothschild 3
Industry Total
2
Industry % Change from Same Period Last Year
Rank Value per Advisor (US$m)
369,979.1
10.0% ▲
100.0
Market
▲ 8558
Share Ch. Deals
▲
4 1 35
▲
-6.3%
7
25.8
Market
51.9
10
520.60.4 +1
1.916
-5
2.9
5.67.1
16.822,729.4
35
121,793.0
22Macquarie Group
21
16Zaoui & Co
Industry % Change from Same Period Last Year
36
23
Ernst & Young LLP
▲UBSPerella Weinberg Partners LP 14
▼▲ 19
20
Societe Generale
15
11Citi
13
▲
12
▼Goldman Sachs & Co
▼
Credit Suisse▲▲ 21 Morgan Stanley
14+2
2013RankFinancial Advisor
▲
100.0
39,908.1 29.4
53.3US$m Sh (%)
17.09.4
18
17.6
18
16
12▲
▲
147*
-
18
Rothschild
27.1
0.5
14.1
7.1
8.219.8
2.23.03.1
27.4%
4
▲
▼1.6Leonardo & Co
HSBC Holdings PLC
0.1
2.7 0.2
▲
▼0.40.5
0.2
-0.8
▲0.2
0.8
▲0.00.4
0.00.7
-▲
▼
▼
0.8
1.1
▲8.1
▼
0.4
0.30.6 ▲1.8
▼
▲0.1
0.4
0.41.6
▲
▼▲0.3
0.8 ▲
▲
▲
▼1.4
Sh (%)
3,432.6
Change in
5.4
100.0
138.8 7.8 ▲
4.4%
AdvisorDeals FeesSh (%)
▲3.4
3.4
2.41.9
+4Share Ch.
13.8
4.859.9
1.2
1.4
3.89.4
0.2
14.516.4
▲35.1
+5▲+14
212.254
6046
12
16.9
-4.510.0
33.340.1
31.8
▲20.4 ▲
42
-50.7
+7
▲ 0.5
▲
▲+1+5
-1.1
-2
19.7 -20.70.4▲ 11
11.1
1.7
135,615.9
3,875.8
26 3,560.53,618.7
4,211.121
2.72.6
4,074.62.3
+5 16Industry Total
2,947.0
Industry % Change from Last Quarter32.1%26.2%
▲
BNP Paribas SA
0.2+2
▲
▲+6
0.51.7
0.8 +3
Credit Agricole CIB
21
-7
+11
-10.4 Bank of America Merrill Lynch
▲
# of
▼
0.6
▲
16
2.1
1.33.1
Market
12
48
6
14
6
2
21
7
5▲-3.9
-2.9
▲
2.4
▼
▲
17
▲
▲2
▼▲
17
4
▼20.0
8.5▼
▲
0.9
10UBS
Zaoui & Co
74,194.7
9
26.5
22.7
22
59,166.521
157Credit Suisse
Citi
11
18
HSBC Holdings PLC
17
98
106,255.141.5
5 43.26 102,054.2
108.2%
245,729.8
-22.4%Industry % Change from Last Quarter* tie
▼
Industry Total
Industry % Change from Same Period Last Year
392019Itau Unibanco 46*
2525
Mediobanca
Ernst & Young LLP
41516
14
24Leonardo & Co
21
JP Morgan
30
Natixis 1320
49,219.3
3.0
1.6
Centerview Partners LLC 16
89.6
7,440.7
-
1.7
Bank of America Merrill Lynch
Sycomore Corporate Finance SAS 23
Perella Weinberg Partners LP
Credit Agricole CIB
28
10
2244
Barclays
13
15.2 -1.7
3.0
-0.311,971.317,211.9 7.0
4.9
20.5
15
31.4
22.1
21.4▲
8.39.3
▲▲
▲
54,329.3
▲5
927.8Deutsche Bank28.2▲
8
45,100.8
1.00.8
1+11 4
3
▼
10
# of
▲
+156
# of Deals per Advisor
▲
Jan 1 – Dec 31
+363
# of Deals per Advisor
Sh (%)Change in
1.9# of Deals
3,977
23.8
26.2Goldman Sachs & Co
49.6114,054.2
44.4 10.0
31.9
46.4
Societe Generale
▲109,053.3
127,597.0
12
▲▲
29.91178,426.9
52,595.8
5.424.1
26.9
20.2
23.4
55,686.8
66,121.230.2
▲
0.8
50,352.1
37,410.320.0
-5.4
4.4
23,568.3
3,368.4
65,108.9
7,277.7-1
1.4
4,090.1
-0.8 ▼
1.13,875.8▼
0.63,551.824
0.3+2 ▲
26 ▲0.9 +70.1
7.7%
+535
24
9
2,771▲
45▼
▲5.8%
+576
24.4% ▲
100.0
1.5
100.0
6,013.9
25.6
ATTIJARIWAFA BANK (MIDDLE EAST
▲
26.4
+5
Moelis & Co
▲+3
▲Share Ch.
72,253.6
+24
6
1944
8 34,775.4
2014 Rank
Rank Value
0.2
0.6
▼▲
9
9,674.6
8.0
66-16.9
▲12
24,687.5
10
▲26,912.419.1
8.3
18.2
7
▲2
▲
0.6 ▲0 18- Natixis 170.1-1
+3-3
0.1+50.3
0.20.6
▲
▲
100.0
-11.3%
27.7▼0.0 0.3
0.9
-
▲
0.0
▼Sycomore Corporate Finance SASNomura
▲0.2
0.2▲
.0▲
6.0-7
0 -
0.31.1143.4▲
▲0.9
▲
▲
▼
▲
20.1
1,771.7
0.3
0.0
▲
4.646.8
10.7
▼
▼
81.92.6
50.726.2
2.91.5
5.6
Imputed Fees (US$m)
▲
▼
▲45.8
▼
▲
85.4
45.295.0
+2 99.6▲
▲▲
+10153.2
Market
2.6
▲▲
8.7# of Deals
▲
2.6
1 3
2014 Rank
Rank Value
▲
Any French Involvement Announced (AD33)
▲▼79.1%
Industry Total
Morgan Stanley52
US$m
21.524.4
Sh (%)Financial Advisor
2,485
+1+4
19.7%▲▼▲
+2+4
▼
▲+5
0.2
2.7
▲
0.5
+2
+1
13
▲▼
+1
0.2
0.1
6
5.0%
-11
+5
3
▲
▲
26
0.50.425,926.6
43,063.7
36,689.835,835.9
42,560.6
537,722.5938,277.8
4
0.9
-1
Visit http://dmi.thomsonreuters.com to view archives and order custom League Tables https://www.thomsonone.com
11
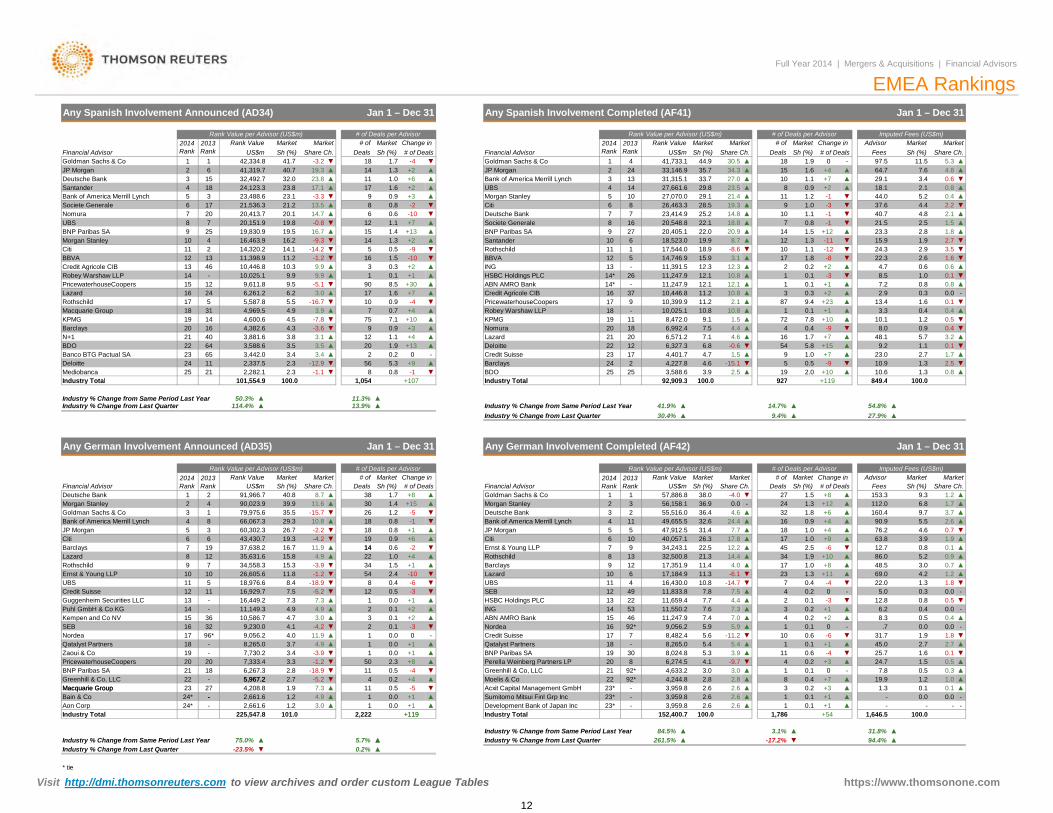
Morgan Stanley Santander
5.30.8
+9-1 BDO
568
1121
2,337.52,282.1 -1.1 ▼
▲▼ 1.3
9.4
+10
87+1 ▲
0.5▲
5.8
1
2.3 ▼-12.9
2.1
252
2.5
6524
01.920
23▲
2.3
3.53.121
-3.6 ▼3,881.640 ▲
20
3.53.8N+1
4,382.6Barclays
64
21.5
10,446.8
1817
1.59.110.8
19 8,472.0
▲
▲
14*
11.2
12.1
▲ ▲+1
1 ▼
0.331
0.10.1
+2
24.3
2.8
1.6
0.87.2
2.922.3
8.54.7
0.1
15.91.8
1.9 2.7▲23.3
-81.1
-1
-11-12
1.3
0.8
1.8
1.5
▼
1.2▲
▼▲
+12
-17
0.2
▲10.8
4
12.1
22
16
Credit SuisseDeloitte
NomuraKPMG
1017
▲12
18.8
15.9
22.0▲
19.9 8.7
3.1
20.9
Any Spanish Involvement Completed (AF41)
▲
2014 Rank
14
▲
US$m
▲
2-3
2.0
54
0.1
10.8
1.716
849 4
▲23.0
9.2
10.9▲ 10.6
▲
20
▲
▲
▲▲
-0.6 ▼
-
17
617,544.0
12
7.57.1
10.811.2
11,391.5
37
6,992.418
-11
10,399.99
+6
Morgan Stanley▲
JP MorganBank of America Merrill Lynch
▼▲
JP Morgan-4
Market
41.71 42,334.8
2014 Rank
10+4
▼4UBS 23.529.827,661.6
10
2
# of Deals per Advisor# ofMarketMarket
Share Ch.30.5
Any Spanish Involvement Announced (AD34)
11,247.9
1
7
27
26
29.128.5 19.3
53
20,548.8
4
8-10-2
▲
8
▲
▲
18.9 -8.6▲▼
22.1
- 12.3
1.31.4
9
915 ▲
3.9
6.2-5.13.0
10,025.1
▲
▲
▲▲
▲
▲
-9.314,320.2
16.2
4.53114
9.9
4
11,398.9
23
13
▲
9.9
19.5
46
▲
9.9
3.4
164,600.6
Banco BTG Pactual SA
194.3
4.918
BDO 22 3,588.6
Macquarie Group
3,442.0
Industry Total
3.4
Mediobanca2425
Deloitte
100 0
6,327.31.5
1
214.4
10
20
23,414.9
11,247.9
100 0101 554 9
Jan 1 – Dec 31
16
Share Ch.Market
Rank Value per Advisor (US$m)
32,492.719.3
Deals
# of Deals per Advisor
▼▲
32.0 ▲23.8 1.0
+3
+7
141117
6▼
Deutsche Bank
▲
BNP Paribas SA
Citi▼0.6
567
1 054
1
12
8.5
9-7.8 ▼
17
24133
1.6
0.5
Societe Generale
2+13
1.1
▲▼
▲
0.7710
+4
0.97.1
-4
Lazard
Barclays
▲
+4+3
+107
▲75
0.2 -
+10
▼
Societe Generale14.7
UBS
16,463.9
7Nomura
-0.8
5Citi
20.1
10,446.8 10.3
19,830.920,151.9
-1.2
14
12
18 24,123.3Bank of America Merrill Lynch
13.5620
21.223,488.6
7
SantanderDeutsche Bank
8
3 -3.3
40.7
23.1
41,319.7
5
215
Rank Value2013Rank
-3.2
3
Goldman Sachs & CoFinancial Advisor DealsFinancial Advisor
Market
▼1.71US$m
Full Year 2014 | Mergers & Acquisitions | Financial Advisors
Change in Rank Value per Advisor (US$m)
4
6
Sh (%)
1.3
# of
18Sh (%)
23.8 17.1
21,536.3
19.8+13
+2
8 0.8
16.71.1
0.9
14Credit Agricole CIB
BNP Paribas SA 910111213
Robey Warshaw LLP
KPMG
BBVA
Credit Agricole CIB
+1
Robey Warshaw LLP
24
4,969.5
9.5
0.9+7
PricewaterhouseCoopers6,261.2169,611.8 +30
Rothschild 17 5Lazard
90
▲
15 12
5,587.8 ▼
▼
5.5
▲-
0.3
ABN AMRO BankHSBC Holdings PLC
14*▲0.1
-16.7▲
PricewaterhouseCoopers▲1.6
131.5
+2
ING14,746.911.2 ▼
+2BBVA 12
11Rothschild▼
▲
-10-9
# of Deals
14.1
25
17
▼
▲
▼
▼
20,413.7
2 -14.2
+21.9Goldman Sachs & Co
33.7
2013Rank
34.333,146.9
Rank Value
▲
▲
25.2
Sh (%)
31,315.1 27.035.7
27,070.0
14.8▲
12.3
6,571.2
+7
16
21.4
44.9
26,463.3
1815
41,733.1
▼
+119
▼
-9
4.7
0.4▲
-99
▲▼
20,405.1
4,227.8
10,025.1
4.6
12.1
6.8
4.6
18,523.0
8.010.1
+23
▲+10
13.4
48.1
3.3
+15+7
0.40.4
100 0
2.5▲
1.3 ▼
▲
▲5.7
▲0.11.72.7
0.8
▼
▼
1.2
3.21.1
▼0.40.5
0.9
0.1 ▼
▲0.6
0.00.31.6
2.5
▼3.5
1.5
0.8
▼▼
2.6
4.8
11.5
3.4
37.6 4.440.7
44.02.2
FeesMarket
Jan 1 – Dec 31
Share Ch.
EMEA Rankings
▲
+2
▲
0.6
▲1.0
2.9
▼
▲
29.1▲
7.664.7
1.0
2.1
-
▲
▼▲
0.9
14
109 -3
11
1.11.0
▼▼
+2
▲0
8-1
1.1 ▲+7
5.2
MarketSh (%)
▲▼
97.54.8
▼0.6
0.418.1
Advisor
▲ 2.1 0.8
Imputed Fees (US$m)Change in
-▲
# of Deals▲
MarketSh (%)
5.3
72 7.8
1.6
Industry Total3,588.6 3.9
▼4,401.7
92792 909 3▲
519
-15.125
Ernst & Young LLP Lazard
Industry % Change from Same Period Last Year
-6
▲
0.10.6
0.2
1.0
# of Deals per Advisor
9.4%
161.8
+8
321.31.527
+1
2.5
1.01718
1
-14.7-6.1
0.1
7
0.23
1.0
3.7
100.0
5.3 3.9
+54
▼-17.2%
-
▼
84.5%▲
▲
11
1
7.8-
2.6▲
▼4,633.2 3.0
3,959.8
8
4
2.6
2.83
-9.7
▲
▲
5.4▼
7.7
5.4▲ 7
9,056.2
30
-
7.549
2.62.8
0.4
0.224
11
▼▼
4.1
0.1▼10
5.9
7.6
-11.2
▲5.97.0 4
1▲
▼▼
17
12.2
4.023
3445
55,516.0
▲7.7 ▲
▲
▲14.4
▲
524.4
4.6
47,912.5
▲
▲49,655.5
17.89
Goldman Sachs & Co
Deutsche BankMorgan Stanley
1123
31.4
-4.0-0.0
38.021 1
3
2.6
23*
▼
▼
BNP Paribas SA8
Moelis & Co
-
4,244.8
▲
6,274.5
2.62.6
2014 Rank
Industry % Change from Same Period Last Year
▲+111.3
0.9
▼
1.9
# of DealsChange in
849.4
48.5
+9
+12
+10
▲
▲-6
▲▼
-4 22.0▼
+6+4+4 ▲
+8
160.4
63.8
+2
▼+1
0
3.05.2
69.0
▼
▲
31.7-
AdvisorFees
▲
▲4.2
▲
12.7
4.6
0.8
153.3
76.2
0.46.28.3
▼
86.0
0.5
90.9▲
1.9.7
1.0
45.025.7 1.6
0.31.5
2.7
0.0
0+7
+3-4
+1
1.20.5
▲
▲
▲
19.9
24.7
▲
▲-
Market
40.8
2013Rank US$m
50.3%
2
Industry Total
Rank Value
▲
Any German Involvement Announced (AD35)
▲Industry % Change from Last Quarter
Rank Value per Advisor (US$m)
Industry % Change from Same Period Last Year114.4%
2014 Rank
1Financial AdvisorDeutsche Bank
Bank of America Merrill LynchGoldman Sachs & Co
2
Citi
4Morgan Stanley
5
91,966.739.9
79,975.643 35.5
81
29.3
90,023.9
15.3 -3.9
60,302.3
4.916.7
34,558.3
740,057.1
22-2
▲Ernst & Young LLP
+4▼
19 +6
8,265.0
▼
10
32,500.8▲
-4.2 ▼
1.0
Citi0.9
-5.6
46 7.4
17,351.917,184.9
11.4
8,482.4
7.8
▲3.0
▲
11.310.8
0.6
+31 ▲
▲0.4
0.10.1
1 0.1
-1,786
0.2
3.1%
▲
57,886.8US$m
100.0
21.322.5
41.9%
Sh (%)Rank Value
32.6
Rank Value per Advisor (US$m)
92*
92*
Industry % Change from Last Quarter
100.0101,554.9
Change in
+151.7
Market
1.4▲▲+8
# of DealsDeals
▼
JP Morgan
Sh (%)▲8.7
▼11
4
11.6
-1▲0.8
Greenhill & Co, LLC
23*
0.8
26,605.6
-1.2 ▼3.3
▼-18.9
4.0-4.2
-1.210
12-
18,976.611.8
8.457.5
13
10UBS 11
Lazard
7.3
15.819 37,638.27
Rothschild 798
10.8 ▲
Barclays
366,067.3
▼JP Morgan
▲
26.7
11.966 19.3
35,631.612
43,430.7
UBS
Barclays-10-6
▲2.40.4 1.3 ▼
0.50.3 -
1.8
0.80 -
▲ 0.1▲
▼0.05.00.2
3.0 3
12.8Puhl GmbH & Co KGGuggenheim Securities LLC
1436
▲4.47.3
PricewaterhouseCoopersZaoui & Co
-3
Nordea 17-
96* 9,056.29,230.0
4.9
Qatalyst Partners 18 8,265.0
Credit Suisse
SEB 1615Kempen and Co NV
32
1920
2.8
▼
-18.9
▲
20
11.94.9
7,333.4-3.9
+119
1
50
4▲
-5.2
4.9
2.7
-Bain & CoMacquarie Group
Aon Corp
221.9Macquarie Group
5,967.227--
2,661.624*
Greenhill & Co, LLC
225,547.8
7.3
▲
4,208.823
3.0
Industry % Change from Last Quarter75.0%
-23.5%
101.0
BNP Paribas SA 21
2,661.6Industry Total
4.7
6,267.35,967.2
1116,449.2
18
11,149.3
-
7,730.2-
▼
13.9%
3.4
-
4.110,586.7
16,929.7 -5.2
-15.7
Jan 1 – Dec 31
-5
▲
1,054
Market
▲11.3%
+107
Bank of America Merrill Lynch+1
SEB
Development Bank of Japan Inc▲
18
Perella Weinberg Partners LP
30
0.6
▲
0.02
14
34
1826 1.2
4.97.3
# of
-2.2 18
Sh (%)
▼
MarketShare Ch.
38
# of Deals per Advisor
0.5
+2
10.0
▲
2,222
10.0
11
▲
+1191▲ -
1,646.5
0.1
▲▲
0.00.1
-100.0
31.8%94.4%
▲
▲1.3
-0.0
0.0
▼▲
▲0.50.12.7
-▲0.4-
▼
1.80.0
+10.0 ▲
▲
0.0
261.5%
▲1.21.2
5.7%0.2%
▲
Sumitomo Mitsui Finl Grp Inc3,959.8+1
-
152,400.7Industry Total
▲
▼
Qatalyst Partners-
+1
Nordea
92*
+13,959.8
+8
-5
▲-4
▲+4
23*
+11
0.1
+1
▼2019
1.5
▲▲
10.1
-311,247.9
2.3
2▲
Rothschild
10
ABN AMRO Bank
54▼
▲
11,833.811,659.4
12
22
15
616,430.04
9
+119
▲27.9%54.8%
9.7112.0
3.7
▲
100.0
6.81.2
1.2 ▲
▲▲0.7
0.9
5.5▼
▲▲
▲
3.9
▲
1.90.72.6
0.1
▲
▲1.7
MarketImputed Fees (US$m)
9.3Sh (%) Share Ch.
Industry % Change from Same Period Last Year
24*
Market
Jan 1 – Dec 31
Industry Total
2013Rank
▲30.4%
MarketFinancial Advisor
Industry % Change from Last Quarter14.7%
▲▲
92792,909.3
▲
Sh (%)Market
Share Ch.# of
Deals
Any German Involvement Completed (AF42)
2456,158.136.436.9
12
26.3
13
634,243.1
128
▲
14
+1
▲-30.5
+2
▼
ING
17Credit Suisse016
▲
0.5
53
8,024.8
14 11,550.2
0.0 ▲
0.2▼ Acxit Capital Management GmbH
5
2122
13
8
HSBC Holdings PLC
* tie
https://www.thomsonone.com Visit http://dmi.thomsonreuters.com to view archives and order custom League Tables
12
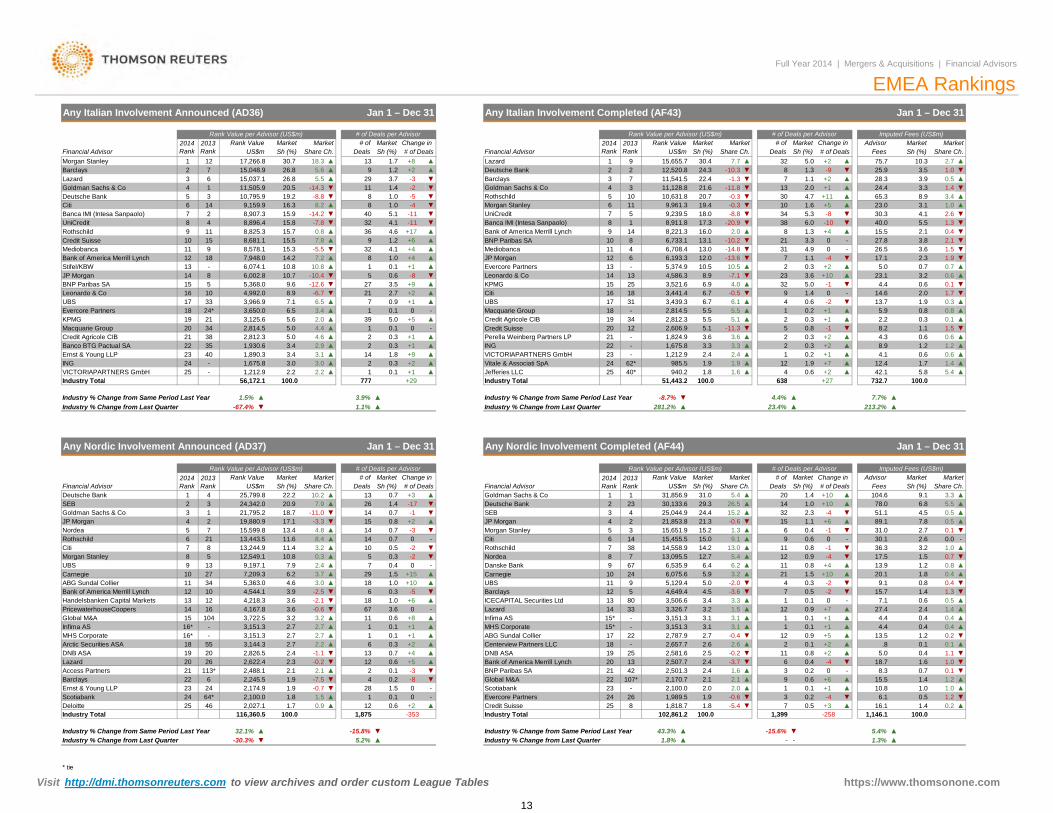
Credit Suisse BNP Paribas SA
Credit Suisse
▼
8.94.1
12.4 1.4
21
124
▲▲▲
+1+7+2
0.30.21.90.6
+2
▲▲
▲3.32.41.91.6
▲▲▲▲
241,212.9
985.5940.2
3.32.41.91.8
-
▲
UBS
--
3420
-
▲▼
8
ING
Change in
RothschildGoldman Sachs & Co
Leonardo & Co
▲
▲
Credit Agricole CIB
11
Bank of America Merrill Lynch
▼
Barclays-3▲
UniCredit
7
1,675.8
1.4-5
17.3▼▼
5Banca IMI (Intesa Sanpaolo)
9,961.3
▲+6
8,911.89,239.5
VICTORIAPARTNERS GmbH
7
8,221.3
Morgan Stanley
6,193.36,708.4
410,631.811,128.8
610
3,441.4
-11.33.6
31-0.5
2,606.9
51 443 2
13KPMGCiti 16
2223
23
0.3▼
+2
1.4 -
+1+1
▲
0.6
0.8
▼
Evercore Partners 5,374.9+10 ▲
-20
▼
10.5 ▲3.6
0.2
+14,586.3
12
▲8
9
6
10MediobancaJP Morgan
1
Market
16.3
5.5
15.815.7
+2
113.71.2
▼
3▲
▼1.0 5
-2 13
17
1425
▼-14.846,733.1
-
20.7
# of Deals per Advisor
US$m Sh (%)Market Market Market
Any Italian Involvement Announced (AD36)
Full Year 2014 | Mergers & Acquisitions | Financial Advisors
Fees
EMEA Rankings
Deals
100 0
Share Ch.
1.91.5 ▼
15.52.1
▼
▼
4.423.1
2.3
Sh (%)
Imputed Fees (US$m)
# of Deals
8.2
▲
42.1
0.61.7
0.7
4.3
5.0
2.0
3.2
▲
1.20.6
0.6
5.8
▲1.2
▼0.3
▼
0.80.1
Advisor
27.8
2.2▲0.8
0.6
▲
▼0.6
▲
2.1
▲1.9
17.126.5
-1
+2
10.3
5.9
1.5▲
1.1
▼3.63.8
0.3
▲0.1
+27
5.0
100 0
13.7
5.4
▲
▲
732 7
14.6
0.6
1.7
▲
0.7
▼8.9
1.4
-10
▲
▲
65.3
2.7Deals
0.3
2
638
3.3
▼
-7.1
1.3
Jan 1 – Dec 31
▼
Sh (%)
-0.318.0
▲
6.96.7
▲
2.0
12
Rank Value per Advisor (US$m)
-10.3
5.5
30.4
19
1.6
+4
▼
0.3▼
▼
-15.0
2
-10.2
Jan 1 – Dec 31
0.1
-5.5
10,795.9
2
0.3
0.314
2
15,037.1
1
8,907.3
5
▼▲▲
15.3▲
20.511,505.9
17,266.8
63Lazard
12
26.815,048.92
30.726.8
Morgan StanleyShare Ch.Sh (%)
Rank Value per Advisor (US$m)2014 Rank
Market2013Rank
Citi
1Deutsche Bank
9,159.9
Barclays
Financial Advisor
4
7
UniCredit
Goldman Sachs & Co
Rank Value
6 1427
Bank of America Merrill Lynch
8,896.4
159
8 4
8,578.1
Banca IMI (Intesa Sanpaolo)
JP Morgan
12
Rothschild
18
14Stifel/KBW
Mediobanca
9 1110
7.1
8,825.3
11
6,074.1
10 4,992.016
14.2
8,681.1
13
3,125.6
UBS 3,966.918Evercore Partners 3,650.017
5,368.015
24*
8
3.0
1920
3821
9.610.7
6.5
Industry Total
Banco BTG Pactual SA
Macquarie GroupCredit Agricole CIB
35Ernst & Young LLP
34
22
25
5
7.2
1,890.3
19.2
21
-6.7
5.6
- 10.8
8.9
1.8
▲
▲▲
▲
2,812.3
2.2
5.0
1,675.81,212.9
3.4
6.5Leonardo & Co
23
-VICTORIAPARTNERS GmbH-24ING
33
KPMG
10.8
15.9
2,814.5
1,930.6 3.4
-10.4-12.6
15.5
5.0
7.8
3
2
▼
Financial AdvisorSh (%)Market
1.7 +8
# of
-8.8
-14.24.1
5.613▲
8.2
▼▼
360.8 ▲
▲
-7.8 32
+9+2
81.08
3.5
18
0.6
4.1
▼
▲
▼
0.1
39
7
5
0.3
▼ 21
0+55.0
▲
+9
12
▲
0.9
0.1
+2
+1
▲
▲▲
+1 ▲
▲
-
Industry Total
1,824.95.1
▲
62*40*
Perella Weinberg Partners LP
Vitale & Associati SpAJefferies LLC
3.6
25
21
1
2,812.35.5 1Macquarie Group 2,814.518 -
+1
5
777
▲
6.7
10.5
▲5.5
183,521.6 4.0
8.9
5.1
5.3
13.1
-8.8
▲2
31
16.0
12.0
6.1
13
6.0
▼
14 1.3
13.0
821
7-13.6
3,439.3
15 ▲
4
329
11
▼+5
5.5
+11
28.3▲
-8
+1
23.0▲
1.03.4
40.0
3.14.1
30
▼-9
24.4
1.03.9 0.53.5▼
▲
▲
▼▲ 0.4
1.32.6
▼30.3▼
▲
▲
▲3.4
2.9
0.11
100 0
4.42.0
4.6
2.23.03.1
56 172 1 +29
▲1.0
32
0
27
+1
+4+4
▲
▲
1.29
-8
2.7
12,520.8
4.6 +17
-0.3
-20.9
103440
-11
▼▼
▼▼
19.4
21.6
5.1
11,541.5▼
22.4
MarketMarket
4.7
75.7
-41.1
0--3.3
04.9▼
+2
-1.3
7.7 ▲24.3
+2725.98
Share Ch.
38
1.1
32
Any Italian Involvement Completed (AF43)
2.0
# of
-11
▼-11.8
▲ 2
-14.3
929 ▼
-4
▲
# of Deals per Advisor
Lazard 15,655.718.3US$m
Change in Rank Value2014 Rank
6,002.8
7,948.0
40
BNP Paribas SA
3
2013Rank
9# of Deals
Deutsche Bank1
Carnegie Carnegie
▼
▲
▲
428
▲1
8.4
0.3 57
3.2▲
▼
▲
▼
51,443.2
186
78.0
2.7
3.6
2.3
▲
-1.1
▲▲
3.03.7
▲
-2.1
0
Sh (%)
JP Morgan
-
-2
2.4
▲
213.2%
1
13
6.8
7.8
+10 ▲
▲
1.4
13
Goldman Sachs & CoJP Morgan
13,244.912,549.15
Citi
41
Morgan Stanley
21
113*
1955
Nordea
UBS
ABG Sundal Collier
16*
20
12
14
62,174.924
22
Industry % Change from Same Period Last Year
5,363.0
9
Handelsbanken Capital MarketsPricewaterhouseCoopers
Bank of America Merrill Lynch
2,622.4
MHS Corporate
Deutsche Bank
7Rothschild
2.7 2.7
2SEB 3
2013Rank
8
23
1 4
65 7
6.2
3,151.3
9,197.1 7.9
2.73,722.5 3.2
4,544.14.6
3,151.3
-2.5
1612
104
3.94,218.34,167.8
1013
Global M&A
Arctic Securities ASA16*18
-
Ernst & Young LLPBarclays
Scotiabank
DNB ASALazard
15Infima AS
21
23
DeloitteIndustry Total
Industry % Change from Last Quarter
Access Partners20 26
1,875
24 64*2,027.1
116,360.525
2,245.5
2,100.0+2
0
-353
1.50
▲
0.612▲
4.5
▼14▲
25,044.9 32
22
21,853.8
11
21.3
▲
0.1
100.0
3.3104.6
Advisor Market
▼
0.8
▲
Share Ch.▲
5.5
▲
▲0.50.5
0.01.03.2
0.12.7
▲
1.30.5
1.4
0.7
0.40.8
0.4 ▲
▲1.42.4
▼
0.6
▼
0.1
1.2
▲
1.2
0.1
▲0.2
+27
Jan 1 – Dec 31
0.7
▼
15.5
9.1
▲
100.0
Imputed Fees (US$m)Market
Sh (%)
▲7.7%
# of Deals
# of Deals per Advisor
732.7
23.4%
# of
638
▲
-4
1
12
▼
89.1
1US$m
▲
30,133.6
281.2%
Rank Value
9
8
+10
▲
5
▼
15.215,455.5
5,129.4 5.0
5.4
15,651.96
14,558.9
6,075.66,535.9
13,095.5
5.9
+63
0.6-1
9
2-11.3 6
1.14.5
▲
36.3
▼-▼
31.0
1.8
1.5
2.6 -
0.4
30.1
7.115.7 ▼
1.2
9.120.1
▼
1.6
15.2▲-0.6
3.2
11
12
51.1
4-2.0
▲
0.1
1.0
▲
▲
▼
▼1.01.1
▲
1.4+3 16.1100.01,146.1
▲
1.3%
0.510.8
▲
6.11.0
▲
1.5
2
-▼-0.7
-7.5
1.7 0.9
▼
2.2
1.9
2.1
2.7
2.1
23
▲
Rothschild▼
-0.2
1.0
Industry % Change from Same Period Last Year
▼
Nordea
1.4 -17+3
4
20.7
Deutsche Bank0.7
SEB 3
6.4
31.0
-8.7%Industry % Change from Same Period Last Year
Goldman Sachs & Co
Industry % Change from Last Quarter
Financial Advisor31,856.9
Sh (%)
100.7
▼▲+2
-314-▼
▲
1.9
15
▼ 0.7
1 0.16 0.3
26
12
11.6
▲
1.0
11
0.3
▼-0.63.6
2.4
13,443.5
8
15,599.8
11.4
1011 34
7,209.327
10.8
2,826.5
-
▼
24,342.021,795.2
13.4
▼-11.07.9
19,880.918.7
▲
13Deals
17.1
20.9
Sh (%)10.2 ▲
Sh (%)# of
Share Ch.
Industry Total
Financial Advisor
Industry % Change from Last Quarter
2014 Rank
Any Nordic Involvement Announced (AD37)
Industry % Change from Same Period Last Year
25,799.8 22.2
Market
▲
3,144.3
US$m
-3.34.8
3.2
▼
▲
0.2
▲0.1
46
5.4%
100.0
42107*
3
32.1% 43.3%▲1.8%
-15.8% ▼Industry % Change from Last Quarter
1867
▲
1.8
-30.3%
0.30.5
-5
14
29
0.70.8
14
+10+15
-3
▲
5.2%▼
Morgan StanleyCiti
1.50-2
2,488.1Bank of America Merrill Lynch
▲
0.6▼
24677
14387
24.4
14.2
▲
3.4
18 -17
33
22
4
0.4
20
9
13
+5
10
+1
0.6
UBS▲
-1
▲
+6
DNB ASA
▲
+8
▲
▼
ICECAPITAL Securities Ltd
ABG Sundal Collier
29.3▲
▲▲
Rank Value per Advisor (US$m)Rank Value
▼
# of Deals FeesDealsChange in 2014
RankMarket
Any Nordic Involvement Completed (AF44)
4.4%
# of Deals per Advisor
1.1%
Rank Value per Advisor (US$m)
▲
Market
Industry Total
MarketMarket2013Rank Share Ch.
777
Market
100.056,172.1
▲-67.4%
Jan 1 – Dec 31
Change in
+29
1.5% 3.9%▼
2324
▼-0.4
2,507.7
2.6
2,501.3
8
2,657.7
132.4
-3.7
2.3
2026.5
0.4
▲
5.4
15
▲1.01.4
▼
-0-3.6 ▼
▲ 0.171
-23.33,506.6
Infima AS
▲3.6 0 14
80-
▲
Lazard 3,326.7
2.72.6 2
2,787.93.1
Centerview Partners LLC
15*
▲
.8
▲▲
▲+2
0.90.1
+7
▲13.5
27.4
▼0.24.4 0.4
1.2
4.40.4
0.40.9
3.1 0.1▲
2.5
MHS Corporate 0.13,151.3-
19 0.425 2,581.6 5.011▲
0.8 +2▼-0.2 ▲-4
▲ 0.2 8.3▼ 6 18.7
0▼
2,100.00.62,170.7 2.1
1.6
30.1
1,989.57
1.9
2.4
▲▲
0.4
▼
2.0
0.5
-
0.2 ▼
2.12.0 ▲
+6
-4+1
▲
26 -0.6-5.41,818.7 1.8
▼
-258
-15.6%
Industry Total 102,861.2 1,399100.0
▲
+1
+2
▲
▲
+4
-8-
Evercore PartnersCredit Suisse
Scotiabank
25
Danske Bank
BNP Paribas SA 21Global M&A
Barclays 4,649.412 5
0.1
-▼
12
1.5
19
11▼
▼
1
21
15.0 ▲
-4
00.8
9.1
0.913.0
-2
13.917.5
+4 ▲
0.30.5
6.2 ▲▲
+10
-
1.5 ▲
12.70.8
+1+1
+51
▼
3.23.13.13,151.3
-
15*-
Visit http://dmi.thomsonreuters.com to view archives and order custom League Tables https://www.thomsonone.com * tie
13
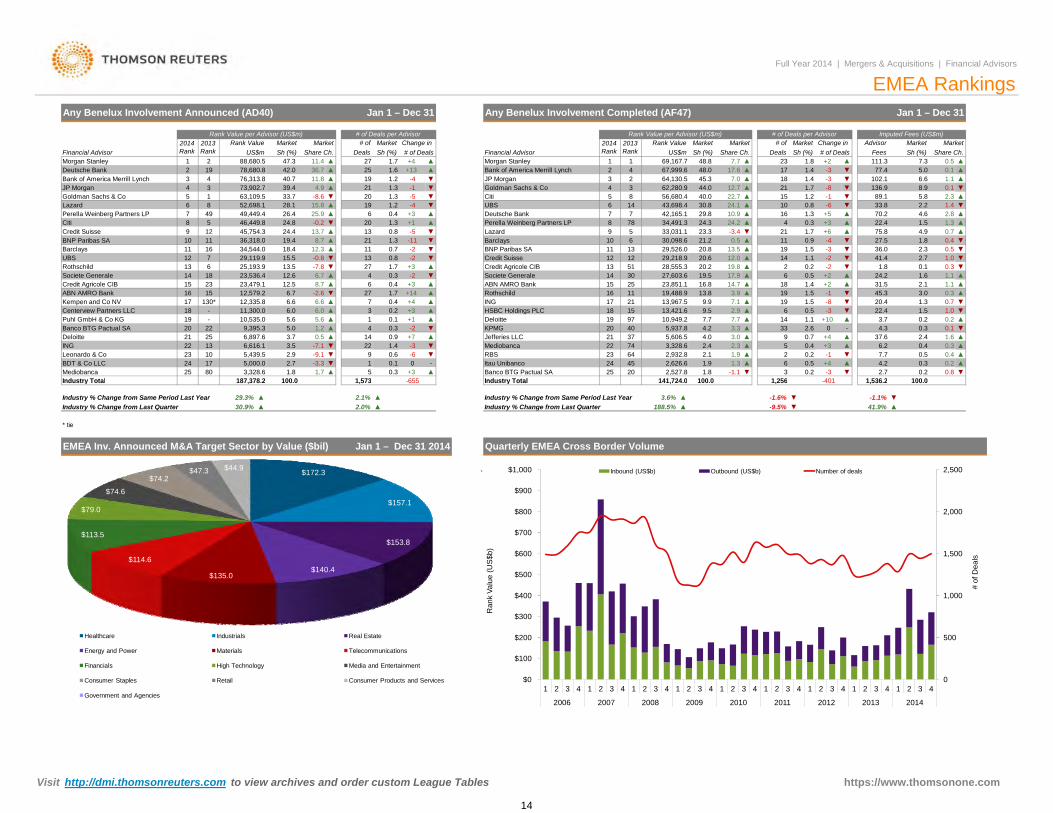
BNP Paribas SA Barclays▲
6▲
▼ 27▼ 13
1127.5
6,897.6
45,754.3
6.06.6
1.7
1.2 -1-6
+5+3
15.5
24.4
6.7
1.8
2.7
ING
-2.68.7
19.4
5.6
-7.1
18.4
13.5
6,616.1
-
12,579.2
6.0
Mediobanca
-7.8
BDT & Co LLC
Centerview Partners LLC
1.8
-9.1
12.6
5.09,395.3
130*
1321
3.55,439.5
3.7
5.610,535.0
23,479.1
12,335.8
2.9
12.5
8017
23
23,536.4
25
25
11,300.0-
23
22
24
Rothschild7
Societe GeneraleCredit Agricole CIB
Kempen and Co NV15
Banco BTG Pactual SA
22
18
Deloitte
Industry Total
10
20
Leonardo & Co
19
Barclays
18
17
Puhl GmbH & Co KG
1516ABN AMRO Bank
61211
Credit Suisse
Goldman Sachs & Co
6.7
34,544.0UBS
14
36,318.012
7
16
13 25,193.929,119.9
119
CitiPerella Weinberg Partners LP
-0.8
▲
49,449.4
Financial Advisor2013Rank
10
6 19
13.7 1321
5
498 5 46,449.8
4
52,698.1
76,313.8
63,109.53
Lazard
Morgan Stanley
73,902.74Bank of America Merrill Lynch
78,680.8
JP Morgan1
1.7
1.3
▲+3
▼
▼
-5
-20.8
Goldman Sachs & Co
UBS
+13
# of Deals1.7 +4
▼
1.31.21.6
-4
12.3 ▲
0.4
▼▼
# of
33,031.1Lazard
42,165.1▲
7
8
34,491.3
Citi
▲Perella Weinberg Partners LP
-1
Deutsche Bank
4
▲+3
-5
Market
7
29,526.0
9
▼10
▼
0.7-11-2
6.6
Market
▲
3
14
8.9
0.81.3
2
▲
1.0
24.2
3.0
1.3
▼4.9 ▲
0.4
4.6
-
▼
▲▲
▼
41.4
4.3
1.5
0.3
22.4
▼1.3▼
0.2-3
3.7 0.21.0
0.320.4
31.5▲
0.12.7
1.8
2.336.0▼
-4-3
▼
0.7▼
▼▼
1.6
2.2
Share Ch.Sh (%)
5.8
Market
102.1
2.333.8
136.989.1
2.4
▼
▼
0.1
▼
▲1.4
45.3
▲
+6
7.3 0.5
AdvisorFees
Full Year 2014 | Mergers & Acquisitions | Financial Advisors
8-8.6 20
12.7
▼43,698.4
21 ▼▲
30.8
▲
▲1.5
140.219.8
1819
70.2
75.822.4
1.1
0.5
1.10.3
2.1
1.52.8
▼
▲
▼
▼▲
0.7
▲
▼▲
0.1
▼7
▲27
0.3 ▼
+140.4
-2
1 ▲
▲
16.8 +2
-80.4▲
▲
▲
3,328.6
6.6▲
4▲
3
1
▲▲
22
1 573187 378 2
5,000.0 -▲ 5
-3.31.7
9▼
-60.1▼
+3
▼0
0.3
-20.3+7
64
+10.2
+31.7
+4
Industry Total
Mediobanca5,606.5
Itau Unibanco
5,937.8KPMG
23
97
▲3.3
7.7▲
HSBC Holdings PLC+3ING
9.513,967.5 9.919,488.9
3.0
Rothschild
4.0
RBS
213,328.674
Deloitte 1940
45
15
2116
37
10,949.2
1713,421.6
11
2264
20
2,626.6
1518
202524
28,555.330
20.2
2519.527,603.6
ABN AMRO BankSociete Generale
20.813
15.8 1.2
-0.2 1.35
▼BNP Paribas SA
6-4
8.7
+1
▼▲
25.9
1.3
253
47.3
24.8
Deals
11
40.74.9
28.133.7
▲
39.411.8
20 8
42.0
Sh (%)11.4
▲
Share Ch.Market
▲19
88,680.521
319
Rank Value per Advisor (US$m)
36.71Morgan Stanley27▲
Rank ValueUS$m
EMEA Rankings
Sh (%)
2
# of Deals per Advisor
Jan 1 – Dec 31Any Benelux Involvement Announced (AD40)
Deutsche Bank
2014 Rank Financial Advisor
655
0.5
5.0▼▲
▼
111.377.4
▲
1.1▲0.1
Market# of Deals per Advisor
Any Benelux Involvement Completed (AF47)
Change in
Jan 1 – Dec 31
2013Rank US$m
Rank Value per Advisor (US$m)Market
Imputed Fees (US$m)
23Sh (%)
Rank Value MarketShare Ch.
69,167.7 48.8Deals # of DealsSh (%)
▲▲ 1.8
21.2
24.3
45.3
29.8
44.0
67,999.6
62,280.9
4 48.064,130.5
0.7
7810.9
1817.6
+10
+42.61.1
33 014
▲ 37.6 ▲
0.2
-10.4
+4 4.2
▲
▲
1.65 0.42.4
0.50.2
1.9 1.3
90.3
▼0.2 0.8
0.4 ▲0.2
0.50.3
6.2▼2.1
141 724 0-1.1
▲ +3 ▲
-3
2
1 25636
1.8
▲1.9
Banco BTG Pactual SA▲100 0401100 0 1 536 2
▼
2,932.8
2.7▼▲▲
7.7
2,527.8
26.4
1.2 4.2
0.6
▼0.1
Credit Agricole CIB
▼
30,098.6
▼
100 0
13.8
20.6
40.05 56,680.4
6
29,218.9
23.3
12 12Credit Suisse
145113
0.8
▲-3
14
▼
Bank of America Merrill Lynch
1.4
▲
0.9
▲
Market Change in
JP Morgan
▲▲ 2
2014 Rank
1
▲17.9
▲11 0.9
▲
+2
▼
1624.2
-2
▲
▲
0.51.5
▲
22.7▲
7.7
▲7.0
24.1
21
-8
+2
21.1
-3
4
21
19
-3
▲
17
▲10
1.4
▲
3.9
12.0
# of
-3.4
15
23,851.1
▲
1.4-11.5
Jefferies LLC
0.3
7.1
7.7
14.7
2.3
1.71.4
13.5
2.9▲
▲
▲0.56
-2
0.5619
EMEA Inv. Announced M&A Target Sector by Value ($bil)
Industry Total 1,573187,378.2
▲
Industry Total
Industry % Change from Last Quarter29.3%30.9% 2.0% 41.9%
-655
▲
* tie
Industry % Change from Same Period Last Year ▲
141,724.0
3.6%
1,256
▼2.1% Industry % Change from Same Period Last Year
Jan 1 – Dec 31 2014
▲ Industry % Change from Last Quarter▼
▲ -9.5%
100.0
-1.1%▼
▲
-401100.0
-1.6%
1,536.2100.0
Quarterly EMEA Cross Border Volume
188.5% ▲
$172.3
$157.1
$153.8
$140.4$135.0
$114.6
$113.5
$79.0
$74.6
$74.2$47.3 $44.9
Healthcare Industrials Real Estate
Energy and Power Materials Telecommunications
Financials High Technology Media and Entertainment
Consumer Staples Retail Consumer Products and Services
Government and Agencies
`
0
500
1,000
1,500
2,000
2,500
$0
$100
$200
$300
$400
$500
$600
$700
$800
$900
$1,000
1 2 3 4 1 2 3 4 1 2 3 4 1 2 3 4 1 2 3 4 1 2 3 4 1 2 3 4 1 2 3 4 1 2 3 4
2006 2007 2008 2009 2010 2011 2012 2013 2014
# of
Dea
ls
Ran
k Va
lue
(US
$b)
Inbound (US$b) Outbound (US$b) Number of deals
Visit http://dmi.thomsonreuters.com to view archives and order custom League Tables https://www.thomsonone.com
14
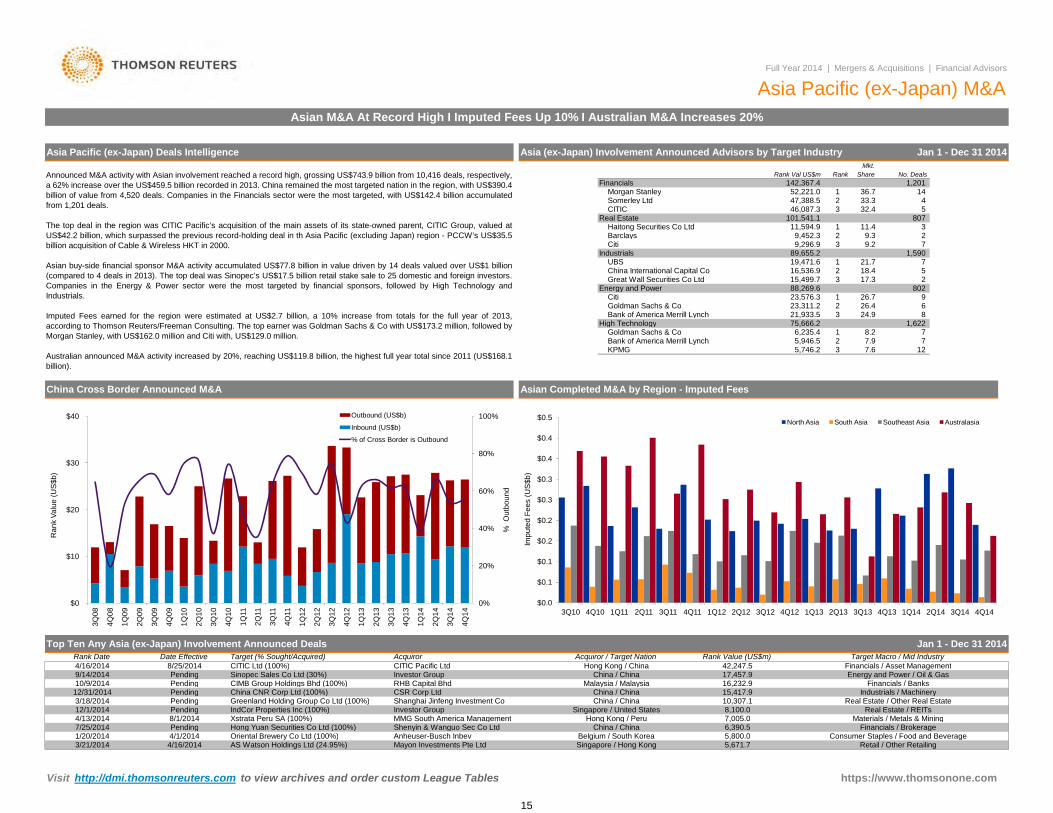
26.4Citi
23,311.2
Energy and Power
11,594.9 11.4
21.7
Haitong Securities Co Ltd9,452.3
Jan 1 - Dec 31 2014
6
5
9.2
Goldman Sachs & Co
14
32.4
3
4
29
17.3
24.9
7
2
KPMG
8
Bank of America Merrill Lynch
26.7
7
3
1,590
29.3
18.4
807 1
2
1,622
802
Announced M&A activity with Asian involvement reached a record high, grossing US$743.9 billion from 10,416 deals, respectively,a 62% increase over the US$459.5 billion recorded in 2013. China remained the most targeted nation in the region, with US$390.4billion of value from 4,520 deals. Companies in the Financials sector were the most targeted, with US$142.4 billion accumulatedfrom 1,201 deals.
The top deal in the region was CITIC Pacific’s acquisition of the main assets of its state-owned parent, CITIC Group, valued atUS$42.2 billion, which surpassed the previous record-holding deal in th Asia Pacific (excluding Japan) region - PCCW’s US$35.5billion acquisition of Cable & Wireless HKT in 2000.
Asian buy-side financial sponsor M&A activity accumulated US$77.8 billion in value driven by 14 deals valued over US$1 billion(compared to 4 deals in 2013). The top deal was Sinopec’s US$17.5 billion retail stake sale to 25 domestic and foreign investors.Companies in the Energy & Power sector were the most targeted by financial sponsors, followed by High Technology andIndustrials.
Imputed Fees earned for the region were estimated at US$2.7 billion, a 10% increase from totals for the full year of 2013,according to Thomson Reuters/Freeman Consulting. The top earner was Goldman Sachs & Co with US$173.2 million, followed byMorgan Stanley, with US$162.0 million and Citi with, US$129.0 million.
Australian announced M&A activity increased by 20%, reaching US$119.8 billion, the highest full year total since 2011 (US$168.1billion).
33.3
15,499.7
Asia Pacific (ex-Japan) Deals Intelligence Asia (ex-Japan) Involvement Announced Advisors by Target Industry
7.6
Goldman Sachs & Co
2
Barclays
89,655.2 Industrials39,296.9 Citi
Bank of America Merrill LynchHigh Technology
5101,541.1
46,087.3 47,388.5 Somerley Ltd
Morgan StanleyFinancials 1,201
No. Deals
52,221.0 1
Rank Val US$m142,367.4
ShareMkt.
Rank
36.7
2
2
Real Estate3CITIC
3
16,536.9
321,933.5
88,269.6 23,576.3
5,946.5
UBS 1
Great Wall Securities Co Ltd
1
5,746.2 7
China International Capital Co
1 76,235.4 75,666.2
12
Asian M&A At Record High I Imputed Fees Up 10% I Australian M&A Increases 20%
19,471.6
Full Year 2014 | Mergers & Acquisitions | Financial Advisors
Asia Pacific (ex-Japan) M&A
8.27.9
Pending Greenland Holding Group Co Ltd (100%) Real Estate / Other Real Estate
Acquiror / Target Nation
Singapore / United States
China / China
Jan 1 - Dec 31 2014
Hong Kong / ChinaEnergy and Power / Oil & Gas
Top Ten Any Asia (ex-Japan) Involvement Announced Deals
CITIC Ltd (100%)Acquiror
8/25/2014
Asian Completed M&A by Region - Imputed Fees
Financials / Banks
8,100.0
15,417.9China / ChinaShanghai Jinfeng Investment Co
Malaysia / Malaysia 16,232.9
10,307.1Real Estate / REITs
Industrials / Machinery
Hong Yuan Securities Co Ltd (100%) Shenyin & Wanguo Sec Co Ltd Financials / Brokerage
Pending IndCor Properties Inc (100%)3/18/2014
7/25/2014
12/1/2014
Pending
Pending10/9/2014 Pending
Pending
CITIC Pacific Ltd
4/13/2014 8/1/2014
9/14/2014RHB Capital BhdCIMB Group Holdings Bhd (100%)
42,247.54/16/2014
China Cross Border Announced M&A
12/31/2014 China CNR Corp Ltd (100%)
Sinopec Sales Co Ltd (30%) China / China
Rank Date Date Effective Target (% Sought/Acquired) Target Macro / Mid IndustryRank Value (US$m)
Xstrata Peru SA (100%)
Financials / Asset Management
6,390.5MMG South America Management
CSR Corp Ltd China / China
Investor Group
7,005.0
17,457.9
Investor GroupHong Kong / Peru Materials / Metals & Mining
1/20/2014 4/1/2014 Oriental Brewery Co Ltd (100%) Anheuser-Busch Inbev Belgium / South Korea 5,800.0 Consumer Staples / Food and Beverage4/16/2014 AS Watson Holdings Ltd (24.95%) Mayon Investments Pte Ltd Singapore / Hong Kong 5,671.7 Retail / Other Retailing3/21/2014
0%
20%
40%
60%
80%
100%
$0
$10
$20
$30
$40
3Q08
4Q08
1Q09
2Q09
3Q09
4Q09
1Q10
2Q10
3Q10
4Q10
1Q11
2Q11
3Q11
4Q11
1Q12
2Q12
3Q12
4Q12
1Q13
2Q13
3Q13
4Q13
1Q14
2Q14
3Q14
4Q14
% O
utbo
und
Ran
k Va
lue
(US
$b)
Outbound (US$b)
Inbound (US$b)
% of Cross Border is Outbound
$0.0
$0.1
$0.1
$0.2
$0.2
$0.3
$0.3
$0.4
$0.4
$0.5
3Q10 4Q10 1Q11 2Q11 3Q11 4Q11 1Q12 2Q12 3Q12 4Q12 1Q13 2Q13 3Q13 4Q13 1Q14 2Q14 3Q14 4Q14
Impu
ted
Fees
(US
$b)
North Asia South Asia Southeast Asia Australasia
https://www.thomsonone.com Visit http://dmi.thomsonreuters.com to view archives and order custom League Tables
15
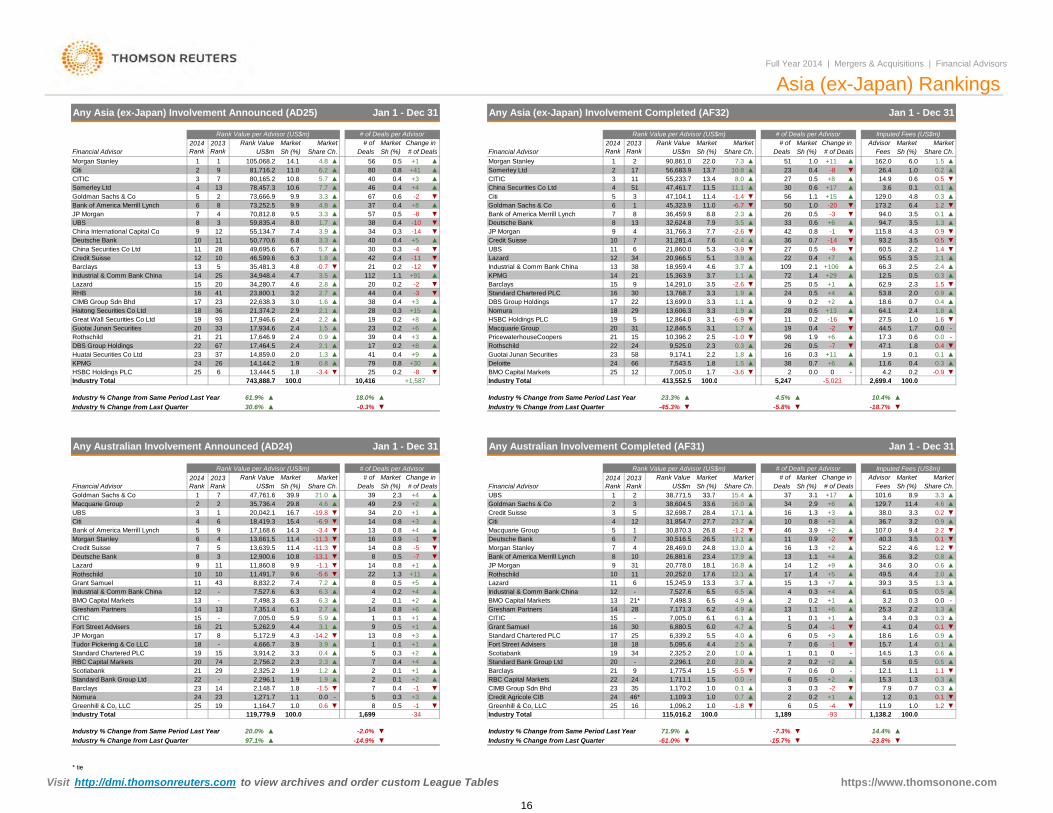
Deutsche Bank Credit Suisse
Full Year 2014 | Mergers & Acquisitions | Financial Advisors
11.6 0.3
Asia (ex-Japan) Rankings
HSBC Holdings PLC
Jan 1 - Dec 31Any Asia (ex-Japan) Involvement Announced (AD25)
25 6 13,444.5 1.8 BMO Capital Markets 12 -7,005.0 ▼0.2 -0.920.4▲
0.05 023100 0
▲ 38 +6 ▲Deloitte025
0.71.81.7 4.2▼-3.6
160.41.524+30791.8
DBS Group Holdings 22 67 17,464.5
0.8▲
▲0.81.9KPMG14,859.0
24 26 14,144.2Guotai Junan Securities
6641
0.2▲0.1+11Huatai Securities Co Ltd 23 37 0.1▲ 1.9▼-7 ▼ 47.1 1.89,525.0 2.3 26 0.4
17.3
23 ▲2.2+9 9,174.1 0.3▲
2.50.5
-44.5-1.0 -▼ 98 1.9 +6
▼0.00.60.9 ▲
▲ Macquarie Group▲PricewaterhouseCoopers
31▲10,396.2
1.7 0.019▼ 11▲ 0.4
0.2 ▼-2Guotai Junan Securities 20 33 17,934.6 2.4
0.2Great Wall Securities Co Ltd 17,946.6 ▲2.41.82.4
1.0-1619 9321,374.2 Nomura2.9 2.1 3.313,606.3 1.9
HSBC Holdings PLC 5+8 3.1 ▼27.5 1.6▲0.50.3 29
-6.9▲+15
CIMB Group Sdn Bhd 1764.1+1318Haitong Securities Co Ltd
22,638.3 3.0 1.636
0.2+3▲▲ 28
17 +213,699.0▲ 18
-2.6 ▼
▲▲3.33.3 1.1
2.0▲ 18.6 0.40.79
53.8+40.2 9
300.4 1.9▲ 2.3 1.5
RHB 16 41 23,800.1 3.2 2416 ▲ 0.50.5
1.1 ▲ 0.312.5+291.4 0.5 ▲7262.9+1
0.9 ▲25
▲▼
▲Lazard 15 20 34,280.7 2.8 ▲4.6Industrial & Comm Bank China 14
2.4 ▲12 34 20,966.5 5.1 3.9
2.5Credit Suisse
▼ 21 0.2 109 2.10.4 -11 ▼ Lazard 3.5
+9125 34,948.4
▲5 35,481.3
4.7 3.5
6.3
▲
12 10 46,599.6 2.13.7 ▲ +106 ▲13 ▼ 66.3
▲4.6
0.4▼ 27 0.5 -9
18,959.4▲+7 ▲ 95.5
▼5.322
1.4 ▼60.5▼3.5▼ 93.2
0.3China Securities Co Ltd 11 -3.9628 2.27
UBS6.7 ▼10 11 50,770.6 6.8 3.3
4.3 0.90.8 -1 ▼▲ 0.7▼
0.536 -14-2.6
31,281.4▲ 10 7.6 0.47.7
UBS 8China International Capital Co 9 12
+5
3 59,835.455,134.7
0.4115.87.4 34 4JP Morgan 90.3 -14 31,766.3 42
Deutsche Bank38▲3.9
7.932,624.8▼
▲3.5 ▲ 33 3.5 1.3▼
0.6 +6 ▲ 94.7▲-3 ▼ 94.0 0.13.536,459.9Bank of America Merrill Lynch 7
130.5
80.4 -10 ▼2.3 ▲
50 1.00.5268.8
▼▼-6.7 173.2129.056 ▲▼-1.4
-8
▲1.1 +156.4 1.24.8 0.3
▼-20JP Morgan 4 70,812.8 9.5
45,323.98
6+837 0.47
67 0.611.0
5 47,104.1 11.4Goldman Sachs & Co 1
3Goldman Sachs & Co 5 2 73,666.9 9.9+1730 0.651 47,461.7
▲4.8 ▲
43.3 -2
China Securities Co LtdCiti▼
▲ 0.13.6▲▲1110.8 ▲
465.77.7 0.4 +4
3▲11.1 0.1▲ 11.5▼▲+8 0.5▲0.20.4 -8 ▼ 26.4 1.0
13.456,683.9
0.5 0.62755,233.7 8.0▲
14.9▲
1.0▲26.24.8 0.556
177.3
▲ 2Somerley Ltd 13.7 10.8 23
US$m2014 Rank
2013 Rank Sh (%) Deals
Morgan Stanley 1 1 105,068.2 5122.090,861.01 ▲
MarketChange in Advisor
▲6.0 1.5162.0+11Share Ch.
# of Deals per Advisor
Deals Sh (%)Market
Financial AdvisorChange in # of Deals
# of Rank ValueShare Ch. Sh (%)
MarketUS$m
MarketMarket Market# of Deals FeesSh (%)
Market
11.0
Financial Advisor Sh (%)14.1 ▲
▲
# ofRank Value per Advisor (US$m)
MarketShare Ch.
Citi
3.7
80
9.93.3 57
▼3.520
19
1.1 14BarclaysKPMG
14,291.0
28
CITIC 3 7 80,165.2
▲ +10.8
Morgan Stanley
Imputed Fees (US$m)
▲
10.6
Bank of America Merrill Lynch 6
78,457.3
Rank Value per Advisor (US$m)2014 Rank
2013 Rank
Rank Value
Rothschild
Barclays -124.8▲
2 9 81,716.2 +41
-0.7
Any Asia (ex-Japan) Involvement Completed (AF32) Jan 1 - Dec 31
# of Deals per Advisor
8
Somerley Ltd 4 13
73,252.5
5.7 ▲49,695.6
0.20.4
442.70.438
2.21.7
17
3.1+6
▲ 0.339
12,846.5
+8 24
13,768.7
▲58
DBS Group Holdings▲
19
▲
▲
+3 ▲ CITIC40
12,864.0
11-430 21,860.0
0.4
23
42
0.2▼+1 587100 0
▼
23
21 21
40
-3
▲
17,646.9
-8 ▼25
1.5
1.8
112
2.4
▲
8.0
▲
▲1.7
▲
2.1▲2.0 1.3
-3.4
2.4
-2
+3
15
Industrial & Comm Bank China
22Rothschild
Industry Total
Standard Chartered PLC
38
▼
▲2021
22
15
15,363.913
21
413 552 5
7,543.5
10 416 5 247 2 699 4 100 0Industry Total 743 888 7
Rothschild Rothschild
Sh (%)
▲61.9%
+447,761.6 ▲
+2
Rank Value
Industry % Change from Last Quarter
6
Goldman Sachs & Co 1 7US$m
1
24.8
Rank Value per Advisor (US$m)Rank Value
Financial Advisor
▲
Rank Value per Advisor (US$m)
US$m
10
Credit Suisse
3
6
Citi5
UBS4
Morgan Stanley
9
6.5
12.1
Macquarie Group 2
-
2
9
1
4
436.5
15,245.9
13.0
-14.2 130.5
▼▲
0.89
109.620,778.031
6-
20,252.0▼
10.8
7.4
-1.1▼
▼
▲-5.67.2
9
3.713.3+522
0.8 16.8
-1.230,516.5
4
17.6
10
26.5
18.1
# of
37
13
1046
0.9
3.1
3.9
16
34
Change in MarketShare Ch.
▲Fees# of Deals Sh (%)101.6
Advisor
+17
▼
# of Deals per Advisor
-5.8%
Share Ch.
Imputed Fees (US$m)
DealsMarketSh (%)
2014 Rank
MarketMarket2013 Rank
23.3% ▲
Jan 1 - Dec 31
-18.7%▼
Any Australian Involvement Completed (AF31)
▼▲
Industry % Change from Last Quarter
▲38.01.3
+6 129.72.9▲+3
▲4.6▲3.38.9
Market
11.4
▲10.4%4.5%
-5,023100.0
0.12,148.7 1.8
1.0
▲
0.61.1 -
-1.5
25
20.0%Industry % Change from Last Quarter
Industry Total
▲
8,832.2
50.4
Industrial & Comm Bank China 12
Greenhill & Co, LLC
14Gresham PartnersBMO Capital Markets
Standard Bank Group Ltd
CITIC
Tudor Pickering & Co LLCJP Morgan
Industry % Change from Same Period Last Year
119,779.9
24 1,271.714
1,164.7
1.923
2,296.1
100.0
Barclays
Industry % Change from Same Period Last Year
4.6 ▲2.32.9
18.0%
29.839.9 ▲
# of
+1,587
-0.3%
100.0
39
Change in
▼
2014 Rank
2013 Rank
MarketSh (%)
Jan 1 - Dec 31
MarketDealsSh (%)
30.6% ▲
2.049
# of Deals
# of Deals per Advisor
Share Ch.21.0
16.7
Any Australian Involvement Announced (AD24)
34+2 ▲
Market
Grant Samuel 11
Bank of America Merrill Lynch
1413
6.16.3-
5
10Lazard
12,900.6 -13.1
15.4
13,661.57
11Deutsche Bank 38
11,860.8
13,639.5
▲
20,042.1
17,168.618,419.3
9.9
▼▼
35,736.4
11.4
-6.9▼ 0.8
14
14.30.8
0.9
0.5
1611.414
11,491.7
▼▼
-11.3-11.3
-3.4
-19.814
UBS
▲+3▲
Citi
Financial Advisor
Credit Suisse+1
Industry Total
4.4
▼
▲
5
1517
1.2
-45.3%
413,552.5
3.4
+5
1.1▲
▲
0.1
0.1
2.0
▲
▲
▲
▲▼ 107.0▲
16
+20.8
▲40.3
1.3
25.3
1.3
0.50.3
+6 1.3▲
52.2+2
▼
0.6
▼
9.4
2.2 ▲
▲
3.3
3.5
0.2
▼
3.2
-2
39.3▲ 49.5
3.0 ▲
▲
3.5
▲
1.3
+1 ▲
6.1
34.6
0.0+1+4
▲
0.92.2
3.2
0.3+1
+9
+7
1.2
▲
0.8
▲
▲▲
▲
1,775.4
▲
▲
11
▲▼
▲ 14▲▲
+4
11
▲4.6
1,138.2
-15.7%▼
0.20.3
6
0.53.2
1-10.4
0.2
0
0.50.6
0.6+20.2
▲1.4
1.1
14.4%▼97.1% -61.0%-14.9%
▲
2,296.1
▲-1.8
20.1
RBC Capital Markets
0.7
Deutsche BankMorgan Stanley
67 28,469.0
26,881.6Bank of America Merrill Lynch 8 23.4 17.9
1
34
17.15
7
5
30,870.3 26.812
Goldman Sachs & Co 2 38,604.5 33.6332,698.7
Macquarie Group
17.123.7
1 38,771.5 33.72
31,854.728.427.7 +3 ▲ 36.7
10,416
16.0 ▲15.4
8
▲13 +4
-7
▼▼
-10.8
6.56.27,171.3
7,498.3
▼-5
▲▲
+1+11
+3
213
11
21* 4.9BMO Capital Markets 13
306,339.2
2
0.5
JP Morgan
81.3
▲ Lazard
0.0-5.5
2.0
17 25
21
2.05,095.6
1,711.11.01.0
1.5
▲
22
-
Fort Street Advisers
▲
1,170.2
9
▲
2.0▲
4.41.0
▼1.5
2,325.22.5
7,351.4+2▲
3.15,172.9 4.3
1
28
5.518
6.0CITIC -
18
6,880.5
13 2.7▲ 15+1
14▲5.9 0.1
▲
Fort Street Advisers 4.45.9-15
16 217,005.05,262.9
17
Standard Chartered PLC74 +4
1918
2.3 715
8
29
4,666.73,914.22,756.2
3.93.93.3 5
2,325.2 1.9
▲
2ScotiabankRBC Capital Markets
▲0.4-
22
34▲ 190.3
-2120
1.9
2.3
▲▲▲
1.2
3523+3 24Credit Agricole CIB
CIMB Group Sdn Bhd
0.4
0.1
-10.5▲
+1
-1
+1
▼▲
+1 ▲ 16Standard Chartered PLC
20▲
Grant Samuel
Standard Bank Group LtdScotiabank
Barclays
7,527.6 6.3
Gresham Partners▲6.3
+67,498.3 0.1
6.3 ▲ +4 ▲
6.14.9
Industrial & Comm Bank China4 12 7,527.6
▲
7,005.0 6.1▲0.1
▼-1
▼▲
▲
18.6
▲▲
0.5
15.71.3
▲0.6
▲
0
0.5 0.3
-
▼
▲
0.1
0.3
▲
0.11.4
0.40.3
▼1.1
▼▲
-
11.9
0.9
100.0
0.17
+2
4
2
6
4.7
0.2
0.8
2
71
0.13
-7.3%▼
71.9%▼
100.0
-2.0% ▼
2319
+2 15.37.9
▼
0.514.5
- 12.15.6▲
36.6
4.1
5,247 2,699.4
7▲
▲
1.1
0.5
▼-21.3▲
0.10.7
-
▼1,699 1,189 -93
1.01.246* 1,109.3
-23.8%
0.3▼
-416▼
▼
8-34
25 61,096.2 1.0 ▼ ▼0.3
Industry % Change from Same Period Last Year
Greenhill & Co, LLCIndustry Total 115,016.2
▲
24
Industry % Change from Last Quarter
4.0
100.0
1.6+3
Industry Total
Industry % Change from Same Period Last Year
743,888.7
Nomura 0.01.2
Visit http://dmi.thomsonreuters.com to view archives and order custom League Tables https://www.thomsonone.com * tie
16
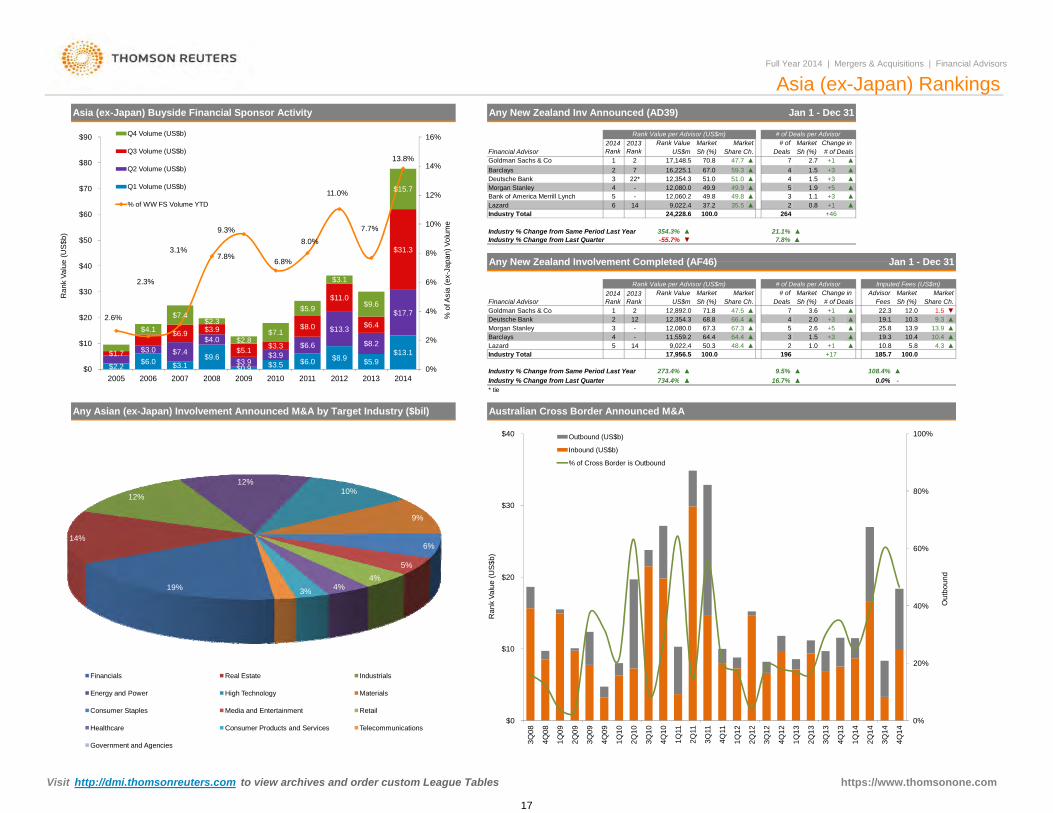
▲
64.4
▲
9,022.4Lazard-
Rank Value
▲
Share Ch.
Rank Value per Advisor (US$m)
Industry % Change from Last Quarter
▲
Goldman Sachs & Co
Asia (ex-Japan) Buyside Financial Sponsor Activity
Industry % Change from Same Period Last Year
759.347.7
MarketShare Ch.Sh (%)
4▲▲70.8
Change in
# of Deals
5
▲+5
+3
1.9
1.5
Market
+10.8
51.5
7.8%21.1%
4
# of Deals per Advisor
2264 +46
10.4
19.167.3
12,354.3
734 4%
4.310.4
100.0
4 9.3
11,559.2Morgan Stanley
▲10.3▲
- 12,080.0
▲
Financial Advisor
Industry Total
Barclays12,080.0
14
US$m
▲▲
12,354.3
49.8
51.0
▲
3 51.049.9 49.9
- 12,060.235.5
5
100.0
1 2
Market Change in # of Market
Industry % Change from Last Quarter
▲68.82
▲▲
47.5Deals
67.33
2013 Rank
2014 Rank
+3
1.5
7
Market # of
66.4 2.0
▲
Jan 1 - Dec 31
Rank Value per Advisor (US$m)
Full Year 2014 | Mergers & Acquisitions | Financial Advisors
Deals2013 Rank US$m
+1Goldman Sachs & CoSh (%)
Asia (ex-Japan) Rankings
Rank Value
Jan 1 - Dec 31
▲
Any New Zealand Involvement Completed (AF46)
▲
24,228.6
+3▲
▼
Industry Total
273.4% ▲
▲
12,892.0 ▲
3
Share Ch.▼
+1250.3 5.8 ▲
5 +5 13.925.8+3
▲
+17
108.4%
185.7
▲
1 2Deutsche Bank 12
- 13.9
12.0
Imputed Fees (US$m)
▲
# of Deals per Advisor
+3
2.7
1.1
3.6
MarketAdvisor
22.3# of DealsSh (%)
MarketFees
67.0
▲64.4
Sh (%)1.5
31.0
16 7%9.5%
196
▲10.8
0 0%
▲
▲+1
Industry % Change from Same Period Last Year 354.3%
2.6
▲
19.3
Barclays
Bank of America Merrill Lynch
2
Market
4
Morgan Stanley
100.0
17,148.5
22*
49.8
-55.7%
Sh (%)71.8
▲48.417,956.5
9,022.4 37.2
2014 Rank
16,225.1
4
▲
Deutsche Bank
Lazard 6 14
Financial Advisor
Any New Zealand Inv Announced (AD39)
7
$2.2 $6.0 $3.1$9.6
$0.9 $3.5 $6.0 $8.9 $5.9$13.1$3.0 $7.4
$4.0
$3.9$3.9
$6.6
$13.3
$8.2
$17.7
$1.7
$6.9 $3.9
$5.1 $3.3
$8.0
$11.0
$6.4
$31.3
$4.1
$7.4$2.3
$2.8$7.1
$5.9
$3.1
$9.6
$15.7
2.6%
2.3%
3.1%7.8%
9.3%
6.8%
8.0%
11.0%
7.7%
13.8%
0%
2%
4%
6%
8%
10%
12%
14%
16%
$0
$10
$20
$30
$40
$50
$60
$70
$80
$90
2005 2006 2007 2008 2009 2010 2011 2012 2013 2014
% o
f Asi
a (e
x-Ja
pan)
Vol
ume
Ran
k Va
lue
(US
$b)
Q4 Volume (US$b)
Q3 Volume (US$b)
Q2 Volume (US$b)
Q1 Volume (US$b)
% of WW FS Volume YTD
▲* tie
734.4%Industry % Change from Last Quarter
Any Asian (ex-Japan) Involvement Announced M&A by Target Industry ($bil) Australian Cross Border Announced M&A
-▲16.7% 0.0%
19%
14%
12%
12%10%
9%
6%
5%4%
4%3%
Financials Real Estate Industrials
Energy and Power High Technology Materials
Consumer Staples Media and Entertainment Retail
Healthcare Consumer Products and Services Telecommunications
Government and Agencies
0%
20%
40%
60%
80%
100%
$0
$10
$20
$30
$40
3Q08
4Q08
1Q09
2Q09
3Q09
4Q09
1Q10
2Q10
3Q10
4Q10
1Q11
2Q11
3Q11
4Q11
1Q12
2Q12
3Q12
4Q12
1Q13
2Q13
3Q13
4Q13
1Q14
2Q14
3Q14
4Q14
Out
boun
d
Ran
k Va
lue
(US
$b)
Outbound (US$b)
Inbound (US$b)
% of Cross Border is Outbound
2005 2006 2007 2008 2009 2010 2011 2012 2013 2014
Visit http://dmi.thomsonreuters.com to view archives and order custom League Tables https://www.thomsonone.com
17
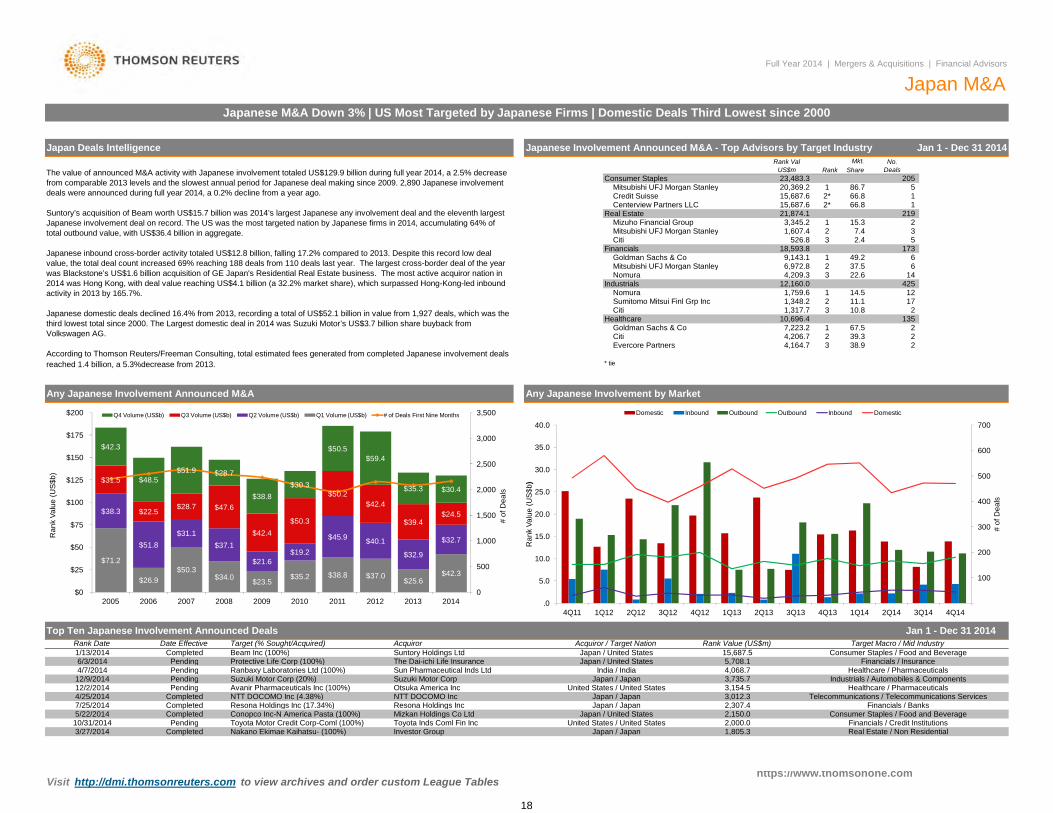
Nomura
Goldman Sachs & Co
* tie
Healthcare
2 3 38.939.34,206.7 2
14.5
49.2
4,164.7
321,348.2
2
10.8
Citi7,223.2
6,972.8
12 1
1
425
67.5 2 135 10,696.4
18,593.8 Financials
11.1
173
6
Industrials 12,160.0 3
9,143.1
Nomura
2
1,759.6
2.4
219
17 2
5
14
1
205 5 1
2
6
Japanese Involvement Announced M&A - Top Advisors by Target Industry Jan 1 - Dec 31 2014Mkt.
Credit Suisse
3 7.4
Japan Deals Intelligence
15,687.6 15,687.6
23,483.3 1
Centerview Partners LLC
Consumer StaplesMitsubishi UFJ Morgan Stanley
The value of announced M&A activity with Japanese involvement totaled US$129.9 billion during full year 2014, a 2.5% decrease from comparable 2013 levels and the slowest annual period for Japanese deal making since 2009. 2,890 Japanese involvement deals were announced during full year 2014, a 0.2% decline from a year ago.
Suntory’s acquisition of Beam worth US$15.7 billion was 2014’s largest Japanese any involvement deal and the eleventh largest Japanese involvement deal on record. The US was the most targeted nation by Japanese firms in 2014, accumulating 64% of total outbound value, with US$36.4 billion in aggregate.
Japanese inbound cross-border activity totaled US$12.8 billion, falling 17.2% compared to 2013. Despite this record low deal value, the total deal count increased 69% reaching 188 deals from 110 deals last year. The largest cross-border deal of the year was Blackstone’s US$1.6 billion acquisition of GE Japan's Residential Real Estate business. The most active acquiror nation in 2014 was Hong Kong, with deal value reaching US$4.1 billion (a 32.2% market share), which surpassed Hong-Kong-led inbound activity in 2013 by 165.7%.
Japanese domestic deals declined 16.4% from 2013, recording a total of US$52.1 billion in value from 1,927 deals, which was the third lowest total since 2000. The Largest domestic deal in 2014 was Suzuki Motor’s US$3.7 billion share buyback from Volkswagen AG.
According to Thomson Reuters/Freeman Consulting, total estimated fees generated from completed Japanese involvement deals reached 1.4 billion, a 5.3%decrease from 2013.
66.866.8
No. DealsRank
20,369.2 2*2*
Share
Mizuho Financial GroupReal Estate
Mitsubishi UFJ Morgan Stanley
15.3
22.6
1,607.4 3
Goldman Sachs & Co37.5
Full Year 2014 | Mergers & Acquisitions | Financial Advisors
Japan M&AJapanese M&A Down 3% | US Most Targeted by Japanese Firms | Domestic Deals Third Lowest since 2000
526.8
3,345.2 1
86.7
Rank Val US$m
Mitsubishi UFJ Morgan Stanley 2Citi
1,317.7
21,874.1
CitiSumitomo Mitsui Finl Grp Inc
1
4,209.3
Evercore Partners
Conopco Inc-N America Pasta (100%) 2,150.0
Japan / JapanRanbaxy Laboratories Ltd (100%)Suzuki Motor Corp (20%)Avanir Pharmaceuticals Inc (100%)NTT DOCOMO Inc (4.38%)
Suntory Holdings Ltd
Sun Pharmaceutical Inds LtdSuzuki Motor CorpOtsuka America IncNTT DOCOMO Inc
Investor GroupFinancials / Credit InstitutionsReal Estate / Non Residential1,805.3
United States / United StatesJapan / Japan
Healthcare / PharmaceuticalsIndustrials / Automobiles & Components
Jan 1 - Dec 31 2014Rank Value (US$m)
3,154.5
2,307.4
Consumer Staples / Food and Beverage
Any Japanese Involvement by Market
3,012.3
4,068.7India / India
Acquiror / Target Nation
2,000.0Toyota Inds Coml Fin Inc
Telecommunications / Telecommunications ServicesFinancials / Banks
Japan / Japan
Mizkan Holdings Co Ltd Japan / United StatesToyota Motor Credit Corp-Coml (100%)
Beam Inc (100%) 15,687.5
Consumer Staples / Food and Beverage
Healthcare / PharmaceuticalsUnited States / United States
Japan / Japan5/22/2014
Completed
Completed
10/31/2014
7/25/20144/25/2014 Completed
CompletedPending
3/27/2014
Resona Holdings Inc (17.34%) Resona Holdings Inc
Japan / United States
3,735.7
Any Japanese Involvement Announced M&A
AcquirorTarget (% Sought/Acquired)Rank Date Date EffectiveTop Ten Japanese Involvement Announced Deals
4/7/2014
Completed6/3/2014
12/2/2014
Pending
PendingPending
12/9/2014
1/13/2014
Pending
Nakano Ekimae Kaihatsu- (100%)
Target Macro / Mid Industry
Protective Life Corp (100%) The Dai-ichi Life Insurance Japan / United States 5,708.1 Financials / Insurance
$71.2
$26.9$50.3
$34.0 $23.5$35.2 $38.8 $37.0
$25.6$42.3
$38.3
$51.8$31.1
$37.1
$21.6$19.2
$45.9 $40.1
$32.9
$32.7
$31.5
$22.5$28.7 $47.6
$42.4$50.3
$50.2$42.4
$39.4$24.5
$42.3
$48.5$51.9 $28.7
$38.8$30.3
$50.5$59.4
$35.3 $30.4
0
500
1,000
1,500
2,000
2,500
3,000
3,500
$0
$25
$50
$75
$100
$125
$150
$175
$200
2005 2006 2007 2008 2009 2010 2011 2012 2013 2014
# of
Dea
ls
Ran
k Va
lue
(US
$b)
Q4 Volume (US$b) Q3 Volume (US$b) Q2 Volume (US$b) Q1 Volume (US$b) # of Deals First Nine Months
100
200
300
400
500
600
700
.0
5.0
10.0
15.0
20.0
25.0
30.0
35.0
40.0
4Q11 1Q12 2Q12 3Q12 4Q12 1Q13 2Q13 3Q13 4Q13 1Q14 2Q14 3Q14 4Q14
# of
Dea
ls
Ran
k Va
lue
(US
$b)
Domestic Inbound Outbound Outbound Inbound Domestic
https://www.thomsonone.com Visit http://dmi.thomsonreuters.com to view archives and order custom League Tables
18
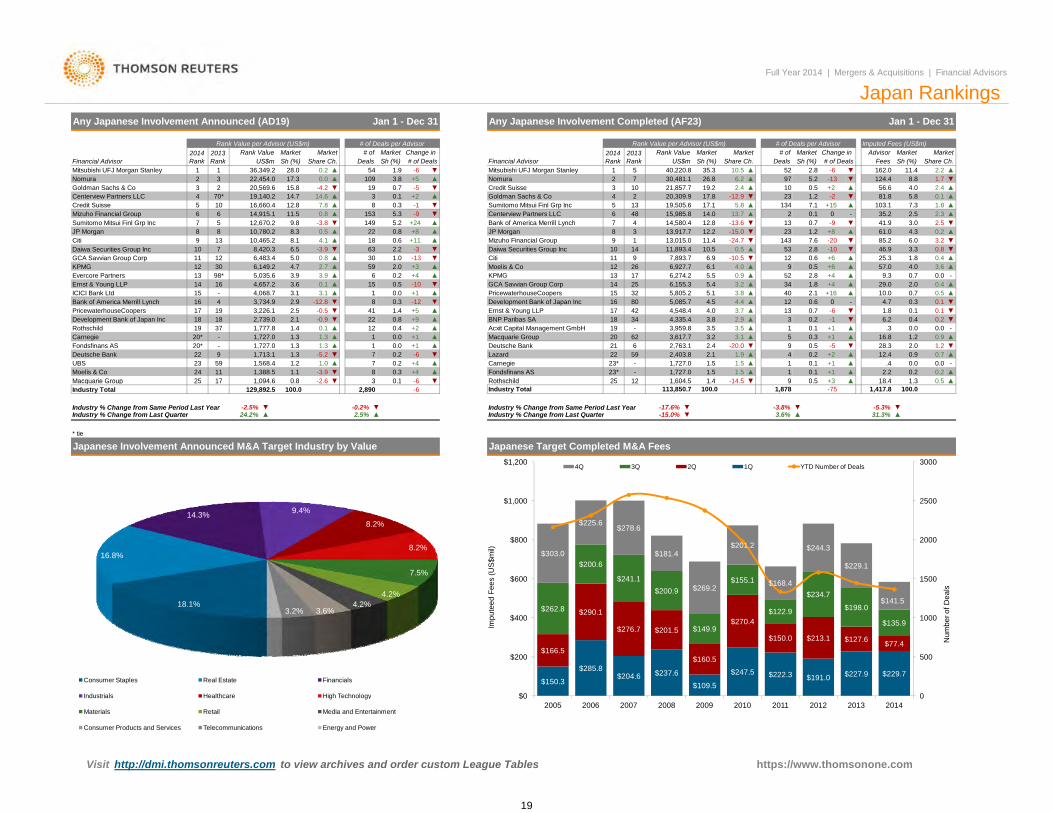
Imputed Fees (US$m)
Financial Advisor
Daiwa Securities Group Inc
2014 Rank
Jan 1 - Dec 31
# of Deals# of 2014
Rank
Any Japanese Involvement Announced (AD19)
Rank Value per Advisor (US$m)Market
-4.2 19
28.0+5
Deals2013 RankSh (%)
Change in Rank Value per Advisor (US$m)
14.720,569.6
1090.054
▼▲17.3
370*
Market2013 Rank
▲
36,349.222,454.0
US$m
19,140.2
Rank ValueSh (%)
▲▲
▲
15.8
1
7.814.6
11.5
0.2
2
4
13
Sumitomo Mitsui Finl Grp Inc
Centerview Partners LLC
Mizuho Financial Group 6 6
GCA Savvian Group Corp
7
98*
2.9
8
1013
3.6
4.7
17
15
812,670.2
3
16,660.414,915.1
12
3,734.916
3
Citi
14Ernst & Young LLPEvercore PartnersKPMG
Bank of America Merrill Lynch
6,149.2
1.4Development Bank of Japan Inc ▼PricewaterhouseCoopers
6.54.1
Daiwa Securities Group Inc188.1 ▲ +1163
Financial Advisor Share Ch.
# of Deals per Advisor
Japan Rankings
Share Ch.Market MarketAdvisor
Sh (%) Sh (%)MarketMarketMarket
Fees# of Deals# of
Sh (%) Share Ch.
# of Deals per Advisor
US$mRank Value
DealsMarket Change in
7 30,481.1 26.840,220.8
124.4▲
5.210.5 ▼35.3-6 ▼
-5 ▼▲
0.7
12
1.9
10▲▲ 0.5
52▼-13▲
-62.8
6.2
+1
+15
▼
▼
-1
-10
1.8
9.3
-20
5.8
25.3
2.5
▼
3.0
2.4
4.3
103.1
46.9
134
▲
81.8
▲
▼
-
85.2
41.9
▲
2.5
6.0
1.8
7.3
0.5
3.3
▲
▼
▼
0.2
2.0
+6
+16▲
▼
▼
0.4
▲
0.1
0.5▲
▲
▲7.1
0.4
0.8
0
29.0
35.2
3.5 0.1
▲
3
-13
▼▼
0.20.7
18
3,617.7
0.180▼
4
0.6
0.223*
▲1.5
23*- ▲ 1
▲
.4▲
+1
+3 18 4
12.4
2.21.50.1 ▲
+11.51.5
0.11
▲4.0-▲
0 5
0.2 +2
112.2
▲
19 -
1 3
▲
17
9
▲1.7
162.0 11.4
▲▼8.8
2.2
56.6 4.0 2.40.1
3.6
3.2
▲
0.2
▲1.8
▼▲
2.3
0.0
▲
61.0
57.0
▲
0.7
-
0.1
0.0
0.0
▼▲
▲-
1.20.7
▲ 0.2
0.9
▼
▲
0.4
0 5
0.7
0.3
0.0
0.0
+652
-1314-3
6.9 -10.5 ▼▲
0.8-3.80.5
10.511.41
▼
+8Bank of America Merrill Lynch
0.6
▲10
7,893.711,893.4
91.0
5,035.64,657.2
3.9
8.310,780.2
16
8,420.310,465.2
30
7
4,068.7
593.9 ▲ 6
12.8
3.1
▼9.8
-3.9
JP Morgan
302.7
5.06,483.4 0.811
▲
▼
22
45
20,309.910
NomuraCredit Suisse
3.8103
19,505.6 17.1
ICICI Bank Ltd
9
5
2
12
Credit Suisse
1
▲
-
Mitsubishi UFJ Morgan Stanley97
Mitsubishi UFJ Morgan Stanley
Goldman Sachs & Co
8
▲7
4
5
-12.9 1.2+2
Nomura21,857.7
2
23
6.2
+219.2
-2
1
413.7
515,985.8
▲17.8
5.813▼0.1
8-9 ▼
Goldman Sachs & Co▲Sumitomo Mitsui Finl Grp Inc▼Centerview Partners LLC
-10.3
▲▲
1535.2 +24149
614,580.4
143
5.3
0.813
-24.73 ▼
923
0.112.8 -9-13.6 0.7▼
248 14.0
▼1.2
0.5
4.012
▲
53 2.8
90.6
0.2
7.6-15.0 +812.213,917.7
▲▲+4+3 12
13 5.56,274.2▲
KPMG6,927.726Moelis & Co2.0
2.8▲
403.834
6.1
0.0 +11.8
+45.4
176,155.3
▲
0.9+4
3.14.7-12.8 0.3 -12
10.02.115 3212
-0.90.1
▲4.4
▲Ernst & Young LLP▲ 3.7
5,085.7
2.92.5
18 18 2,739.0 2.1-6
22 0.8 +9 3.819 3,226.1
Carnegie 20* -Rothschild 19 37 1,777.8
1,727.01.4 0.41.3
123.1
+2▲ Acxit Capital Management GmbH▲ 3.2
15
229▲
▲ 0.0 +10.0 ▼
1,713.1Fondsfinans ASDeutsche Bank
20*-5.2
▲Macquarie GroupDeutsche Bank -20.0
1.3
UBS 23 59 1,568.4 1.2▼1.3
1.022 9
▼2 6Macquarie Group 25 17 0 8-
1 604 5▼ 12Rothschild0 1 14 51 46 25 ▼
2.1
42
- 1,727.0 1.3 ▲ 6
0.1 ▼ 14
1.3
Any Japanese Involvement Completed (AF23)
241,727.07 0.2
▼ +4 1,727.00.3▲ ▲
Lazard▼Carnegie
13,015.0
1
5.1
Citi
Development Bank of Japan Inc
622,763.1
1,388.5 ▲1.1
▼▲
-6+4
+17 0.2
▲0.5▲
PricewaterhouseCoopers 5,805.2▼
3.5▲
▲1.9
16
59
3,959.8
4.5
2,403.8
▲
1 094 68-3.9Moelis & Co3
11 Fondsfinans AS
▲ .30.3
+1 ▲
0.5
10.9
-52.416.8
2120
28.31.22.0▼
3.215
Full Year 2014 | Mergers & Acquisitions | Financial Advisors
GCA Savvian Group Corp
0
-10 25
Jan 1 - Dec 31
BNP Paribas SA 344.0▼ +5 4,548.4
4,335.441-0.5
JP MorganMizuho Financial Group
8
Industry % Change from Same Period Last Year Industry % Change from Same Period Last YearIndustry % Change from Last Quarter Industry % Change from Last Quarter ▲▲3.6%
-75▲+3 18.4
-5.3%
Industry Total
Japanese Target Completed M&A Fees
Vi it htt //d i th t t i hi d d t L T bl
-3.8%
0.5
31.3%
1.391,878
▲1,417.8
▼
100.0
▼
htt // th
0.5▼100.0 2,890129,892.5
-2.6Industry Total -6Macquarie Group 25 17 0.8
* tie
24.2%-2.5%
▲
1,604.5▼ 12
-17.6%▲
▼▼ -0.2%2.5%
▼▼-15.0%
Rothschild0.1 -14.51.4-6 25100.0
▼113,850.7
Japanese Involvement Announced M&A Target Industry by Value
1,094.6 3
18.1%
16.8%
14.3% 9.4%
8.2%
8.2%
7.5%
4.2%4.2%
3.6%3.2%
1.4%
Consumer Staples Real Estate Financials
Industrials Healthcare High Technology
Materials Retail Media and Entertainment
Consumer Products and Services Telecommunications Energy and Power
$150.3
$285.8$204.6 $237.6
$109.5
$247.5 $222.3 $191.0 $227.9 $229.7
$166.5
$290.1
$276.7 $201.5
$160.5
$270.4
$150.0 $213.1 $127.6 $77.4
$262.8
$200.6
$241.1$200.9
$149.9
$155.1
$122.9
$234.7
$198.0
$135.9
$303.0
$225.6$278.6
$181.4
$269.2
$201.2
$168.4
$244.3
$229.1
$141.5
0
500
1000
1500
2000
2500
3000
$0
$200
$400
$600
$800
$1,000
$1,200
2005 2006 2007 2008 2009 2010 2011 2012 2013 2014
Num
ber o
f Dea
ls
Impu
teed
Fee
s (U
S$m
il)
4Q 3Q 2Q 1Q YTD Number of Deals
Visit http://dmi.thomsonreuters.com to view archives and order custom League Tables https://www.thomsonone.com
19
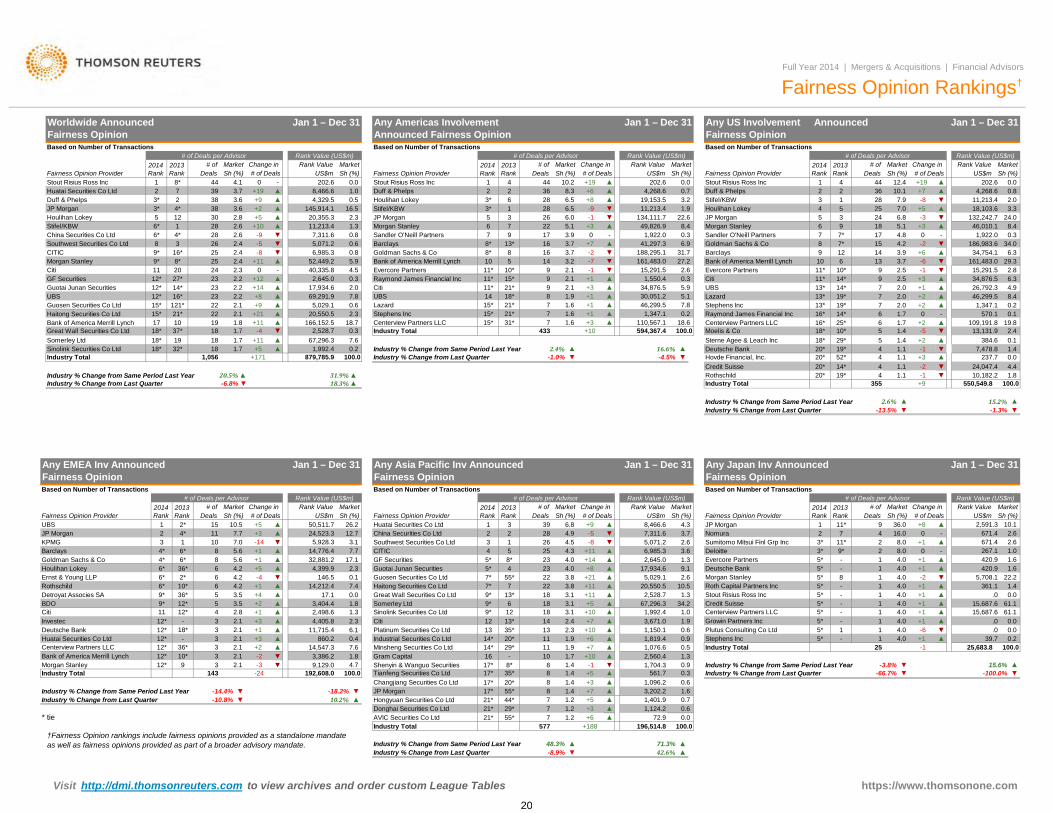
Industry Total
Industry Total
Industry % Change from Same Period Last Year ▲ ▲Industry % Change from Last Quarter ▼ ▲
Fairness Opinion Rankings†
18* 19 18 1.7 +11
100.0+9355
24,047.4 4.4Credit Suisse 20* 14* 4 1.1 -2 ▼Hovde Financial, Inc. 20* 52* 4 1.1 +3
46,299.5 8.41,347.1
237.7 0.01.4
11,213.4 2.0
46,010.1 8.41,922.0 0.3
3.3
7,478.8
+19
132,242.7 24.018,103.6
Full Year 2014 | Mergers & Acquisitions | Financial Advisors
202.6 0.04,268.6 0.8
Market
4,329.5 0.5
7,311.6
US$m202.6
▲
▲
145,914.1▲
0.6
JP Morgan
▲20
+110
+12
Somerley Ltd
2,645.0
5.9
7
20,550.5
23 2.2
8,466.6
2.4
▲
3.7
2.2 +14 ▲
-
20,355.3 2.3
-
52,449.2
1.0
0.8
11,213.4
5,071.2
16.5▲3* 2
+2 ▲38 +9
3.6383.6
6* 1 2.6 +10
3* 4*
2.48
-826 2.4
52830 2.8 +5
9*2.311
3
248* 25
9* 16* 25
0.341,297.3
6* 4* 2.6
▼ 6,985.3
28 ▼-9
7.8
40,335.8 4.5
60.8
8.4
0.6 ▲1,922.0
1.3
Stifel/KBW
JP Morgan
Sandler O'Neill PartnersGoldman Sachs & CoBarclays
3.21.9
22.6Houlihan Lokey
Morgan Stanley
2.0
▼-5
Bank of America Merrill Lynch
100.0594,367.4
16
69,291.917,934.6
13*9 17 03.9
0.3
3.7Barclays7
2.222
2.1
2323
+8
10
15* 121*
19
Guotai Junan SecuritiesUBS
21*▲
▲ 67,296.3 7.6
166,152.5
2.1▲▲
+215,029.1
+111.718
GF Securities
18*
+9
14*
-4
12*
17
Industry % Change from Same Period Last Year
2.318.7
CITIC
Citi
15*
12*
22
37*1.8
Guosen Securities Co Ltd
12*
6.9+7
27*
Morgan Stanley
16* ▲
8*China Securities Co LtdSouthwest Securities Co Ltd
+3
JP MorganHoulihan Lokey
7Stifel/KBW
16Sandler O'Neill PartnersMorgan Stanley
-
6.0 134,111.749,826.95.1
19,153.511,213.4
▲28
4,268.6
▼▲
▲
▼3* 6 28 6.5 +8
0.02 2 36 8.3
US$m Sh (%)
0.710.2 +19 ▲
Rank Value
202.6
Houlihan Lokey
# of Market Change in
1 4 44# of DealsSh (%)Deals
04.1
2014 Rank
Stout Risius Ross Inc
# ofSh (%)
2013 Rank
0.0
Rank Value
Stout Risius Ross IncDuff & Phelps +6
# of Deals
21 8* 44
Fairness Opinion Provider2013 Rank
26Stifel/KBW -9
5 322
6.53* 1-1
+6
▲
34,876.52.5
7+1+2
▼Evercore Partners
-6
▼
Industry Total 550,549.8
▼
-
▲
+10
29.310 6▼
+3
161,483.0
-2 ▼34,754.1 6.3
186,983.6 34.0▲
719*
10*14*14*
11*
13*99
0.2
15,291.5 2.82.5
3.9
▲6.3
26,792.3
+2
4.9▲
2.4109,191.8
▲
24 6.8
17 -4.2
384.6
▲
▲07*
5 +5
5.14.8
▼
13
67
28
18
1215
3
89
12.410.1
+19
-1
2
+39-3
+7
7*
44
4
2014 Rank
2013 Rank
Stout Risius Ross IncFairness Opinion Provider
1 4Duff & Phelps
▼7.925
▲
7.0-8
▲
UBSCiti 11*
2
3.714
5 3
361
13*13*Stephens Inc
Lazard
Raymond James Financial Inc
Moelis & Co
20.5%
16*
2.0
▲
Sterne Agee & Leach Inc20* 19* 4
▼ -4.5%1.1
▲Deutsche Bank
619* 7 2.0
2.0
19.8
-1
18* 10* 5 ▼
Duff & Phelps
Rank Value (US$m)
Worldwide Announced Fairness Opinion
Rank Value (US$m)MarketRank ValueChange in
# of Deals per Advisor# of Deals per AdvisorBased on Number of Transactions
Change in # of Market# of Deals per Advisor
Market2014 Rank Sh (%) # of Deals
Market
Jan 1 – Dec 31 Jan 1 – Dec 31Any Americas Involvement Announced Fairness Opinion
Jan 1 – Dec 31Any US Involvement Announced Fairness Opinion
Deals Sh (%)
Rank Value (US$m)
Huatai Securities Co Ltd
Fairness Opinion Provider US$m Sh (%)
Based on Number of TransactionsBased on Number of Transactions
39
Deals
Bank of America Merrill LynchHaitong Securities Co Ltd
Industry % Change from Last Quarter
+2
12
13,131.9Great Wall Securities Co Ltd 1.4+2-5433
29* 5 1.418*
570.1 0.1Centerview Partners LLC 16* 25* 6
1.7 01.7
14*
▲ 0.12.4%
-1.0%▲16.6%
31.9%-6.8% 18.3%
85
10*15*21*
Goldman Sachs & CoBank of America Merrill LynchEvercore PartnersRaymond James Financial IncCiti
3.73.22.12.12.1
8*1011*11*11*
▲▲
14999
31.727.2
2.60.35.9
-2-7-1
+1+3
879,785.9 100.0
188,295.1161,483.0
15,291.51,550.4
34,876.5
▼▼▼
+1711,056Sinolink Securities Co Ltd 18* 32* 18 1.7 +5 ▲ 1,992.4 0.2
UBSLazardStephens IncCenterview Partners LLC
▼ 2,528.7 0.3
1415*15*15*
18*21*21*31*
8777
1.91.61.61.6
+1+1+1+3
▲▲▲▲
19* 4
30,051.246,299.5
1,347.1110,567.1
5.17.80.2
18.6
1.1 -1 ▼ 10,182.2 1.8Rothschild 20*y g
†Fairness Opinion rankings include fairness opinions provided as a standalone mandate as well as fairness opinions provided as part of a broader advisory mandate.
.039.7
22.21.40.0
61.161.1
0.00.00.2
5,708.1361.1
.015,687.615,687.6
.0-6
+1
▲▲▲▲▲▼▲
-2+1+1+1+1+1
11
4.04.04.04.04.04.04.0
111111
5*
-----1-
5*5*5*5*5*5*
1,401.9 0.7
Plutus Consulting Co LtdStephens Inc
0.9
7 1.2 +5
Morgan StanleyRoth Capital Partners IncStout Risius Ross IncCredit SuisseCenterview Partners LLCGrowin Partners Inc
▲
+3 ▲ 1,096.2 0.6JP Morgan 17* 55* 8 1.4
▲ 561.7 0.3
▲ 3,202.2 1.68 1.4
4.7Tianfeng Securities Co Ltd 17* 35* 8Changjiang Securities Co Ltd
1.41.4
Morgan Stanley 12* 9 3 2.1 -3Bank of America Merrill Lynch 12* 10* 3 2.1 -2Centerview Partners LLC 12* 36* 3 2.1 +2
18* 3 2.1 +1
2.6% ▲ ▲
+11 +1
671.4 2.6
▲Deutsche Bank 5*Evercore Partners 5* - 1 4.0
1.6
671.4 2.6267.1 1.0420.9
4.0 ▲1.6
2,591.3 10.1
12*
▲
-14 5,928.3
2.1
▲▲
+2
3.1
+1 ▲ 32,881.2
12*
5*+5
NomuraJP Morgan
Any Japan Inv Announced Fairness Opinion
7
4
4.3
Market
Any Asia Pacific Inv Announced Fairness Opinion
4.912
2014 Rank
39 +96.82
-100.0%
1.034.2
8
25 25,683.8 100.0
▲
Industry Total
5*
9*
4
7*
9*
▲
4.5
71.3%▲
+188
▲
Sumitomo Mitsui Finl Grp Inc 11*
▼
Industry % Change from Same Period Last Year -3.8% ▼
0.6
3*Deloitte
15.6%
4.0
-1
9* 2 8.0 0 -
420.9-
4 16.0▲
US$m
2 8.0 +10 -
▲9 36.0 +8Deals
2013 Rank
# of Market# of Deals
Industry % Change from Last Quarter -66.7% ▼
Sh (%)
3*
11*
Change in Market
▼
+10
196,514.8
▲
▼+10
1,704.32,560.41,076.6
+7
+5
+5
20,550.5
9*
Industry % Change from Last Quarter -8.9% ▼ 42.6%
1,992.4
577
Industry % Change from Same Period Last Year 48.3%
Sinolink Securities Co Ltd
14*14*
-1
Industry Total
7*
12 18 3.1
3.17 3.8
13* 186 18 3.1
10.51.32,528.7
▲
▲
22
67,296.3+11+11
3.82223
▲
5,029.1
8*▲
▲4.04.0
5 25
+219.1
▲ 2.6+8 17,934.6
Market
5,071.2
Sh (%)Sh (%)
-8
1.3
3.7▼
23 ▲+146,985.3
26
2,645.0
Rank Value
4.38,466.6▲
+11 3.62.6
# of Deals
-5
Industry % Change from Last Quarter -10.8% ▼ 10.2%Industry % Change from Same Period Last Year
Industry Total
▼
192,608.0
Huatai Securities Co Ltd
-14.4%
100.0-24143
11,715.4-
▲ 14,547.3 7.61.8
▼ 9,129.03,386.2
▲-18.2% ▼
-16
17* 20*
Hongyuan Securities Co Ltd 21* 44*
100.0
▼
+3▲
1.3Shenyin & Wanguo Securities 17* 8* 8
▲ 0.511 1.9
13 35*6.1▲ 0.9
13
14,212.4 7.4+1
1.817.1 0.0
59* +4
▲ 4,405.8 2.3
3,404.4+1 ▲ 2,498.6
2* -46*
36* 3.5▲9*
10*
3.5
4.25
4,399.9 2.3▼ 146.5 0.1
4.266
4.2
4*4* 6*3
86*
101
8
2014 Rank
4*
Jan 1 – Dec 31Any EMEA Inv Announced Fairness Opinion
US$mRank Value
7.7 +310.5
▲2
Market2013 Rank
Change in Deals
15Sh (%)
2*
# of Deals per Advisor
Fairness Opinion Provider
Rank Value (US$m)
▼-1.3%
Rank Value
Jan 1 – Dec 31
Fairness Opinion Provider
y
Sh (%)
Based on Number of Transactions
Industry % Change from Last Quarter
# of Deals per Advisor Rank Value (US$m)
Goldman Sachs & Co
15.2%
▲
50,511.7
▼28
17.1
Sh (%)
12.7▲
7.77.0
+524,523.3
5.6
# of Deals
5*
1
Platinum Securities Co Ltd
CITIC1
3
55*
GF Securities
Southwest Securities Co LtdChina Securities Co Ltd
Houlihan Lokey
4
Guosen Securities Co Ltd
Deals
2 ▼
Change in
* tie
29* 11 1.9 +7▲
Minsheng Securities Co Ltd10 1.7Gram Capital
12*+10 ▲ 1,150.1
11 12* 2.8 1.3Citi 12Investec
Citi
66*
12*
Fairness Opinion ProviderUBSJP Morgan
Barclays
3
Rothschild6*
BDO
Ernst & Young LLP
KPMG
2014 Rank
1
Great Wall Securities Co LtdHaitong Securities Co Ltd
Guotai Junan Securities
Detroyat Associes SASomerley Ltd
11
-
# of2013 Rank
# of
Based on Number of Transactions
36*
Industrial Securities Co Ltd
Rank Value (US$m)
860.2 0.43 2.1 +3 ▲ 20*
-13.5% ▼
US$mMarket
1,819.42.3
▲ 3,671.0 1.9
Industry % Change from Same Period Last Year
# of Deals per AdvisorBased on Number of Transactions
7,311.6
13* 14 2.4 +7
+6
Jan 1 – Dec 31
3
Deutsche Bank
26.2
+1 14,776.45.6
Huatai Securities Co Ltd
Donghai Securities Co Ltd 1.2 0.6AVIC Securities Co Ltd
21*21*
29*55*
77 0.01.2
+3+6
▲▲
1,124.272.9
https://www.thomsonone.com Visit http://dmi.thomsonreuters.com to view archives and order custom League Tables
20
-
-
-
-
-
Redina Doda
Financial and legal advisors receive full credit for each deal on which they provide financial or legal advisory services, unless they represent minority sellers or advise on only a portionof the transaction or Thomson Reuters has not been made aware of their participation in that transaction. For pending transactions, advisors to targets of multiple bids receive credit forthe transaction agreed to or, in the absence of an agreement, the value of the highest offer.
E-mail: [email protected]
E-mail: [email protected]
Asia-PacificKelvin Bian
Kaori Motohashi
EMEA
Tel: +44 (0) 20 7542 3558
E-mail: [email protected]
Japan
Deals with undisclosed dollar values are rank eligible but with no corresponding Rank Value. Non-US dollar denominated transactions are converted to the US dollar equivalent at thetime of announcement of terms.
Tel: +852 3761 1852
Full Year 2014 | Mergers & Acquisitions | Financial Advisors
Ranking Criteria Summary
If you would like to participate in the submissionprocess, receive quarterly press releases, or havequestions about league table criteria pleasecontact:
League tables include rank eligible mergers, acquisitions, repurchases, spin-offs, self-tenders, minority stake purchases and debt restructurings.
A tender/merger transaction is considered to be effective at the time of consummation of the merger or the date on which it is declared wholly unconditional.
AmericasRobert LevineTel: +1 646 223 5682
Announced league tables include all deals that were announced between January 1, 2013 and December 31, 2014 and of which Thomson Reuters was made aware. All current dataand previous year's data is as of 5:00pm EDT on December 31, 2014.
-
-
-
-
League tables, commentary, and charts citing announced activity are based on Rank Date and include intended, pending, partially complete, completed, pending regulatory, andunconditional transactions. Rank Date is defined as the earliest public announcement of when a value can be applied to a transaction.
League table volumes for Mitsubishi UFJ Financial Group and Morgan Stanley, included herein reflect the changes after the commencement of their jointly established securities firmsin Japan: (1) Mitsubishi UFJ Morgan Stanley Securities and (2) Morgan Stanley MUFG Securities. Accreditation for transactions involving the newly established joint ventures arereflected in totals for Morgan Stanley. For Japanese related rankings, Morgan Stanley is represented as "Mitsubishi UFJ Morgan Stanley”.
Any Involvement league tables include deals where the target, acquiror, or either ultimate parent are domiciled (nation of headquarters) in the specified region or nation. Anyinvolvement league tables also include the nation of the seller and seller ultimate parent on privately negotiated stake purchases
Kaori Motohashi
Imputed fees are calculated using Freeman & Co. proprietary algorithm where spreads or fees are not disclosed. Deal fees are on a gross basis before all expenses. Each underwriteror advisor is allocated its share of deal fees using Freeman & Co. allocation methodology, based on the number of underwriters or advisors on the deal and their role. No fees areallocated to syndicated members.
E-mail: [email protected]: +813 6441 1338
While Thomson Reuters has used reasonable endeavors to ensure that the information provided in this document is accurate and up to date as at the time of issue, neither Thomson Reuters nor its third party content providers shall be liable forany errors, inaccuracies or delays in the information, nor for any actions taken in reliance thereon, nor does it endorse any views or opinions of any third party content provider. Thomson Reuters disclaims all warranties, express or implied, as tothe accuracy or completeness of any of the content provided, or as to the fitness of the content for any purpose to the extent permitted by law. The content herein is not appropriate for the purposes of making a decision to carry out a transactionor trade and does not provide any form of advice (investment, tax, legal) amounting to investment advice, nor make any recommendations or solicitations regarding particular financial instruments, investments or products, including the buying orselling of securities. Thomson Reuters has not undertaken any liability or obligation relating to the purchase or sale of securities for or by any person in connection with this document.
© 2014 Thomson Reuters. All rights reserved.
Thomson Reuters and the Thomson Reuters logo are registered trademarks and trademarks of Thomson Reuters and its affiliated companies. Any third party name or mark herein belongs to the relevant third party.
https://www.thomsonone.com
21
© 2014 Thomson Reuters. 1006243 03/14.Thomson Reuters and the Kinesis logo are trademarks of Thomson Reuters.
FOR INFORMATION PROFESSIONALSSDC Platinum is the world’s foremost financial transactions database, covering new issues, M&A, syndicated loans, private equity, project finance, poison pills, and more.
Solution for:• Market Analysis & Trends (Geography, Sector,
Asset Class, Deal Type, Deal Size, etc.)• Deal Origination (Debt Maturity Analysis,
Company Lifecycle including Private Equity)• Pitch Creation (Firm Credentials,
Representative Acquirors)• M&A Targeting (Active Strategic/Sponsor
Acquirors, Target Company Screener)• Negotiation (T&C Benchmarking)
FOR INVESTMENT BANKERSThomson Reuters Eikon is the most intuitive and comprehensive way of staying informed. With natural-language search, you can quickly find global information, news, charts and analytics. Company and industry views provide top-level summaries, and then detailed information is just a click away. Identify new opportunities and gain deep understanding of markets, industries, companies and events.
Thomson Reuters Eikon also includes an Add-In for Microsoft® Office to help you increase your efficiency. From screening and targeting to comparables analysis, building league tables, valuing a company and
developing a client pitch book, you can do all this without leaving Microsoft Office. Search and autosuggest features in Excel make model-building easier.
Solution for:• Managing Client Relationships• Deal Origination• New Issues Pre-Marketing/Roadshows• Financial Modeling• Customized League Tables• Simple Deals screening• Valuation analysis and comparable
deal screening• On-brand pitch book creation
FOR STRATEGY AND PLANNING TEAMSThomson Reuters Deals Business Intelligence enables you to slice and dice our renowned Deals and Fees data to create ad hoc reports, analyze market trends, benchmark your performance and identify opportunities – all within a tool built into your workflow in Excel®, saving you valuable time and giving you a competitive edge.
Solution for:• Conducting market analysis and
identifying trends• Benchmarking your performance and
monitoring competitors• Targeting clients by wallet size and
banking relationship• Allocating resources more effectively by
evaluating and analyzing lost deals
Send us a sales enquiry at: financial.thomsonreuters.com/salesRead more about our products at: financial.thomsonreuters.com/products
To purchase individual Thomson Reuters Deals or League Table reports, please contact our Thomson Reuters On Demand group:
Web: http://financial.thomsonreuters.com/ondemandEmail: [email protected]
Access unique analysis for free anytime using Thomson Reuters Deals Intelligence website and receive regular updates, delivered direct to your inbox.
Go to: dmi.thomsonreuters.com/dealsintelligence
Thomson Reuters Solutions for the Deal Making Community
22