Embed Size (px)
Citation preview
SUCCESSION SOLVEDBrad Bueermann, CEO, FP Transitions
Ted Parker, GM of Advisor Lending, Live Oak Bank
PRESENTED BY
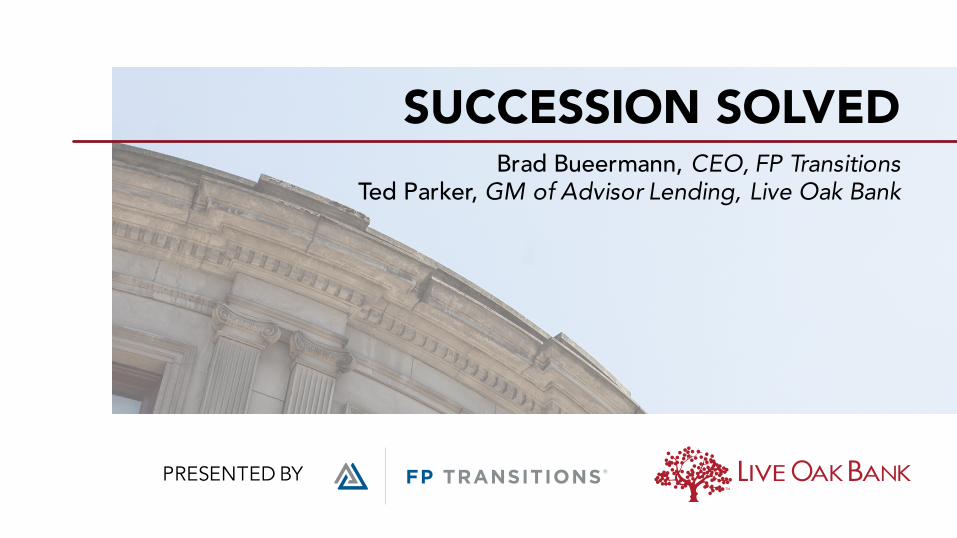
Succession is a constant topic in the industry.
Yet few founder/owners have created workable succession plans.
Attrition is the most common outcome. Why?
FP Transitions has written the book and created more than 375 Succession Plans.
SUCCESSION TALK
WHY WE NEED A SUCCESSION SOLUTION (NOT TALK)!
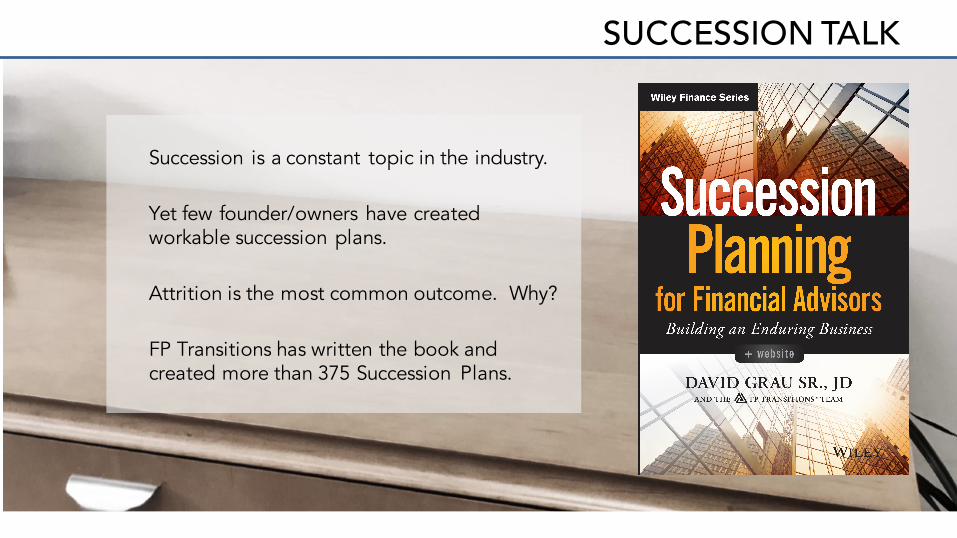
Succession discussion is often misguided.
Discussion focuses on the End not the Continuation.
PARADIGM SHOULD BE SUSTAINABILITY.
Robo advisors vs. wealth firms is not your greatest threat.
Danger is the perception of wealth management firms as ephemeral.
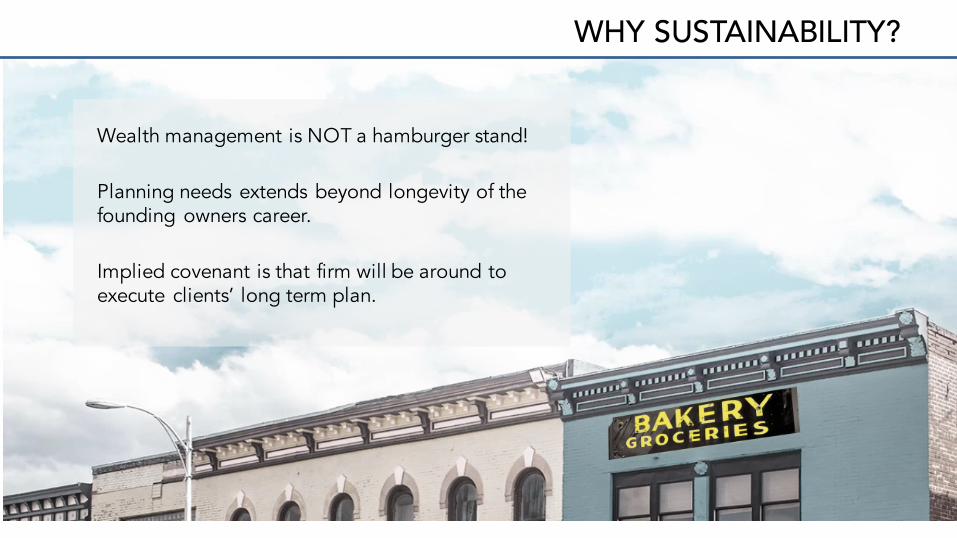
WHY SUSTAINABILITY?
Wealth management is NOT a hamburger stand!
Planning needs extends beyond longevity of the founding owners career.
Implied covenant is that firm will be around to execute clients’ long term plan.
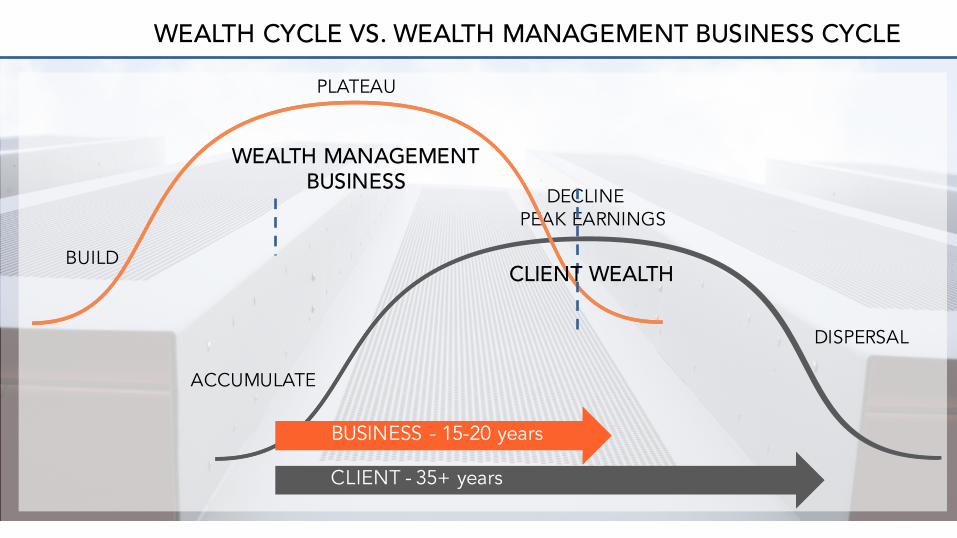
WEALTH CYCLE VS. WEALTH MANAGEMENT BUSINESS CYCLE
ACCUMULATE
PEAK EARNINGS
DISPERSAL
BUILD
DECLINE
PLATEAU
WEALTH MANAGEMENTBUSINESS
CLIENT WEALTH
BUSINESS - 15-20 years
CLIENT - 35+ years
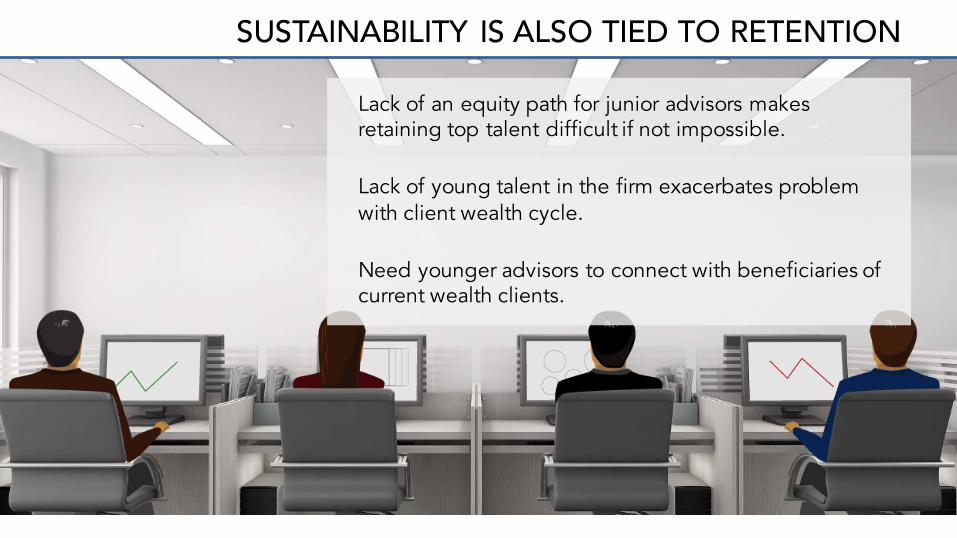
SUSTAINABILITY IS ALSO TIED TO RETENTION
Lack of an equity path for junior advisors makes retaining top talent difficult if not impossible.
Lack of young talent in the firm exacerbates problem with client wealth cycle.
Need younger advisors to connect with beneficiaries of current wealth clients.
ROADBLOCKS TO CREATING VIABLE PLANSWHY ISN’T SUSTAINABLE PLANNING WORKING?
ROADBLOCK 1 : LATE START
Start planning way too late.
When the firm is beginning or nearing decline rather than while it is strong and robust.
Succession is perceived as the “END,” rather than a “sustainability” plan and a long- term growth plan.
ROADBLOCKS TO CREATING VIABLE PLANS
Common compensation systems derived from wirehouse models
Over weights bonuses & commissions, thereby sharing “profit” with non-owners
Result: Firms lack profits and are therefore NOT “investable” enterprises
Sustainable firms must have profits
ROADBLOCK 2 : UNBALANCED COMPENSATION SYSTEMS
ROADBLOCK 3 : G2 HAS NO MONEY TO INVEST
Employees and Junior Advisors derive their income from wages and bonuses from the business and seldom have substantial savings
ROADBLOCKS TO CREATING VIABLE PLANS
SOLUTION:
RE-ENGINEER A SUSTAINABLE FIRM
CREATING THE SUSTAINABLE FIRM
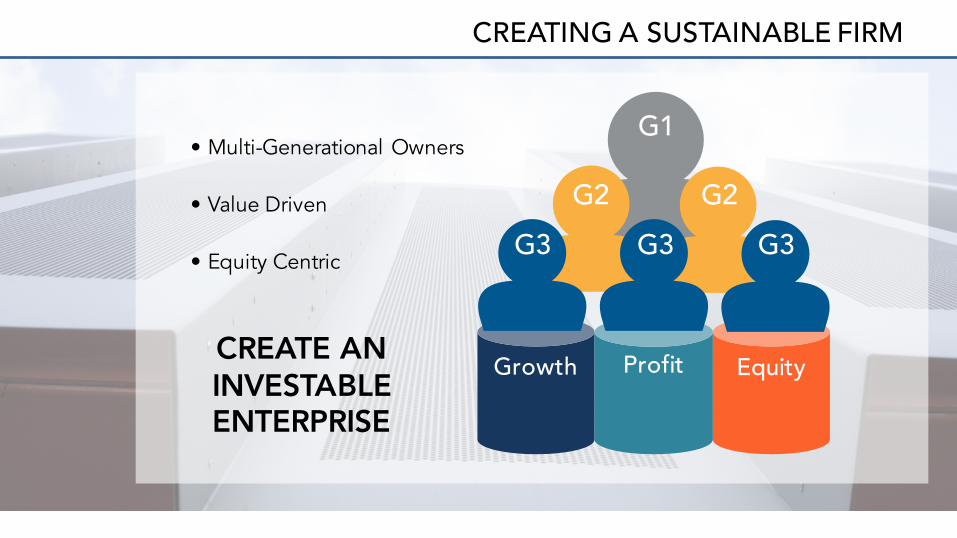
CREATING A SUSTAINABLE FIRM
• Multi-Generational Owners
• Value Driven
• Equity Centric
CREATE AN INVESTABLE ENTERPRISE
Growth Profit Equity
G1
G2 G2G3G3G3
Grow
th
20%
0%
Age
15%
5%
10%
25%
< 40 years 40 – 50 years 50 – 60 years 60 – 70 years 70+ years
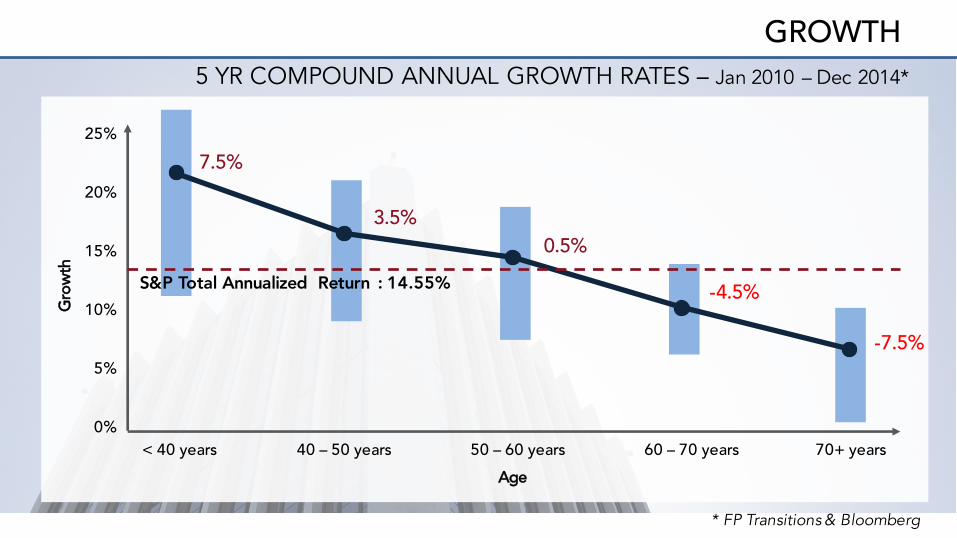
5 YR COMPOUND ANNUAL GROWTH RATES – Jan 2010 – Dec 2014*
GROWTH
S&P Total Annualized Return : 14.55%
-7.5%
-4.5%
0.5%3.5%
7.5%
* FP Transitions & Bloomberg
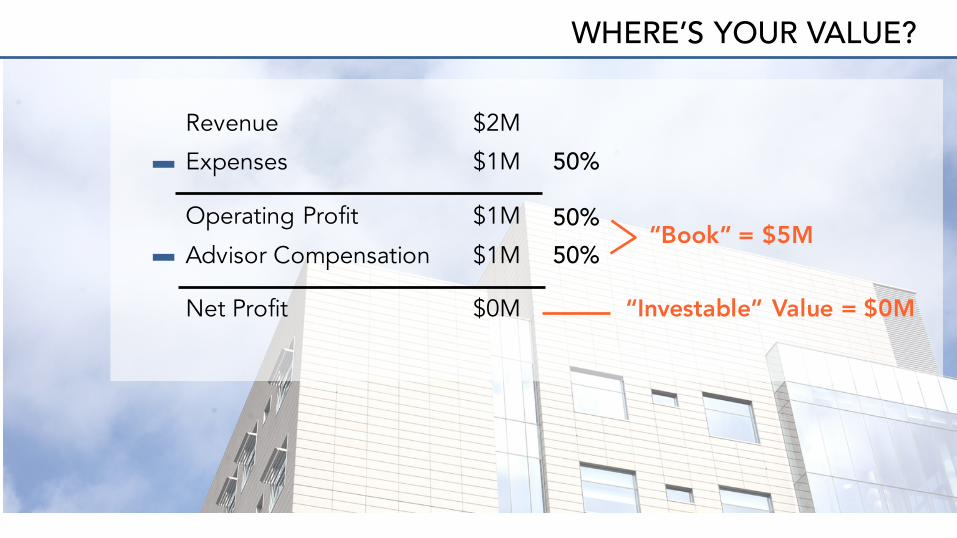
WHERE’S YOUR VALUE?
Revenue $2M
Expenses $1M
Operating Profit $1M
Advisor Compensation $1M
Net Profit $0M
50%
50%
50%“Book” = $5M
“Investable” Value = $0M
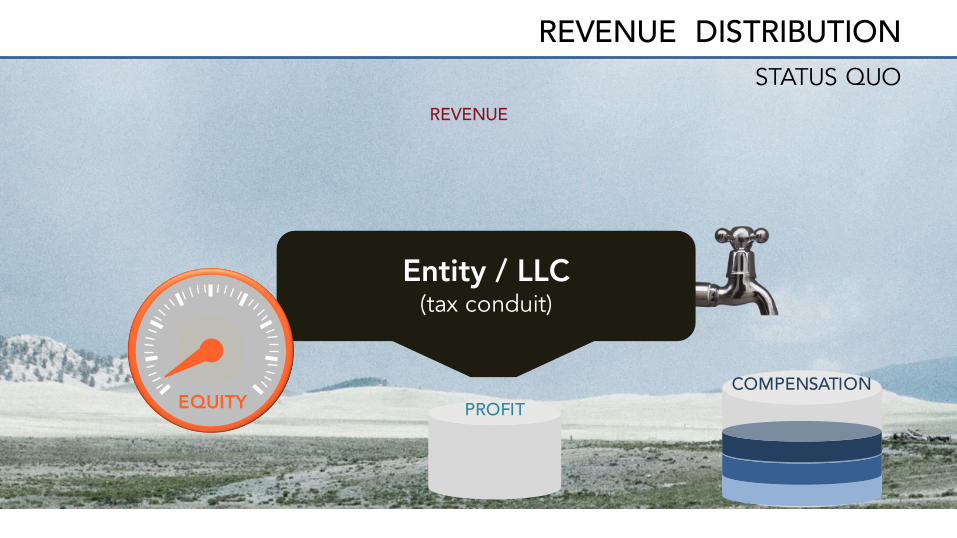
REVENUE DISTRIBUTIONSTATUS QUO
Entity / LLC(tax conduit)
EQUITY
REVENUE
COMPENSATIONPROFIT
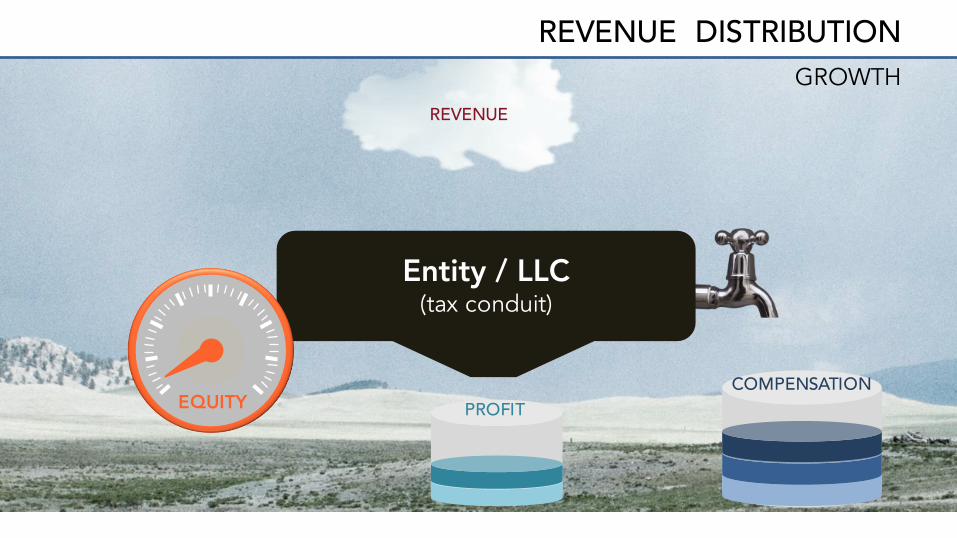
GROWTH
Entity / LLC(tax conduit)
EQUITY
REVENUE DISTRIBUTION
REVENUE
COMPENSATIONPROFIT
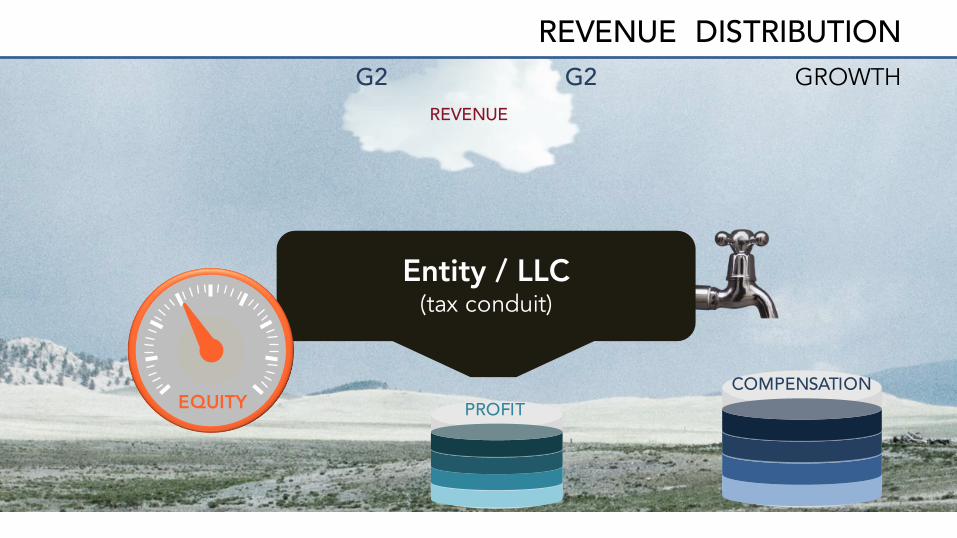
GROWTH
Entity / LLC(tax conduit)
G2 G2
EQUITYCOMPENSATION
PROFIT
REVENUE
REVENUE DISTRIBUTION
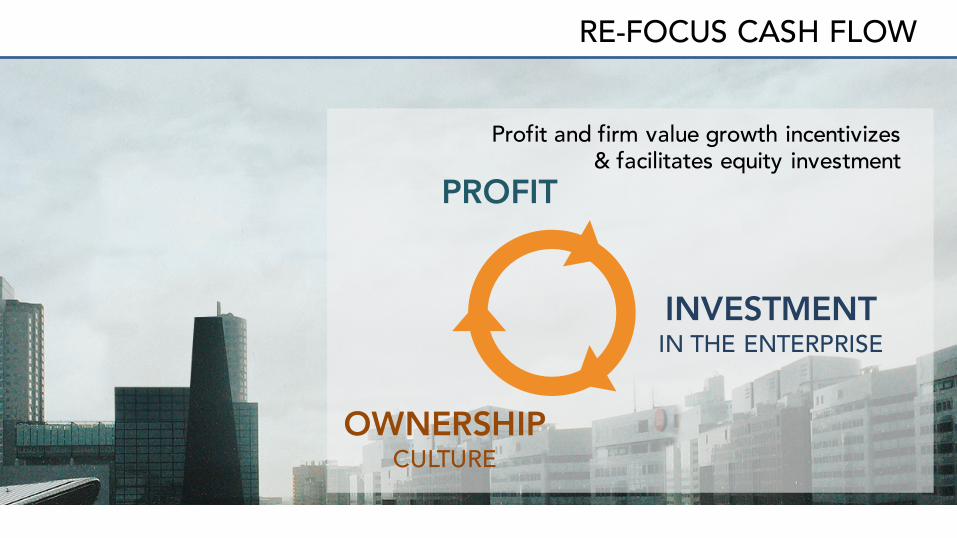
RE-FOCUS CASH FLOW
PROFIT
INVESTMENT IN THE ENTERPRISE
OWNERSHIP CULTURE
Profit and firm value growth incentivizes & facilitates equity investment
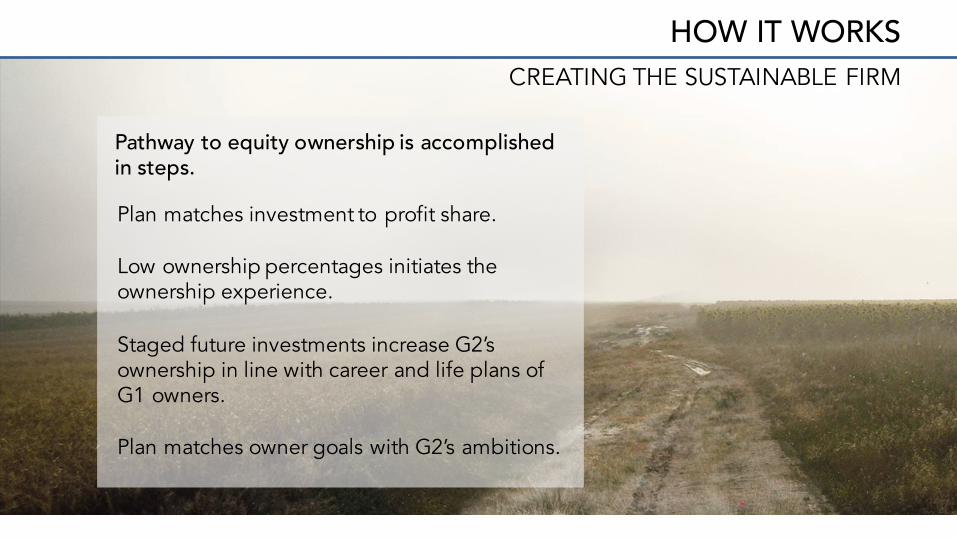
HOW IT WORKS
Pathway to equity ownership is accomplished in steps.
CREATING THE SUSTAINABLE FIRM
Plan matches investment to profit share.
Low ownership percentages initiates the ownership experience.
Staged future investments increase G2’s ownership in line with career and life plans of G1 owners.
Plan matches owner goals with G2’s ambitions.
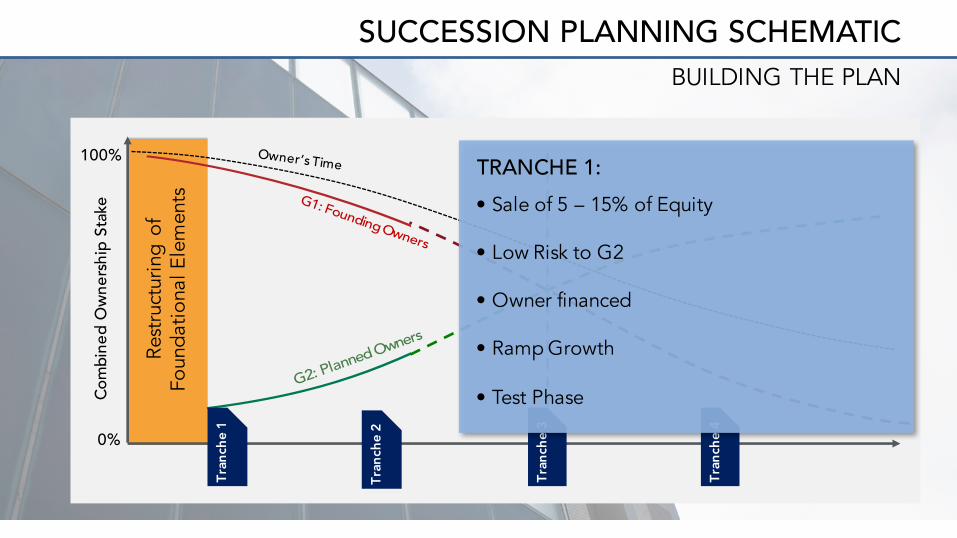
SUCCESSION PLANNING SCHEMATIC
Com
bine
d O
wner
ship
Sta
ke
100%
0%
Tran
che
2
Tran
che
1
Tran
che
3
BUILDING THE PLAN
Tran
che
4
TRANCHE 1:• Sale of 5 – 15% of Equity
• Low Risk to G2
• Owner financed
• Ramp Growth
• Test Phase
Rest
ruct
urin
g of
Foun
datio
nal E
lem
ents
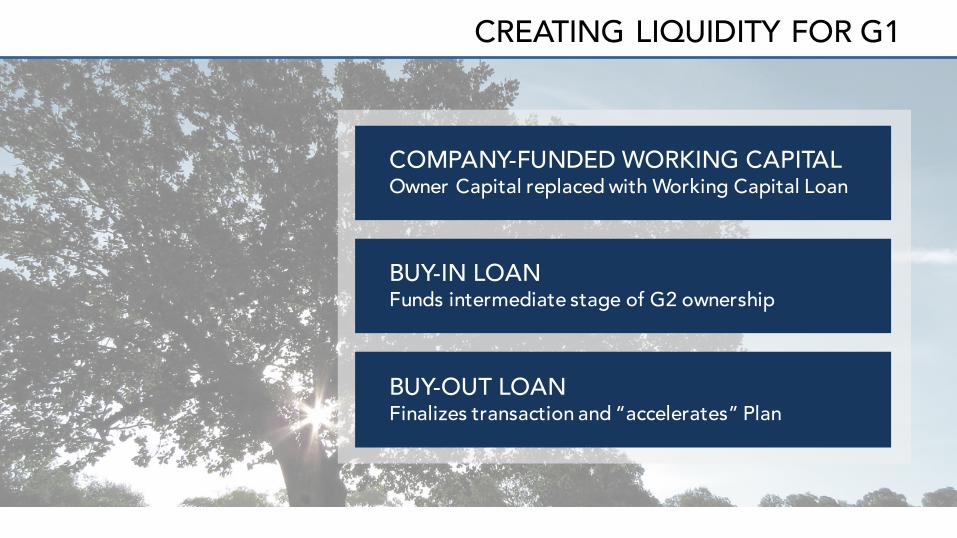
CREATING LIQUIDITY FOR G1
COMPANY-FUNDED WORKING CAPITALOwner Capital replaced with Working Capital Loan
BUY-IN LOAN Funds intermediate stage of G2 ownership
BUY-OUT LOAN Finalizes transaction and “accelerates” Plan
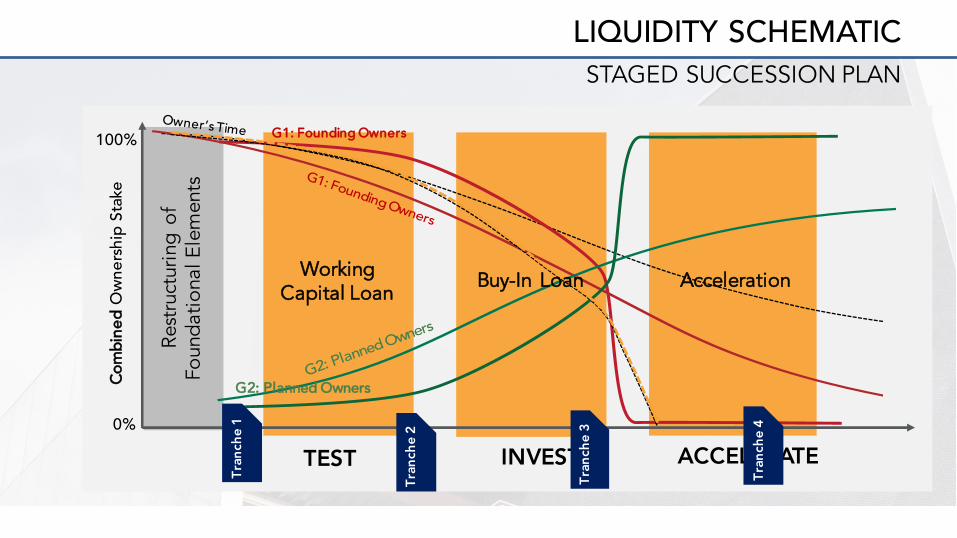
LIQUIDITY SCHEMATICSTAGED SUCCESSION PLAN
Com
bine
d O
wner
ship
Sta
ke100%
0%
G2: Planned Owners
Acceleration
G1: Founding Owners
TEST INVEST ACCELERATE
Tran
che
2
Tran
che
1
Tran
che
3
Tran
che
4
Rest
ruct
urin
g of
Foun
datio
nal E
lem
ents
Working Capital Loan
Buy-In Loan
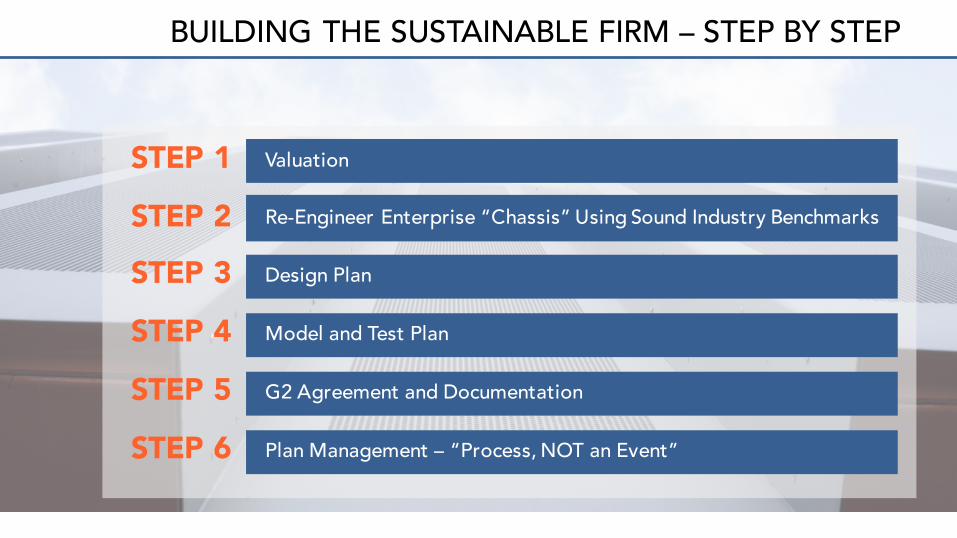
BUILDING THE SUSTAINABLE FIRM – STEP BY STEP
STEP 1
STEP 2
STEP 3
STEP 4
STEP 5
STEP 6
Valuation
Re-Engineer Enterprise “Chassis” Using Sound Industry Benchmarks
Design Plan
Model and Test Plan
G2 Agreement and Documentation
Plan Management – “Process, NOT an Event”
BRINGING THE PIECES TOGETHER
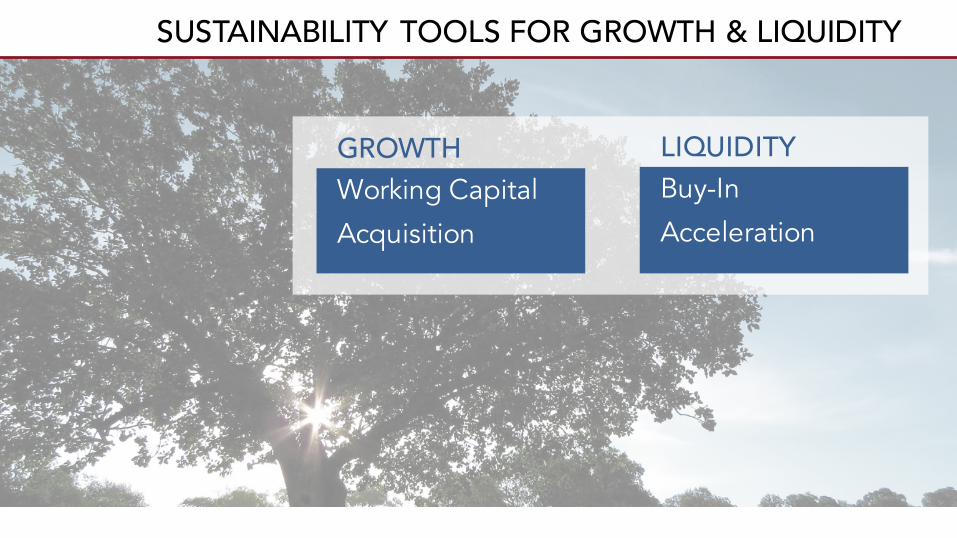
SUSTAINABILITY TOOLS FOR GROWTH & LIQUIDITY
GROWTHWorking Capital
Acquisition
LIQUIDITYBuy-In
Acceleration
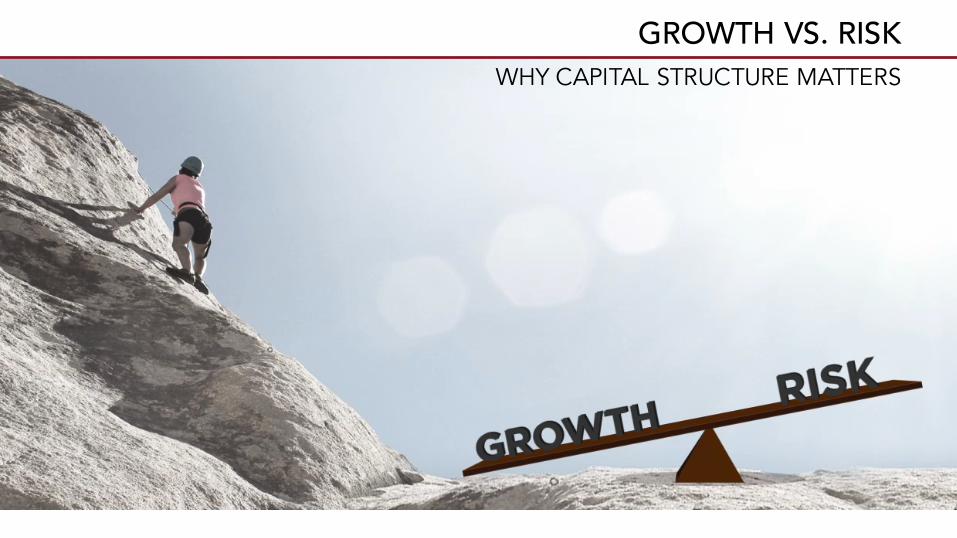
GROWTH VS. RISKWHY CAPITAL STRUCTURE MATTERS
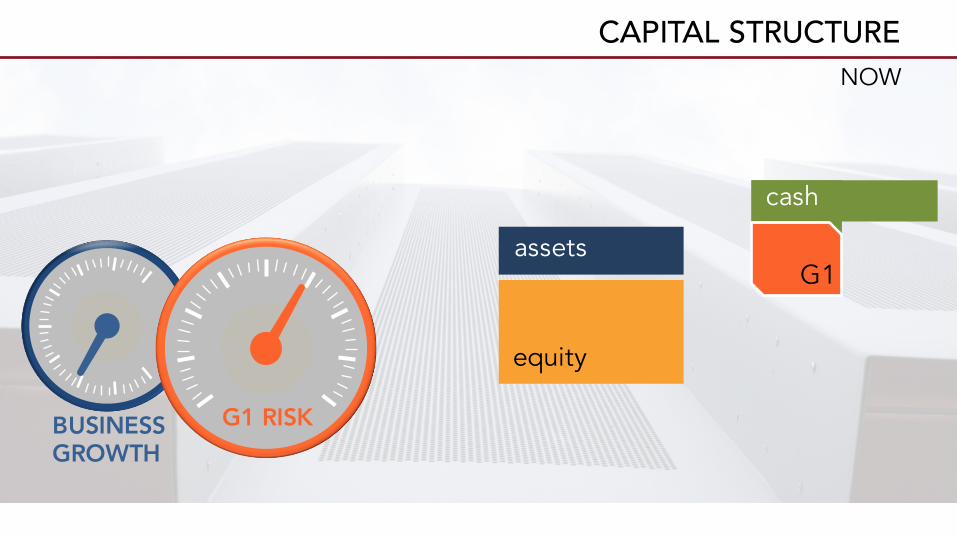
CAPITAL STRUCTURENOW
assets
equity
G1 RISKBUSINESSGROWTH
cashcash
G1
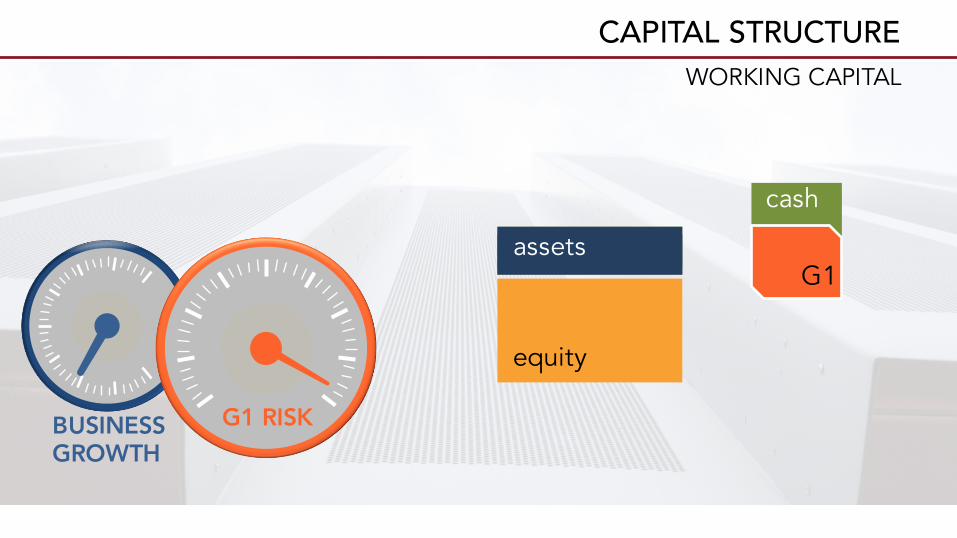
CAPITAL STRUCTUREWORKING CAPITAL
equity
cash
G1
G1 RISKBUSINESSGROWTH
cashworking cap loanassets
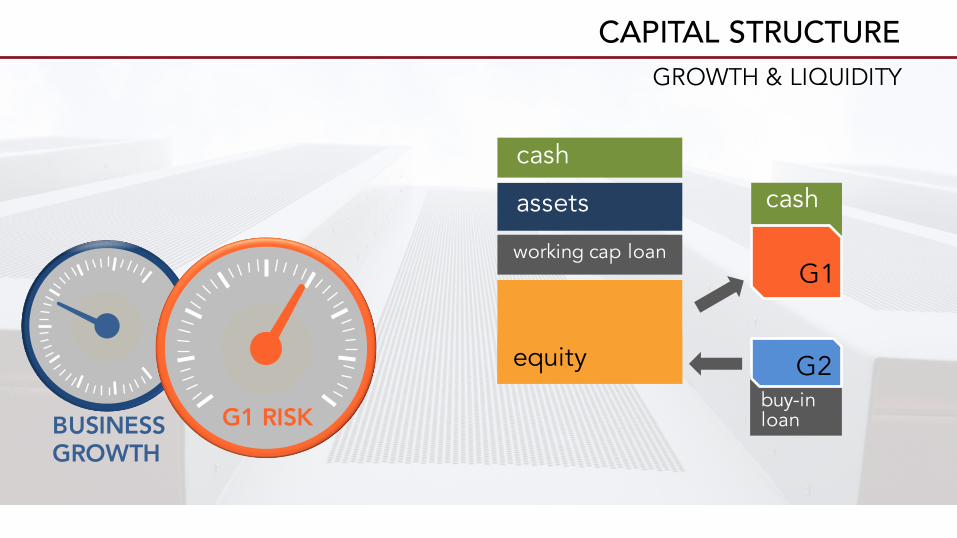
CAPITAL STRUCTUREGROWTH & LIQUIDITY
equity
cash
G1working cap loan
assets
cash
G1 RISKBUSINESSGROWTH
buy-in loan
G2
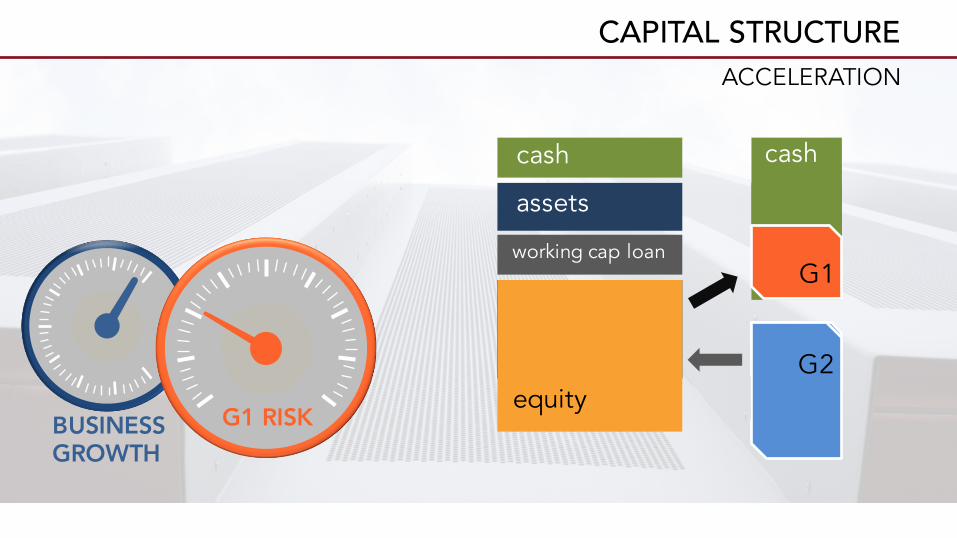
CAPITAL STRUCTUREACCELERATION
cash
G1working cap loan
assets
cash
G1 RISKBUSINESSGROWTH
acceleration loan
equity buy-in
G2
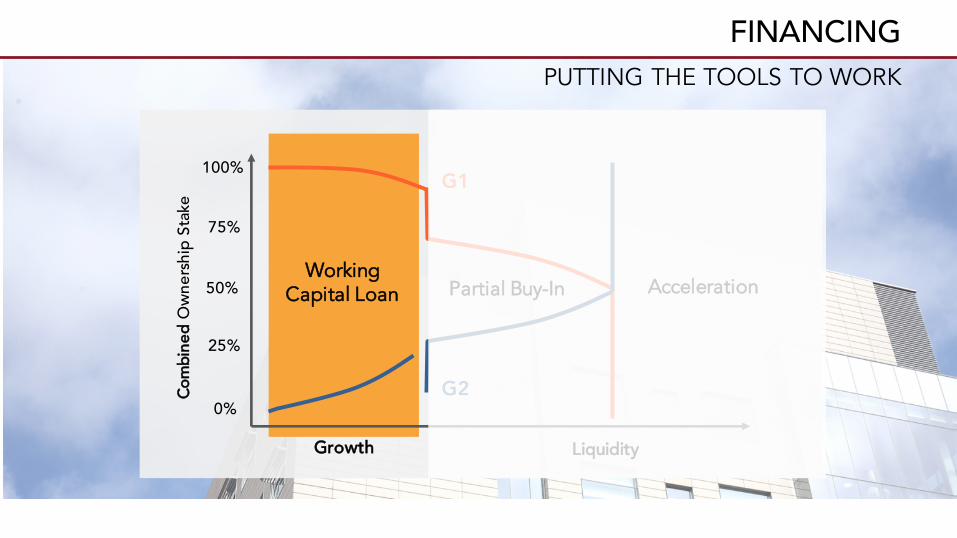
FINANCING
Working Capital Loan
Com
bine
dO
wner
ship
Sta
ke100%
0%
25%
75%
50%
LiquidityGrowth
Partial Buy-In Acceleration
G1
G2
PUTTING THE TOOLS TO WORK
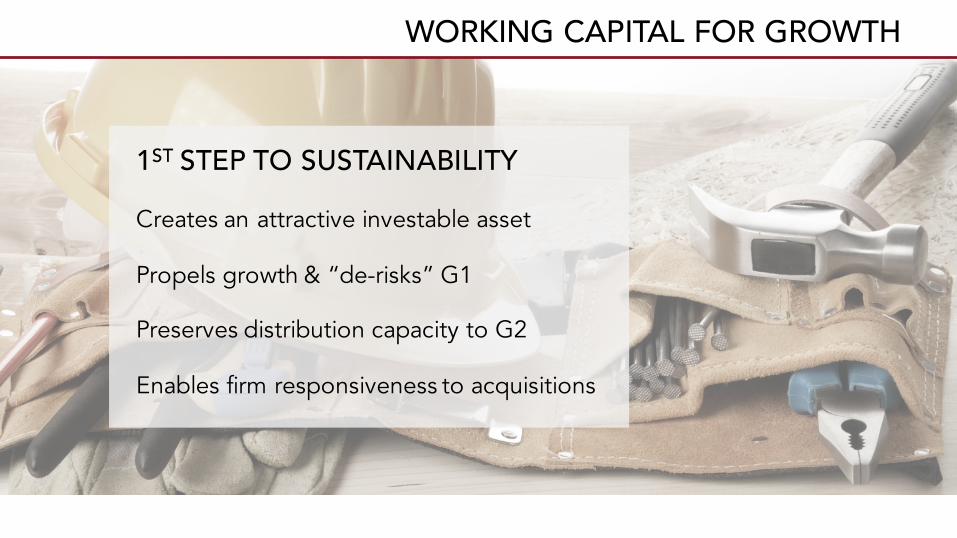
WORKING CAPITAL FOR GROWTH
1ST STEP TO SUSTAINABILITY
Creates an attractive investable asset
Propels growth & “de-risks” G1
Preserves distribution capacity to G2
Enables firm responsiveness to acquisitions
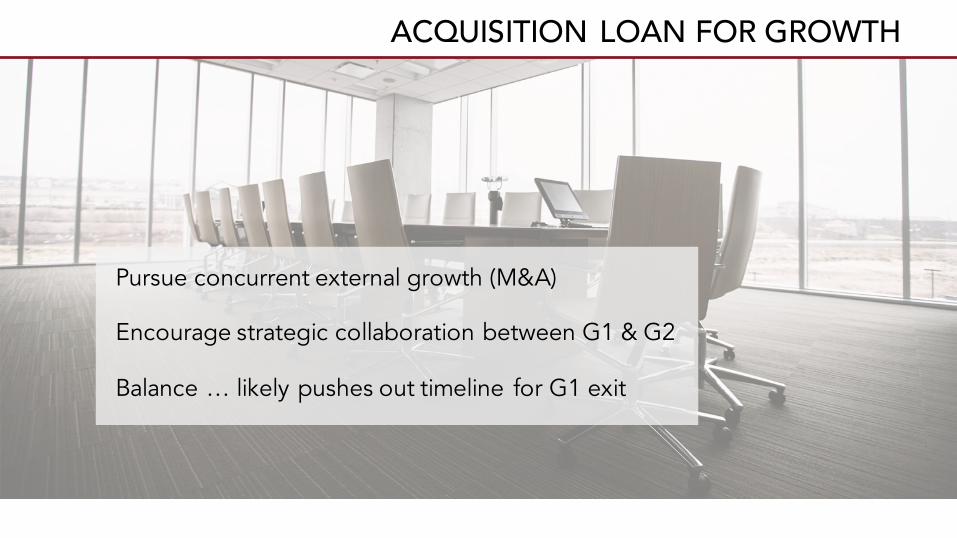
ACQUISITION LOAN FOR GROWTH
Pursue concurrent external growth (M&A)
Encourage strategic collaboration between G1 & G2
Balance … likely pushes out timeline for G1 exit
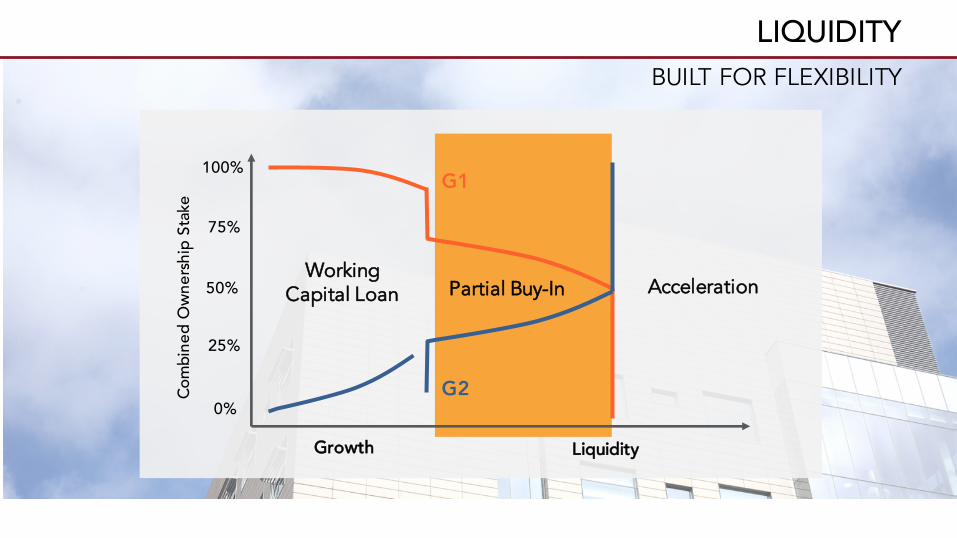
LIQUIDITY
Working Capital Loan
Com
bine
d O
wner
ship
Sta
ke100%
0%
25%
75%
50%
Growth
G1
G2
Liquidity
AccelerationPartial Buy-In
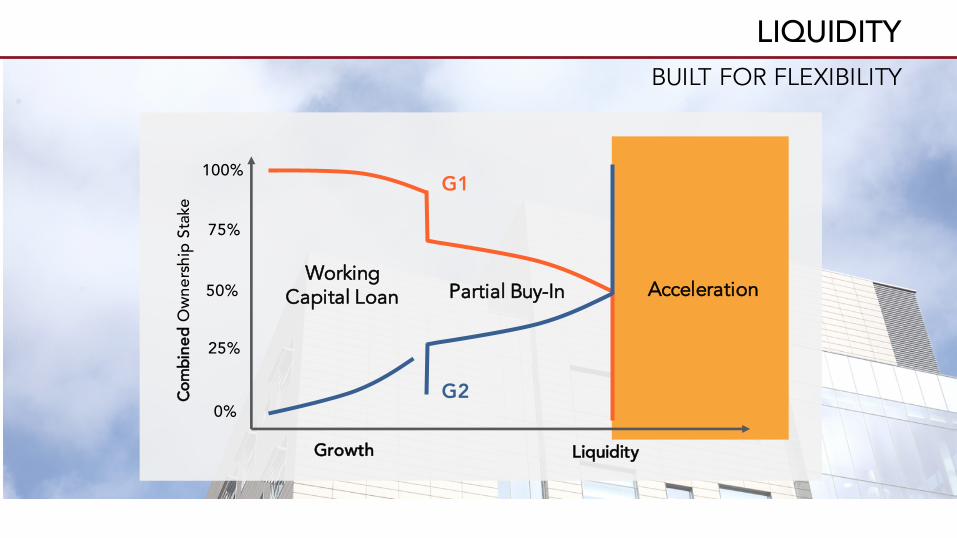
BUILT FOR FLEXIBILITY
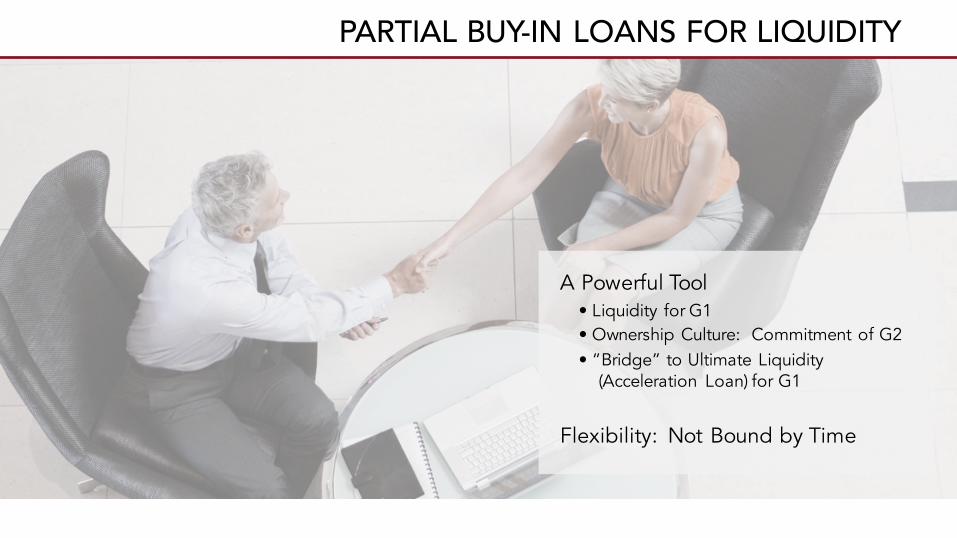
PARTIAL BUY-IN LOANS FOR LIQUIDITY
A Powerful Tool• Liquidity for G1• Ownership Culture: Commitment of G2• “Bridge” to Ultimate Liquidity
(Acceleration Loan) for G1
Flexibility: Not Bound by Time
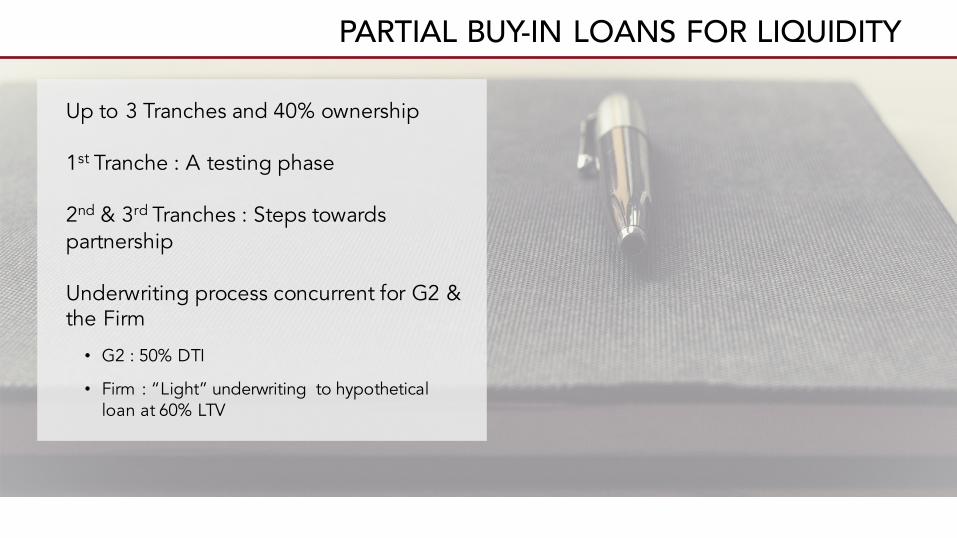
PARTIAL BUY-IN LOANS FOR LIQUIDITY
Up to 3 Tranches and 40% ownership
1st Tranche : A testing phase
2nd & 3rd Tranches : Steps towards partnership
Underwriting process concurrent for G2 & the Firm
• G2 : 50% DTI
• Firm : “Light” underwriting to hypothetical loan at 60% LTV
BUILT FOR FLEXIBILITY
LIQUIDITY
Working Capital Loan
Com
bine
dO
wner
ship
Sta
ke100%
0%
25%
75%
50%
Growth
G1
G2
Liquidity
AccelerationPartial Buy-In
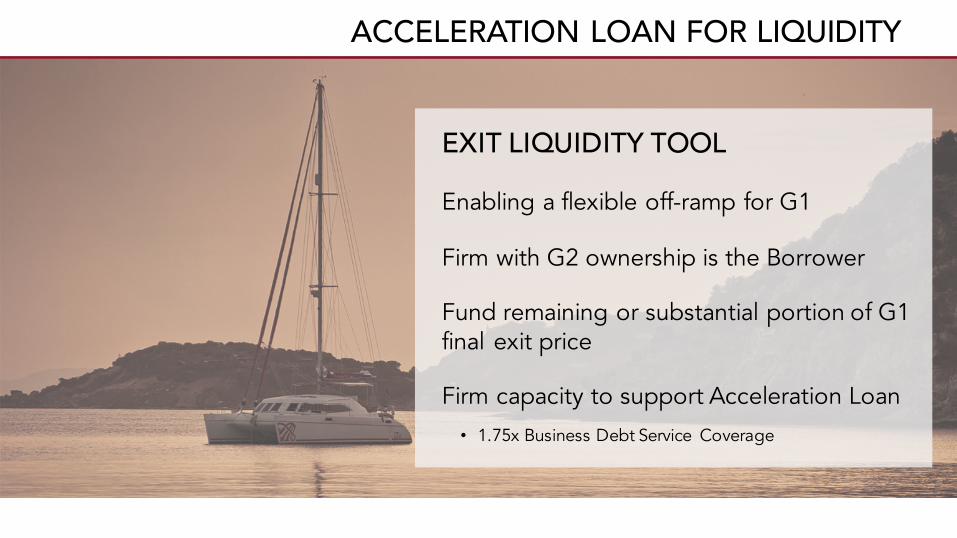
ACCELERATION LOAN FOR LIQUIDITY
EXIT LIQUIDITY TOOL
Enabling a flexible off-ramp for G1
Firm with G2 ownership is the Borrower
Fund remaining or substantial portion of G1 final exit price
Firm capacity to support Acceleration Loan
• 1.75x Business Debt Service Coverage
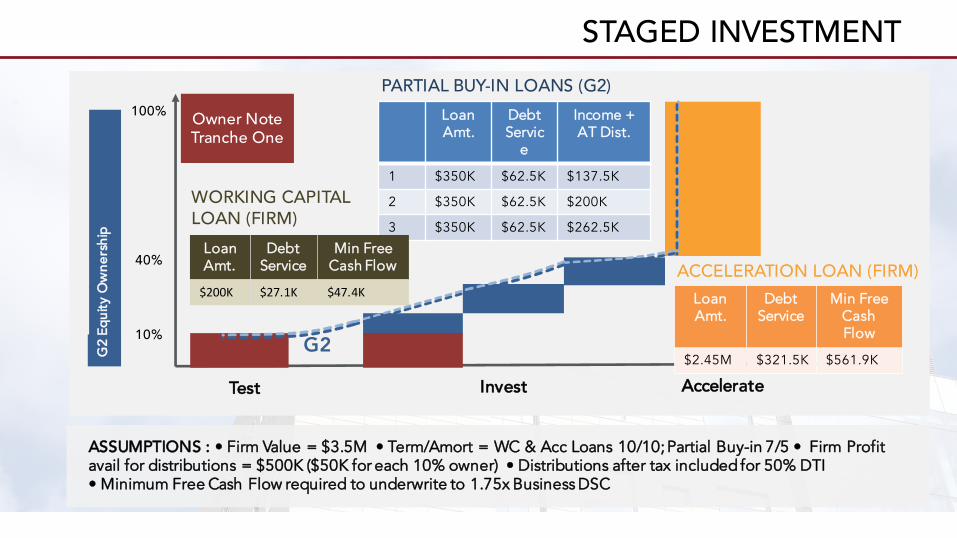
STAGED INVESTMENT
100%
40%
10%
Test
G2
Invest Accelerate
ASSUMPTIONS : • Firm Value = $3.5M • Term/Amort = WC & Acc Loans 10/10; Partial Buy-in 7/5 • Firm Profit avail for distributions = $500K ($50K for each 10% owner) • Distributions after tax included for 50% DTI • Minimum Free Cash Flow required to underwrite to 1.75x Business DSC
Owner NoteTranche One
LoanAmt.
Debt Servic
e
Income + AT Dist.
1 $350K $62.5K $137.5K
2 $350K $62.5K $200K
3 $350K $62.5K $262.5K
PARTIAL BUY-IN LOANS (G2)
LoanAmt.
Debt Service
Min Free Cash Flow
$200K $27.1K $47.4K
WORKING CAPITAL LOAN (FIRM)
LoanAmt.
Debt Service
Min Free Cash Flow
$2.45M $321.5K $561.9K
ACCELERATION LOAN (FIRM)
G2 Eq
uity O
wner
ship
THANK YOU
for more informationfptransitions.com
800.934.3303liveoakbank.com