Embed Size (px)
Citation preview

Deutsche Bank
Systematic M&A Arbitrage
April 9, 2016
Deutsche Bank does and seeks to do business with companies covered in its research reports. Thus, investors should be aware that the firm may have a conflict of interest that could affect the objectivity of this report. Investors should consider this report as only a single factor in making their investment decision. DISCLOSURES AND ANALYST CERTIFICATIONS ARE LOCATED IN APPENDIX 1. MICA(P) 072/04/2012
Global Quantitative Strategy
Yin Luo, CFA ▪ 212 250 8983 ▪ [email protected]
Managing Director & Global Head of Quantitative Strategy

Deutsche Bank
Yin Luo, CFA ▪ 1.212.250.8983 ▪ [email protected]
#1 Ranked Global Quantitative & Strategy Team
Source: gettyimages.com, Deutsche Bank Quantitative Strategy
research surveys: America #1; Europe #1; Asia #1; Fixed Income quant research #1
The US team is also top ranked in the “Accounting & Tax Policy” and” Portfolio Strategy” sectors
All our research can be accessed at: http://eqindex.db.com/gqs
1
New York
— Javed Jussa
US Head of Quantitative Strategy
— Miguel Alvarez
— Sheng Wang
— Gaurav Rohal, CFA
— Zheyin (George) Zhao
— Allen Wang
— David Elledge
Quant IT
— Sergei Khomiouk
Chile Offshore Support
— Nicolas Magunacelaya
— Joaquin Gonzalez
London
— Spyros Mesomeris, PhD
European Head of Quantitative Strategy
— Christian Davies
— Jacopo Capra
— Shuo (Alison) Qu, PhD
— Paul Ward
— James Osiol
Quant FX/Commodities
— Caio Natividade
— Vivek Anand
Hong Kong
— Khoi LeBinh
Asian Head of Quantitative Strategy
— Vincent Zoonekynd, PhD
— Ada Lau
— Hemant Sambatur
— Jiazi Tang
— Yin Luo, CFA
Global Head of Quantitative Strategy

Deutsche Bank
Yin Luo, CFA ▪ 1.212.250.8983 ▪ [email protected]
04/04/2016 15:40:54 2010 DB Blue template
— Our data set covers 40,000 M&A deals over 25 years of
history. We use merger types and moods to measure
post-announcement drift.
— We provide a model predicting the probability of a merger
going through: the MAS model.
— A multifactor model provides the expected alpha of each
merger: the MAA model.
— We find certainly characteristics of the deal have
significant impact on the duration of the transaction: the
MAD model.
— Combining the MAA, MAS and the expected duration
(MAD model) of a deal, we deliver a systematic M&A
portfolio with an annualized return of 15% and a Sharpe
ratio of 1.6x.
Abstract
2
Performance of the systematic M&A (SMA) strategy
Source: Thompson Reuters, Compustat, IBES, Russell, S&P, Deutsche Bank Quantitative Strategy
0
2
4
6
8
10
12Russell 3000
Naïve M&A strategy
Final M&A portfolio

Deutsche Bank
Yin Luo, CFA ▪ 1.212.250.8983 ▪ [email protected]
0%
10%
20%
30%
40%
50%
60%
70%
80%
90%
100%
Other Cash only Stock only Cash and stock
Source: Thompson Reuters, Compustat, IBES, Russell, S&P, Deutsche Bank Quantitative Strategy
Thomson Reuters’ Deals M&A database Number of deals of each type Percentage of each type
Percentage of each style Percentage of each mood
3
0
500
1000
1500
2000
2500
Other Cash only Stock only Cash and stock
0%
10%
20%
30%
40%
50%
60%
70%
80%
90%
100%
Stake purchases Undisclosed dollar value
Disclosed dollar value Self tenders, recaps
0%
10%
20%
30%
40%
50%
60%
70%
80%
90%
100%
Friendly Neutral Hostile Not appl. Unsolic.

Deutsche Bank
Yin Luo, CFA ▪ 1.212.250.8983 ▪ [email protected]
0.97
0.98
0.99
1.00
1.01
1.02
1.03
1.04
1.05
Deal goes through Deal fails
Post-announcementdrift
0%
10%
20%
30%
40%
50%
60%
70%
80%
90%
100%
US Mergers International Mergers
Source: Thompson Reuters, Compustat, IBES, Russell, S&P, Deutsche Bank Quantitative Strategy
Other important deal features Percentage US vs. international Average final control sought
Distribution of deal success/failure by deal age Average profit of successful deals
4
0%
10%
20%
30%
40%
50%
60%
70%
80%
90%
100%
Percentage of deals going through
0.0
0.1
0.2
0.3
0.4
0.5
0.6
0.7
0.8
0.9
1.0
Pro
po
rtio
n o
f m
erg
ers
go
ing
thro
ugh
Announcement year
Average: 61%
drops 20% during crisis
0.00
0.01
0.02
0.03
0.04
0.05
0.06
0.07
0.08
0.09
0.10
Fre
qu
en
cy
Days until deal is cancelled/closed
Deal closed successfully Deal withdrawn
Pre- and post-announcement drift
0.80
0.85
0.90
0.95
1.00
1.05
1.10
1.15
1.20
1.25
1.30
Deal goes through Deal fails
Pre-announcementdrift
Announcement jump

Deutsche Bank
Yin Luo, CFA ▪ 1.212.250.8983 ▪ [email protected]
0.0 0.1 0.2 0.3 0.4 0.5 0.6 0.7 0.8
Month
Merton's distance to default
Price-to-52 week high
Normalized abnormal volume
Target price implied return
Return on invested capital (ROIC)
Operating earnings yield, trailing 12M, Basic
Recommendation, mean
Earnings yield, FY0
Expected dividend yield
Asset turnover
Skewness, 1Y daily
12M-1M price return
Total return, 12M
Price-to-operating EPS, trailing 12M, Basic
# of days to cover short
Return on net operating assets (RNOA)
Altman's z-score
Price-to-sales, trailing 12M
Earnings yield x IBES 5Y growth
IBES FY1 EPS up/down ratio, 1M
Barry ratio
Factor strength
Fact
or
nam
e
5
Factor strength in predicting merger success (red = dec. blue = inc.)
— A logit model predicts eventual success of deal each month. This is done on the most up-to-date information set
of that month over the point-in-time population of merger targets to avoid any look ahead bias.
— Fully dynamic. Probability reflects both the age of the deal, and its deteriorating or improving fundamental
characteristics.
Dynamic prediction of M&A success: the MAS model
Factor strength evolution over time
Source: Thompson Reuters, Compustat, IBES, Russell, S&P, Deutsche Bank Quantitative Strategy
-1.0
-0.8
-0.6
-0.4
-0.2
0.0
0.2
0.4
0.6
Fact
or
Stre
ngt
h
Calibration year (expanding window)
Month
Merton's distance to default
Price-to-52 week high
Normalized abnormal volume
Target price implied return
Return on invested capital (ROIC)
Operating earnings yield, trailing 12M, Basic
Recommendation, mean
Earnings yield, FY0
Expected dividend yield

Deutsche Bank
Yin Luo, CFA ▪ 1.212.250.8983 ▪ [email protected]
MAS model with M&A type, style and mood
6
The impact of deal type, style and mood on the transaction success probability
Other useful factors
— Factors such as deal type, style, and mood are not included in the MAS model, because these factors may
change over time and are sometimes backfilled, which leads to potential look-ahead bias.
— It is interesting to see that deals with undisclosed value, hostile takeovers, and unsolicited transactions have
much higher failure rates.
Source: Thompson Reuters, Compustat, IBES, Russell, S&P, Deutsche Bank Quantitative Strategy
-5
-4
-3
-2
-1
0
1

Deutsche Bank
Yin Luo, CFA ▪ 1.212.250.8983 ▪ [email protected]
MAS performance
— Bold range of predictions as the model
commonly boasts out-of-sample convictions
ranging from 10% to 90%
— Accurate predictions where the predicted
probability matches the out-of-sample frequency
of success
— Positive alpha as screening out deals likely to fail
improves merger arbitrage performance
7
Estimated vs realized success frequencies Performance for above and below median probability of success
Distribution of MAS predictions
Source: Thompson Reuters, Compustat, IBES, Russell, S&P, Deutsche Bank Quantitative Strategy
0
200
400
600
800
1000
1200
1400
1600
Nu
mb
er
of
dat
a p
oin
ts
Estimated probability of success
y = 0.8809x + 0.1554R² = 0.9493
0.00
0.10
0.20
0.30
0.40
0.50
0.60
0.70
0.80
0.90
1.00
0.00 0.20 0.40 0.60 0.80 1.00
Re
aliz
ed
fre
qu
en
cy o
f su
cce
ss
Estimated probability of success
0.96
0.97
0.98
0.99
1
1.01
1.02
1.03
low probability of success high probability of success

Deutsche Bank
Yin Luo, CFA ▪ 1.212.250.8983 ▪ [email protected]
0 0.05 0.1 0.15 0.2 0.25 0.3 0.35 0.4 0.45 0.5
Mood: Hostile
Mood: Not Appl.
month
Type: Cash only
Price-to-52 week high
Return on invested capital (ROIC)
Return on Asset
Valuation spread
80
90
100
110
120
130
140
150
160
170
1 2 3 4 5 6 7 8 9 10 11 12
Exp
ect
ed
re
mai
nin
g d
ura
tio
n in
day
s
Age of deal in months
-0.6
-0.5
-0.4
-0.3
-0.2
-0.1
0.0
0.1
0.2
1 2 3 4 5 6 7 8 9 10 11 12
Z-sc
ore
fac
tor
valu
e
Age of deal in months
Price-to-52 week low YoY change in # of shares outstanding
IBES 5Y EPS growth Price to book ratio
Long-term debt/equity
0.0
0.1
0.2
0.3
0.4
0.5
0.6
0.7
1 2 3 4 5 6 7 8 9 10 11 12
Ave
rage
pro
bab
ility
of
goin
g th
rou
gh
Age of deal in months
Source: Thompson Reuters, Compustat, IBES, Russell, S&P, Deutsche Bank Quantitative Strategy
The impact of age: the deal duration MAD model Probability of success as a function of age Fundamentals deteriorate as the deal ages
Remaining duration as a function of deal age – four-month is the
critical value Factor coefficients for a Cox survival model (red = long; blue = short)
8

Deutsche Bank
Yin Luo, CFA ▪ 1.212.250.8983 ▪ [email protected]
The takeover target universe
9
M&A universe outperforms the market over the long run
Plain vanilla risk arbitrage strategy as our benchmark
— All M&A targets that are in the Russell 3000 universe at the
announcement date
— Close our trade when the deal closes successfully or when is withdrawn,
with a maximum holding period of one year
— Monthly rebalance – a stock enters the M&A universe at the closest month
end after its announcement date
— Long only, no leverage, fully invested
Coverage of the M&A universe
0
50
100
150
200
250
1
10
100
Russell 3000
M&A universe
Source: Thompson Reuters, Compustat, IBES, Russell, S&P, Deutsche Bank Quantitative Strategy
Sharpe ratio
0.0
0.1
0.2
0.3
0.4
0.5
0.6
0.7
0.8
0.9
1.0
Russell 3000 M&A universe
Deutsche Bank
Yin Luo, CFA ▪ 1.212.250.8983 ▪ [email protected] 10
Annualized return
— For M&A transactions involving acquirer’s stocks, a long-only strategy takes significant unnecessary risk. For
the stock deals, risk arbitrageurs would long the target company shares and short the acquire company
stocks. The hedge ratio on the short side is calculated based on the deal structure.
— Similar to the naïve long-only risk arbitrage strategy, we weight each deal by the market cap of the target
companies at every month end. For the stock deals in which the acquire companies are also in the Russell
3000 iIndex, we short the acquirer company using the appropriate hedge ratio. If a stock deal closes
successfully or is withdrawn within a month, both the long and the short positions are closed intra month, on
the same day. Otherwise, the positions are rebalanced at the end of each month.
A naïve long/short risk arbitrage strategy
Sharpe ratio
Source: Thompson Reuters, Compustat, IBES, Russell, S&P, Deutsche Bank Quantitative Strategy
0%
2%
4%
6%
8%
10%
12%
14%
16%
Long only Long/short
0.0
0.1
0.2
0.3
0.4
0.5
0.6
0.7
0.8
0.9
1.0
Long only Long/short

Deutsche Bank
Yin Luo, CFA ▪ 1.212.250.8983 ▪ [email protected]
-80%
-60%
-40%
-20%
0%
20%
40%
60%
80%Rank IC
12 month average
Avg = 7.60%Min = -47%Max = 64%Avg/Std.Dev.= 0.41
0%
2%
4%
6%
8%
10%
12%
14%
16%
1 2 3 4 5 6 7 8 9 10 11 12 M&A
Source: Thompson Reuters, Compustat, IBES, Russell, S&P, TAQ, Deutsche Bank Quantitative Strategy
Multifactor M&A alpha: the MAA model Common quant factors also predict the returns of takeover targets (IC) The MAA model strongly predicts the future return of targets (IC)
Forecasting power as a function of forecasting horizon Investing in deals with strong alpha based on the MAA model
11
0%
1%
2%
3%
4%
5%
6%
7%
0
1
2
3
4
5
6
7
8
9M&A universe
MAS model
MAA model

Deutsche Bank
Yin Luo, CFA ▪ 1.212.250.8983 ▪ [email protected] 12
Average bias statistic: realized future risk / historical volatility
— Equity risk model (i.e., the covariance matrix) is generally estimated based on historical data (returns and factors).
— For takeover target companies, however, the future risk is more of a binary issues – if the deals close on their
original terms, the risk tends to be fairly minimal; on the other hand, if the deals break up, the downside risk is
tremendous.
— Our MAS model predicts deal success probability and can significantly improve deal risk estimation.
— We use the bias statistic to measure the accuracy of our risk prediction. The bias statistic is the ratio of realized risk
and predicted risk. A perfect risk model should have a bias statistic close to 1.0.
Using the MAS model to improve deal risk estimation
The higher the deal success probability, the lower realized risk,
@COR(model scores, bias statistic)
Source: Thompson Reuters, Compustat, IBES, Russell, S&P, Deutsche Bank Quantitative Strategy
0.00
0.50
1.00
1.50
2.00
2.50M&A universe
Russell 3000
-80%
-60%
-40%
-20%
0%
20%
40%
60%
80%
MAS model MAA model
)exp( ,,, tititi pVolNewVol

Deutsche Bank
Yin Luo, CFA ▪ 1.212.250.8983 ▪ [email protected]
Source: Thompson Reuters, Compustat, IBES, Russell, S&P, Deutsche Bank Quantitative Strategy
More sophisticated portfolio construction technique – risk parity
Sharpe ratio Max drawdown
13
— More sophisticated portfolio construction techniques can further improve performance
— Equally weighted MAA: in this portfolio, we simply equally weight all takeover targets ranked in the top
half by the MAA model;
— Inverse volatility: for the same target stocks, we apply the inverse volatility weighting scheme;
— Risk parity – sample covariance matrix: we weight the same target firms, using the risk parity algorithm.
The covariance matrix is based on sample return data.
— Risk parity – MAS matrix: we weight the same target companies, using the risk parity scheme.
However, we adjust the covariance matrix using our MAS model.
— Weighting stocks by inverse volatility helps, while taking into account of correlation (risk parity) further
improves performance. Lastly, our MAS-adjusted covariance matrix boosts return and cuts down risk.
0.0
0.2
0.4
0.6
0.8
1.0
1.2
1.4
Equally weighted MAA
Inverse volatility Risk parity - sample covariance matrix
Risk parity - MAS matrix
-50%
-45%
-40%
-35%
-30%
-25%
-20%
-15%
-10%
-5%
0%
Equally weighted MAA
Inverse volatility Risk parity - sample covariance matrix
Risk parity - MAS matrix
Deutsche Bank
Yin Luo, CFA ▪ 1.212.250.8983 ▪ [email protected]
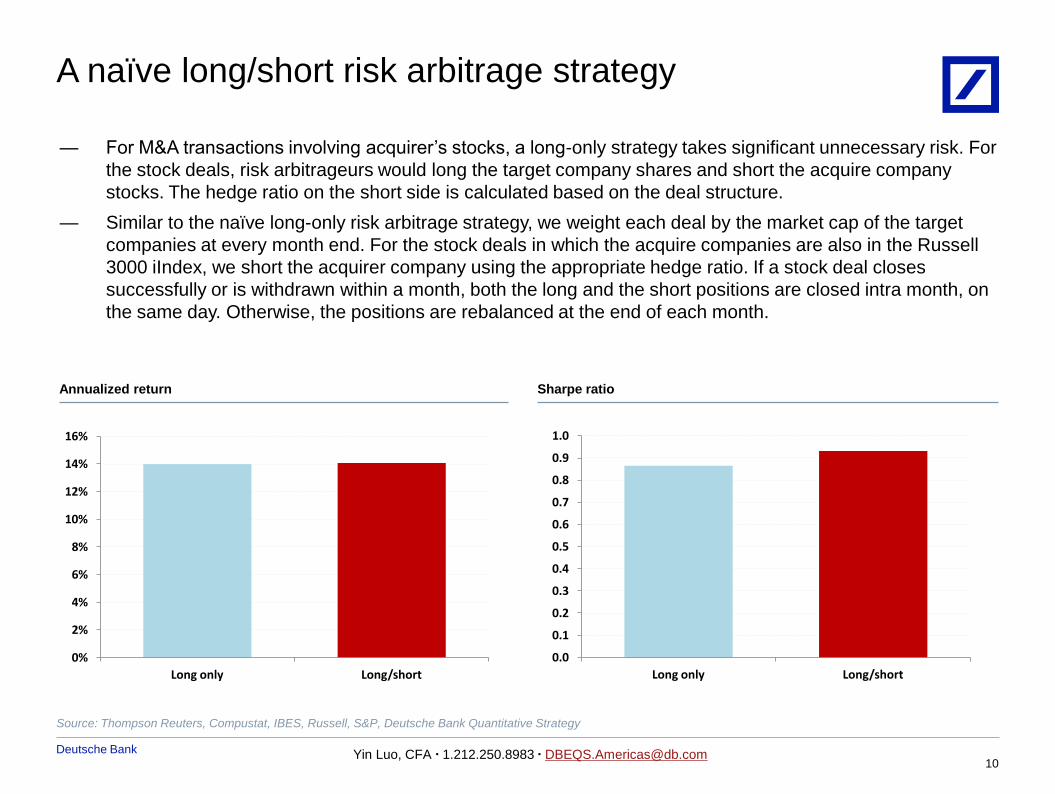
The final systematic M&A (SMA) portfolio
— Start with the universe of targets of all US target
companies in the Russell 3000 index
— Use the MAA model and adjust the expected alpha by
the expected duration from the MAD model for a
duration-adjusted alpha signal
— Use the MAS model to predict the deal success
probability, which is then used to improve our
covariance matrix estimation
— Finally, we apply a mean-variance optimization to
construct our systematic M&A arbitrage (SMA) portfolio
14
Max drawdown
Sharpe ratio
Annualized returns
Source: Thompson Reuters, Compustat, IBES, Russell, S&P, Deutsche Bank Quantitative Strategy
www ''
0.00
0.20
0.40
0.60
0.80
1.00
1.20
1.40
An
nu
aliz
ed
Sh
arp
e
Strategies
0%2%4%6%8%
10%12%14%16%
An
nu
aliz
ed
me
an r
etu
rns
Strategies -70%
-60%
-50%
-40%
-30%
-20%
-10%
0%M
axim
um
dra
wd
ow
n
Strategies

Deutsche Bank
Yin Luo, CFA ▪ 1.212.250.8983 ▪ [email protected]
04/04/2016 15:40:58 2010 DB Blue template
Appendix 1 Important Disclosures Additional Information Available upon Request
DOUBLE CLICK IN
For disclosures pertaining to recommendations or estimates made on securities other than the primary subject of this research, please see the
most recently published company report or visit our global disclosure look-up page on our website at
http://gm.db.com/ger/disclosure/DisclosureDirectory.eqsr
15

Deutsche Bank
Yin Luo, CFA ▪ 1.212.250.8983 ▪ [email protected]
Special Disclosures N/A
Analyst Certification
The views expressed in this report accurately reflect the personal views of the undersigned lead analyst(s). In addition, the
undersigned lead analyst(s) has not and will not receive compensation for providing a specific recommendation or view in this report.
[Yin Luo]
Hypothetical Disclaimer
Backtested, hypothetical or simulated performance results discussed herein have inherent limitations. Unlike an actual performance
record based on trading actual client portfolios, simulated results are achieved by means of the retroactive application of a backtested
model itself designed with the benefit of hindsight. Taking into account historical events the backtesting of performance also differs
from actual account performance because an actual investment strategy may be adjusted any time, for any reason, including a
response to material, economic or market factors. The backtested performance includes hypothetical results that do not reflect the
reinvestment of dividends and other earnings or the deduction of advisory fees, brokerage or other commissions, and any other
expenses that a client would have paid or actually paid. No representation is made that any trading strategy or account will or is likely
to achieve profits or losses similar to those shown. Alternative modeling techniques or assumptions might produce significantly different
results and prove to be more appropriate. Past hypothetical backtest results are neither an indicator nor guarantee of future returns.
Actual results will vary, perhaps materially, from the analysis.
16

Deutsche Bank
Yin Luo, CFA ▪ 1.212.250.8983 ▪ [email protected]
Regulatory Disclosures 1. Important Additional Conflict Disclosures Aside from within this report, important conflict disclosures can also be found at https://gm.db.com/equities under the “Disc losures Lookup” and “Legal” tabs. Investors are strongly encouraged to review this information before investing.
2. Short-Term Trade Ideas Deutsche Bank equity research analysts sometimes have shorter-term trade ideas (known as SOLAR ideas) that are consistent or inconsistent with Deutsche Bank’s existing longer term ratings. These trade ideas can be found at the SOLAR link at http://gm.db.com.
3. Country-Specific Disclosures Australia & New Zealand: This research, and any access to it, is intended only for "wholesale clients" within the meaning of the Australian Corporations Act and New Zealand Financial Advisors Act respectively. EU countries: Disclosures relating to our obligations under MiFiD can be found at http://www.globalmarkets.db.com/riskdisclosures. Japan: Disclosures under the Financial Instruments and Exchange Law: Company name - Deutsche Securities Inc. Registration number - Registered as a financial instruments dealer by the Head of the Kanto Local Finance Bureau (Kinsho) No. 117. Member of associations: JSDA, Type II Financial Instruments Firms Association, The Financial Futures Association of Japan, Japan Investment Advisers Association. Commissions and risks involved in stock transactions - for stock transactions, we charge stock commissions and consumption tax by multiplying the transaction amount by the commission rate agreed with each customer. Stock transactions can lead to losses as a result of share price fluctuations and other factors. Transactions in foreign stocks can lead to additional losses stemming from foreign exchange fluctuations. "Moody's", "Standard & Poor's", and "Fitch" mentioned in this report are not registered credit rating agencies in Japan unless “Japan” or "Nippon" is specifically designated in the name of the entity. Russia: This information, interpretation and opinions submitted herein are not in the context of, and do not constitute, any appraisal or evaluation activity requiring a license in the Russian Federation.
17

Deutsche Bank
Yin Luo, CFA ▪ 1.212.250.8983 ▪ [email protected]
Global Disclaimer The information and opinions in this report were prepared by Deutsche Bank AG or one of its affiliates (collectively "Deutsche Bank"). The information herein is believed to be reliable and has been obtained from public sources believed to be reliable. Deutsche Bank makes no representation as to the accuracy or completeness of such information.
Deutsche Bank may engage in securities transactions, on a proprietary basis or otherwise, in a manner inconsistent with the view taken in this research report. In addition, others within Deutsche Bank, including strategists and sales staff, may take a view that is inconsistent with that taken in this research report.
Opinions, estimates and projections in this report constitute the current judgement of the author as of the date of this report. They do not necessarily reflect the opinions of Deutsche Bank and are subject to change without notice. Deutsche Bank has no obligation to update, modify or amend this report or to otherwise notify a recipient thereof in the event that any opinion, forecast or estimate set forth herein, changes or subsequently becomes inaccurate. Prices and availability of financial instruments are subject to change without notice. This report is provided for informational purposes only. It is not an offer or a solicitation of an offer to buy or sell any financial instruments or to participate in any particular trading strategy. Target prices are inherently imprecise and a product of the analyst judgement.
As a result of Deutsche Bank’s March 2010 acquisition of BHF-Bank AG, a security may be covered by more than one analyst within the Deutsche Bank group. Each of these analysts may use differing methodologies to value the security; as a result, the recommendations may differ and the price targets and estimates of each may vary widely.
In August 2009, Deutsche Bank instituted a new policy whereby analysts may choose not to set or maintain a target price of certain issuers under coverage with a Hold rating. In particular, this will typically occur for "Hold" rated stocks having a market cap smaller than most other companies in its sector or region. We believe that such policy will allow us to make best use of our resources. Please visit our website at http://gm.db.com to determine the target price of any stock.
The financial instruments discussed in this report may not be suitable for all investors and investors must make their own informed investment decisions. Stock transactions can lead to losses as a result of price fluctuations and other factors. If a financial instrument is denominated in a currency other than an investor's currency, a change in exchange rates may adversely affect the investment.
All prices are those current at the end of the previous trading session unless otherwise indicated. Prices are sourced from local exchanges via Reuters, Bloomberg and other vendors. Data is sourced from Deutsche Bank and subject companies.
Past performance is not necessarily indicative of future results. Deutsche Bank may with respect to securities covered by this report, sell to or buy from customers on a principal basis, and consider this report in deciding to trade on a proprietary basis.
Derivative transactions involve numerous risks including, among others, market, counterparty default and illiquidity risk. The appropriateness or otherwise of these products for use by investors is dependent on the investors' own circumstances including their tax position, their regulatory environment and the nature of their other assets and liabilities and as such investors should take expert legal and financial advice before entering into any transaction similar to or inspired by the contents of this publication. Trading in options involves risk and is not suitable for all investors. Prior to buying or selling an option investors must review the "Characteristics and Risks of Standardized Options," at http://www.theocc.com/components/docs/riskstoc.pdf If you are unable to access the website please contact Deutsche Bank AG at +1 (212) 250-7994, for a copy of this important document.
The risk of loss in futures trading, foreign or domestic, can be substantial. As a result of the high degree of leverage obtainable in futures trading, losses may be incurred that are greater than the amount of funds initially deposited.
Unless governing law provides otherwise, all transactions should be executed through the Deutsche Bank entity in the investor's home jurisdiction. In the U.S. this report is approved and/or distributed by Deutsche Bank Securities Inc., a member of the NYSE, the NASD, NFA and SIPC. In Germany this report is approved and/or communicated by Deutsche Bank AG Frankfurt authorized by the BaFin. In the United Kingdom this report is approved and/or communicated by Deutsche Bank AG London, a member of the London Stock Exchange and regulated by the Financial Services Authority for the conduct of investment business in the UK and authorized by the BaFin. This report is distributed in Hong Kong by Deutsche Bank AG, Hong Kong Branch, in Korea by Deutsche Securities Korea Co. This report is distributed in Singapore by Deutsche Bank AG, Singapore Branch or Deutsche Securities Asia Limited, Singapore Branch, and recipients in Singapore of this report are to contact Deutsche Bank AG, Singapore Branch or Deutsche Securities Asia Limited, Singapore Branch in respect of any matters arising from, or in connection with, this report. Where this report is issued or promulgated in Singapore to a person who is not an accredited investor, expert investor or institutional investor (as defined in the applicable Singapore laws and regulations), Deutsche Bank AG, Singapore Branch or Deutsche Securities Asia Limited, Singapore Branch accepts legal responsibility to such person for the contents of this report. In Japan this report is approved and/or distributed by Deutsche Securities Inc. The information contained in this report does not constitute the provision of investment advice. In Australia, retail clients should obtain a copy of a Product Disclosure Statement (PDS) relating to any financial product referred to in this report and consider the PDS before making any decision about whether to acquire the product. Deutsche Bank AG Johannesburg is incorporated in the Federal Republic of Germany (Branch Register Number in South Africa: 1998/003298/10). Additional information relative to securities, other financial products or issuers discussed in this report is available upon request. This report may not be reproduced, distributed or published by any person for any purpose without Deutsche Bank's prior written consent. Please cite source when quoting.
Copyright © 2013 Deutsche Bank AG
18