Embed Size (px)
Citation preview

Technical AnalysisTechnical Analysis
Presented byDr.K.PRABHAKARAN MBA,M.Phil.,PGDMM,Ph.D.
Faculty-Finance, RVS Faculty of Management,Coimbatore & SEBI Financial Education Resource Person
Visiting Faculty- BSE Institute Ltd

Technical Analysis
Technical analysis is the attempt toforecast stock prices on the basis ofmarket-derived data.
Technical analysts essentially search forbullish (positive) and bearish (negative)signals about stock prices or marketdirection.

Technical Analysis
The technical analyst deal with only threepieces of data: price, trading volume, and openinterest.
Technical analysts believe that the historicalperformance of stocks and markets areindications of future performance.

Types of Charts
Line Chart Candlestick Chart Bar Charts

Line Chart
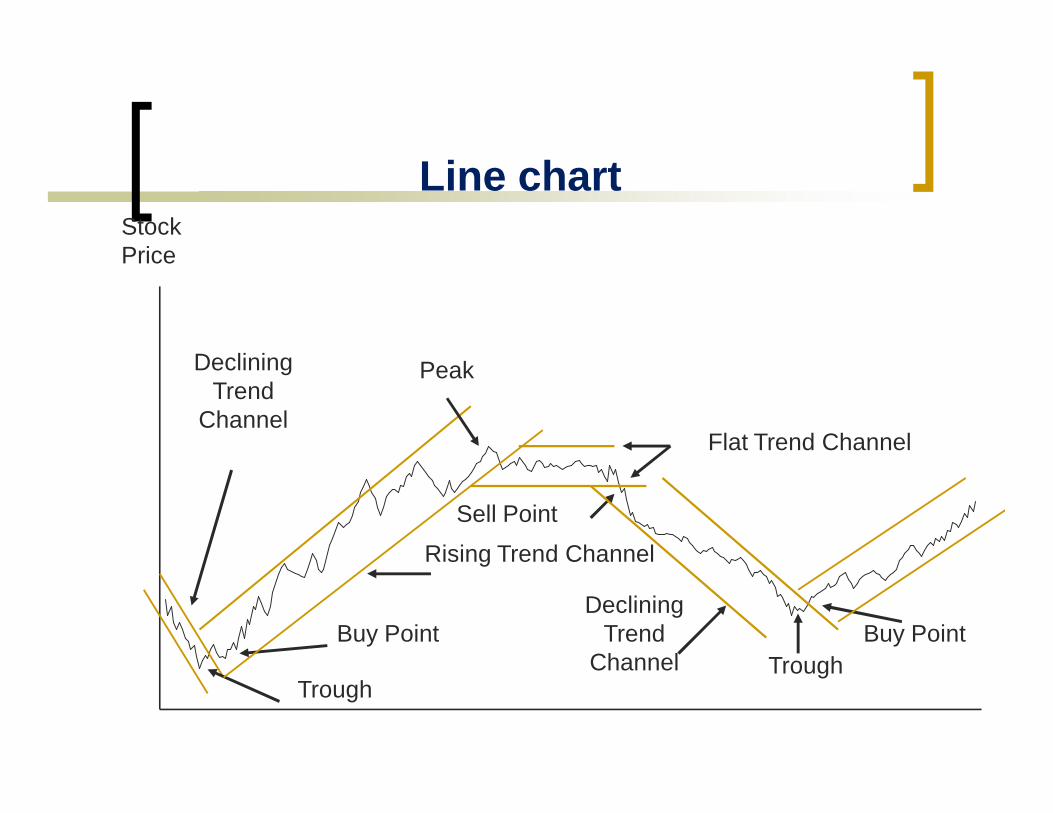
Line chartStock Price
Declining Trend
Channel
Trough
Buy Point
Rising Trend Channel
Flat Trend Channel
Sell Point
Peak
Declining Trend
Channel TroughBuy Point

Trend Lines
There are three basic kinds of trends: An Up trend where prices
are generally increasing. A Down trend where
prices are generally decreasing.
A Trading Range.

Support and Resistance
Support level is a price level where the price tends to find support as it is going down
Support and Resistance
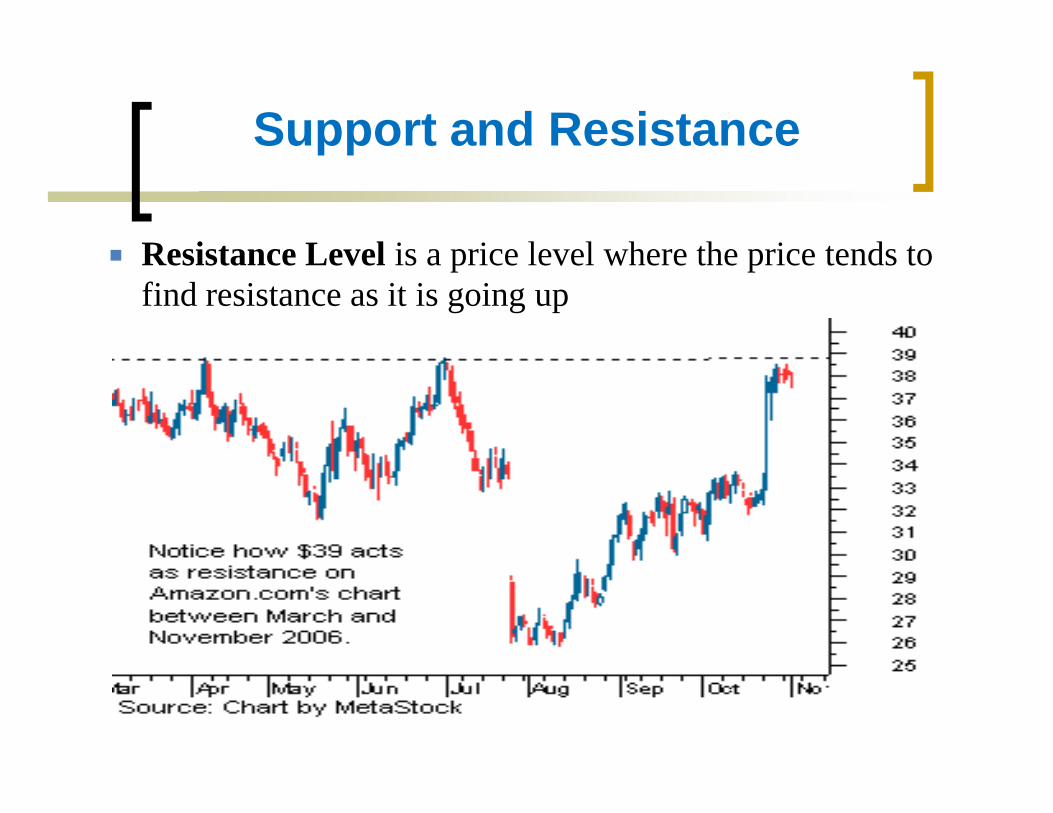
Resistance Level is a price level where the price tends to find resistance as it is going up

Importance of Support and Resistance
Support and resistance analysis is an important part oftrends because it can be used to make tradingdecisions and identify when a trend is reversing

Head and Shoulders
This formation is characterized by two small peaks on either side of a larger peak.
This is a reversal pattern, meaning that it signifies a change in the trend.
Head
Head
Left Shoulder
Left Shoulder
Right Shoulder
Right Shoulder
Neckline
Neckline
H&S Top
H&S Bottom

Head & Shoulders Example
Sell Signal
Minimum Target PriceBased on measurement rule

Double Tops and Bottoms
These formations are similar to the H&S formations, but there is no head.
These are reversal patterns with the same measuring implications as the H&S.
Target
Double Top
Double Bottom
Target

Double Bottom Example

Rounded Tops & Bottoms
Rounding formations are characterized by a slow reversal of trend.
Rounding Top
Rounding Bottom
16
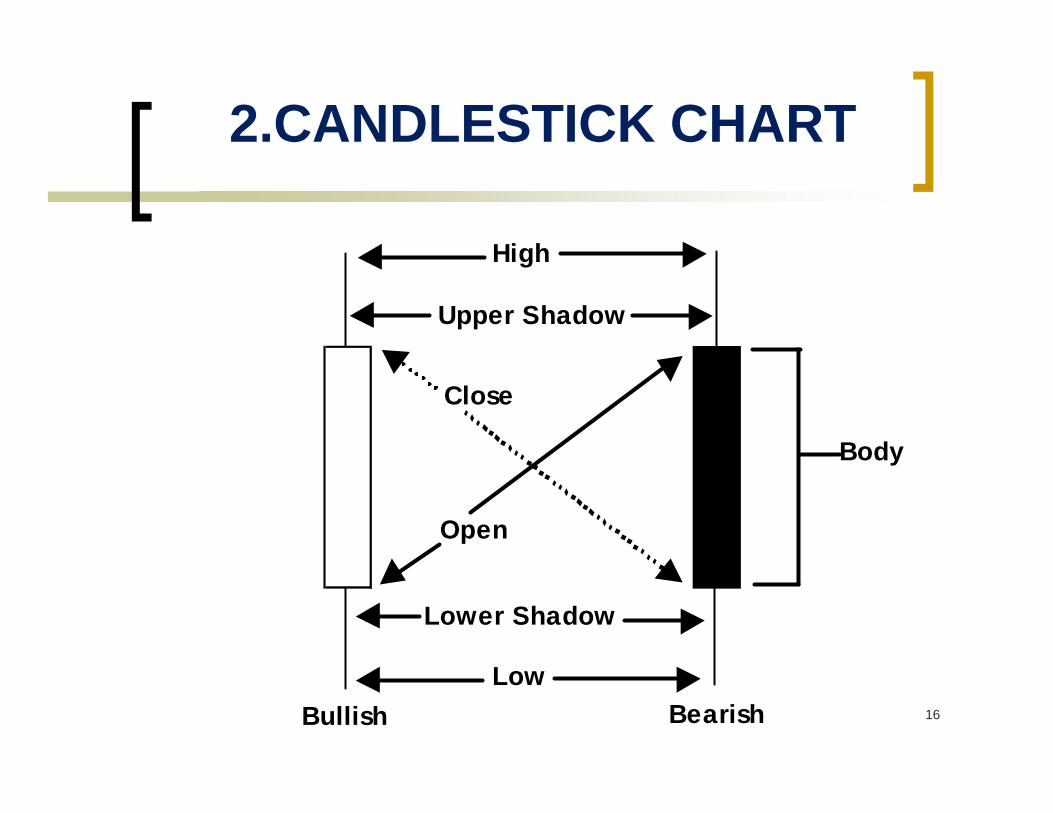
2.CANDLESTICK CHART
High
Upper Shadow
Low
Lower Shadow
Open
Bullish Bearish
Body
Close

17
Candle Stick Charting
Green is an example of a bullish pattern, the stock opened at (or near) its low and closed near its high
Red is an example of a bearish pattern. The stock opened at (or near) its high and dropped substantially to close near its low

18
Top example is called a hammer and is a bullish pattern only if it occurs after the stock price has dropped for several days.
Bottom is an example of a Doji.
Candle Stick Charting


Japanese Candlesticks(Example)

21
3.Bar Chart
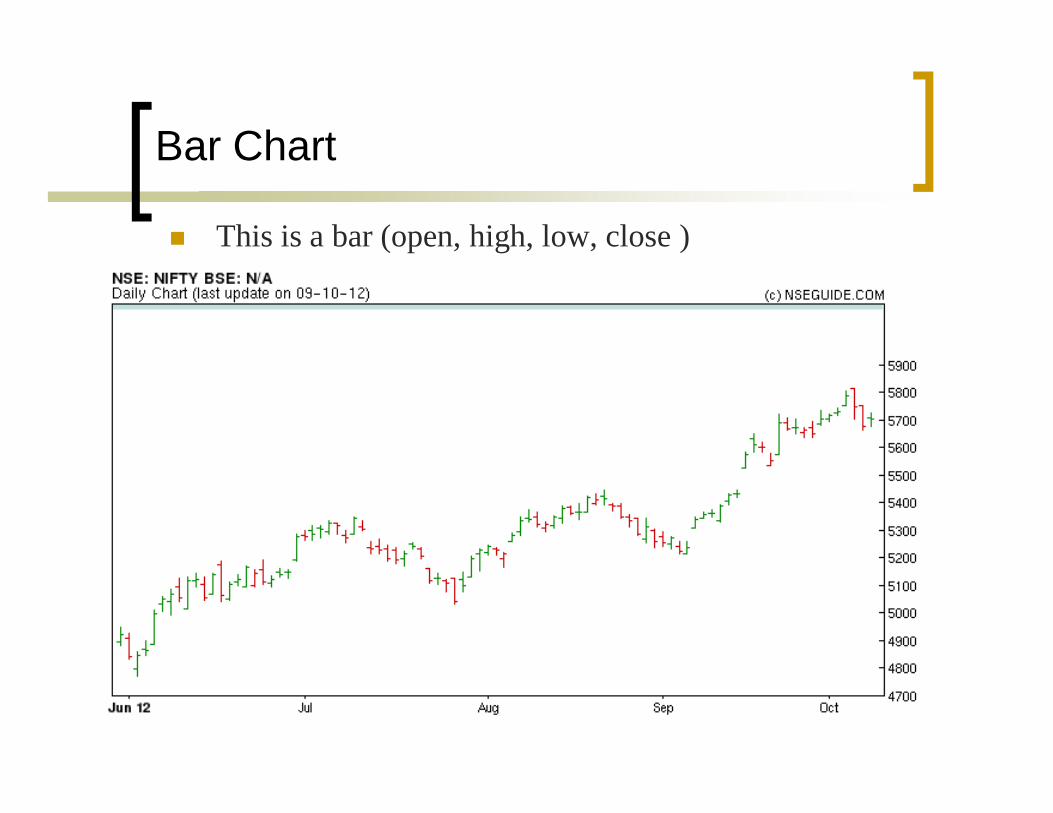
Bar Chart
This is a bar (open, high, low, close )

Example
Double bottom Gap, should getfilled
Nov to Mar Trading range Descending
triangles

Technical Indicators
There are hundreds of technical indicators used to generate buy and sell signals.
We will look at just a few Indicators Moving Average Moving Average Convergence/Divergence
(MACD) Relative Strength Index (RSI) Bollinger Bands Pivot Point Money Flow Index

25
Moving Average
Calculated by applying a percentage of today'sclosing price to yesterday's moving averagevalue.
The most commonly used moving averages areof 10,20, 30, 50, 100 and 200 days.
For example: a 10-day simple moving averageis calculated by adding the closing prices forthe last 10 days and dividing the total by 10.

Moving Average
The Moving Average Technical Indicator shows the mean instrument price value for a certain period of time.
There are four different types of moving averages: Simple moving averages Exponential moving averages Smoothed moving averages Linear Weighted moving averages

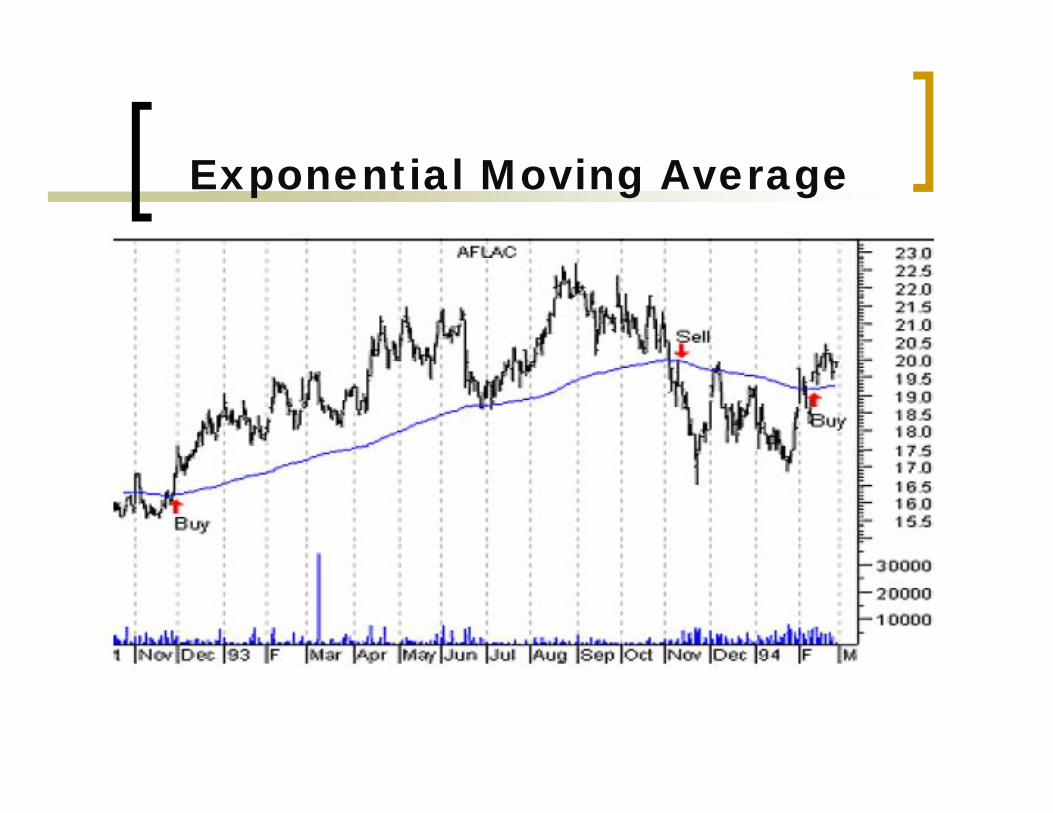
Exponential Moving Average
The exponential moving average is a type of movingaverage that gives more weight to recent prices in anattempt to make it more responsive to new information.
Formula:
Exponential Moving Average

Example for EMA

Moving Average Convergence/Divergence (MACD)
MACD was developed by Gerald Appel as away to keep track of a moving averagecrossover system.
Appel defined MACD as the differencebetween a 12-day and 26-day moving average.A 9-day moving average of this difference isused to generate signals.
When this signal line goes from negative topositive, a buy signal is generated.
When the signal line goes from positive tonegative, a sell signal is generated.

Moving Averages Convergence Divergence

MACD Example Chart

Relative Strength Index (RSI) RSI was developed by Welles Wilder as an
oscillator to measure overbought/oversoldlevels.
RSI is a measure of the ratio of average pricechanges on up days to average price changeson down days.
The most important thing to understand aboutRSI is that a level above 70 indicates a stockis overbought, and a level below 30 indicatesthat it is oversold (it can range from 0 to 100).
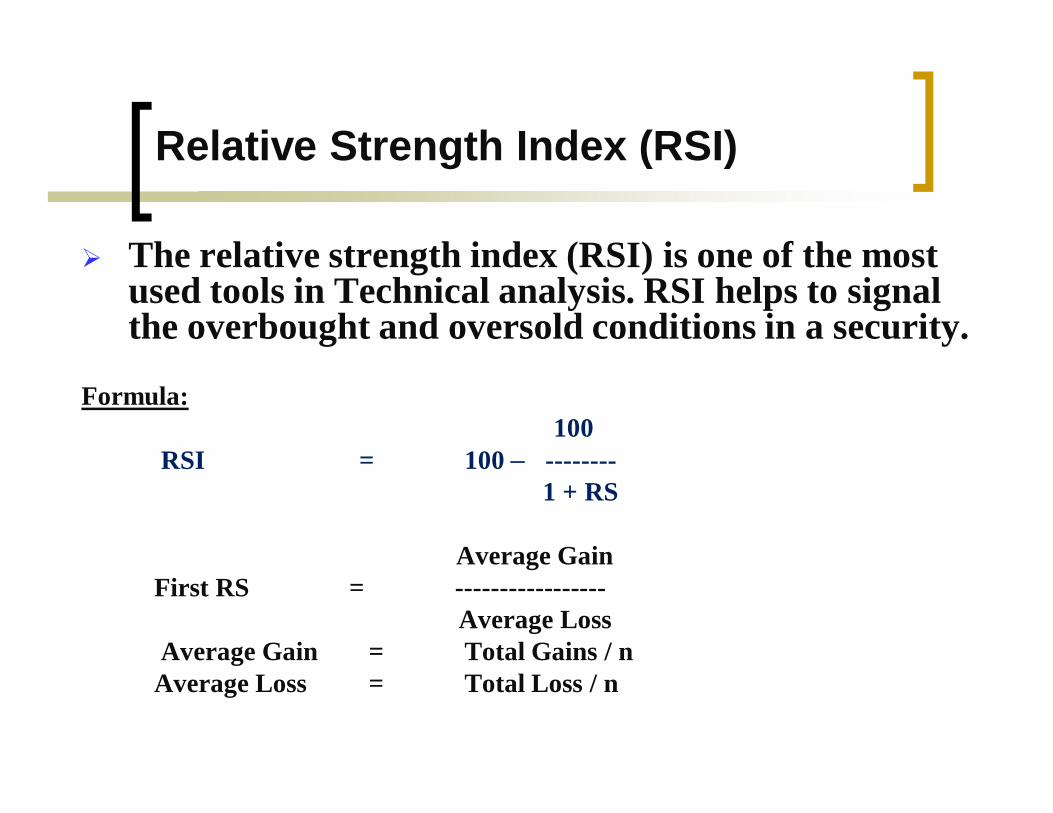
Relative Strength Index (RSI)
The relative strength index (RSI) is one of the most used tools in Technical analysis. RSI helps to signal the overbought and oversold conditions in a security.
Formula: 100
RSI = 100 --------1 + RS
Average Gain First RS = -----------------
Average LossAverage Gain = Total Gains / n
Average Loss = Total Loss / n

RSI Example ChartOversoldOverbought

RSI Example

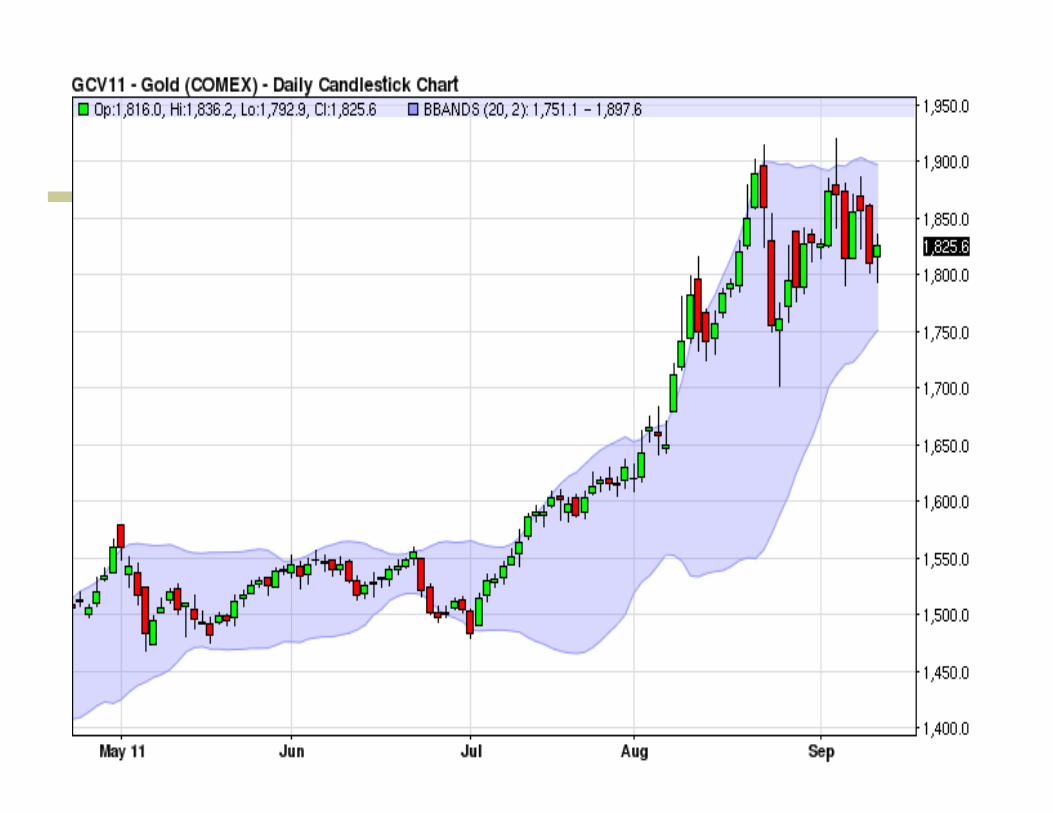
Bollinger Bands Bollinger bands were created by John Bollinger
(former FNN technical analyst, and regular guest on CNBC).
Bollinger Bands are based on a moving average of the closing price.
They are two standard deviations above and below the moving average.
A buy signal is given when the stock price closes below the lower band, and a sell signal is given when the stock price closes above the upper band.
When the bands contract, that is a signal that a big move is coming, but it is impossible to say if it will be up or down.

Bollinger Bands
MONEY FLOW INDEX (MFI)
Money flow index was discovered by Createdby Gene Quong and Avrum Soudack.
Money flow is positive when the typical pricerises. This is due to buying pressure. A ratio ofpositive and negative money flow is thenplugged into an RSI formula to create anoscillator that moves between zero and onehundred.

FORMULA

MFI EXAMPLE
MONEY FLOW INDEX
010203040506070
Mar
-08
Jun-
08
Sep
-08
Dec
-08
Mar
-09
Jun-
09
Sep
-09
Dec
-09
Mar
-10
Jun-
10
Sep
-10
Dec
-10
Mar
-11
Jun-
11
Sep
-11
Dec
-11
YEAR
MFI MFI

Pivot Point
A technical indicator derived by calculating thenumerical average of particular share high, lowand closing prices. The pivot point is used as apredictive indicator.
If the following day’s market price fallsbelow the pivot point, it may be used as a newsupport level.
Support and resistance are price levels atwhich movements should stop and reversedirection.

Formula for Pivot Point
Pivot Point (P) = (High + Low + Close) / 3
Support level 1(S1) = ((2*pivot point) – high))
Resistant level 1(R1) = ((2*pivot point) – low))
Support level 2(S2) = ((pivot point) – (R1-S1))
Resistant level 2(R2) = ((pivot point) + (R1-S1))