Embed Size (px)
Citation preview

111
This indicator set is prepared for users to give up-to-date information about different areas of Turkish Economy.
This document is updated at the first day of every week.
Last update: February 22, 2016
February 2016
TURKISH ECONOMY
Undersecretariat of Treasury
333
CONTENTSTurkish Economy in the World.................................................................4Demographic Profile.................................................................................7Growth....................................................................................................11Employment............................................................................................29Inflation...................................................................................................41Foreign Trade and Balance of Payments...............................................53Public Finance........................................................................................73Debt Management..................................................................................82Financial Sector....................................................................................116Market Indicators..................................................................................128Investment Environment.......................................................................139Relationship with the IMF and EU........................................................145Social Security......................................................................................148Labor Market.........................................................................................156R&D......................................................................................................167Energy Sector.......................................................................................182
444
TURKISH ECONOMY IN THE WORLD
555
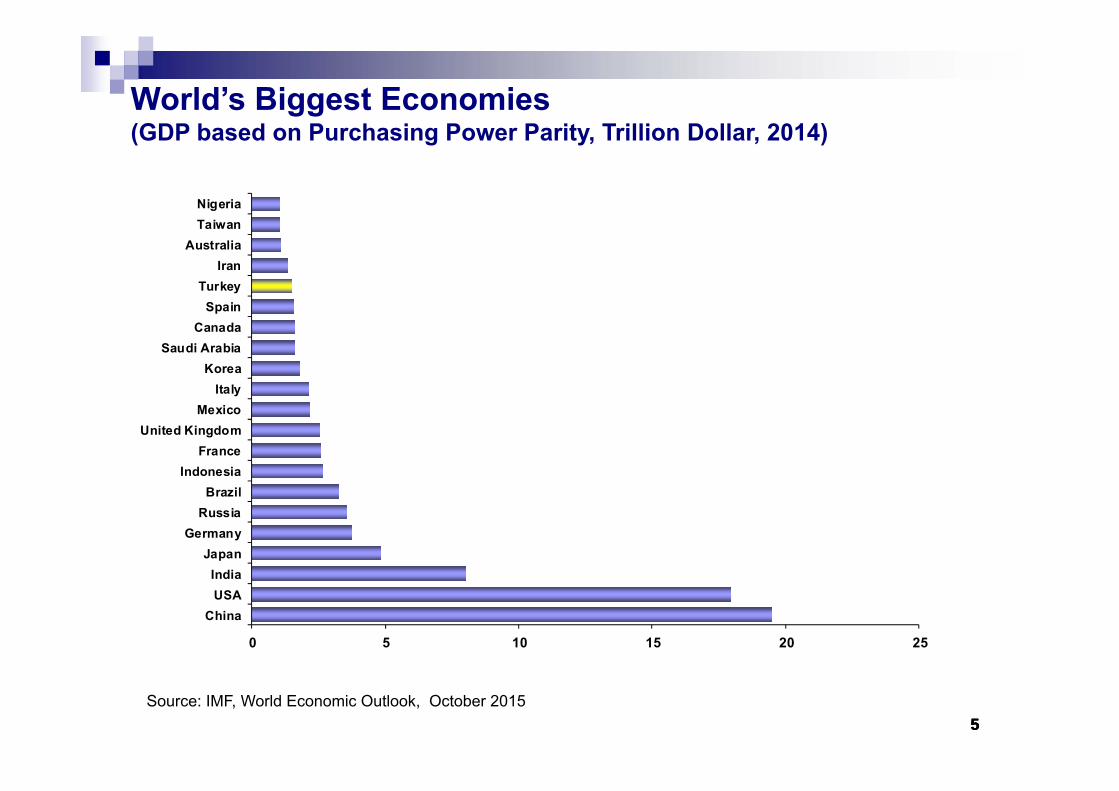
World’s Biggest Economies (GDP based on Purchasing Power Parity, Trillion Dollar, 2014)
0 5 10 15 20 25
ChinaUSAIndia
JapanGermany
RussiaBrazil
IndonesiaFrance
United KingdomMexico
ItalyKorea
Saudi ArabiaCanada
SpainTurkey
IranAustralia
TaiwanNigeria
Source: IMF, World Economic Outlook, October 2015
666
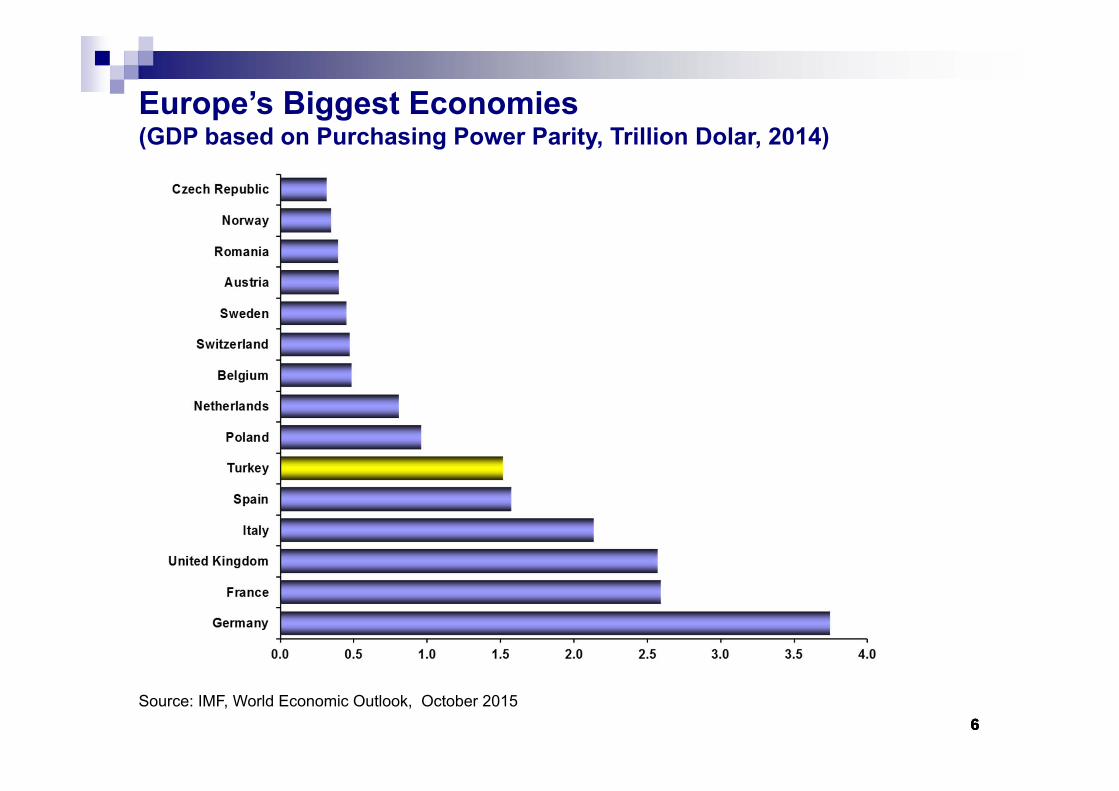
Europe’s Biggest Economies (GDP based on Purchasing Power Parity, Trillion Dolar, 2014)
Source: IMF, World Economic Outlook, October 2015

777
DEMOGRAPHIC PROFILE
888
25.7
15.8
15.6
15.1
15.1
15.0
14.5
14.7
14.9
13.7
63.5
65.2
61.5
63.9
65.7
63.9
64.3
61.4
61.5
59.9
10.8
19.0
22.9
21.0
19.2
21.1
21.3
23.9
23.7
26.4
0% 10% 20% 30% 40% 50% 60% 70% 80% 90% 100%
Turkey
Russia
Europe
Romania
Slovak Rep.
Poland
Ukraine
Hungary
Czech Rep.
Bulgaria
0-14 Age 14-60 Age 60+ Age
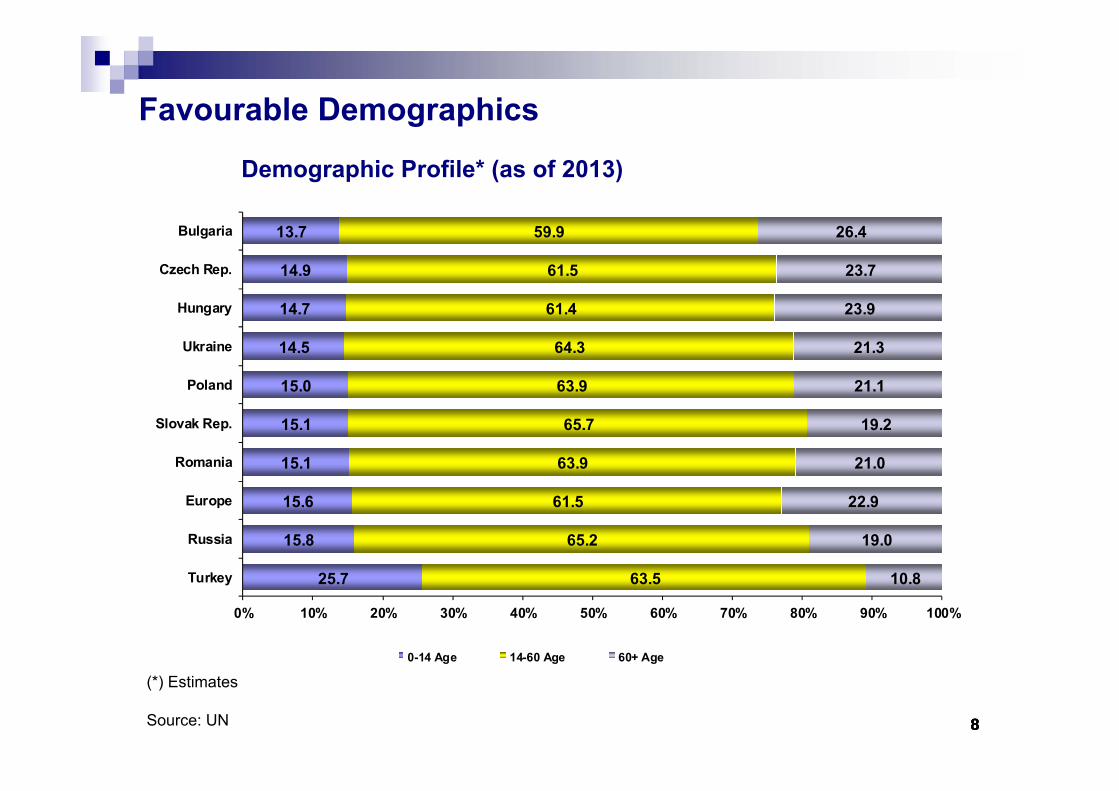
Favourable Demographics
Demographic Profile* (as of 2013)
(*) Estimates
Source: UN
99
17.1
16.1
16.4
15.4
14.8
14.8
16.0
14.0
13.9
13.8
54.4
53.2
56.2
51.0
52.5
48.7
50.8
50.6
49.4
49.4
28.5
30.8
27.3
33.6
32.7
36.5
33.2
35.4
36.7
36.7
0% 10% 20% 30% 40% 50% 60% 70% 80% 90% 100%
Russia
Ukraine
Turkey
Europe
Hungary
Bulgaria
Czech Rep.
Slovak Rep.
Poland
Romania
0-14 Age 14-60 Age 60+ Age
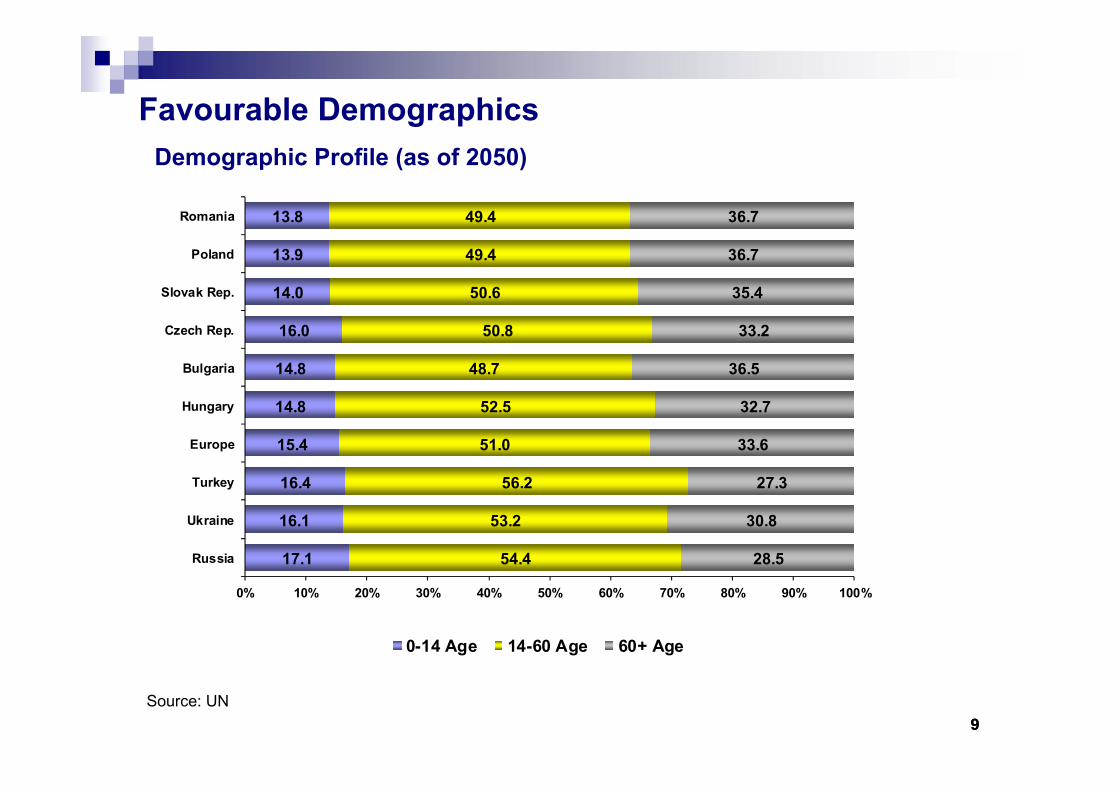
Source: UN
Favourable DemographicsDemographic Profile (as of 2050)
101010
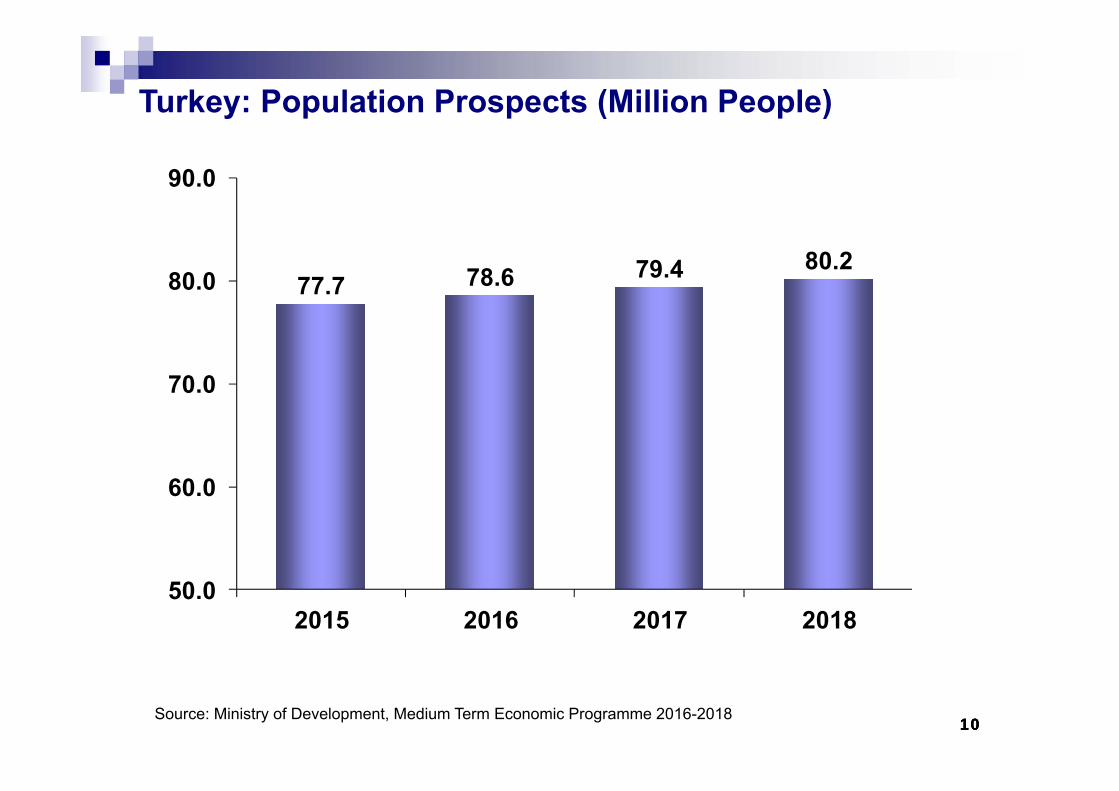
Turkey: Population Prospects (Million People)
77.7 78.6 79.4 80.2
50.0
60.0
70.0
80.0
90.0
2015 2016 2017 2018
Source: Ministry of Development, Medium Term Economic Programme 2016-2018

111111
GROWTH
121212
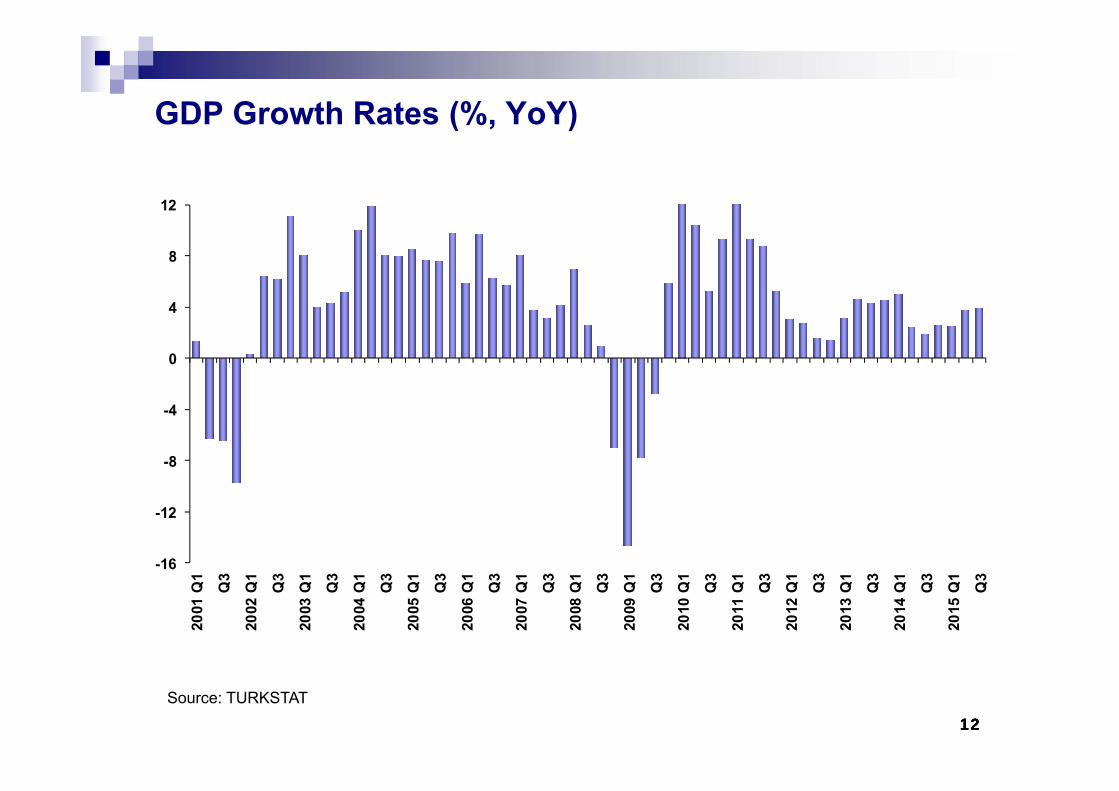
GDP Growth Rates (%, YoY)
-16
-12
-8
-4
0
4
8
1220
01 Q
1
Q3
2002
Q1
Q3
2003
Q1
Q3
2004
Q1
Q3
2005
Q1
Q3
2006
Q1
Q3
2007
Q1
Q3
2008
Q1
Q3
2009
Q1
Q3
2010
Q1
Q3
2011
Q1
Q3
2012
Q1
Q3
2013
Q1
Q3
2014
Q1
Q3
2015
Q1
Q3
Source: TURKSTAT
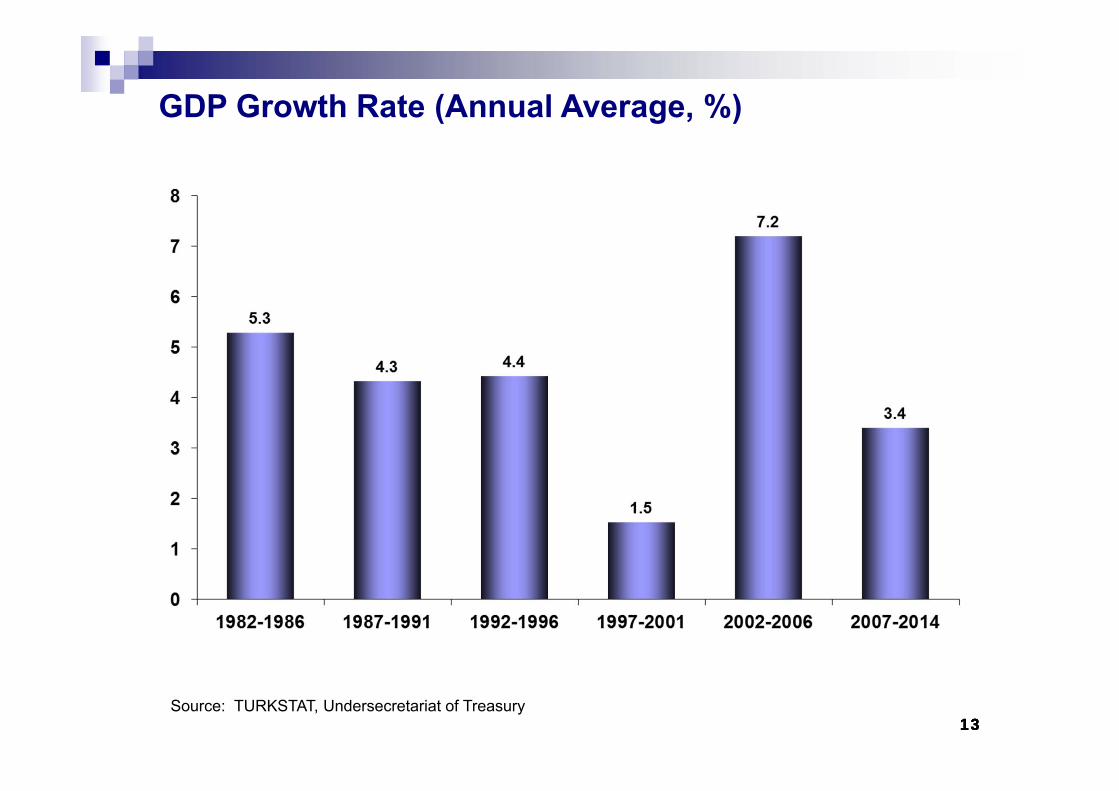
131313Source: TURKSTAT, Undersecretariat of Treasury
GDP Growth Rate (Annual Average, %)
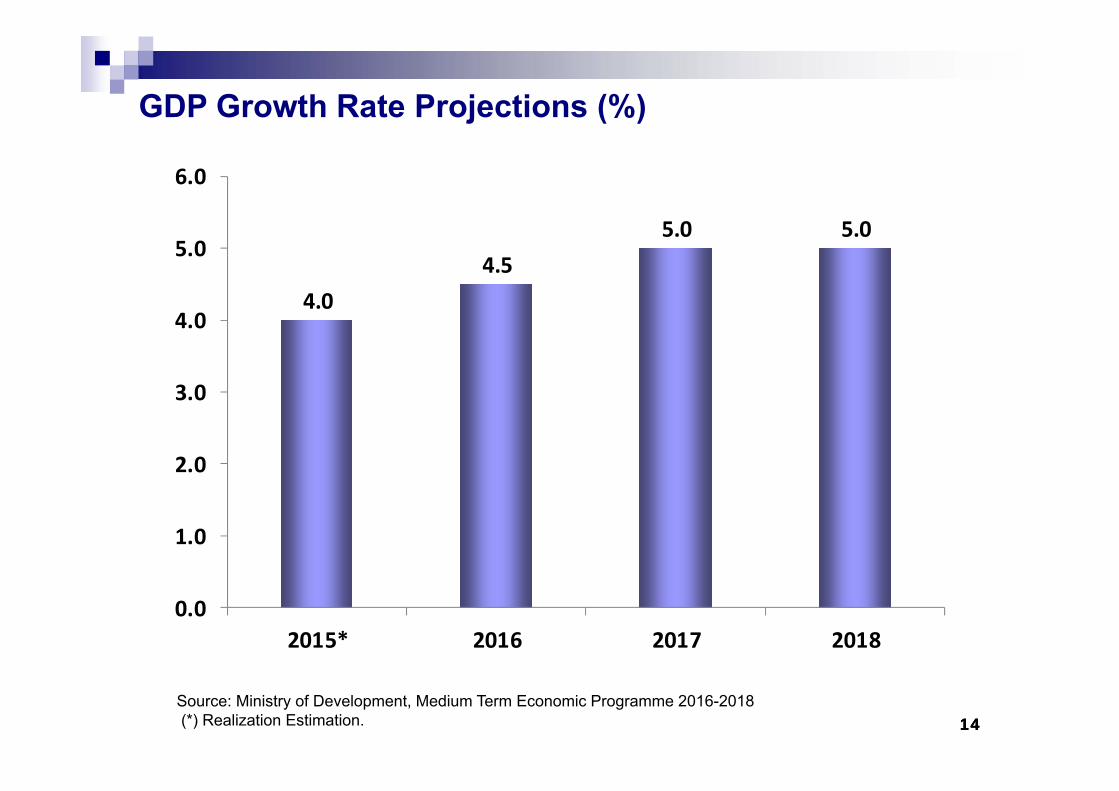
141414Source: Ministry of Development, Medium Term Economic Programme 2016-2018(*) Realization Estimation.
GDP Growth Rate Projections (%)
4.04.5
5.0 5.0
0.0
1.0
2.0
3.0
4.0
5.0
6.0
2015* 2016 2017 2018
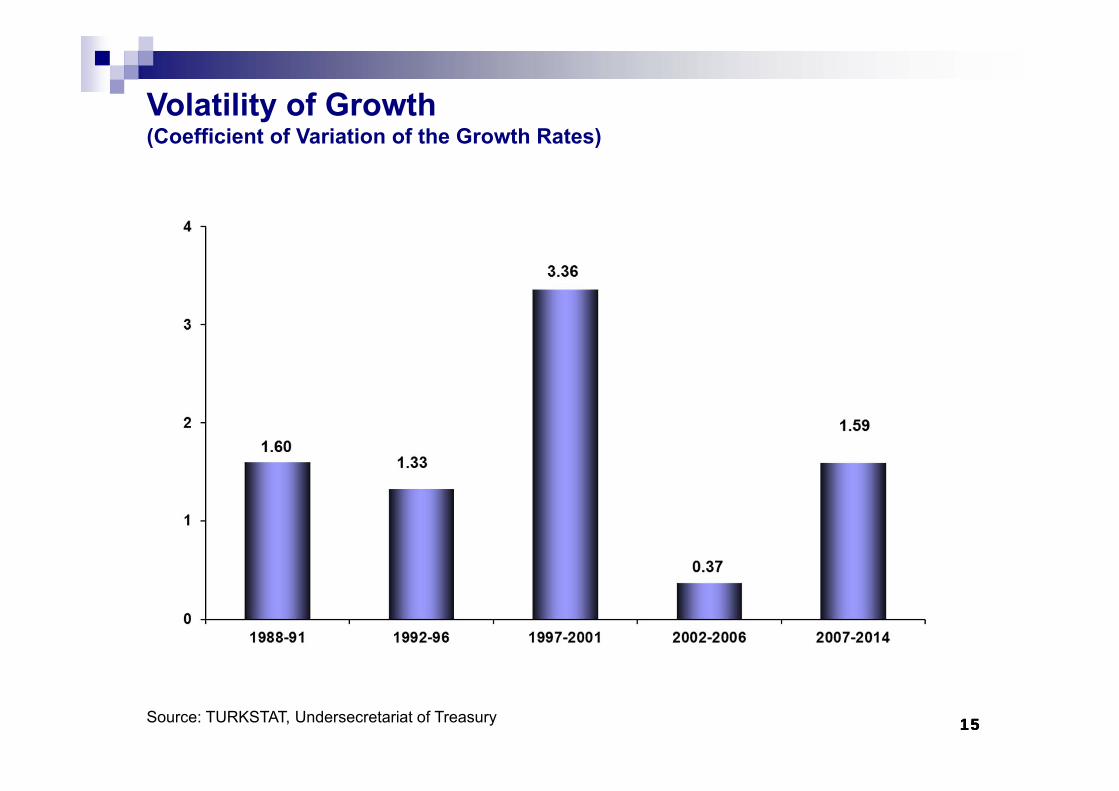
151515
Volatility of Growth(Coefficient of Variation of the Growth Rates)
Source: TURKSTAT, Undersecretariat of Treasury
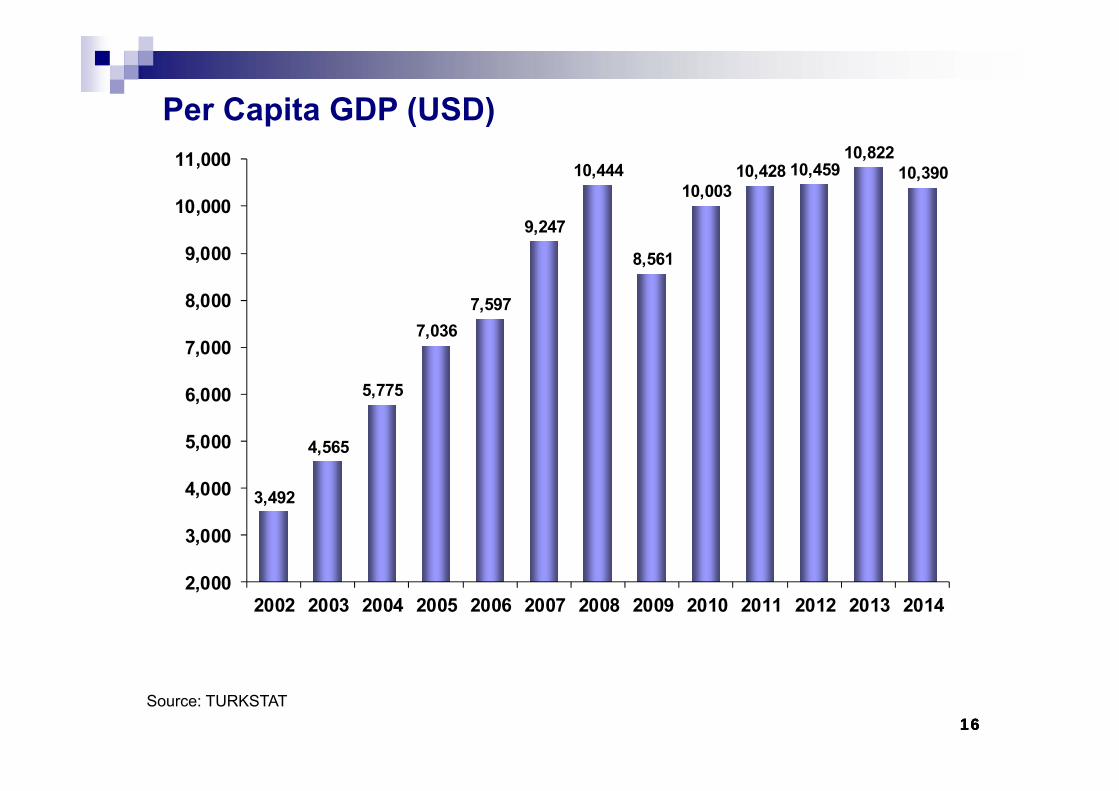
161616
3,492
4,565
5,775
7,0367,597
9,247
10,444
8,561
10,00310,428 10,459
10,82210,390
2,000
3,000
4,000
5,000
6,000
7,000
8,000
9,000
10,000
11,000
2002 2003 2004 2005 2006 2007 2008 2009 2010 2011 2012 2013 2014
Per Capita GDP (USD)
Source: TURKSTAT
171717
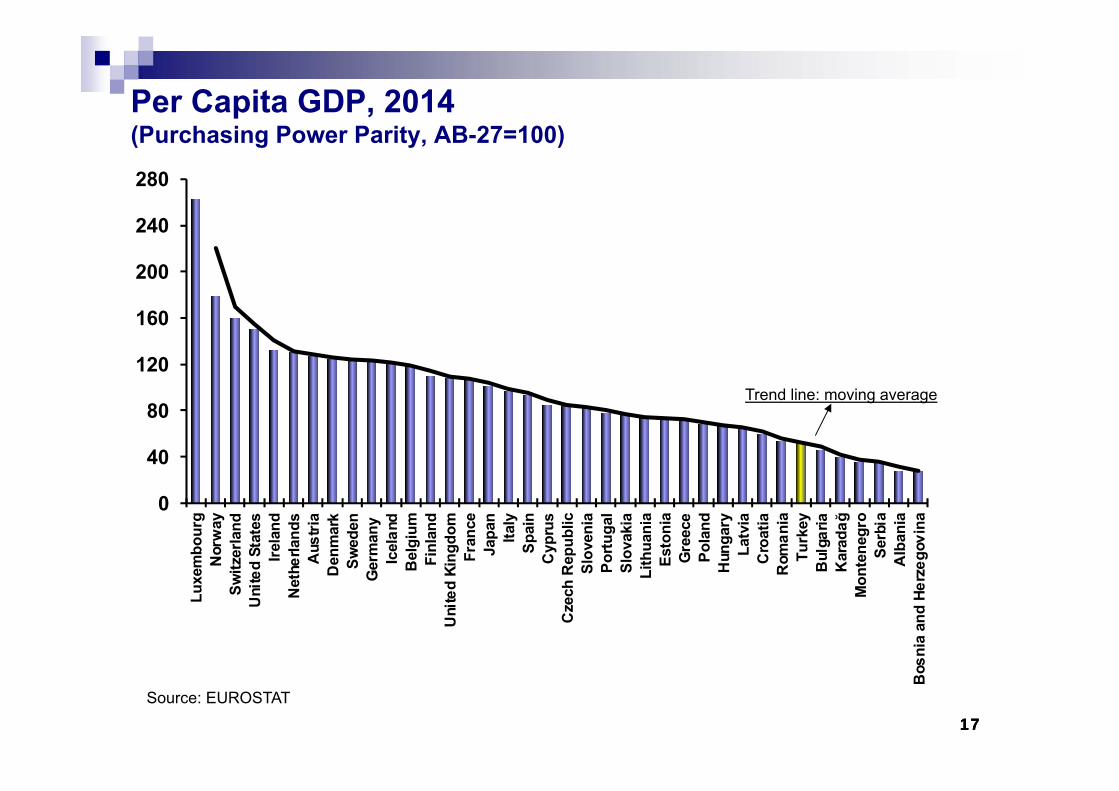
Per Capita GDP, 2014(Purchasing Power Parity, AB-27=100)
Source: EUROSTAT
Trend line: moving average
0
40
80
120
160
200
240
280Lu
xem
bour
gN
orw
aySw
itzer
land
Uni
ted
Stat
esIre
land
Net
herla
nds
Aus
tria
Den
mar
kSw
eden
Ger
man
yIc
elan
dB
elgi
umFi
nlan
dU
nite
d Ki
ngdo
mFr
ance
Japa
nIta
lySp
ain
Cyp
rus
Cze
ch R
epub
licSl
oven
iaPo
rtuga
lSl
ovak
iaLi
thua
nia
Esto
nia
Gre
ece
Pola
ndH
unga
ryLa
tvia
Cro
atia
Rom
ania
Turk
eyB
ulga
riaK
arad
ağM
onte
negr
oSe
rbia
Alb
ania
Bos
nia
and
Herz
egov
ina
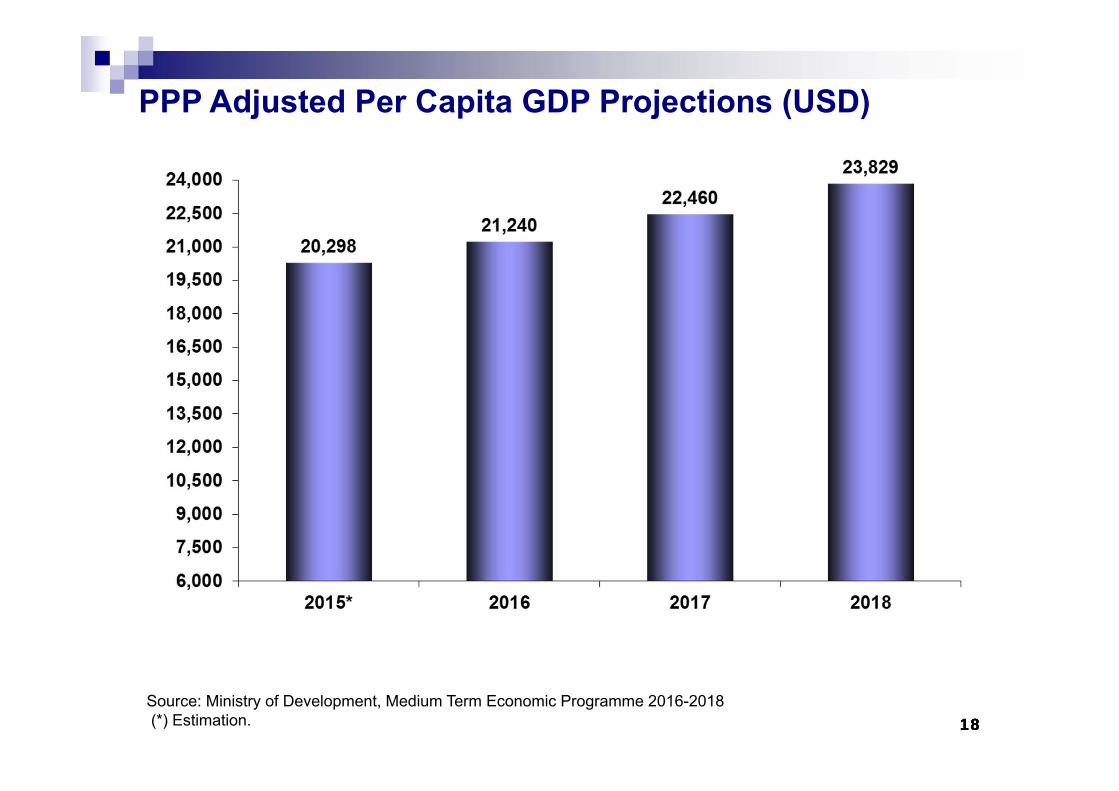
181818Source: Ministry of Development, Medium Term Economic Programme 2016-2018(*) Estimation.
PPP Adjusted Per Capita GDP Projections (USD)
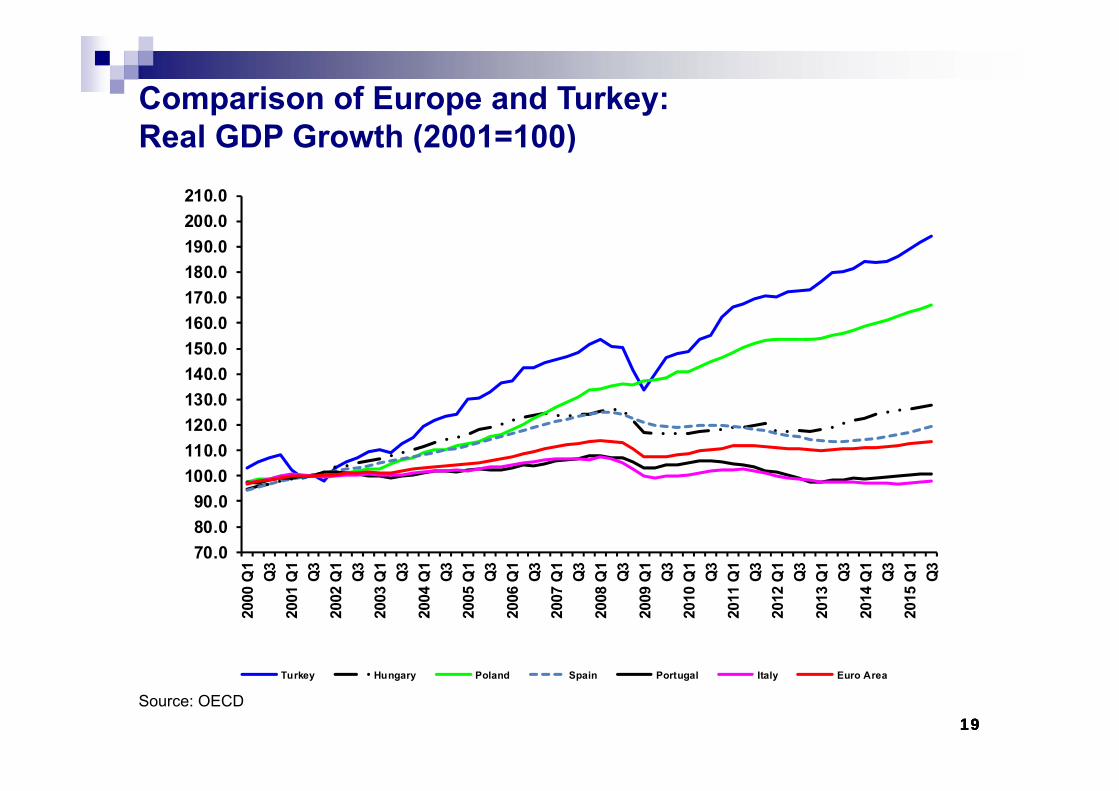
191919Source: OECD
Comparison of Europe and Turkey:Real GDP Growth (2001=100)
70.080.090.0
100.0110.0120.0130.0140.0150.0160.0170.0180.0190.0200.0210.0
2000
Q1
Q3
2001
Q1
Q3
2002
Q1
Q3
2003
Q1
Q3
2004
Q1
Q3
2005
Q1
Q3
2006
Q1
Q3
2007
Q1
Q3
2008
Q1
Q3
2009
Q1
Q3
2010
Q1
Q3
2011
Q1
Q3
2012
Q1
Q3
2013
Q1
Q3
2014
Q1
Q3
2015
Q1
Q3
Turkey Hungary Poland Spain Portugal Italy Euro Area
202020
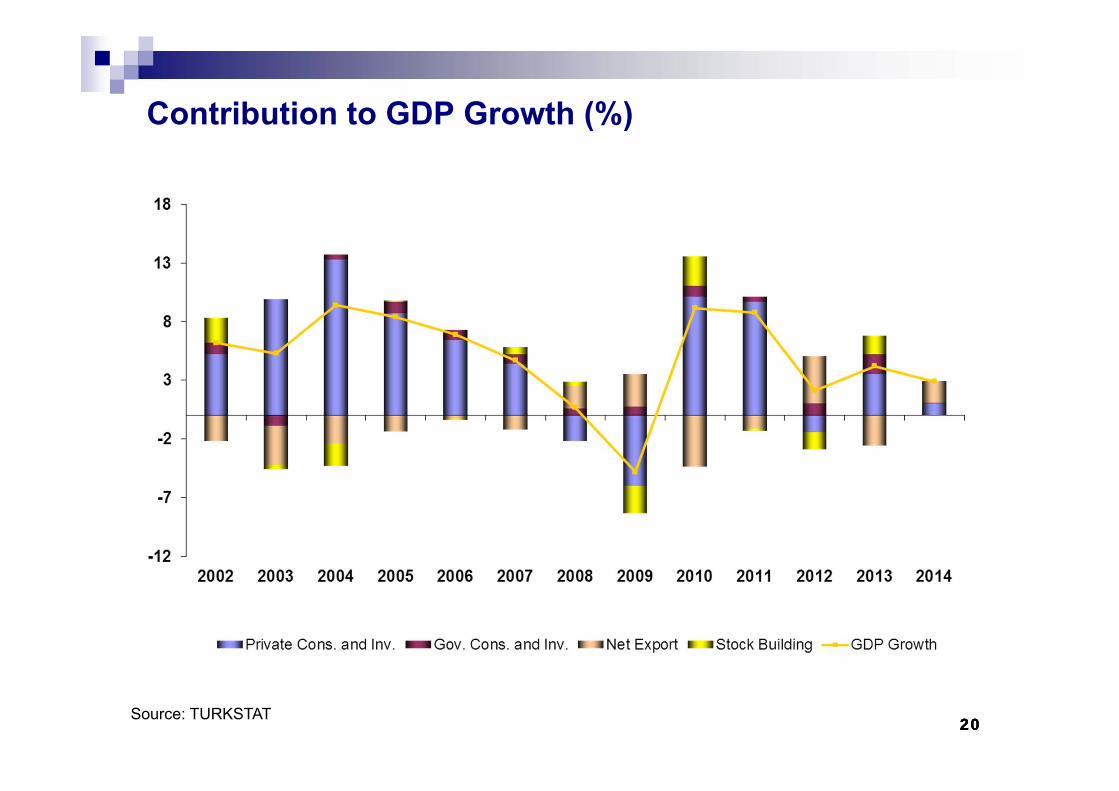
Contribution to GDP Growth (%)
Source: TURKSTAT
212121
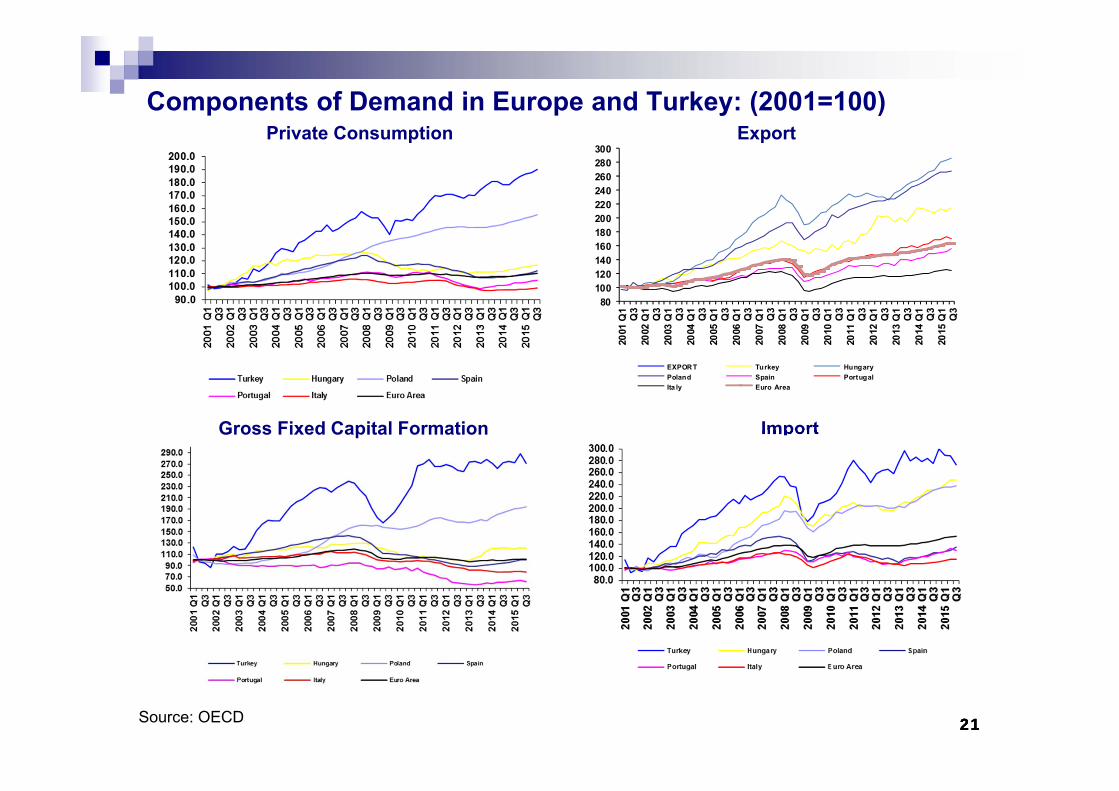
Components of Demand in Europe and Turkey: (2001=100)
80100120140160180200220240260280300
2001
Q1
Q3
2002
Q1
Q3
2003
Q1
Q3
2004
Q1
Q3
2005
Q1
Q3
2006
Q1
Q3
2007
Q1
Q3
2008
Q1
Q3
2009
Q1
Q3
2010
Q1
Q3
2011
Q1
Q3
2012
Q1
Q3
2013
Q1
Q3
2014
Q1
Q3
2015
Q1
Q3
EXPORT Turkey HungaryPoland Spain PortugalIta ly Euro Area
Source: OECD
Private Consumption Export
İthalat
Gross Fixed Capital Formation Import
222222
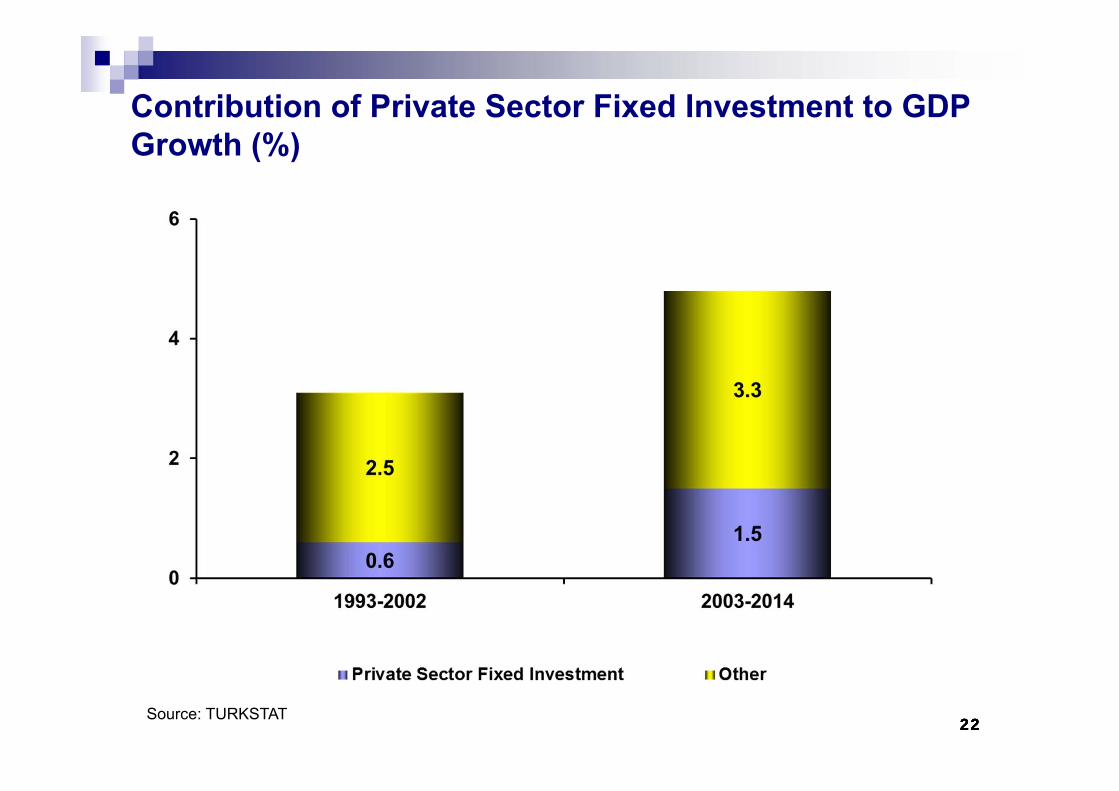
Contribution of Private Sector Fixed Investment to GDP Growth (%)
Source: TURKSTAT
232323
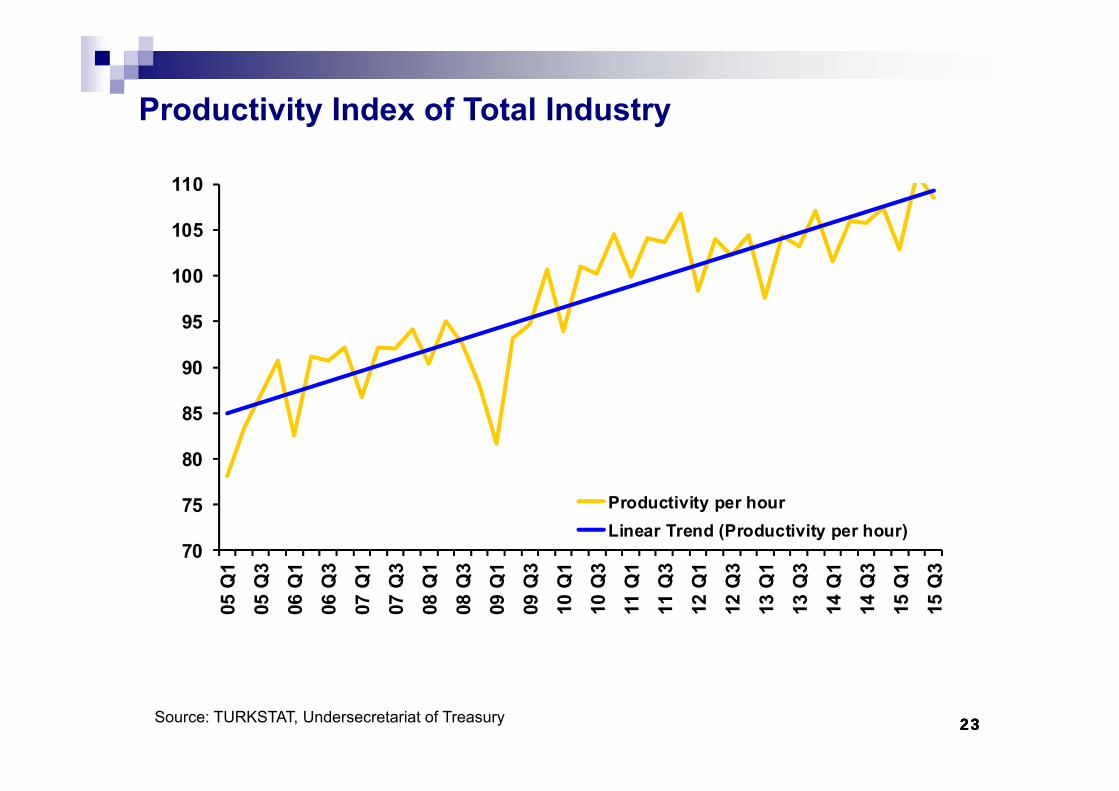
Productivity Index of Total Industry
70
75
80
85
90
95
100
105
110
05 Q
1
05 Q
3
06 Q
1
06 Q
3
07 Q
1
07 Q
3
08 Q
1
08 Q
3
09 Q
1
09 Q
3
10 Q
1
10 Q
3
11 Q
1
11 Q
3
12 Q
1
12 Q
3
13 Q
1
13 Q
3
14 Q
1
14 Q
3
15 Q
1
15 Q
3
Productivity per hourLinear Trend (Productivity per hour)
Source: TURKSTAT, Undersecretariat of Treasury
24242424
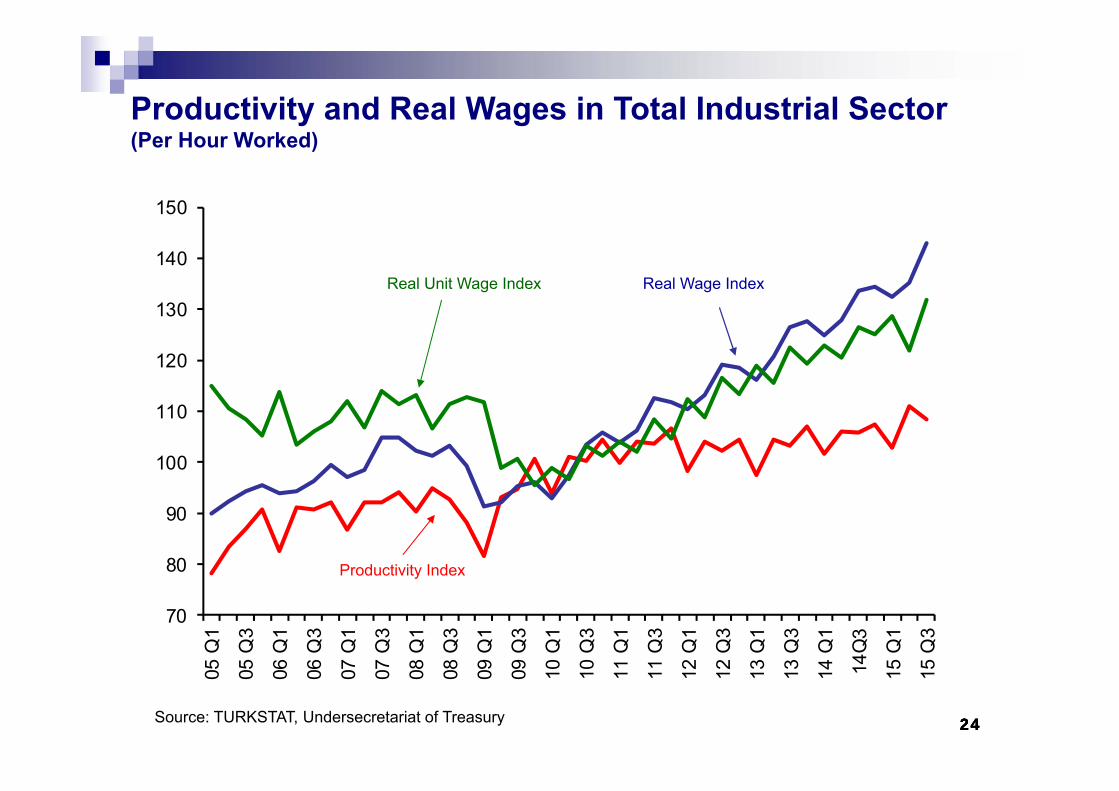
Productivity and Real Wages in Total Industrial Sector(Per Hour Worked)
Source: TURKSTAT, Undersecretariat of Treasury
70
80
90
100
110
120
130
140
15005
Q1
05 Q
3
06 Q
1
06 Q
3
07 Q
1
07 Q
3
08 Q
1
08 Q
3
09 Q
1
09 Q
3
10 Q
1
10 Q
3
11 Q
1
11 Q
3
12 Q
1
12 Q
3
13 Q
1
13 Q
3
14 Q
1
14Q
3
15 Q
1
15 Q
3
Productivity Index
Real Wage IndexReal Unit Wage Index
25252525
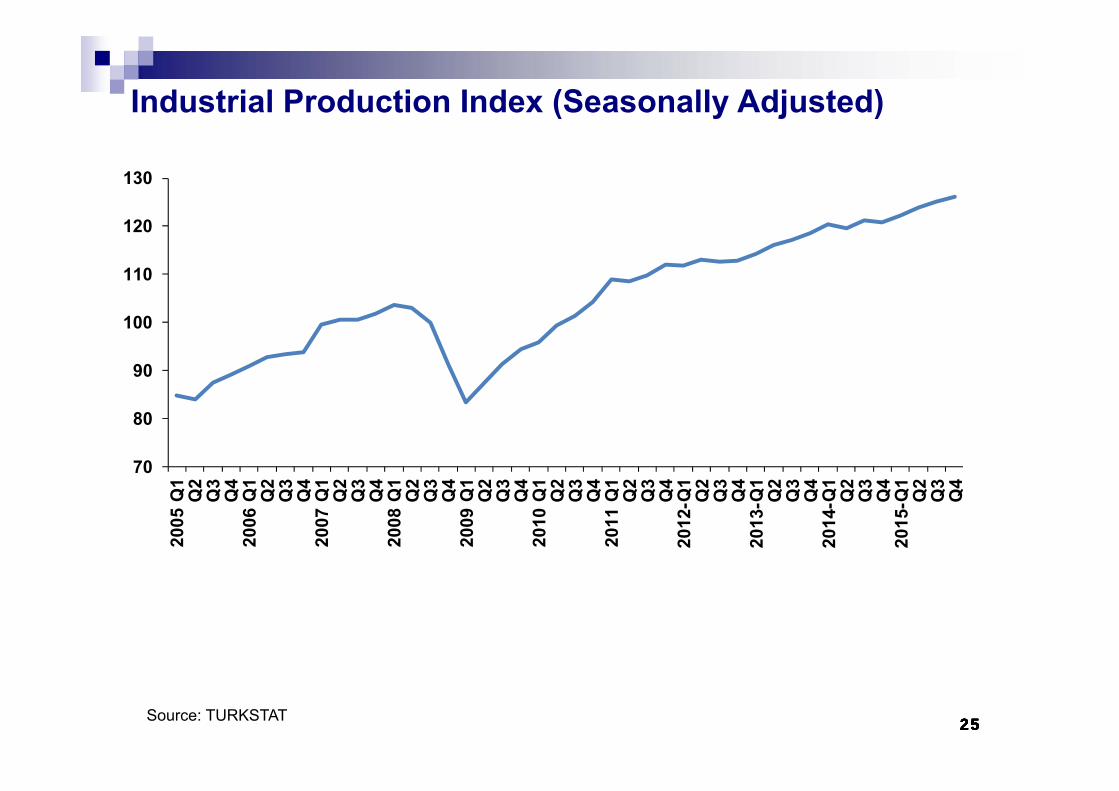
Industrial Production Index (Seasonally Adjusted)
70
80
90
100
110
120
13020
05 Q
1Q
2Q
3Q
420
06 Q
1Q
2Q
3Q
420
07 Q
1Q
2Q
3Q
420
08 Q
1Q
2Q
3Q
420
09 Q
1Q
2Q
3Q
420
10 Q
1Q
2Q
3Q
420
11 Q
1Q
2Q
3Q
420
12-Q
1Q
2Q
3Q
420
13-Q
1Q
2Q
3Q
420
14-Q
1Q
2Q
3Q
420
15-Q
1Q
2Q
3Q
4
25Source: TURKSTAT
26262626
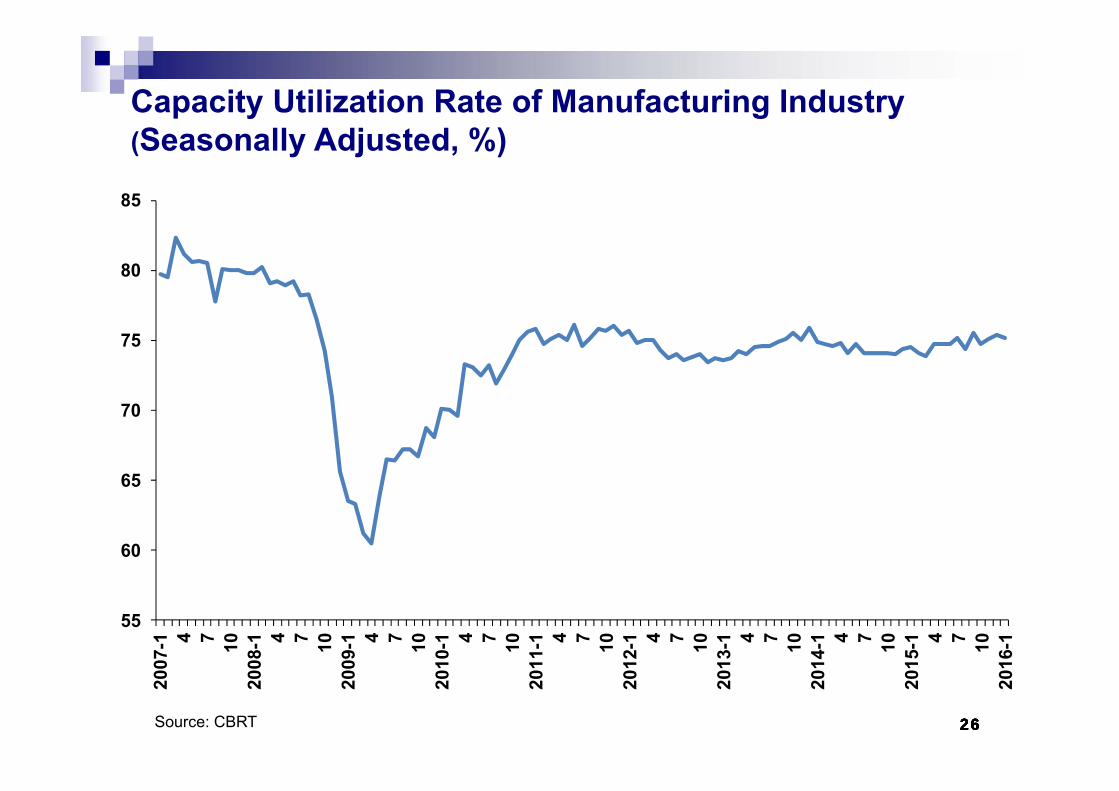
Capacity Utilization Rate of Manufacturing Industry (Seasonally Adjusted, %)
Source: CBRT
55
60
65
70
75
80
85
2007
-1 4 7 1020
08-1 4 7 10
2009
-1 4 7 1020
10-1 4 7 10
2011
-1 4 7 1020
12-1 4 7 10
2013
-1 4 7 1020
14-1 4 7 10
2015
-1 4 7 1020
16-1
26
27272727
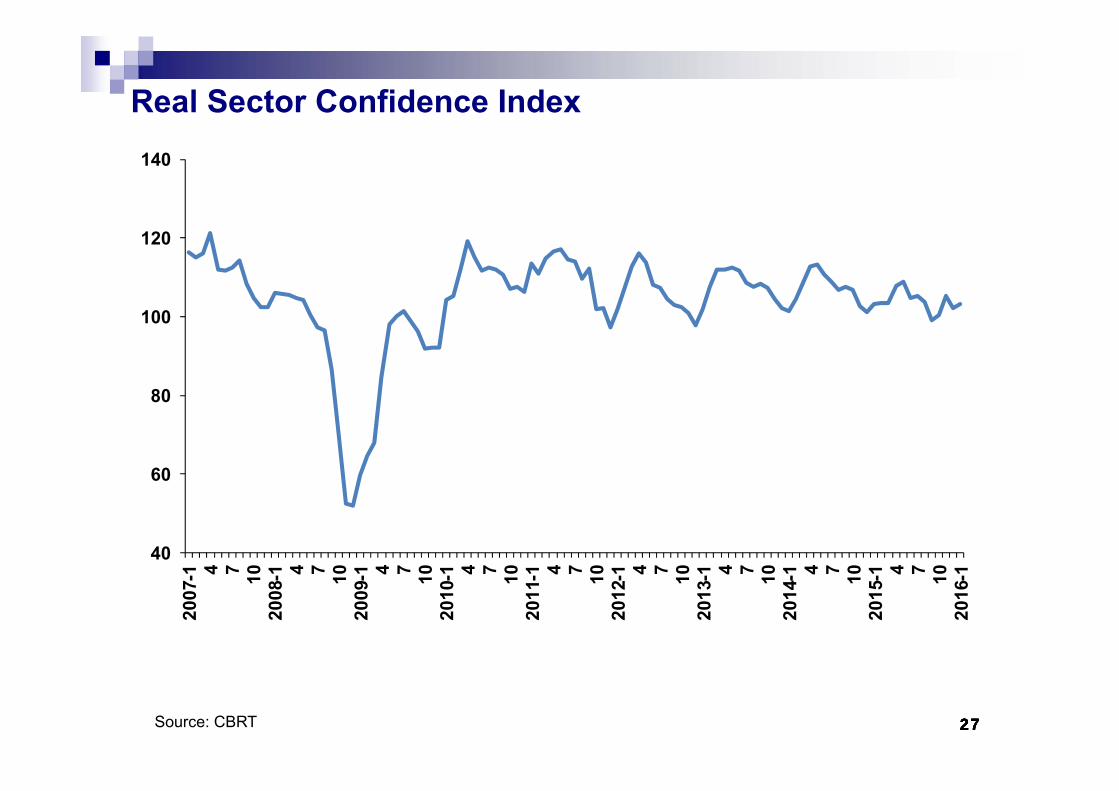
Real Sector Confidence Index
Source: CBRT 27
40
60
80
100
120
14020
07-1 4 7 10
2008
-1 4 7 1020
09-1 4 7 10
2010
-1 4 7 1020
11-1 4 7 10
2012
-1 4 7 1020
13-1 4 7 10
2014
-1 4 7 1020
15-1 4 7 10
2016
-1
28282828
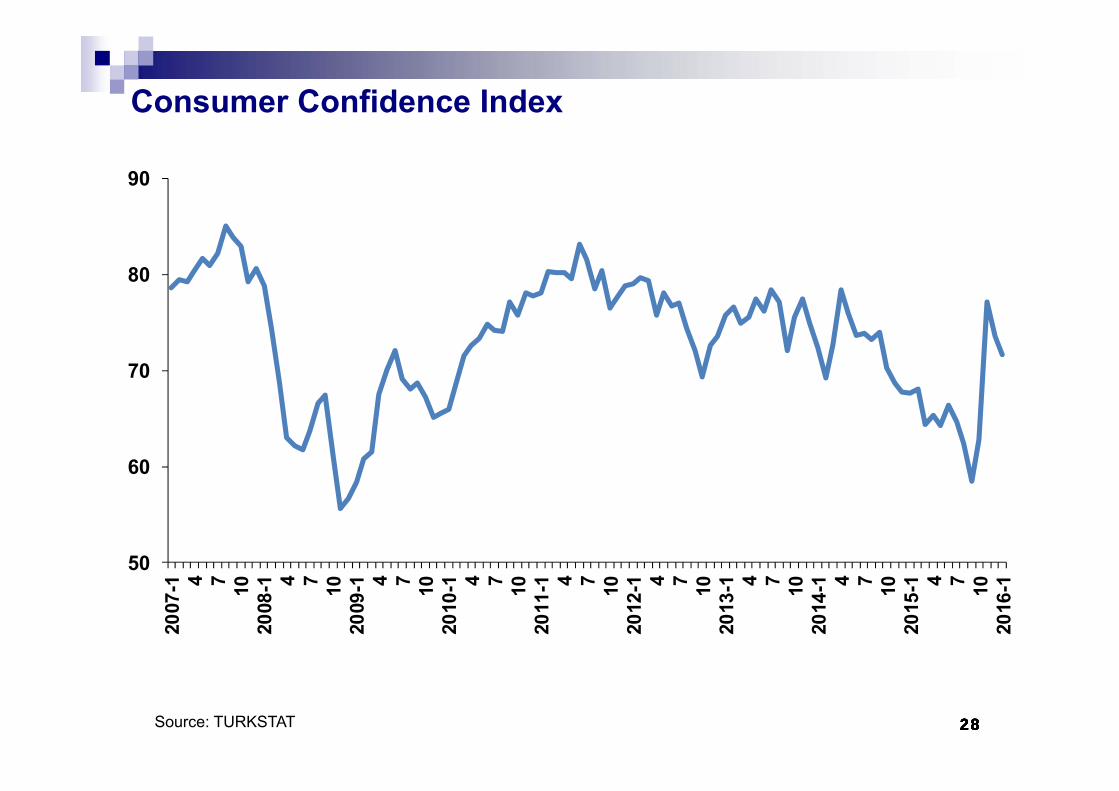
Consumer Confidence Index
Source: TURKSTAT
50
60
70
80
9020
07-1 4 7 10
2008
-1 4 7 1020
09-1 4 7 10
2010
-1 4 7 1020
11-1 4 7 10
2012
-1 4 7 1020
13-1 4 7 10
2014
-1 4 7 1020
15-1 4 7 10
2016
-1
28

292929
EMPLOYMENT
3030
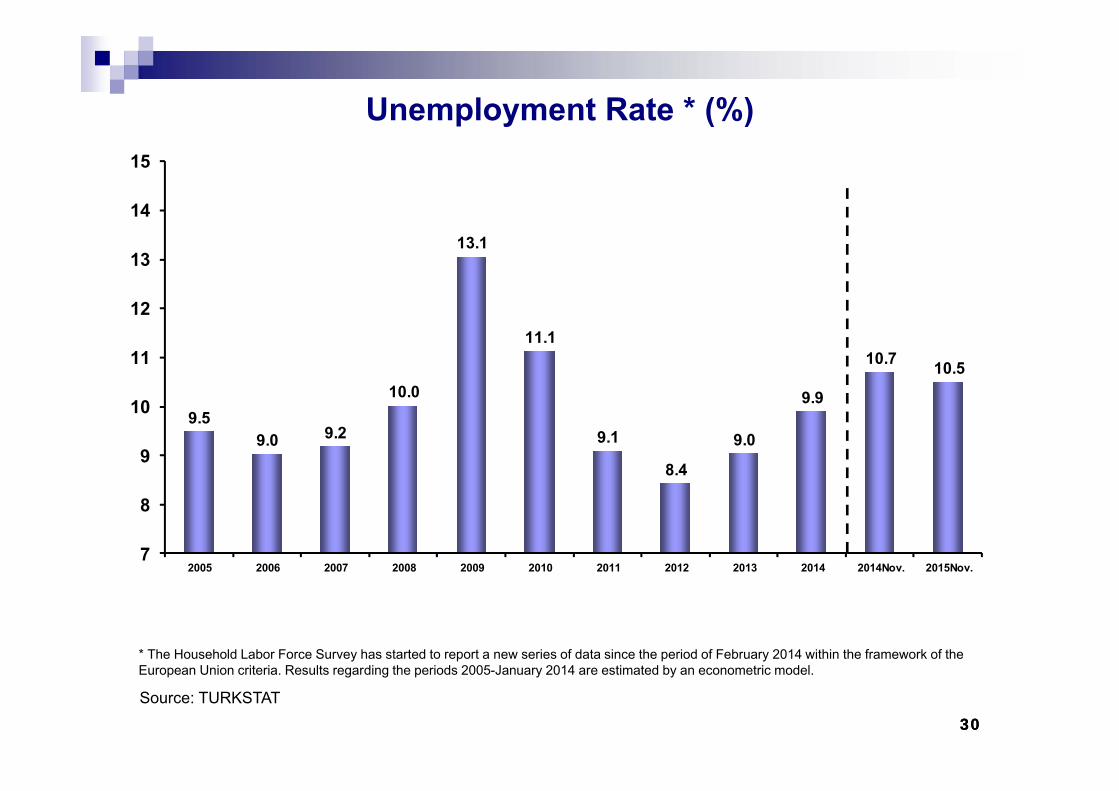
Unemployment Rate * (%)
9.59.0 9.2
10.0
13.1
11.1
9.1
8.4
9.0
9.9
10.7 10.5
7
8
9
10
11
12
13
14
15
2005 2006 2007 2008 2009 2010 2011 2012 2013 2014 2014Nov. 2015Nov.
Source: TURKSTAT
* The Household Labor Force Survey has started to report a new series of data since the period of February 2014 within the framework of the European Union criteria. Results regarding the periods 2005-January 2014 are estimated by an econometric model.
31
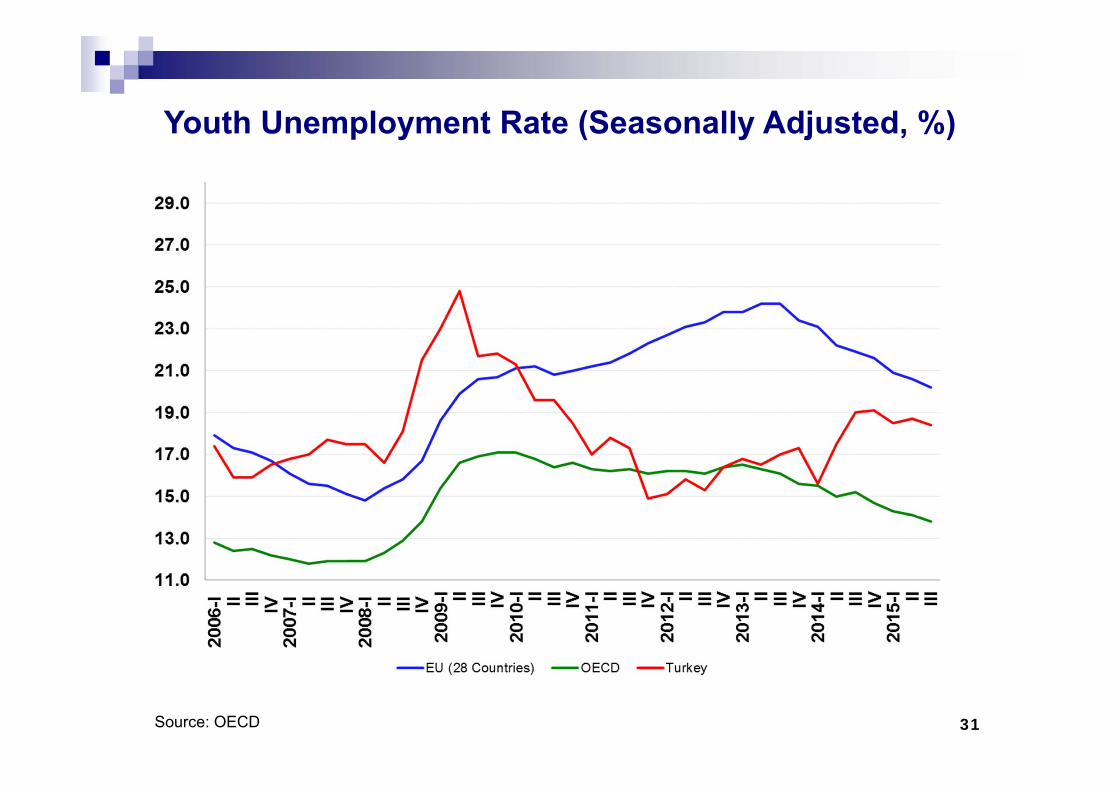
Youth Unemployment Rate (Seasonally Adjusted, %)
Source: OECD
323232
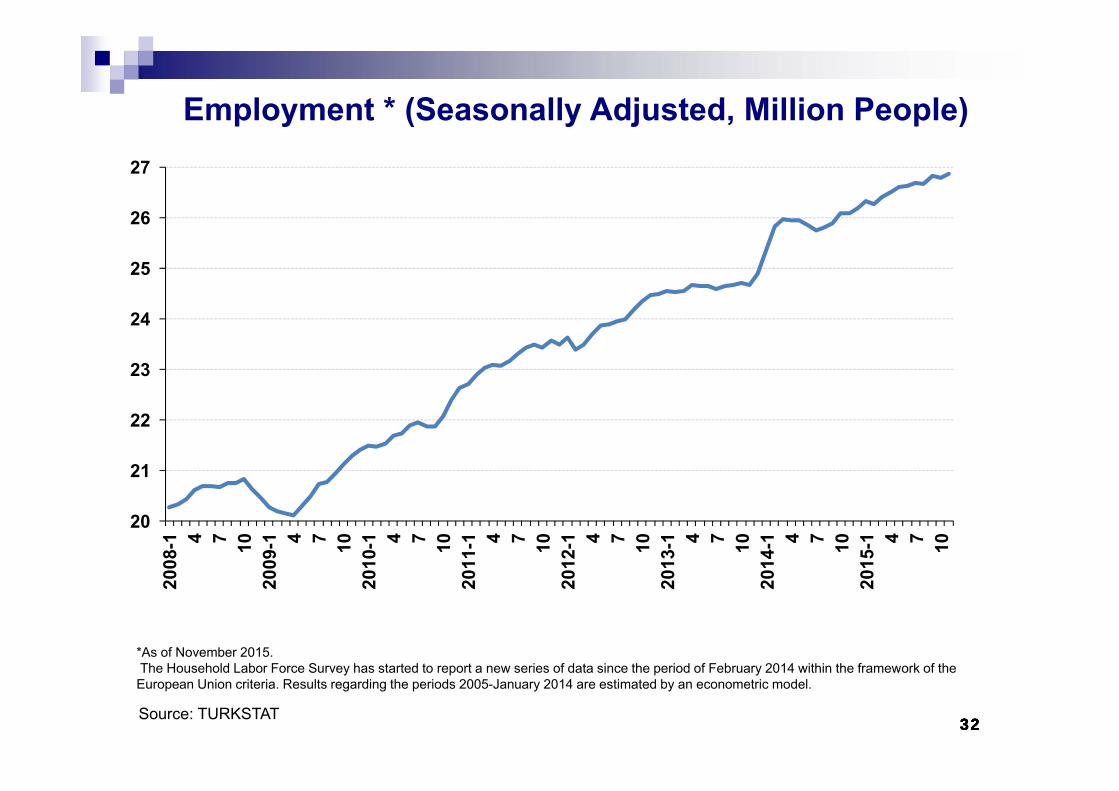
Employment * (Seasonally Adjusted, Million People)
Source: TURKSTAT 32
20
21
22
23
24
25
26
2720
08-1 4 7 10
2009
-1 4 7 1020
10-1 4 7 10
2011
-1 4 7 1020
12-1 4 7 10
2013
-1 4 7 1020
14-1 4 7 10
2015
-1 4 7 10
*As of November 2015.The Household Labor Force Survey has started to report a new series of data since the period of February 2014 within the framework of the European Union criteria. Results regarding the periods 2005-January 2014 are estimated by an econometric model.
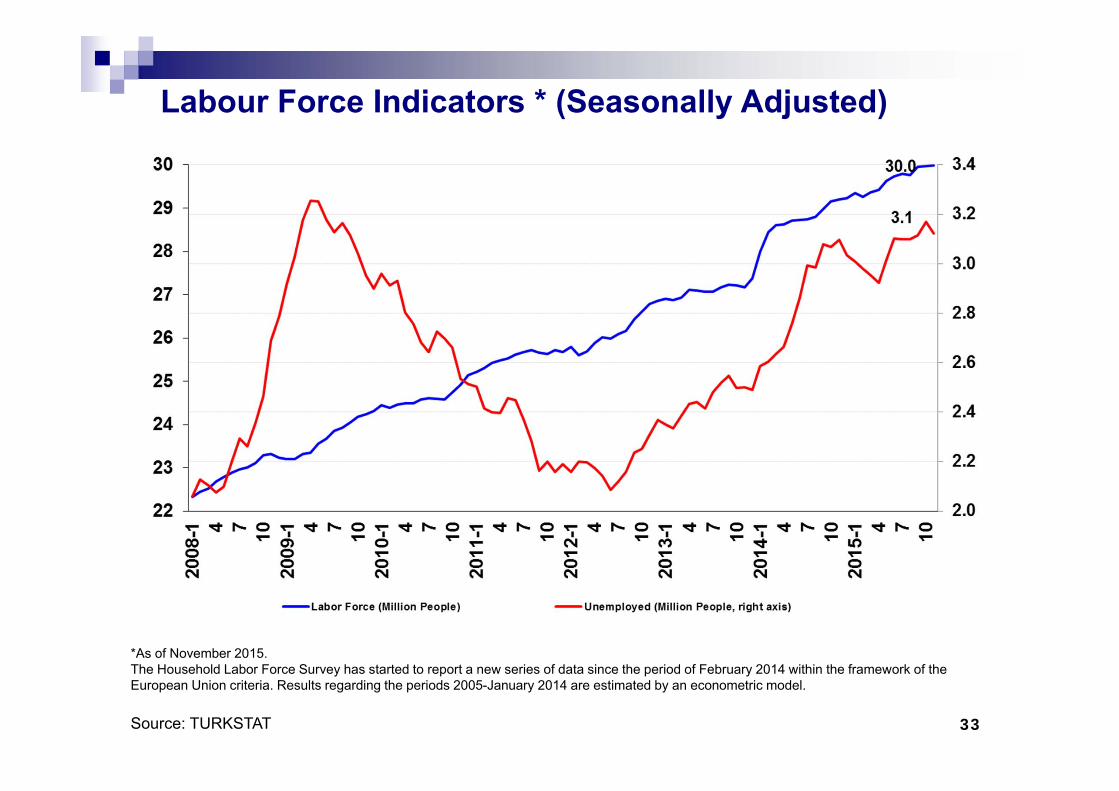
Labour Force Indicators * (Seasonally Adjusted)
33Source: TURKSTAT
*As of November 2015. The Household Labor Force Survey has started to report a new series of data since the period of February 2014 within the framework of the European Union criteria. Results regarding the periods 2005-January 2014 are estimated by an econometric model.
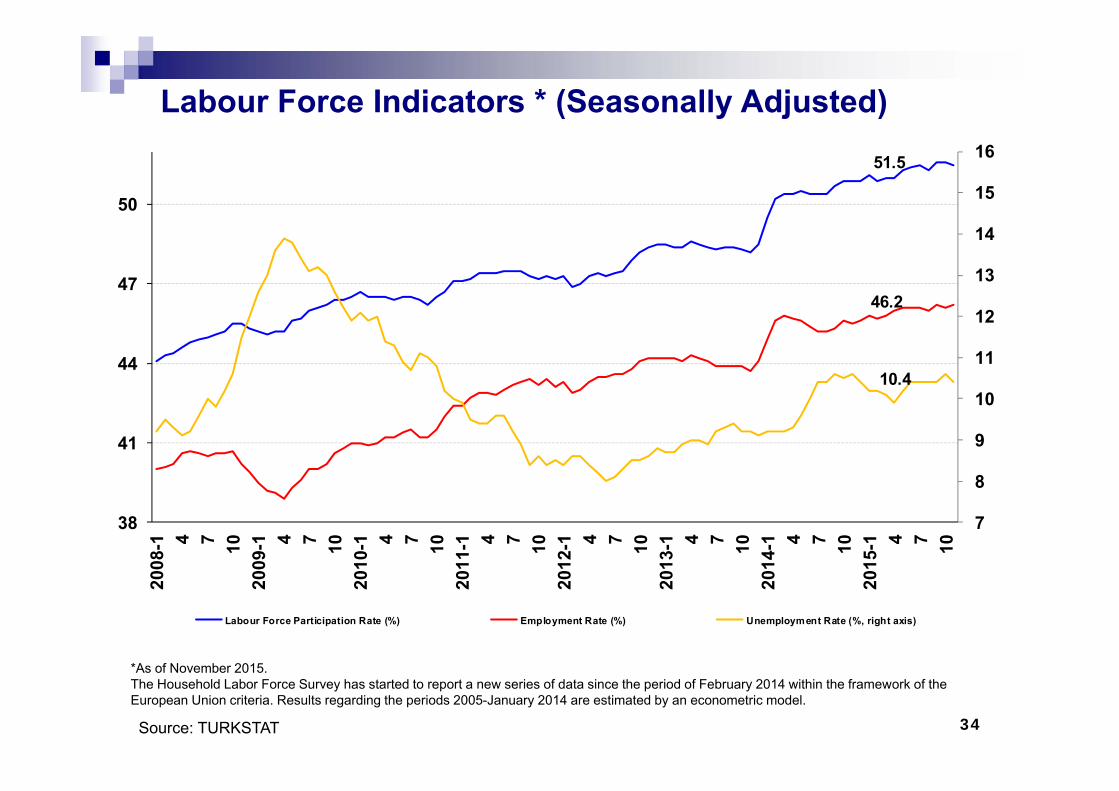
Labour Force Indicators * (Seasonally Adjusted)
51.5
46.2
10.4
7
8
9
10
11
12
13
14
15
16
38
41
44
47
50
2008
-1 4 7 1020
09-1 4 7 10
2010
-1 4 7 1020
11-1 4 7 10
2012
-1 4 7 1020
13-1 4 7 10
2014
-1 4 7 1020
15-1 4 7 10
Labour Force Participation Rate (%) Employment Rate (%) Unemployment Rate (%, right axis)
34Source: TURKSTAT
*As of November 2015. The Household Labor Force Survey has started to report a new series of data since the period of February 2014 within the framework of the European Union criteria. Results regarding the periods 2005-January 2014 are estimated by an econometric model.
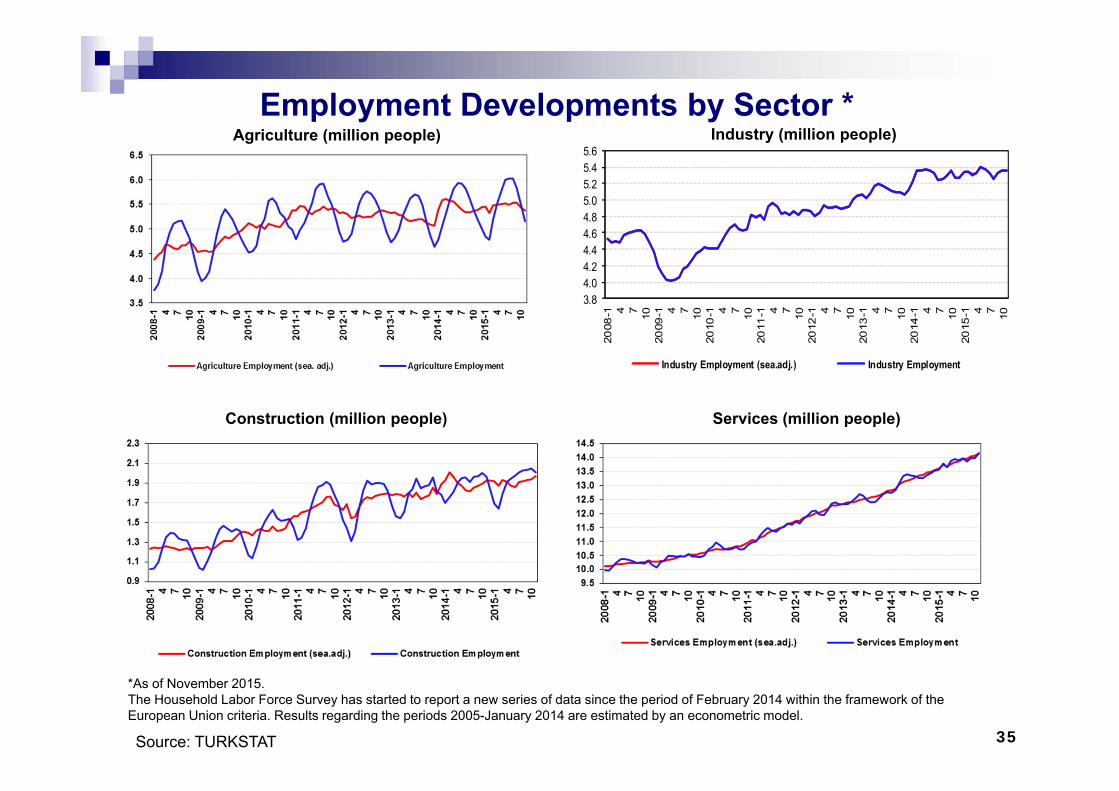
Agriculture (million people)Employment Developments by Sector *
35
3.84.04.24.44.64.85.05.25.45.6
2008
-1 4 7 1020
09-1 4 7 10
2010
-1 4 7 1020
11-1 4 7 10
2012
-1 4 7 1020
13-1 4 7 10
2014
-1 4 7 1020
15-1 4 7 10
Industry Employment (sea.adj.) Industry Employment
Industry (million people)
Construction (million people) Services (million people)
Source: TURKSTAT
*As of November 2015. The Household Labor Force Survey has started to report a new series of data since the period of February 2014 within the framework of the European Union criteria. Results regarding the periods 2005-January 2014 are estimated by an econometric model.
36
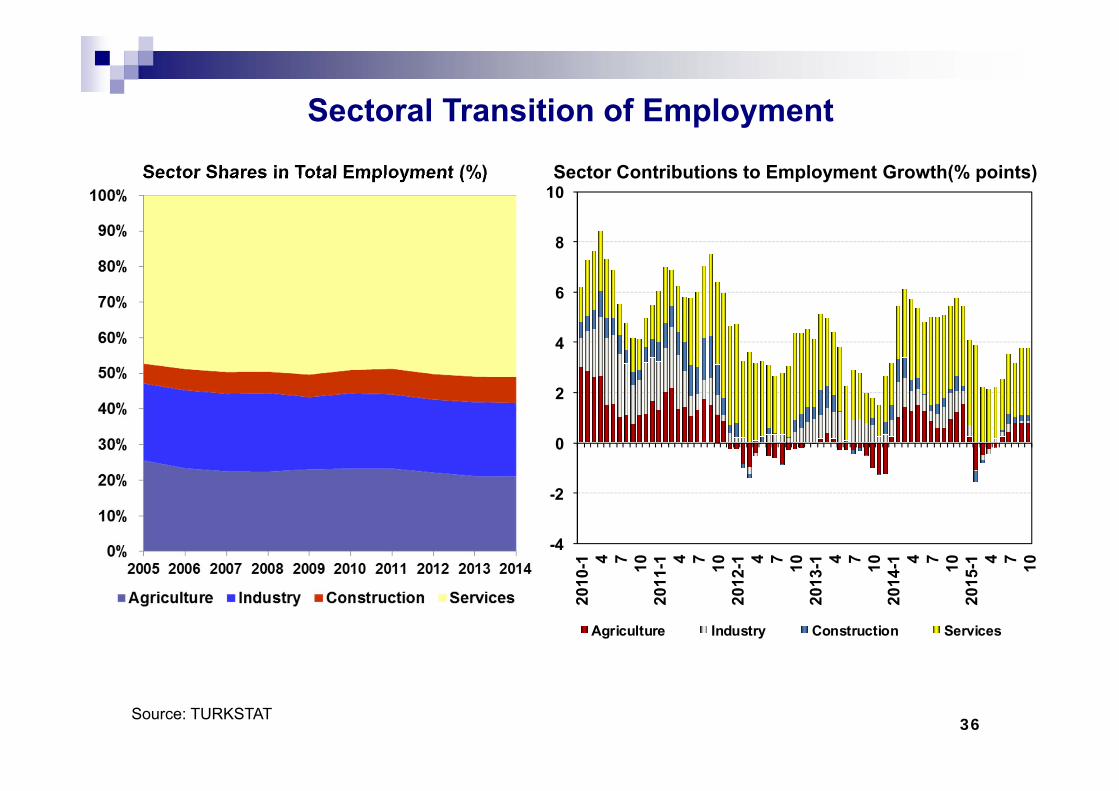
Sector Shares in Total Employment (%)
Sectoral Transition of Employment
-4
-2
0
2
4
6
8
10
2010
-1 4 7 1020
11-1 4 7 10
2012
-1 4 7 1020
13-1 4 7 10
2014
-1 4 7 1020
15-1 4 7 10
Agriculture Industry Construction Services
Sector Contributions to Employment Growth(% points)
Source: TURKSTAT
37
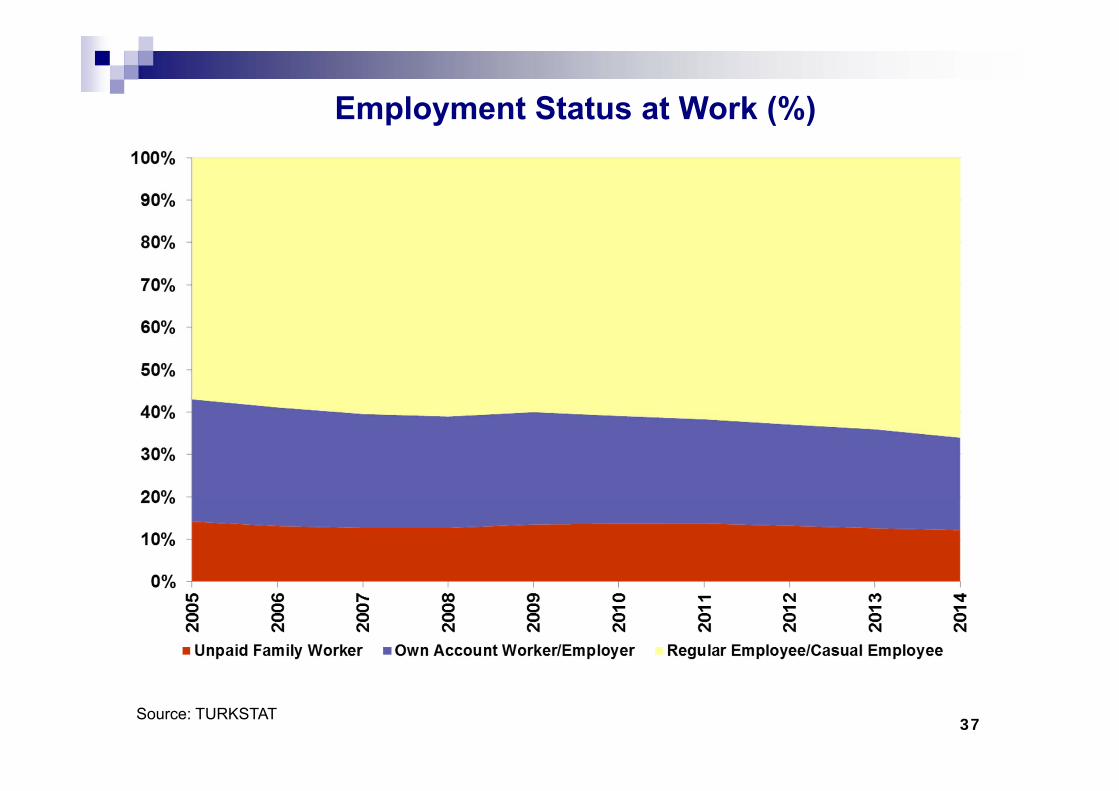
Employment Status at Work (%)
Source: TURKSTAT
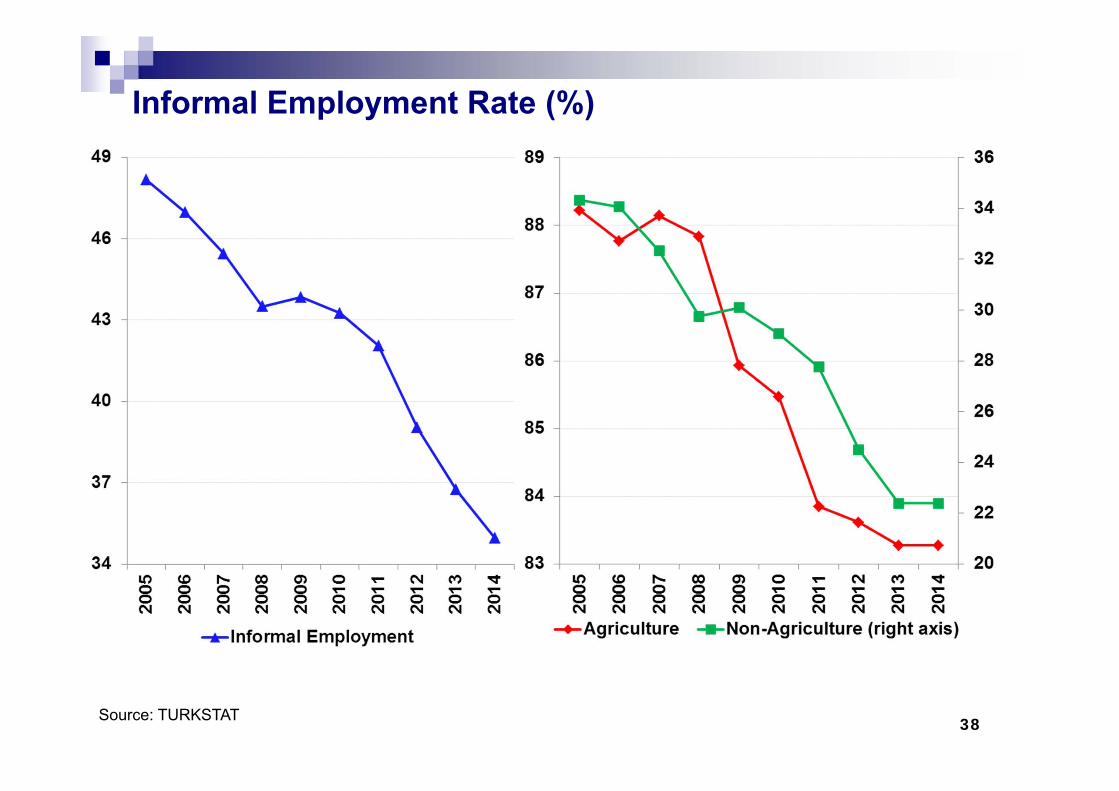
Informal Employment Rate (%)
38Source: TURKSTAT
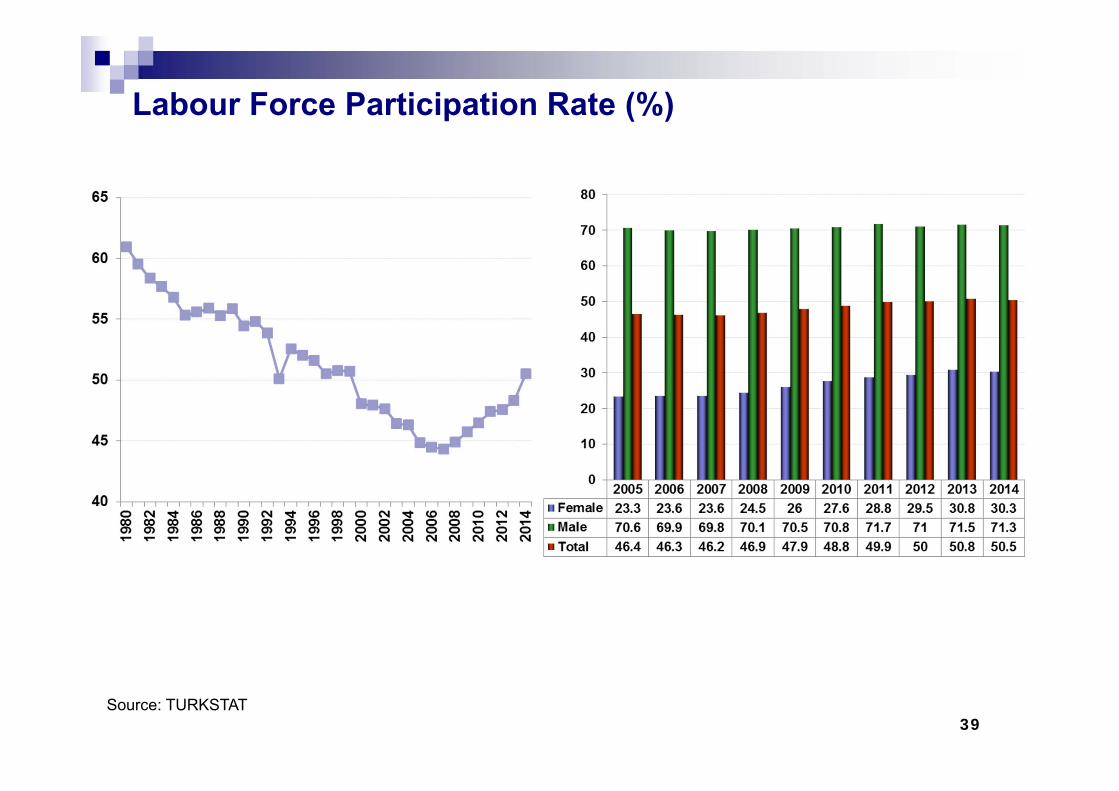
39
Labour Force Participation Rate (%)
Source: TURKSTAT
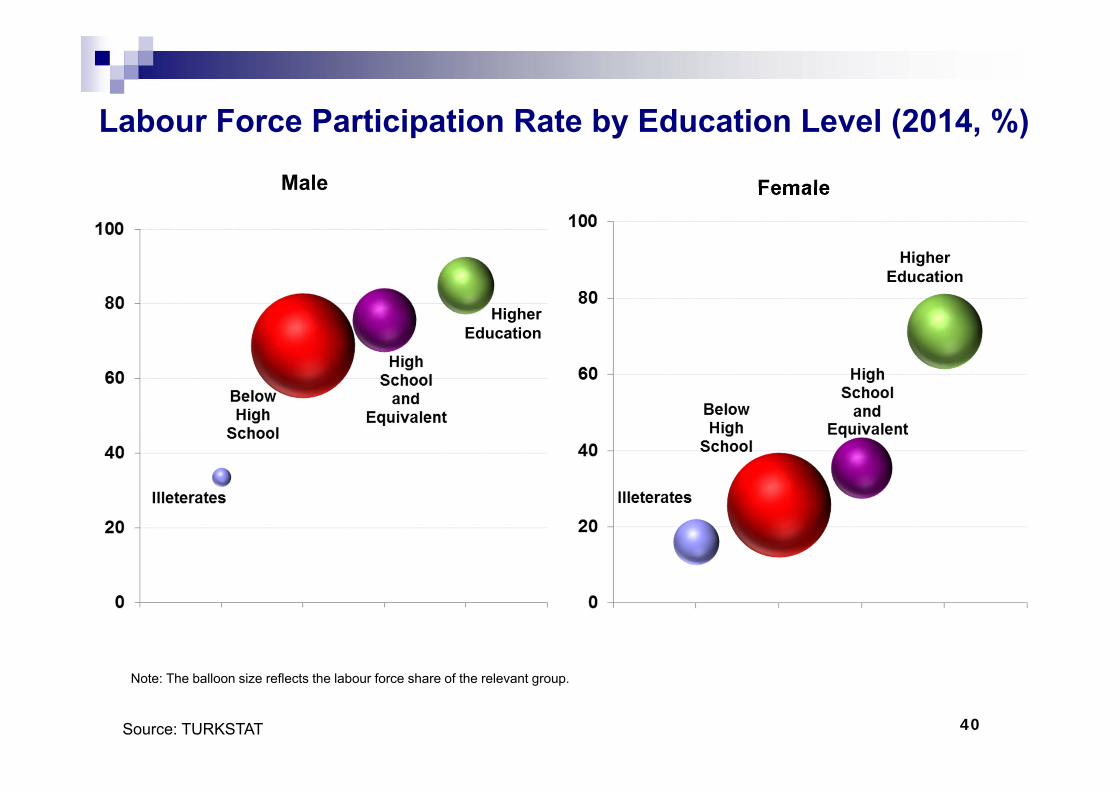
Labour Force Participation Rate by Education Level (2014, %)
40
Male Female
Higher Education
Note: The balloon size reflects the labour force share of the relevant group.
Higher Education
Source: TURKSTAT
414141
INFLATION
424242
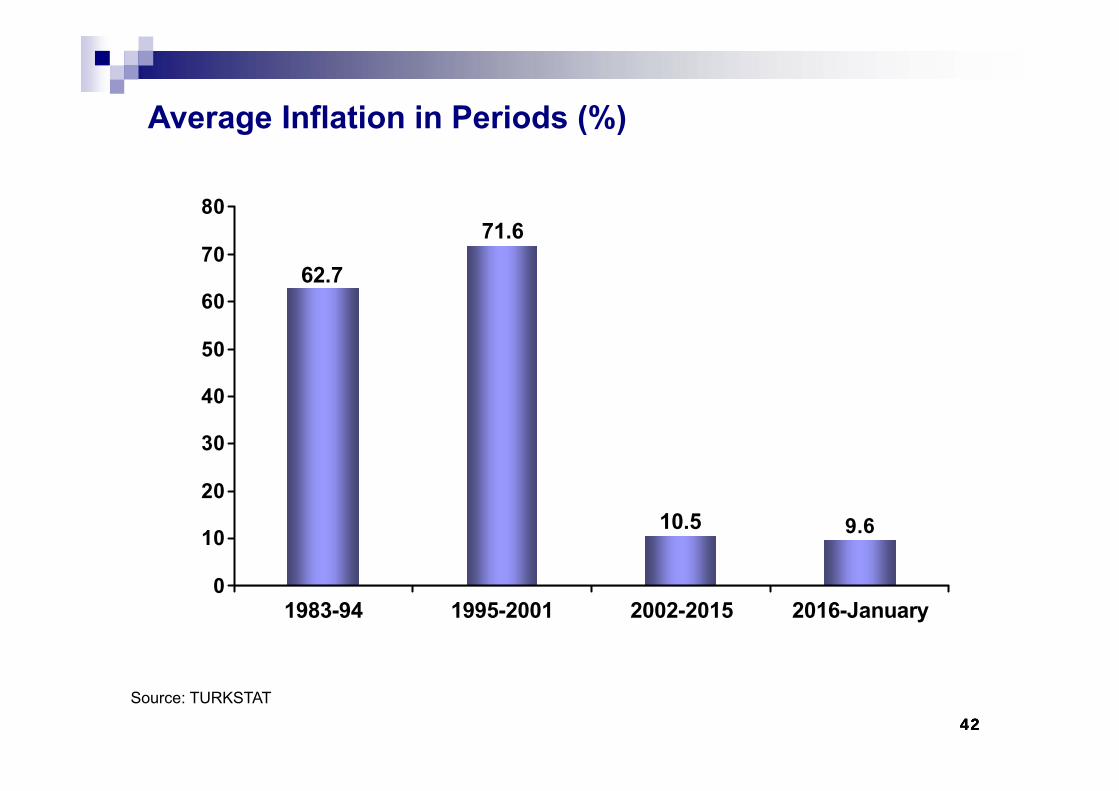
Average Inflation in Periods (%)
62.7
71.6
10.5 9.6
0
10
20
30
40
50
60
70
80
1983-94 1995-2001 2002-2015 2016-January
Source: TURKSTAT
434343
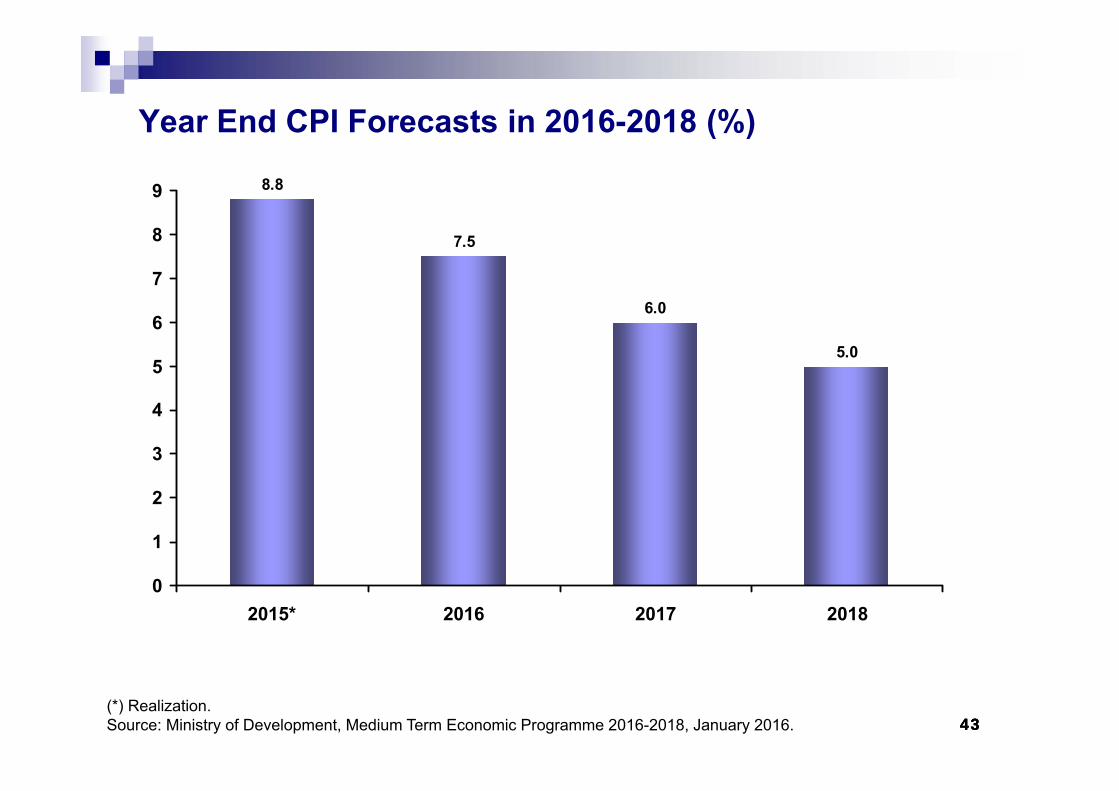
8.8
7.5
6.0
5.0
0
1
2
3
4
5
6
7
8
9
2015* 2016 2017 2018
Year End CPI Forecasts in 2016-2018 (%)
(*) Realization. Source: Ministry of Development, Medium Term Economic Programme 2016-2018, January 2016.
444444
-5
0
5
10
15
20
25
30
35D
ec-0
5
Jun-
06
Dec
-06
Jun-
07
Dec
-07
Jun-
08
Dec
-08
Jun-
09
Dec
-09
Jun-
10
Dec
-10
Jun-
11
Dec
-11
Jun-
12
Dec
-12
Jun-
13
Dec
-13
Jun-
14
Dec
-14
Jun-
15
Dec
-15
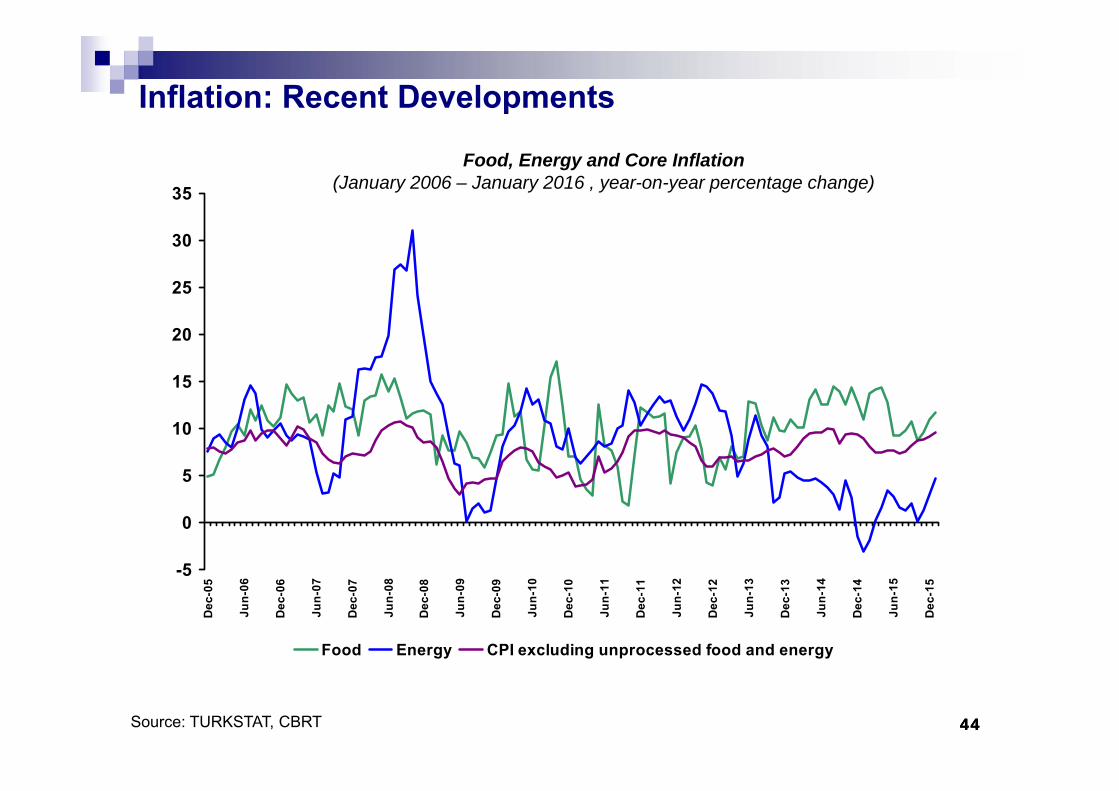
Food Energy CPI excluding unprocessed food and energy
Food, Energy and Core Inflation(January 2006 – January 2016 , year-on-year percentage change)
Inflation: Recent Developments
Source: TURKSTAT, CBRT
454545
0
5
10
15
20
25D
ec-0
5
May
-06
Oct
-06
Mar
-07
Aug
-07
Jan-
08
Jun-
08
Nov
-08
Apr
-09
Sep-
09
Feb-
10
Jul-1
0
Dec
-11
May
-11
Oct
-11
Mar
-12
Aug
-12
Jan-
13
Jun-
13
Nov
-13
Apr
-14
Sep-
14
Feb-
15
Jul-1
5
Dec
-15
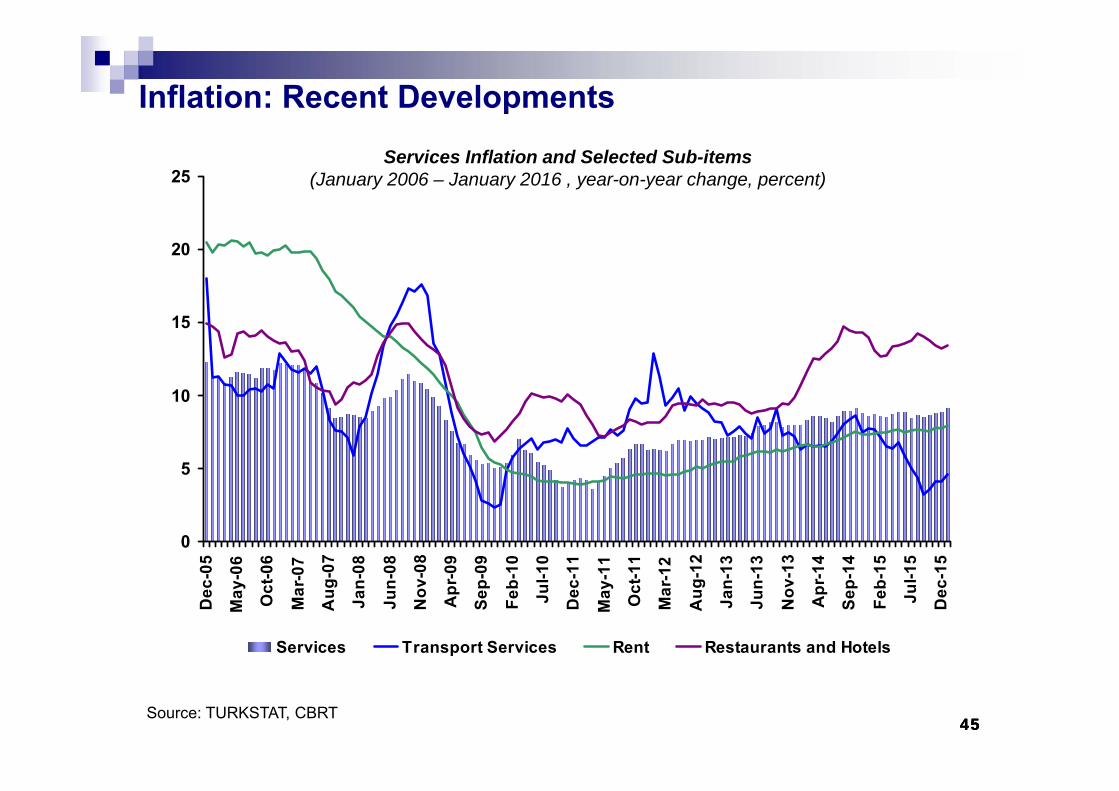
Services Transport Services Rent Restaurants and Hotels
Inflation: Recent Developments Services Inflation and Selected Sub-items
(January 2006 – January 2016 , year-on-year change, percent)
Source: TURKSTAT, CBRT
464646
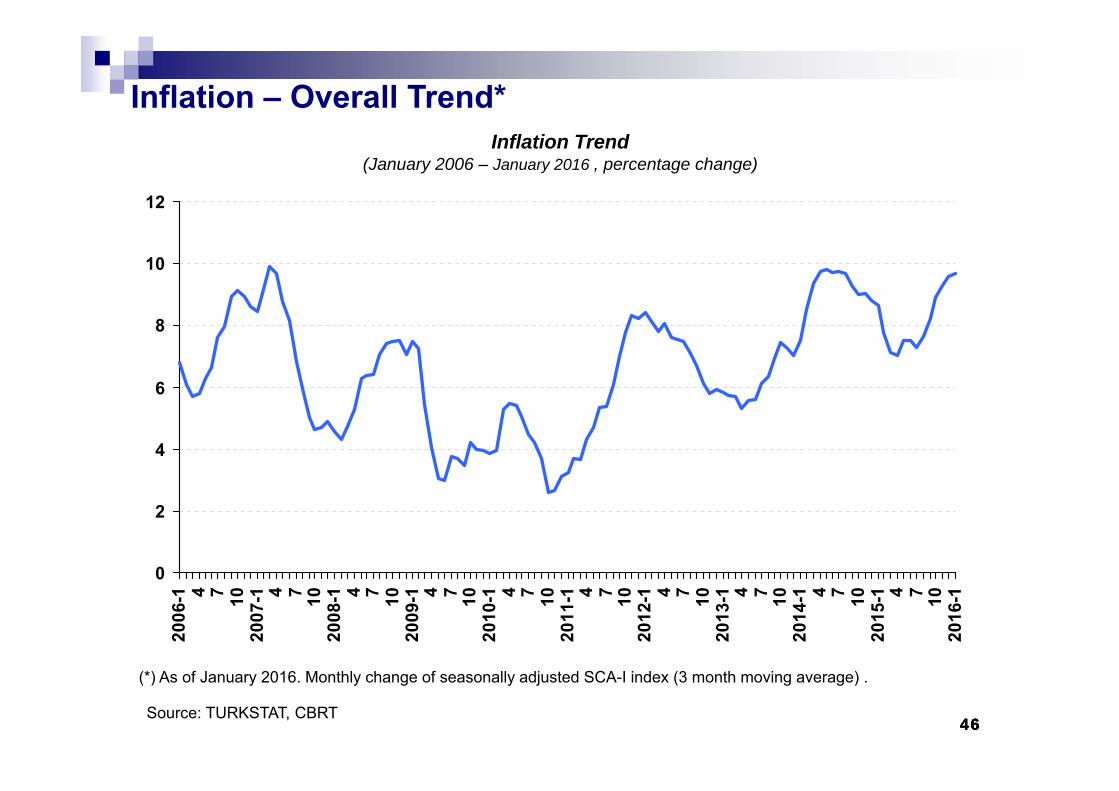
Inflation – Overall Trend*
0
2
4
6
8
10
1220
06-1 4 7 10
2007
-1 4 7 1020
08-1 4 7 10
2009
-1 4 7 1020
10-1 4 7 10
2011
-1 4 7 1020
12-1 4 7 10
2013
-1 4 7 1020
14-1 4 7 10
2015
-1 4 7 1020
16-1
Inflation Trend(January 2006 – January 2016 , percentage change)
(*) As of January 2016. Monthly change of seasonally adjusted SCA-I index (3 month moving average) .
Source: TURKSTAT, CBRT
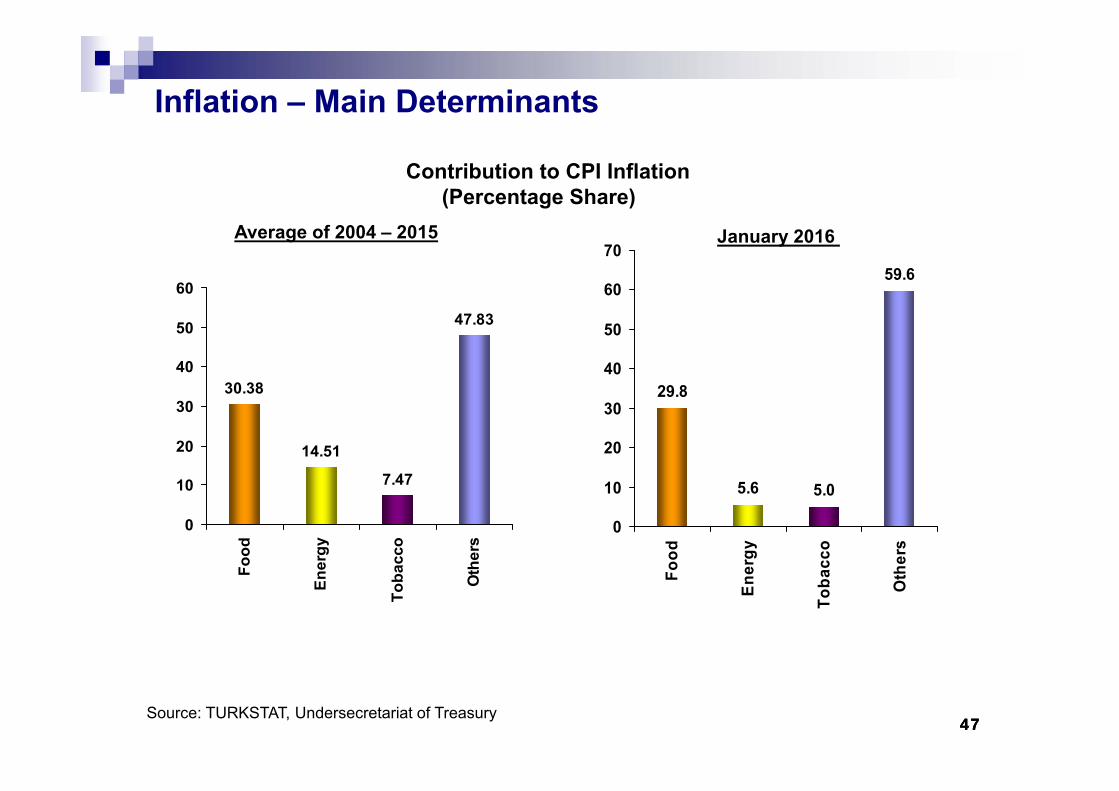
29.8
5.6 5.0
59.6
0
10
20
30
40
50
60
70
Food
Ener
gy
Toba
cco
Oth
ers
474747
Average of 2004 – 2015 January 2016
Inflation – Main Determinants
Contribution to CPI Inflation (Percentage Share)
Source: TURKSTAT, Undersecretariat of Treasury
30.38
14.51
7.47
47.83
0
10
20
30
40
50
60
Food
Ener
gy
Toba
cco
Oth
ers
4848
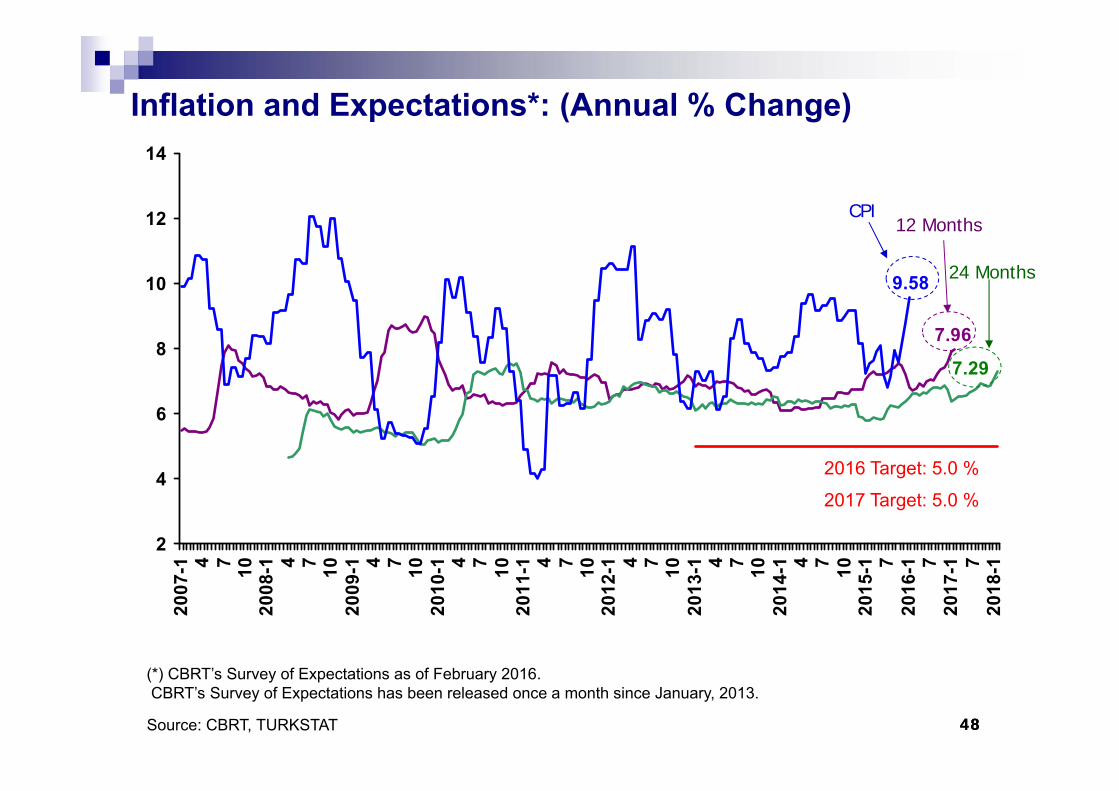
Inflation and Expectations*: (Annual % Change)
7.96
7.29
9.58
2
4
6
8
10
12
1420
07-1 4 7 10
2008
-1 4 7 1020
09-1 4 7 10
2010
-1 4 7 1020
11-1 4 7 10
2012
-1 4 7 1020
13-1 4 7 10
2014
-1 4 7 1020
15-1 7
2016
-1 720
17-1 7
2018
-1
CPI12 Months
24 Months
Source: CBRT, TURKSTAT
(*) CBRT’s Survey of Expectations as of February 2016.CBRT’s Survey of Expectations has been released once a month since January, 2013.
2016 Target: 5.0 %
2017 Target: 5.0 %
494949
0
4
8
12
16
20
24
28
32
103
4 710104
4 710105
4 710106
4 710107
4 710108
4 710109
4 710110
4 710111
4 710112
4 710113
4 710114
4 710115
4 710116
4 710117
4 710118
12 months 24
months
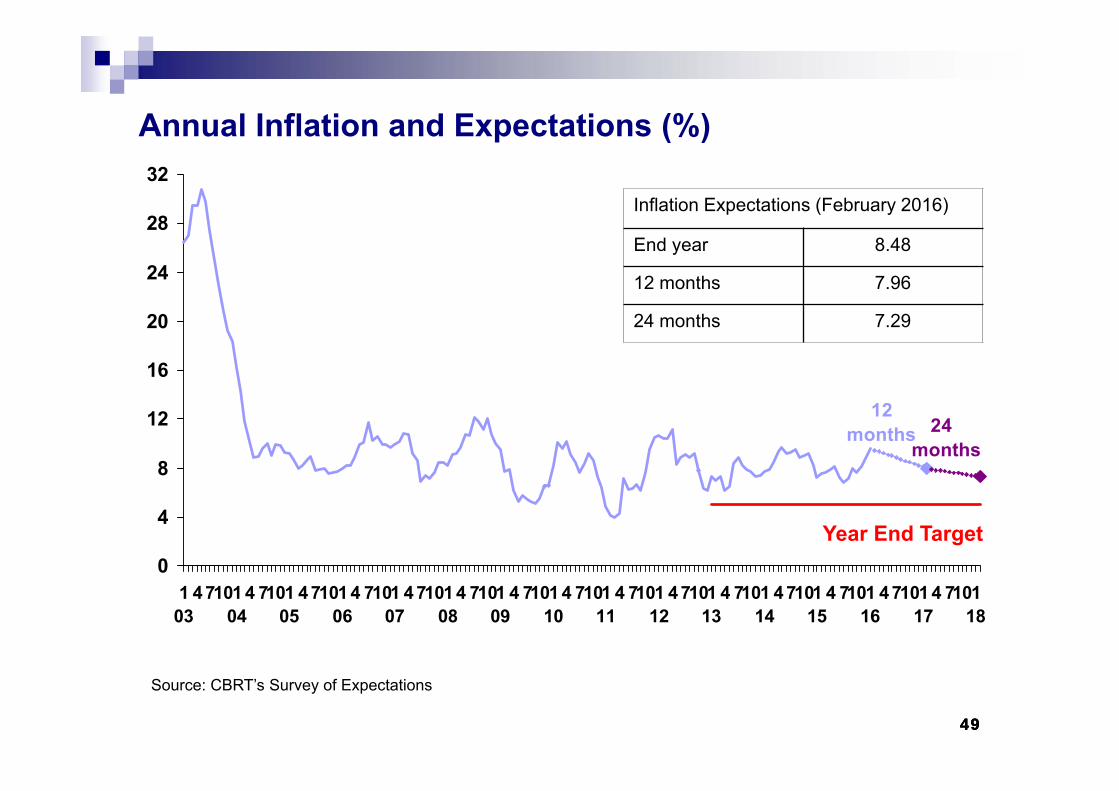
Inflation Expectations (February 2016)
End year 8.48
12 months 7.96
24 months 7.29
Annual Inflation and Expectations (%)
Source: CBRT’s Survey of Expectations
Year End Target
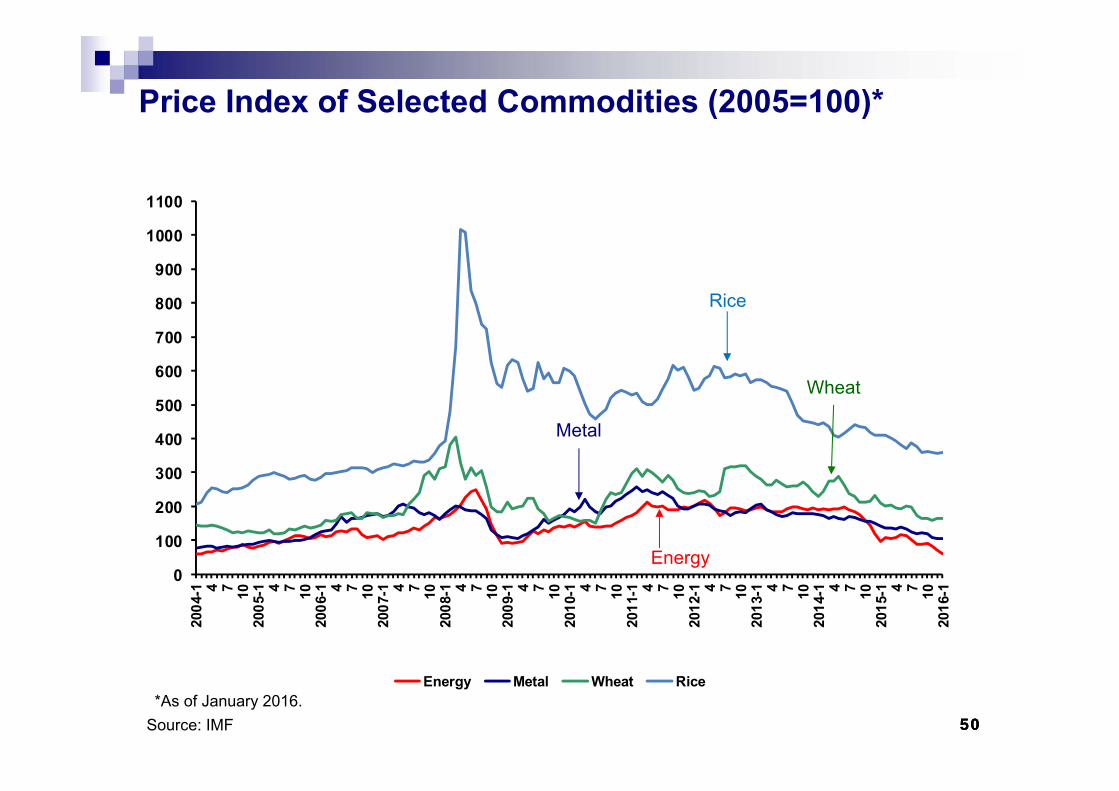
505050
0
100
200
300
400
500
600
700
800
900
1000
110020
04-1 4 7 10
2005
-1 4 7 1020
06-1 4 7 10
2007
-1 4 7 1020
08-1 4 7 10
2009
-1 4 7 1020
10-1 4 7 10
2011
-1 4 7 1020
12-1 4 7 10
2013
-1 4 7 1020
14-1 4 7 10
2015
-1 4 7 1020
16-1
Energy Metal Wheat Rice
Energy
Metal
Wheat
Rice
Source: IMF
Price Index of Selected Commodities (2005=100)*
*As of January 2016.
515151
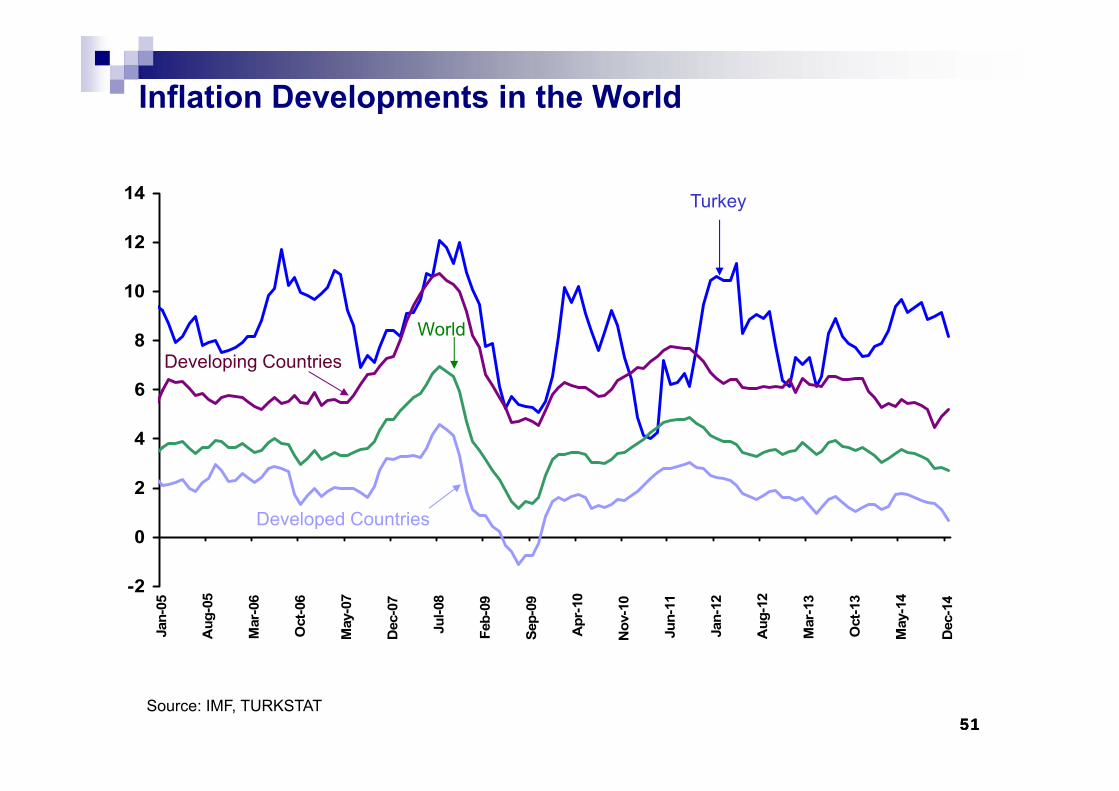
Inflation Developments in the World
-2
0
2
4
6
8
10
12
14
Jan-
05
Aug
-05
Mar
-06
Oct
-06
May
-07
Dec
-07
Jul-0
8
Feb-
09
Sep-
09
Apr
-10
Nov
-10
Jun-
11
Jan-
12
Aug
-12
Mar
-13
Oct
-13
May
-14
Dec
-14
Turkey
World
Developing Countries
Developed Countries
Source: IMF, TURKSTAT
5252
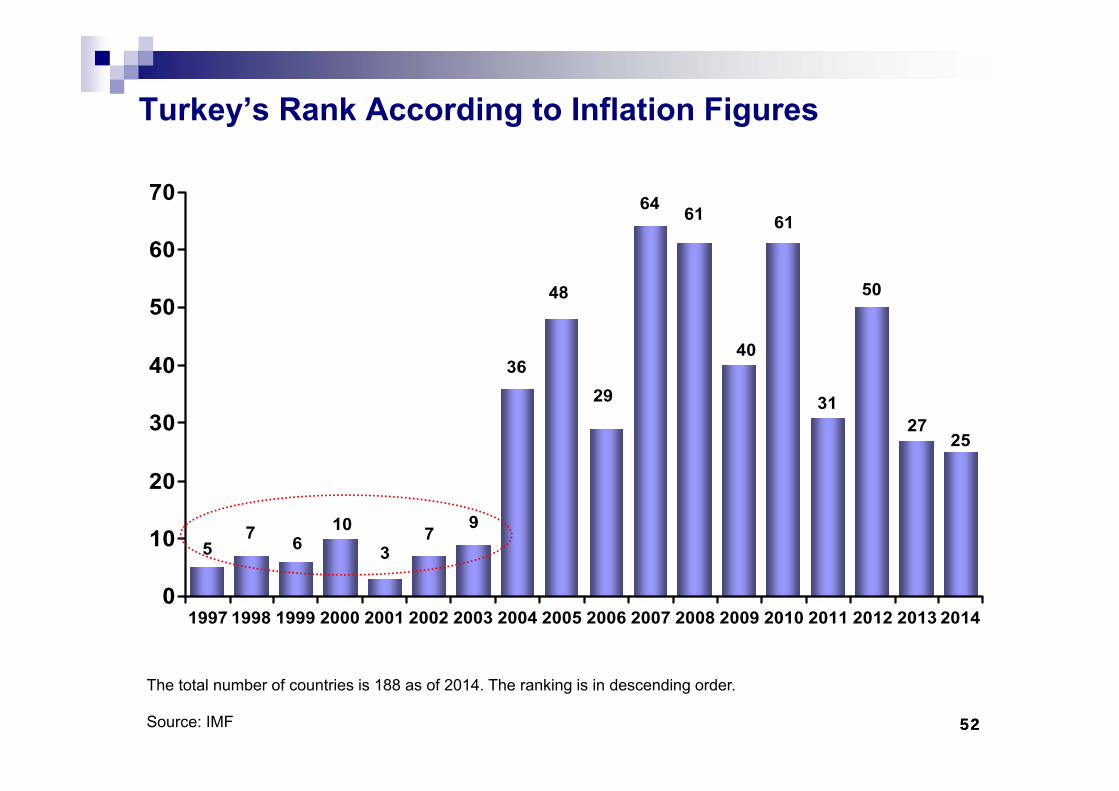
Turkey’s Rank According to Inflation Figures
The total number of countries is 188 as of 2014. The ranking is in descending order.
57 6
103
7 9
36
48
29
64 61
40
61
31
50
2725
0
10
20
30
40
50
60
70
1997 1998 1999 2000 2001 2002 2003 2004 2005 2006 2007 2008 2009 2010 2011 2012 2013 2014
Source: IMF
535353
FOREIGN TRADE and BALANCE OF PAYMENTS
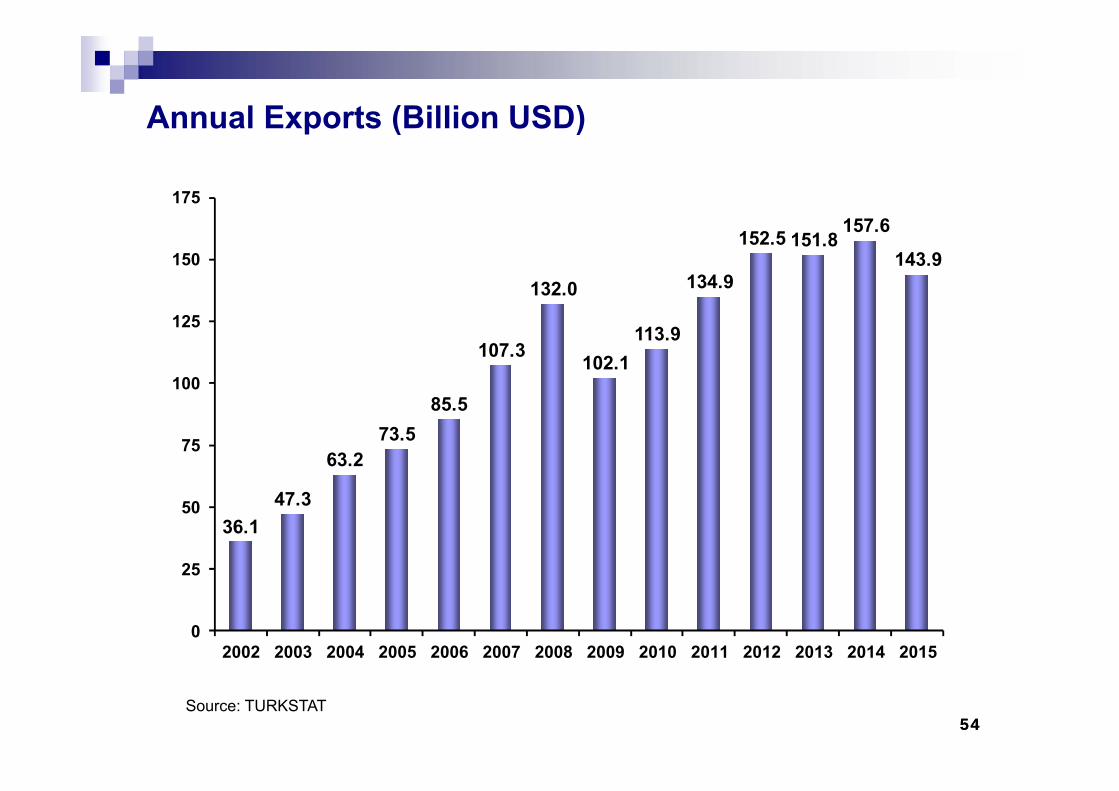
5454
36.147.3
63.273.5
85.5
107.3
132.0
102.1113.9
134.9
152.5 151.8157.6
143.9
0
25
50
75
100
125
150
175
2002 2003 2004 2005 2006 2007 2008 2009 2010 2011 2012 2013 2014 2015
Annual Exports (Billion USD)
Source: TURKSTAT
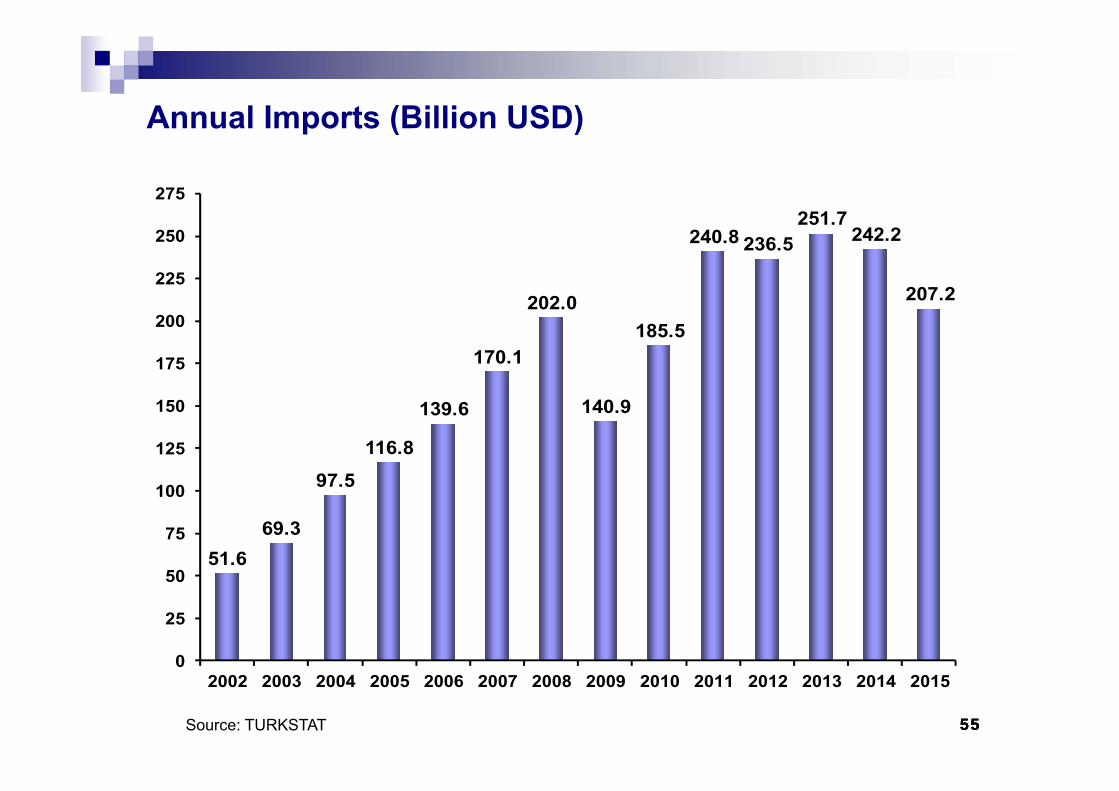
555555
Annual Imports (Billion USD)
Source: TURKSTAT
51.669.3
97.5
116.8
139.6
170.1
202.0
140.9
185.5
240.8 236.5251.7
242.2
207.2
0
25
50
75
100
125
150
175
200
225
250
275
2002 2003 2004 2005 2006 2007 2008 2009 2010 2011 2012 2013 2014 2015
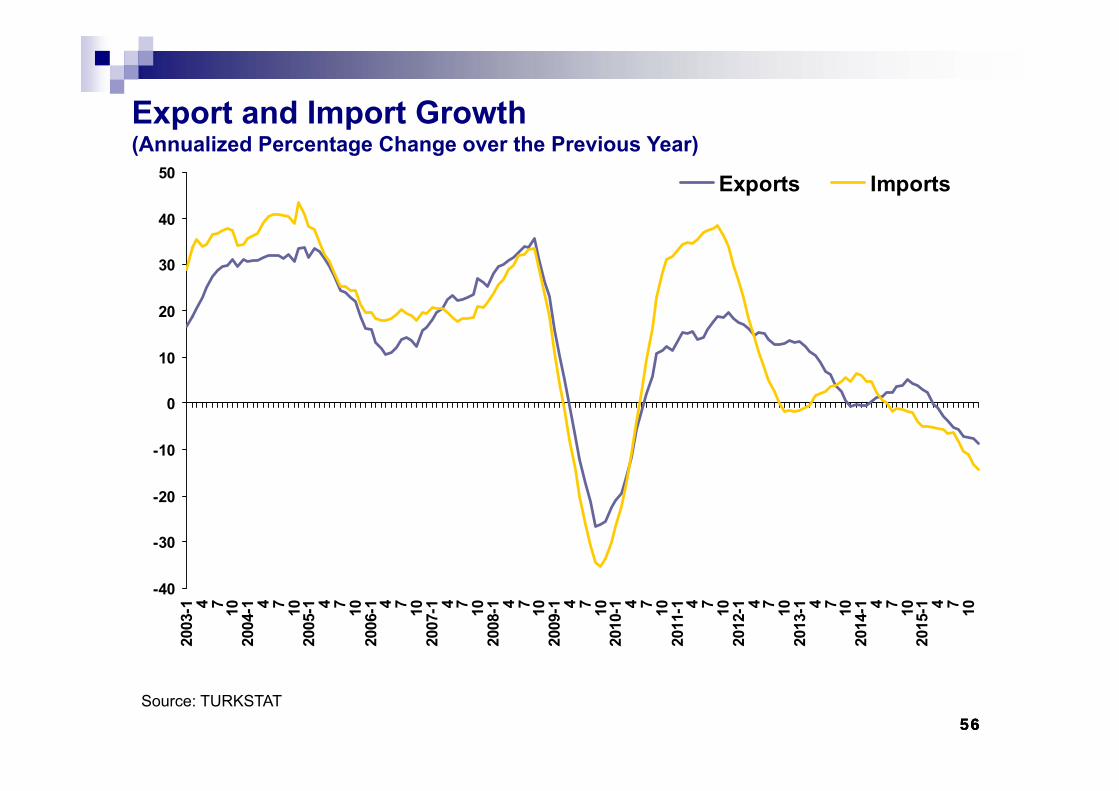
565656
Export and Import Growth (Annualized Percentage Change over the Previous Year)
-40
-30
-20
-10
0
10
20
30
40
5020
03-1 4 7 10
2004
-1 4 7 1020
05-1 4 7 10
2006
-1 4 7 1020
07-1 4 7 10
2008
-1 4 7 1020
09-1 4 7 10
2010
-1 4 7 1020
11-1 4 7 10
2012
-1 4 7 1020
13-1 4 7 10
2014
-1 4 7 1020
15-1 4 7 10
Exports Imports
Source: TURKSTAT
575757
80100120140160180200220240260280300
01 Q
101
Q3
02 Q
102
Q3
03 Q
103
Q3
04 Q
104
Q3
05 Q
105
Q3
06 Q
106
Q3
07 Q
107
Q3
08 Q
108
Q3
09 Q
109
Q3
10 Q
110
Q3
11 Q
111
Q3
12 Q
112
Q3
13 Q
113
Q3
14 Q
114
Q3
15 Q
115
Q3
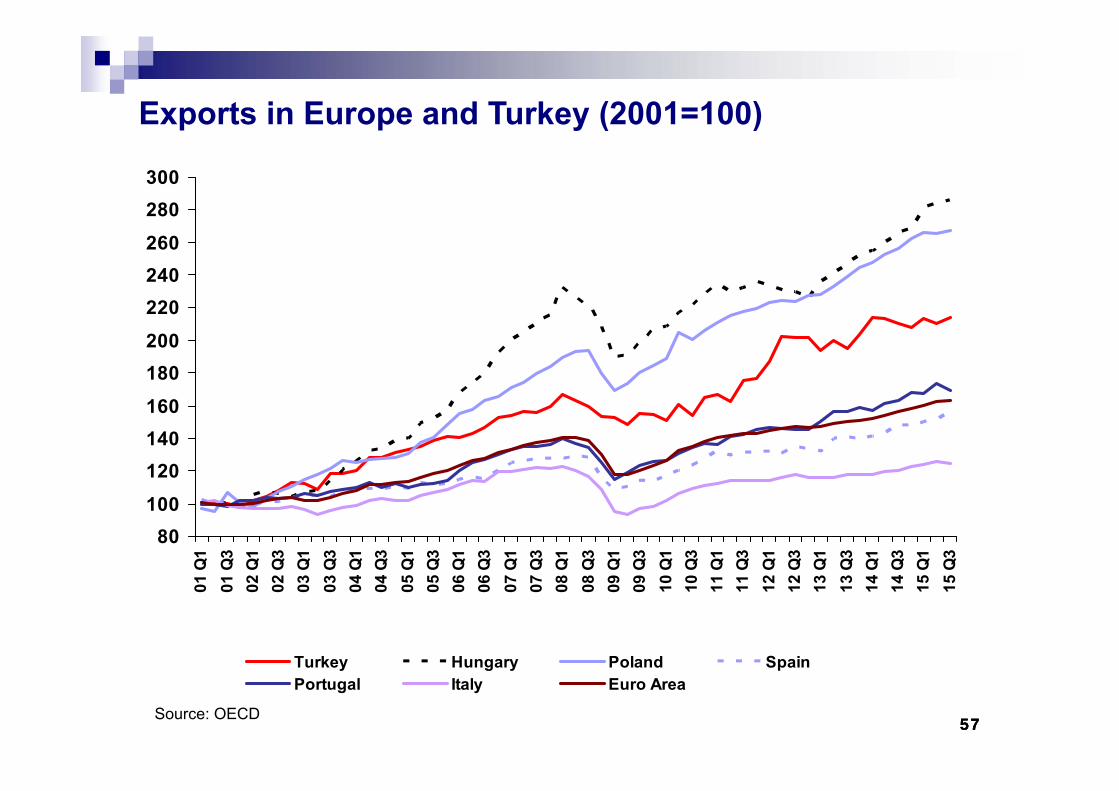
Turkey Hungary Poland SpainPortugal Italy Euro Area
Exports in Europe and Turkey (2001=100)
Source: OECD
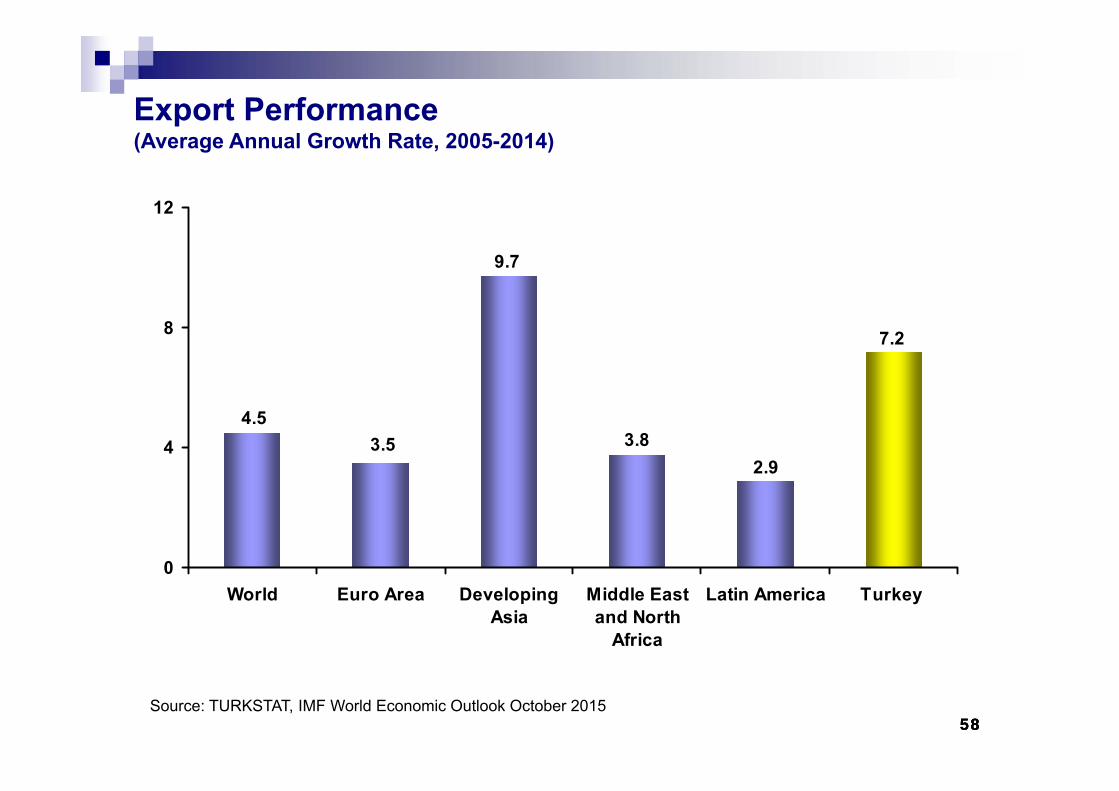
585858
3.82.9
7.2
9.7
3.54.5
0
4
8
12
World Euro Area DevelopingAsia
Middle Eastand North
Africa
Latin America Turkey
Export Performance (Average Annual Growth Rate, 2005-2014)
Source: TURKSTAT, IMF World Economic Outlook October 2015
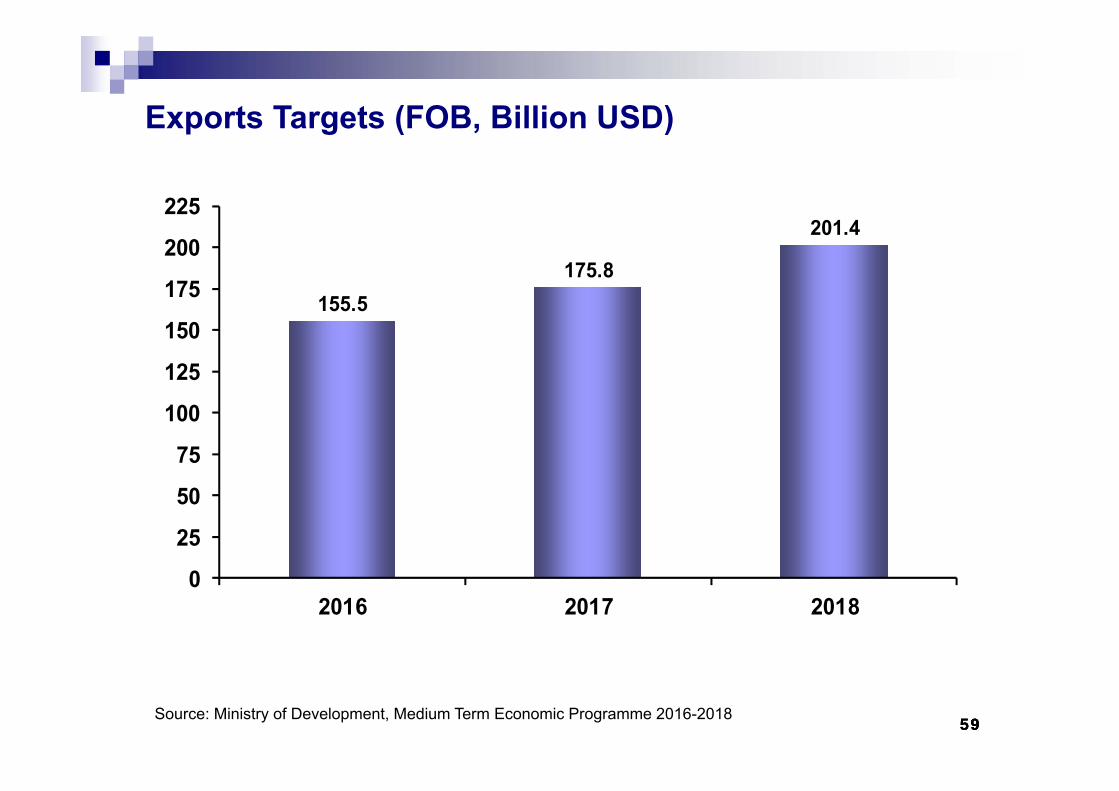
595959
155.5175.8
201.4
0
25
50
75
100
125
150
175
200
225
2016 2017 2018
Exports Targets (FOB, Billion USD)
Source: Ministry of Development, Medium Term Economic Programme 2016-2018
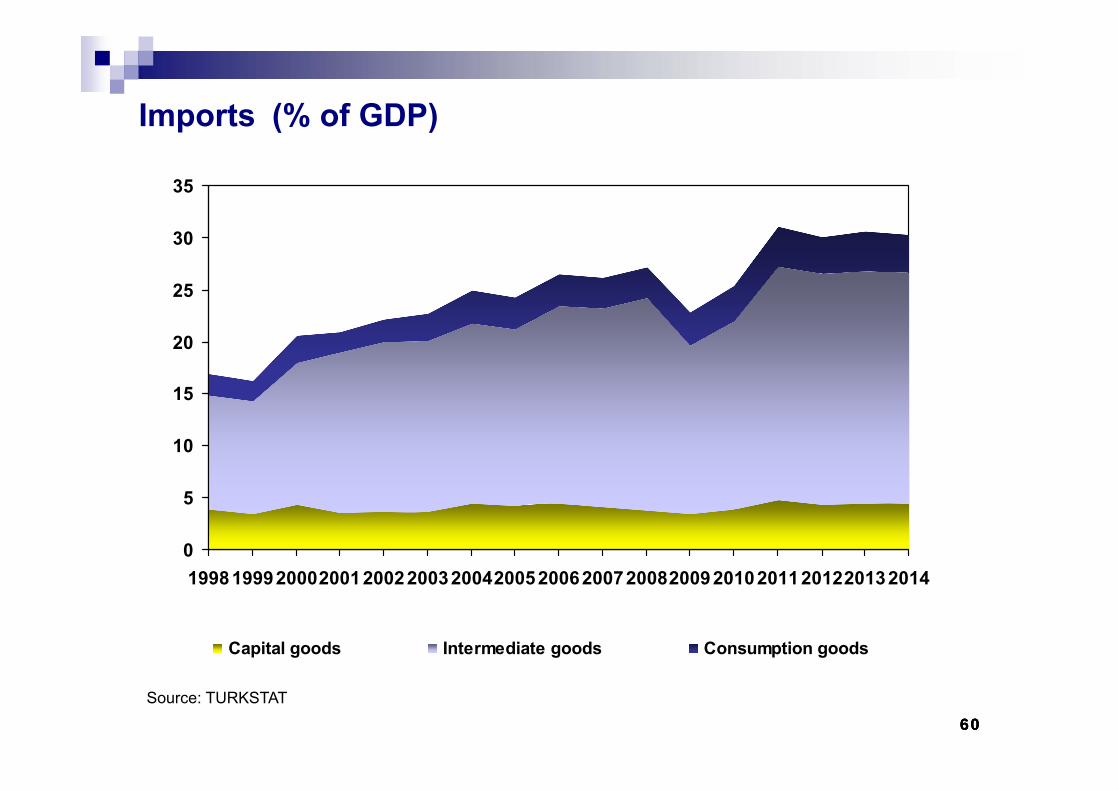
606060
0
5
10
15
20
25
30
35
19981999200020012002200320042005200620072008200920102011201220132014
Capital goods Intermediate goods Consumption goods
Imports (% of GDP)
Source: TURKSTAT
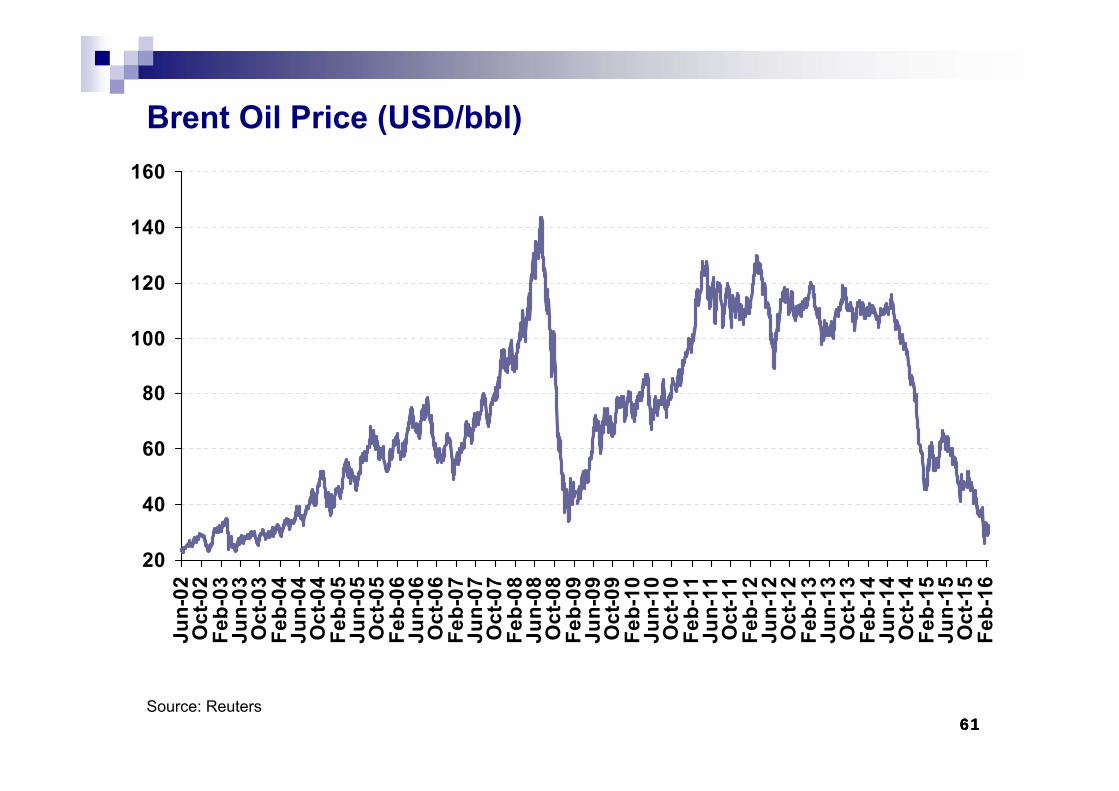
616161
Brent Oil Price (USD/bbl)
20
40
60
80
100
120
140
160Ju
n-02
Oct
-02
Feb-
03Ju
n-03
Oct
-03
Feb-
04Ju
n-04
Oct
-04
Feb-
05Ju
n-05
Oct
-05
Feb-
06Ju
n-06
Oct
-06
Feb-
07Ju
n-07
Oct
-07
Feb-
08Ju
n-08
Oct
-08
Feb-
09Ju
n-09
Oct
-09
Feb-
10Ju
n-10
Oct
-10
Feb-
11Ju
n-11
Oct
-11
Feb-
12Ju
n-12
Oct
-12
Feb-
13Ju
n-13
Oct
-13
Feb-
14Ju
n-14
Oct
-14
Feb-
15Ju
n-15
Oct
-15
Feb-
16
Source: Reuters
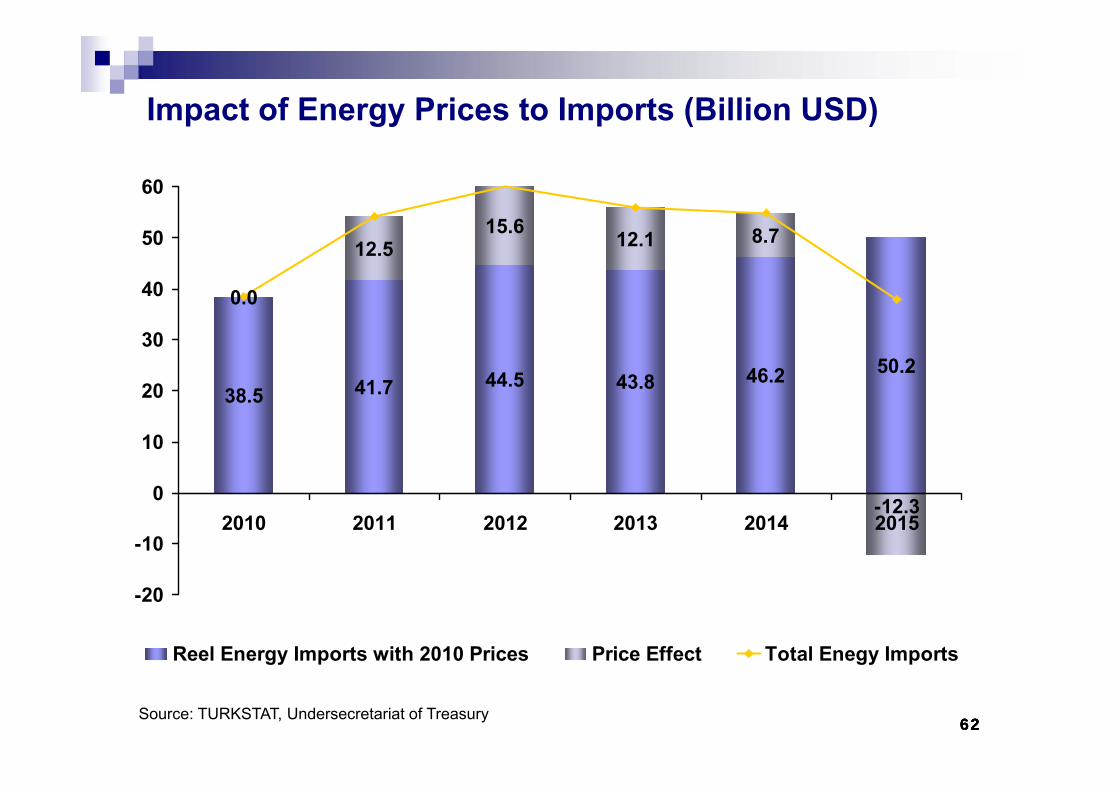
626262
Impact of Energy Prices to Imports (Billion USD)
38.5 41.7 44.5 43.8 46.2 50.2
0.0
12.515.6 12.1 8.7
-12.3
-20
-10
0
10
20
30
40
50
60
2010 2011 2012 2013 2014 2015
Reel Energy Imports with 2010 Prices Price Effect Total Enegy Imports
Source: TURKSTAT, Undersecretariat of Treasury
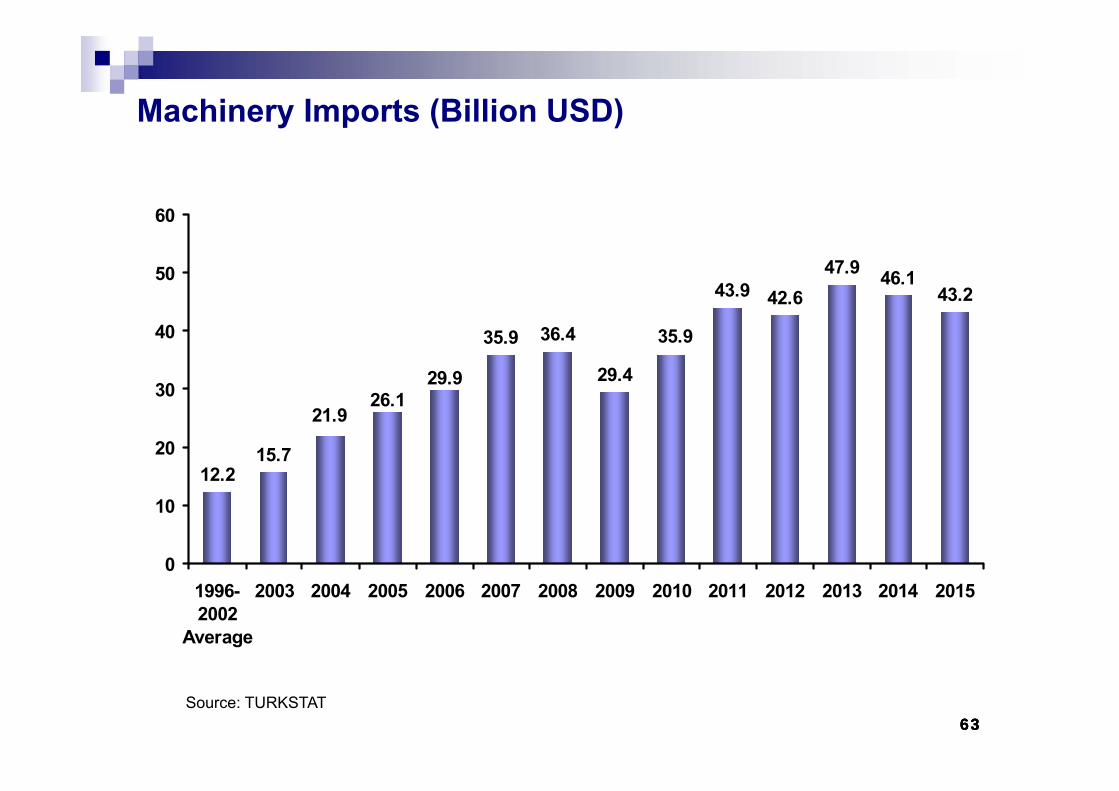
636363
Machinery Imports (Billion USD)
29.4
42.647.9 46.1
43.243.9
35.9
12.215.7
21.926.1
29.9
35.9 36.4
0
10
20
30
40
50
60
1996-2002
Average
2003 2004 2005 2006 2007 2008 2009 2010 2011 2012 2013 2014 2015
Source: TURKSTAT
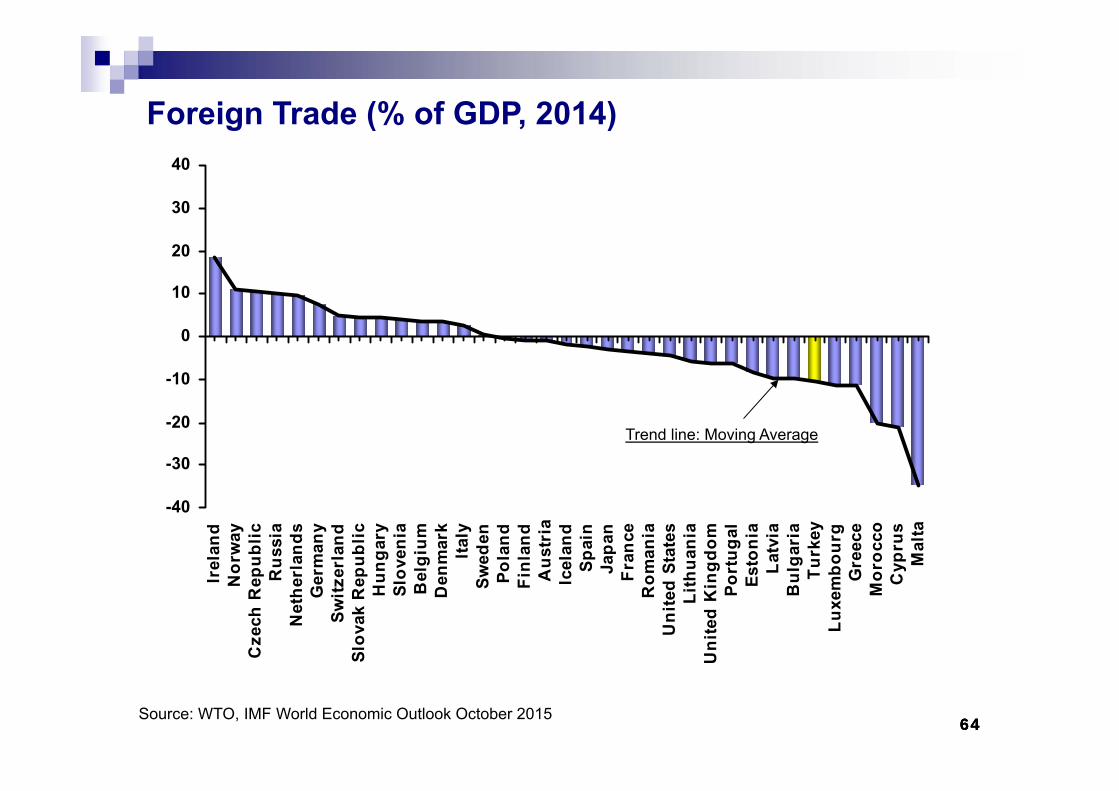
646464
Trend line: Moving Average
-40
-30
-20
-10
0
10
20
30
40
Irel
and
Nor
way
Cze
ch R
epub
licR
ussi
aN
ethe
rlan
dsG
erm
any
Switz
erla
ndSl
ovak
Rep
ublic
Hun
gary
Slov
enia
Bel
gium
Den
mar
kIta
lySw
eden
Pola
ndFi
nlan
dA
ustr
iaIc
elan
dSp
ain
Japa
nFr
ance
Rom
ania
Uni
ted
Stat
esLi
thua
nia
Uni
ted
Kin
gdom
Port
ugal
Esto
nia
Latv
iaB
ulga
ria
Turk
eyLu
xem
bour
gG
reec
eM
oroc
coC
ypru
sM
alta
Foreign Trade (% of GDP, 2014)
Source: WTO, IMF World Economic Outlook October 2015
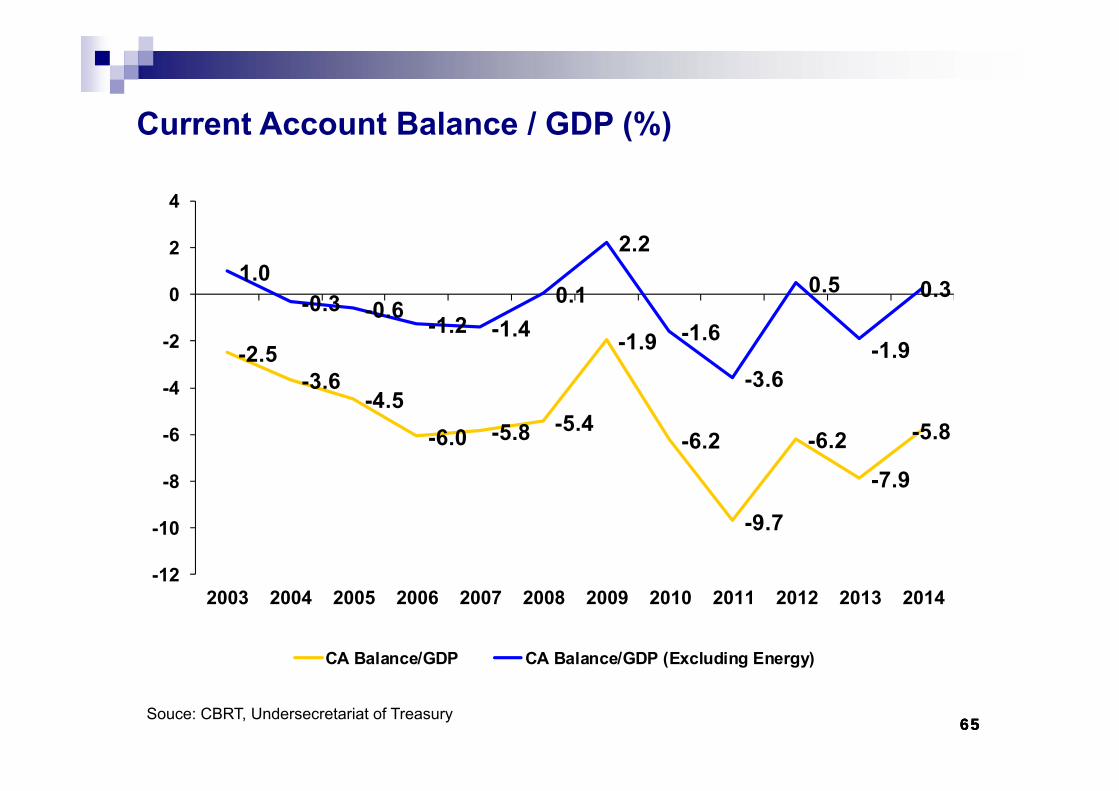
656565
-2.5-3.6
-4.5-6.0 -5.8 -5.4
-1.9
-6.2
-9.7
-6.2
-7.9
-5.8
1.0-0.3 -0.6 -1.2 -1.4
0.1
2.2
-1.6
-3.6
0.5
-1.9
0.3
-12
-10
-8
-6
-4
-2
0
2
4
2003 2004 2005 2006 2007 2008 2009 2010 2011 2012 2013 2014
CA Balance/GDP CA Balance/GDP (Excluding Energy)
Current Account Balance / GDP (%)
Souce: CBRT, Undersecretariat of Treasury
666666
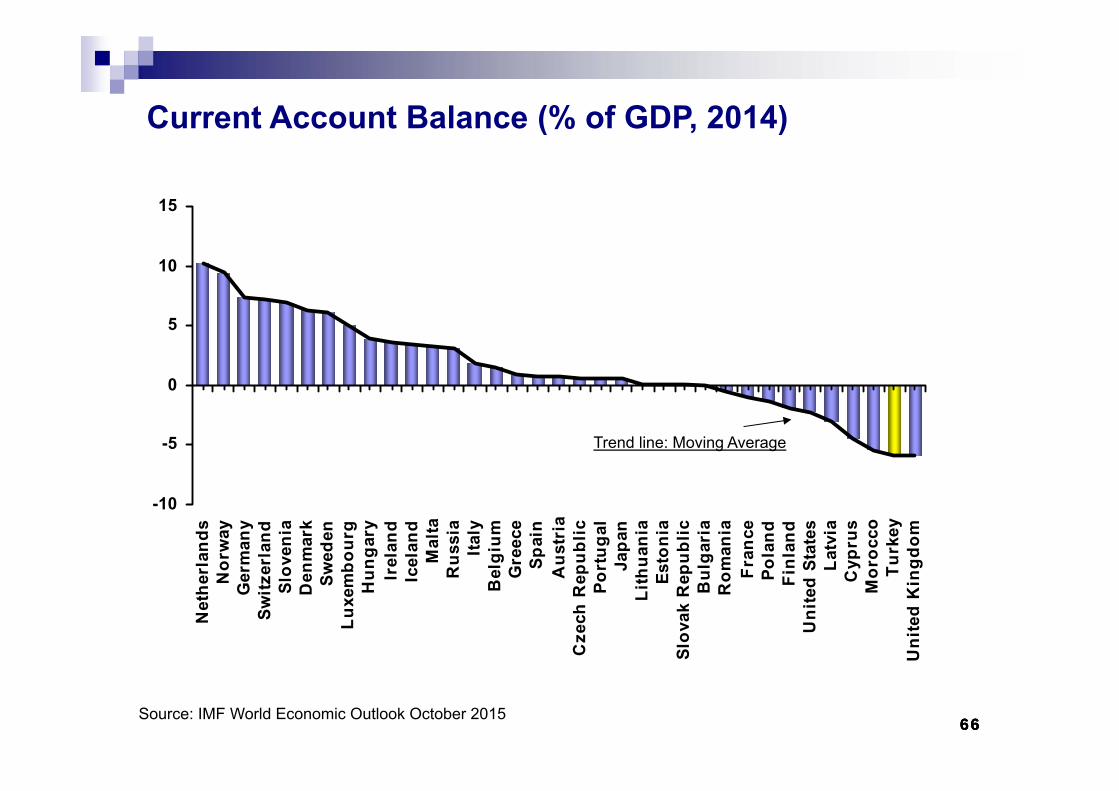
Trend line: Moving Average
-10
-5
0
5
10
15N
ethe
rlan
dsN
orw
ayG
erm
any
Switz
erla
ndSl
oven
iaD
enm
ark
Swed
enLu
xem
bour
gH
unga
ryIr
elan
dIc
elan
dM
alta
Rus
sia
Italy
Bel
gium
Gre
ece
Spai
nA
ustr
iaC
zech
Rep
ublic
Port
ugal
Japa
nLi
thua
nia
Esto
nia
Slov
ak R
epub
licB
ulga
ria
Rom
ania
Fran
cePo
land
Finl
and
Uni
ted
Stat
esLa
tvia
Cyp
rus
Mor
occo
Turk
eyU
nite
d K
ingd
om
Source: IMF World Economic Outlook October 2015
Current Account Balance (% of GDP, 2014)
676767
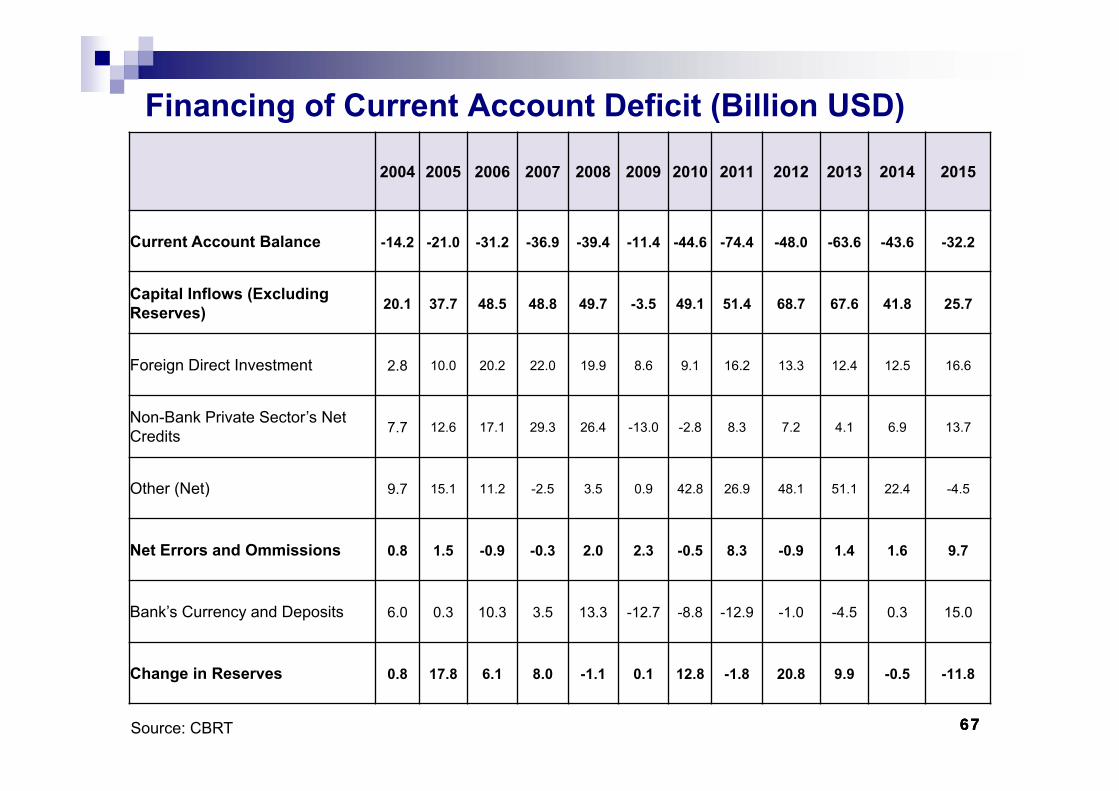
Financing of Current Account Deficit (Billion USD)
Source: CBRT
2004 2005 2006 2007 2008 2009 2010 2011 2012 2013 2014 2015
Current Account Balance -14.2 -21.0 -31.2 -36.9 -39.4 -11.4 -44.6 -74.4 -48.0 -63.6 -43.6 -32.2
Capital Inflows (Excluding Reserves) 20.1 37.7 48.5 48.8 49.7 -3.5 49.1 51.4 68.7 67.6 41.8 25.7
Foreign Direct Investment 2.8 10.0 20.2 22.0 19.9 8.6 9.1 16.2 13.3 12.4 12.5 16.6
Non-Bank Private Sector’s Net Credits 7.7 12.6 17.1 29.3 26.4 -13.0 -2.8 8.3 7.2 4.1 6.9 13.7
Other (Net) 9.7 15.1 11.2 -2.5 3.5 0.9 42.8 26.9 48.1 51.1 22.4 -4.5
Net Errors and Ommissions 0.8 1.5 -0.9 -0.3 2.0 2.3 -0.5 8.3 -0.9 1.4 1.6 9.7
Bank’s Currency and Deposits 6.0 0.3 10.3 3.5 13.3 -12.7 -8.8 -12.9 -1.0 -4.5 0.3 15.0
Change in Reserves 0.8 17.8 6.1 8.0 -1.1 0.1 12.8 -1.8 20.8 9.9 -0.5 -11.8
686868
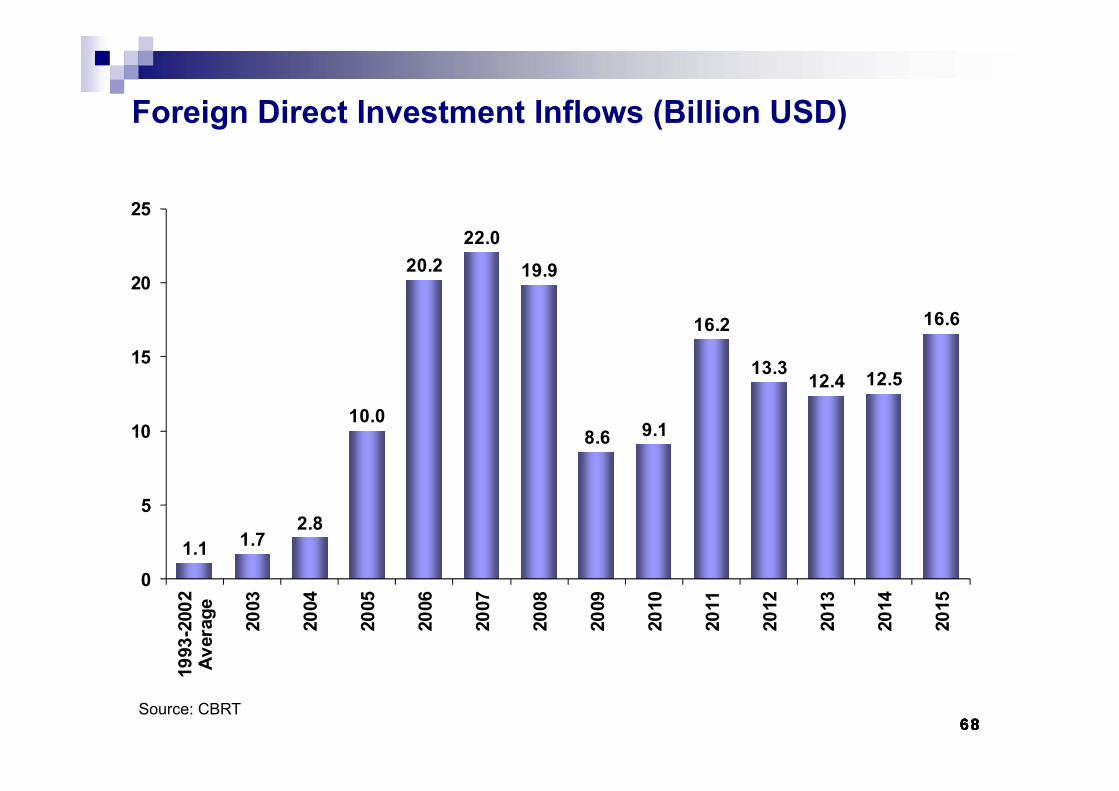
1.1 1.72.8
10.0
20.222.0
19.9
8.6 9.1
16.2
13.312.4 12.5
16.6
0
5
10
15
20
2519
93-2
002
Aver
age
2003
2004
2005
2006
2007
2008
2009
2010
2011
2012
2013
2014
2015
Foreign Direct Investment Inflows (Billion USD)
Source: CBRT68
696969
-20 -10 0 10 20 30 40 50 60 70 80
2005
2006
2007
2008
2009
2010
2011
2012
2013
2014
2015
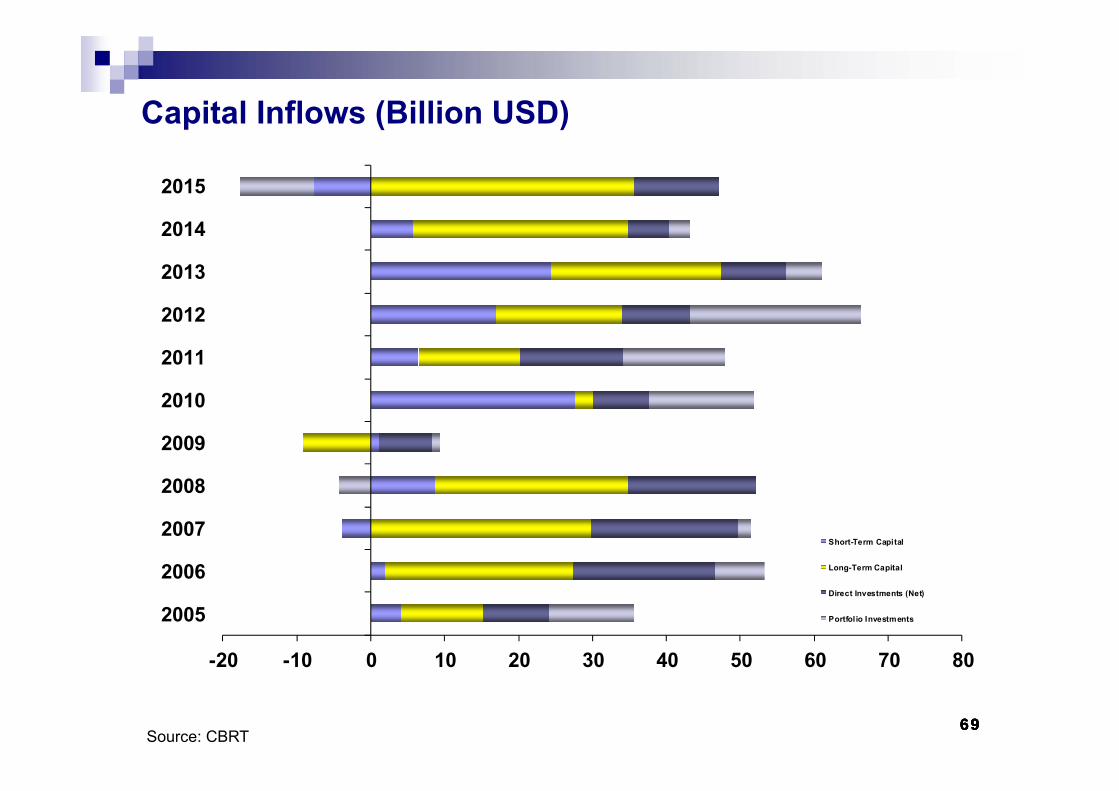
Short-Term Capital
Long-Term Capital
Direct Investments (Net)
Portfolio Investments
Capital Inflows (Billion USD)
69Source: CBRT
707070
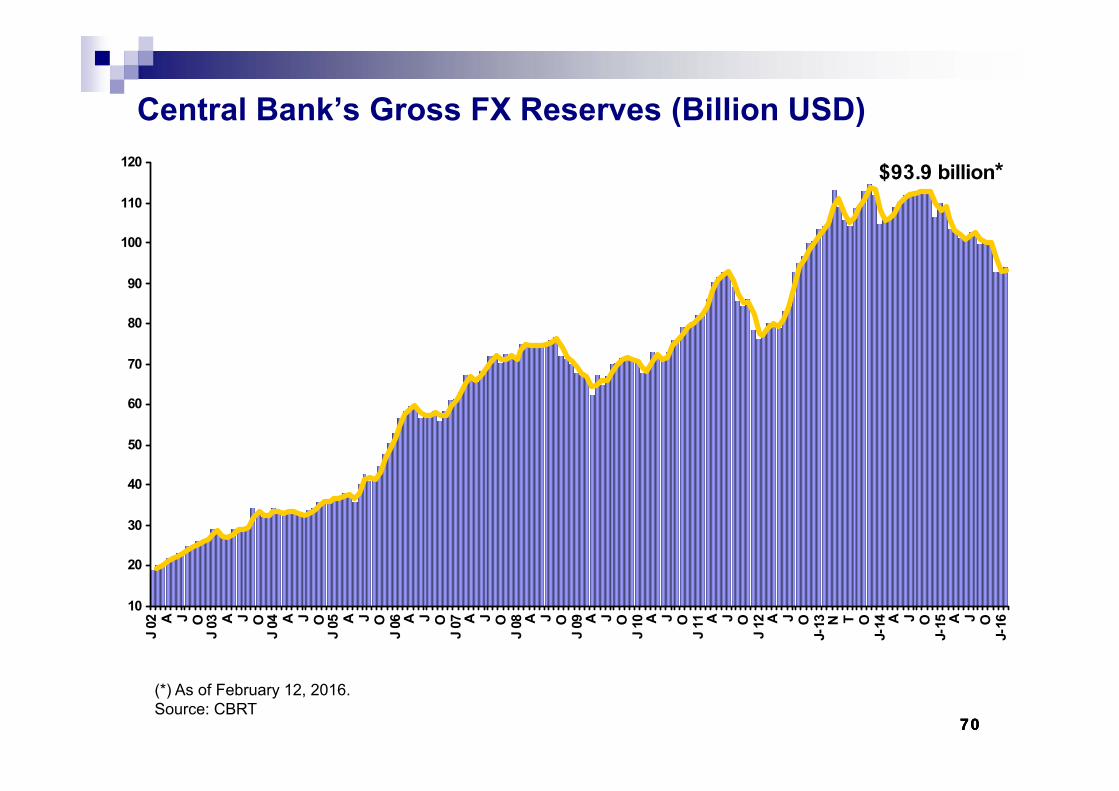
Central Bank’s Gross FX Reserves (Billion USD)
(*) As of February 12, 2016.Source: CBRT
10
20
30
40
50
60
70
80
90
100
110
120J
02 A J OJ
03 A J OJ
04 A J OJ
05 A J OJ
06 A J OJ
07 A J OJ
08 A J OJ
09 A J OJ
10 A J OJ
11 A J OJ
12 A J OJ-
13 N T OJ-
14 A J OJ-
15 A J OJ-
16
$93.9 billion*
717171
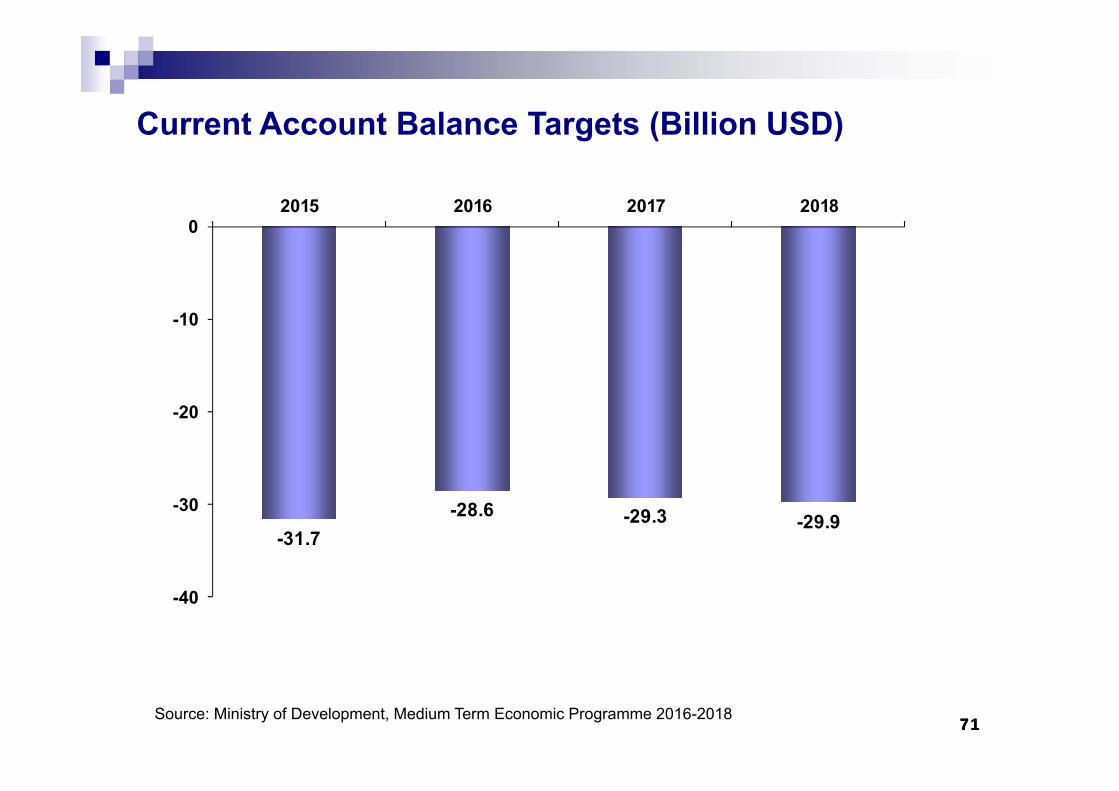
-31.7-28.6 -29.3 -29.9
-40
-30
-20
-10
02015 2016 2017 2018
Source: Ministry of Development, Medium Term Economic Programme 2016-2018
Current Account Balance Targets (Billion USD)
727272
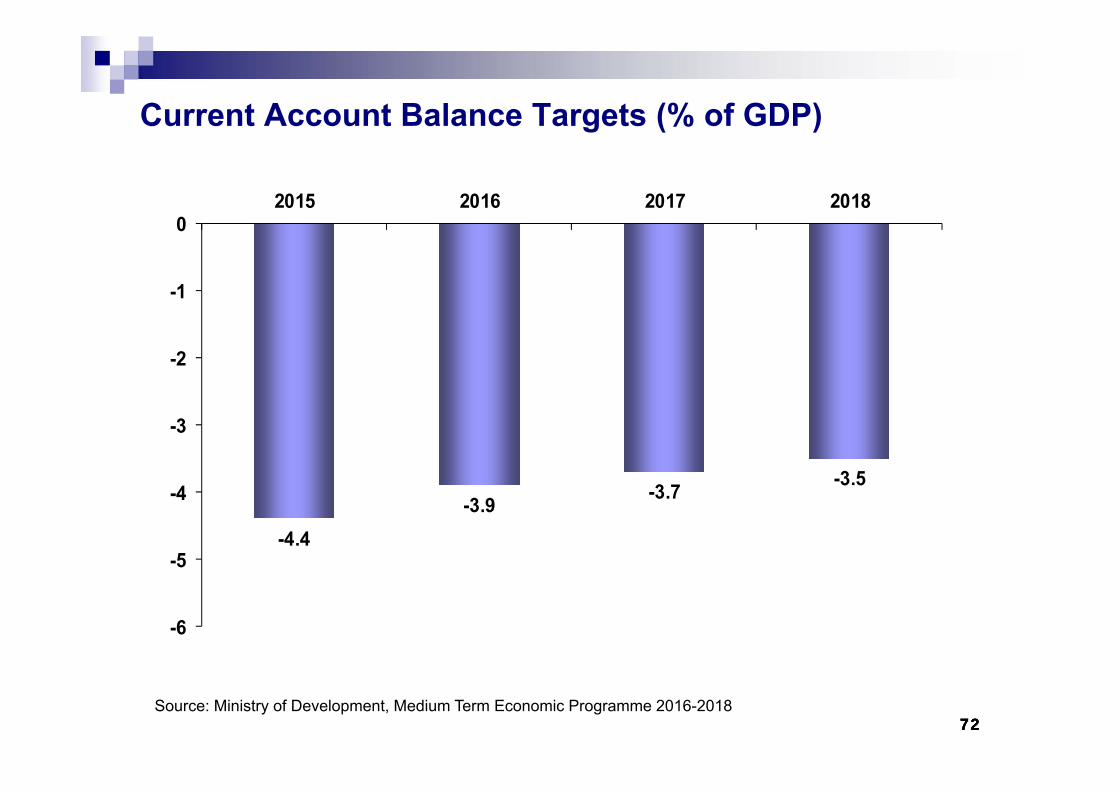
Current Account Balance Targets (% of GDP)
-4.4-3.9 -3.7 -3.5
-6
-5
-4
-3
-2
-1
02015 2016 2017 2018
Source: Ministry of Development, Medium Term Economic Programme 2016-2018

737373
PUBLIC FINANCE
747474
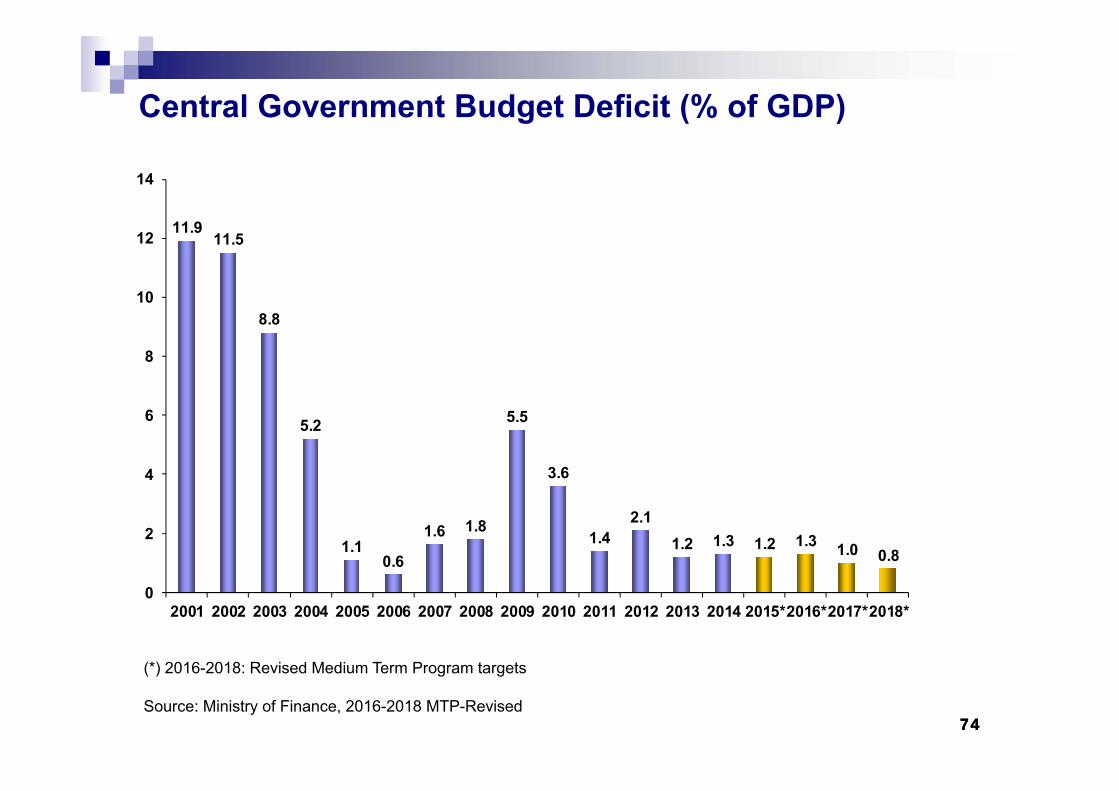
Central Government Budget Deficit (% of GDP)
(*) 2016-2018: Revised Medium Term Program targets
Source: Ministry of Finance, 2016-2018 MTP-Revised
11.911.5
8.8
5.2
1.10.6
1.6 1.8
5.5
3.6
1.42.1
1.2 1.3 1.2 1.3 1.0 0.8
0
2
4
6
8
10
12
14
2001 2002 2003 2004 2005 2006 2007 2008 2009 2010 2011 2012 2013 2014 2015*2016*2017*2018*
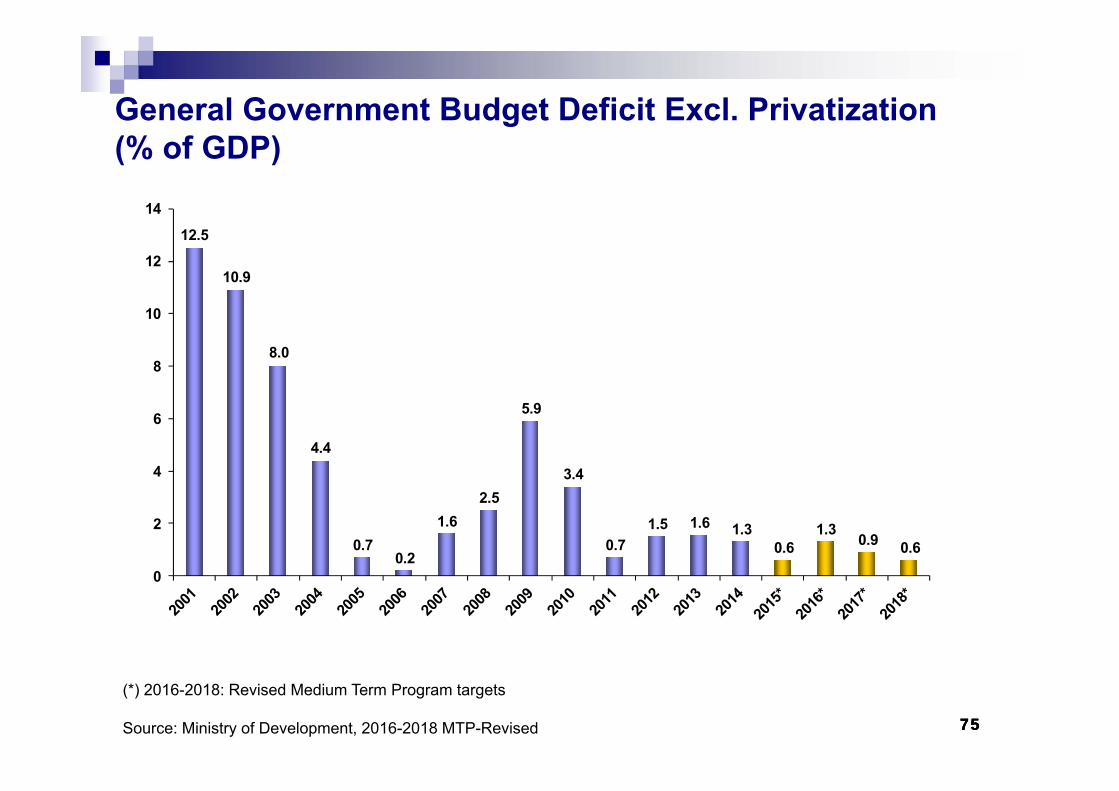
757575
General Government Budget Deficit Excl. Privatization(% of GDP)
(*) 2016-2018: Revised Medium Term Program targets
Source: Ministry of Development, 2016-2018 MTP-Revised
12.5
10.9
8.0
4.4
0.70.2
1.62.5
5.9
3.4
0.71.5 1.6 1.3
0.61.3
0.9 0.6
0
2
4
6
8
10
12
14
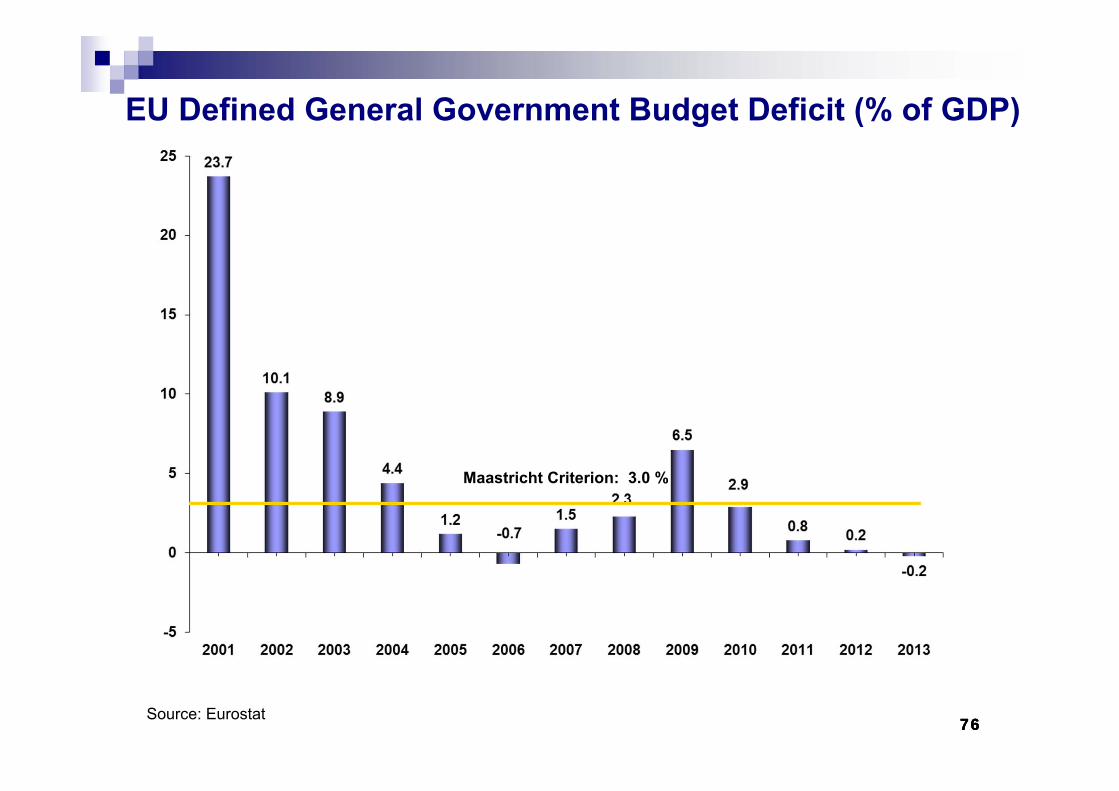
767676
Maastricht Criterion: 3.0 %
EU Defined General Government Budget Deficit (% of GDP)
Source: Eurostat
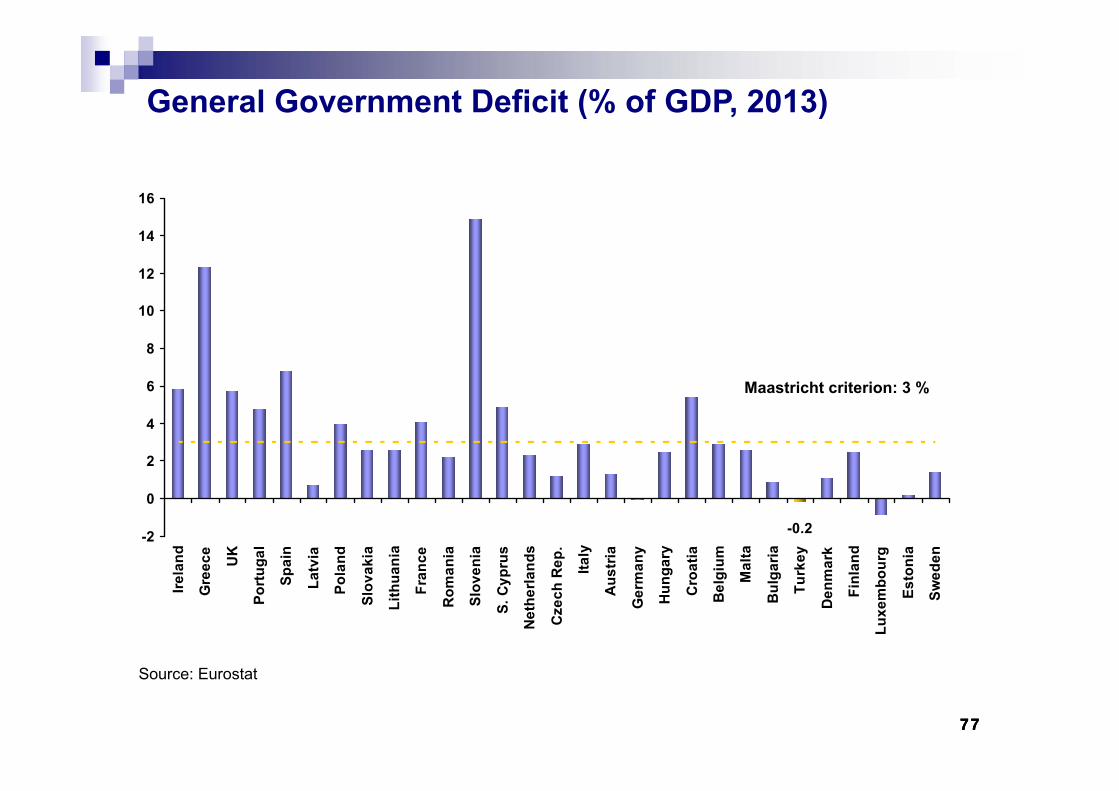
777777
General Government Deficit (% of GDP, 2013)
Source: Eurostat
-0.2-2
0
2
4
6
8
10
12
14
16Ire
land
Gre
ece
UK
Port
ugal
Spai
n
Latv
ia
Pola
nd
Slov
akia
Lith
uani
a
Fran
ce
Rom
ania
Slov
enia
S. C
ypru
s
Net
herla
nds
Cze
ch R
ep.
Italy
Aus
tria
Ger
man
y
Hun
gary
Cro
atia
Bel
gium
Mal
ta
Bul
garia
Turk
ey
Den
mar
k
Finl
and
Luxe
mbo
urg
Esto
nia
Swed
en
Maastricht criterion: 3 %
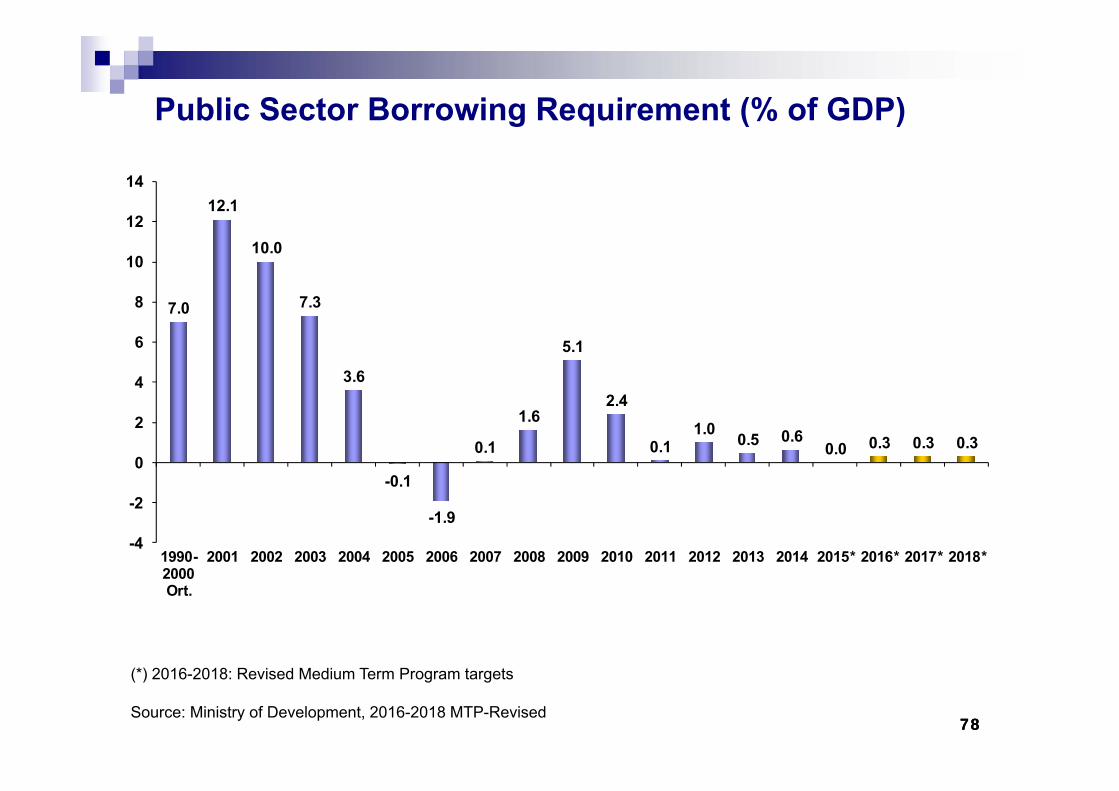
7878
Public Sector Borrowing Requirement (% of GDP)
(*) 2016-2018: Revised Medium Term Program targets
Source: Ministry of Development, 2016-2018 MTP-Revised
7.0
12.1
10.0
7.3
3.6
-0.1
-1.9
0.1
1.6
5.1
2.4
0.11.0 0.5 0.6
0.0 0.3 0.3 0.3
-4
-2
0
2
4
6
8
10
12
14
1990-2000Ort.
2001 2002 2003 2004 2005 2006 2007 2008 2009 2010 2011 2012 2013 2014 2015* 2016* 2017* 2018*
797979
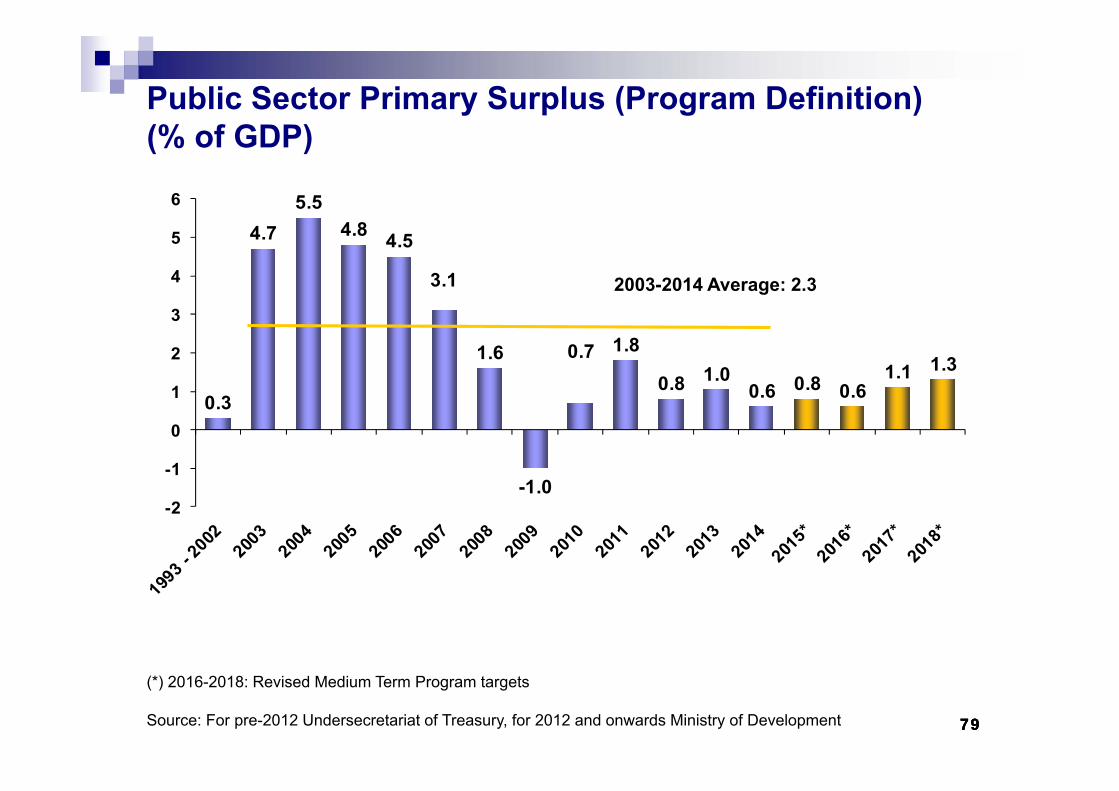
2003-2014 Average: 2.3
Public Sector Primary Surplus (Program Definition)(% of GDP)
(*) 2016-2018: Revised Medium Term Program targets
Source: For pre-2012 Undersecretariat of Treasury, for 2012 and onwards Ministry of Development
0.3
4.75.5
4.8 4.5
3.1
1.6
-1.0
0.7 1.8
0.8 1.00.6 0.8 0.6
1.1 1.3
-2
-1
0
1
2
3
4
5
6
808080
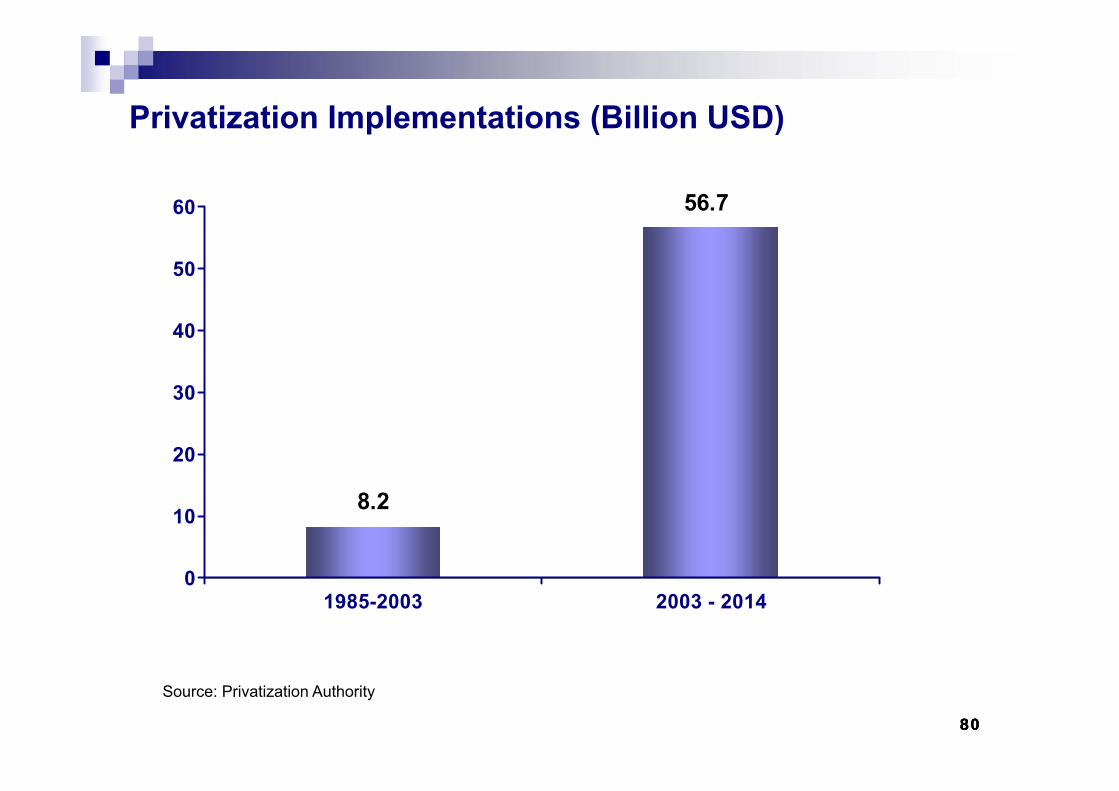
Privatization Implementations (Billion USD)
8.2
56.7
0
10
20
30
40
50
60
1985-2003 2003 - 2014
Source: Privatization Authority
818181
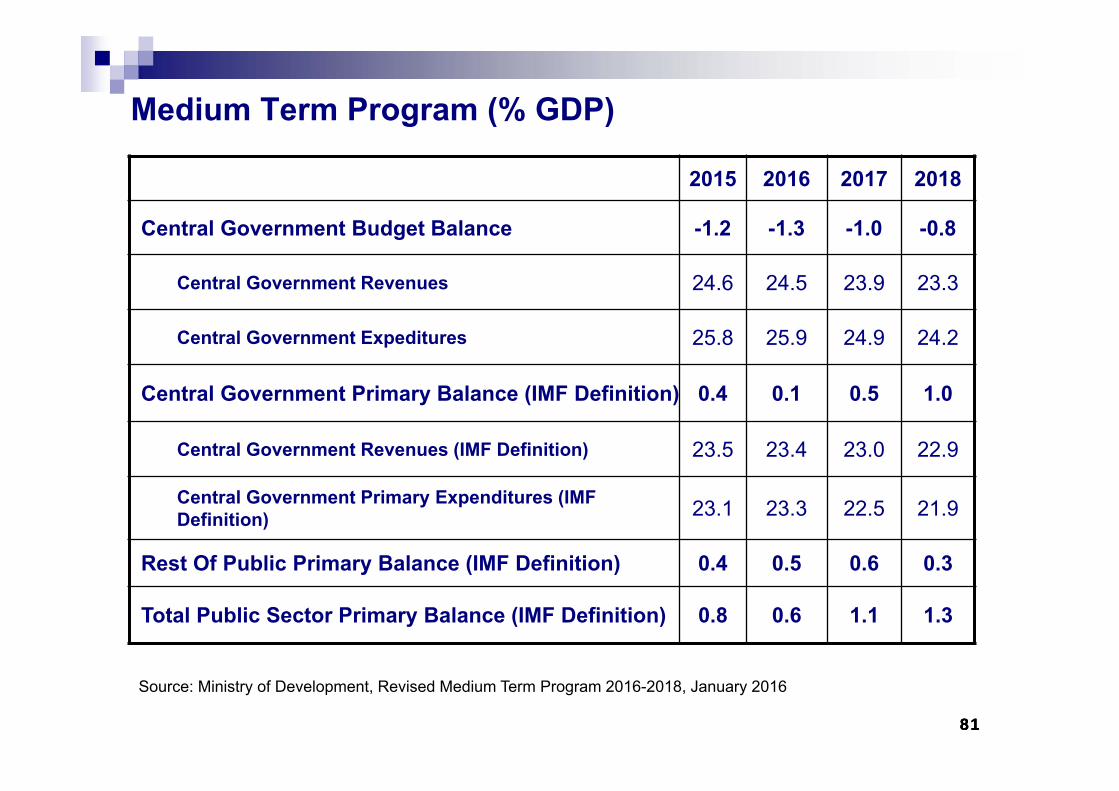
Medium Term Program (% GDP)
Source: Ministry of Development, Revised Medium Term Program 2016-2018, January 2016
2015 2016 2017 2018
Central Government Budget Balance -1.2 -1.3 -1.0 -0.8
Central Government Revenues 24.6 24.5 23.9 23.3
Central Government Expeditures 25.8 25.9 24.9 24.2
Central Government Primary Balance (IMF Definition) 0.4 0.1 0.5 1.0
Central Government Revenues (IMF Definition) 23.5 23.4 23.0 22.9
Central Government Primary Expenditures (IMF Definition) 23.1 23.3 22.5 21.9
Rest Of Public Primary Balance (IMF Definition) 0.4 0.5 0.6 0.3
Total Public Sector Primary Balance (IMF Definition) 0.8 0.6 1.1 1.3

828282
DEBT MANAGEMENT
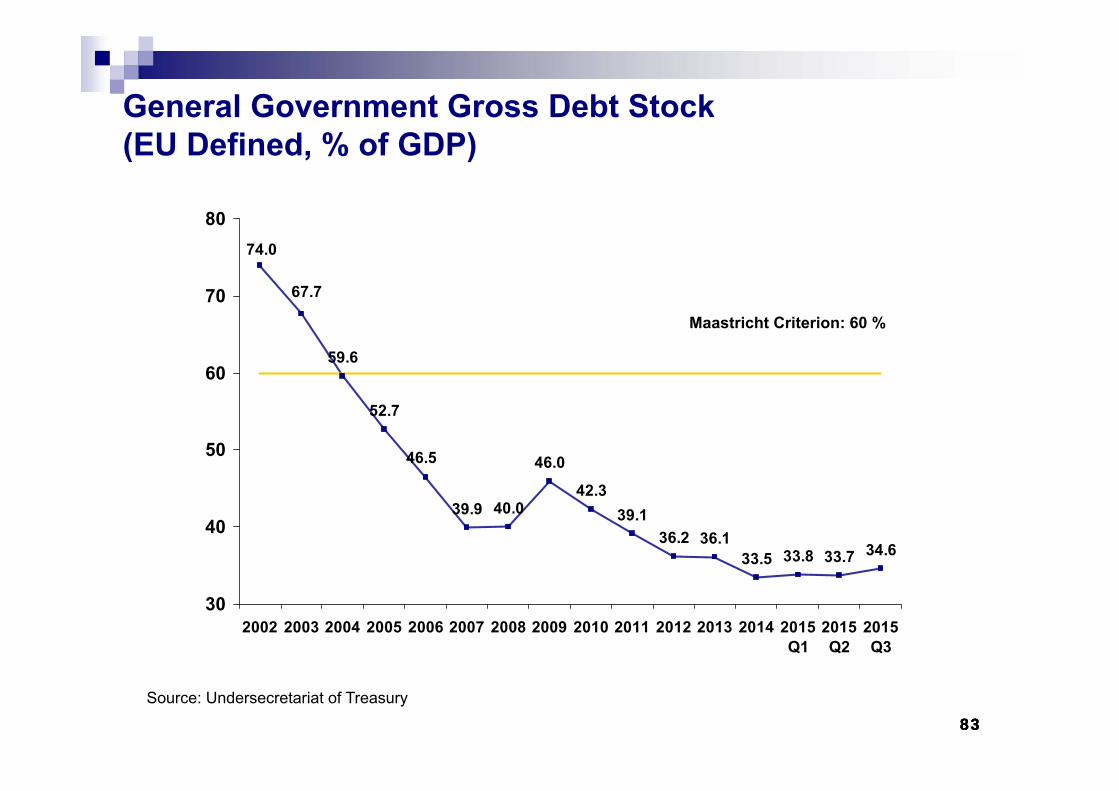
838383
59.6
52.7
40.0
46.0
42.339.1
36.2 36.133.5 33.8 33.7 34.6
67.7
74.0
39.9
46.5
30
40
50
60
70
80
2002 2003 2004 2005 2006 2007 2008 2009 2010 2011 2012 2013 2014 2015Q1
2015Q2
2015Q3
General Government Gross Debt Stock (EU Defined, % of GDP)
Source: Undersecretariat of Treasury
Maastricht Criterion: 60 %
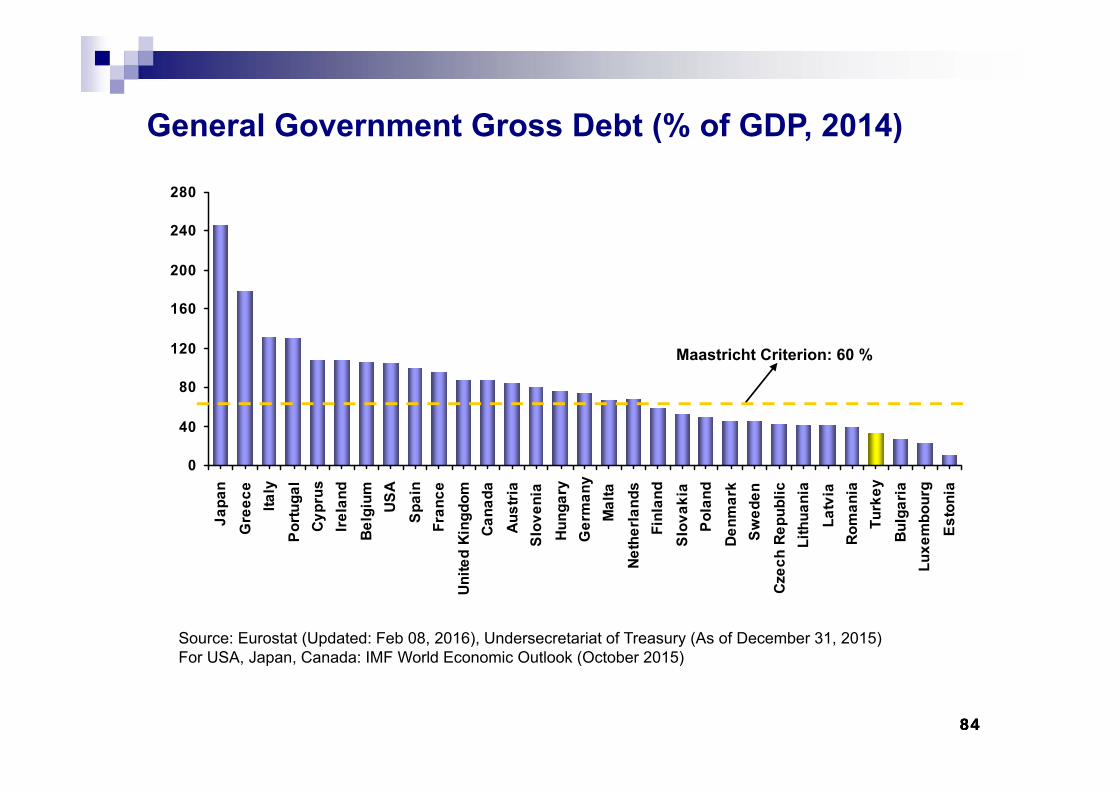
848484
0
40
80
120
160
200
240
280
Jap
an
Gre
ece
Ital
y P
ortu
gal
Cyp
rus
Irel
and
Bel
gium
U
SA
S
pain
F
ranc
e U
nite
d Ki
ngdo
m
Can
ada
Aus
tria
S
love
nia
Hun
gary
G
erm
any
Mal
ta
Net
herl
ands
F
inla
nd
Slo
vaki
a P
olan
d D
enm
ark
Sw
eden
C
zech
Rep
ublic
L
ithua
nia
Lat
via
Rom
ania
T
urke
y B
ulga
ria
Lux
embo
urg
Est
onia
General Government Gross Debt (% of GDP, 2014)
Maastricht Criterion: 60 %
Source: Eurostat (Updated: Feb 08, 2016), Undersecretariat of Treasury (As of December 31, 2015)For USA, Japan, Canada: IMF World Economic Outlook (October 2015)
858585
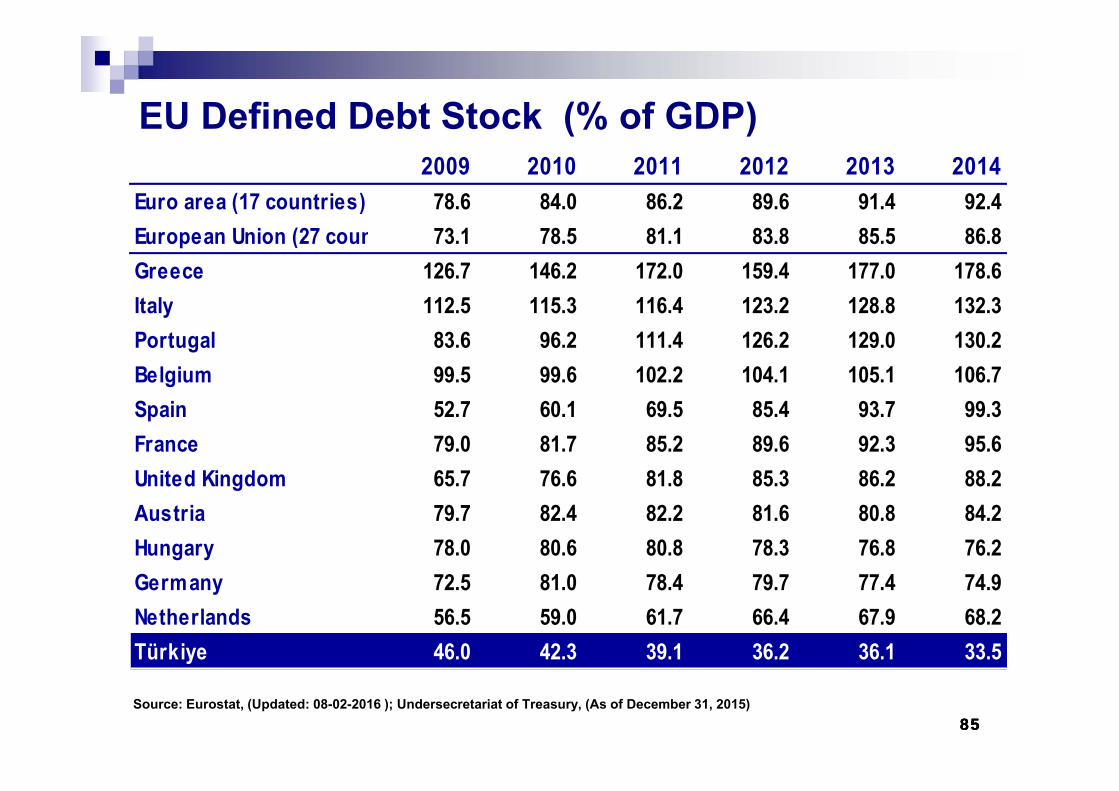
EU Defined Debt Stock (% of GDP)2009 2010 2011 2012 2013 2014
Euro area (17 countries) 78.6 84.0 86.2 89.6 91.4 92.4European Union (27 coun 73.1 78.5 81.1 83.8 85.5 86.8Greece 126.7 146.2 172.0 159.4 177.0 178.6Italy 112.5 115.3 116.4 123.2 128.8 132.3Portugal 83.6 96.2 111.4 126.2 129.0 130.2Belgium 99.5 99.6 102.2 104.1 105.1 106.7Spain 52.7 60.1 69.5 85.4 93.7 99.3France 79.0 81.7 85.2 89.6 92.3 95.6United Kingdom 65.7 76.6 81.8 85.3 86.2 88.2Austria 79.7 82.4 82.2 81.6 80.8 84.2Hungary 78.0 80.6 80.8 78.3 76.8 76.2Germany 72.5 81.0 78.4 79.7 77.4 74.9Netherlands 56.5 59.0 61.7 66.4 67.9 68.2Türkiye 46.0 42.3 39.1 36.2 36.1 33.5
Source: Eurostat, (Updated: 08-02-2016 ); Undersecretariat of Treasury, (As of December 31, 2015)
868686
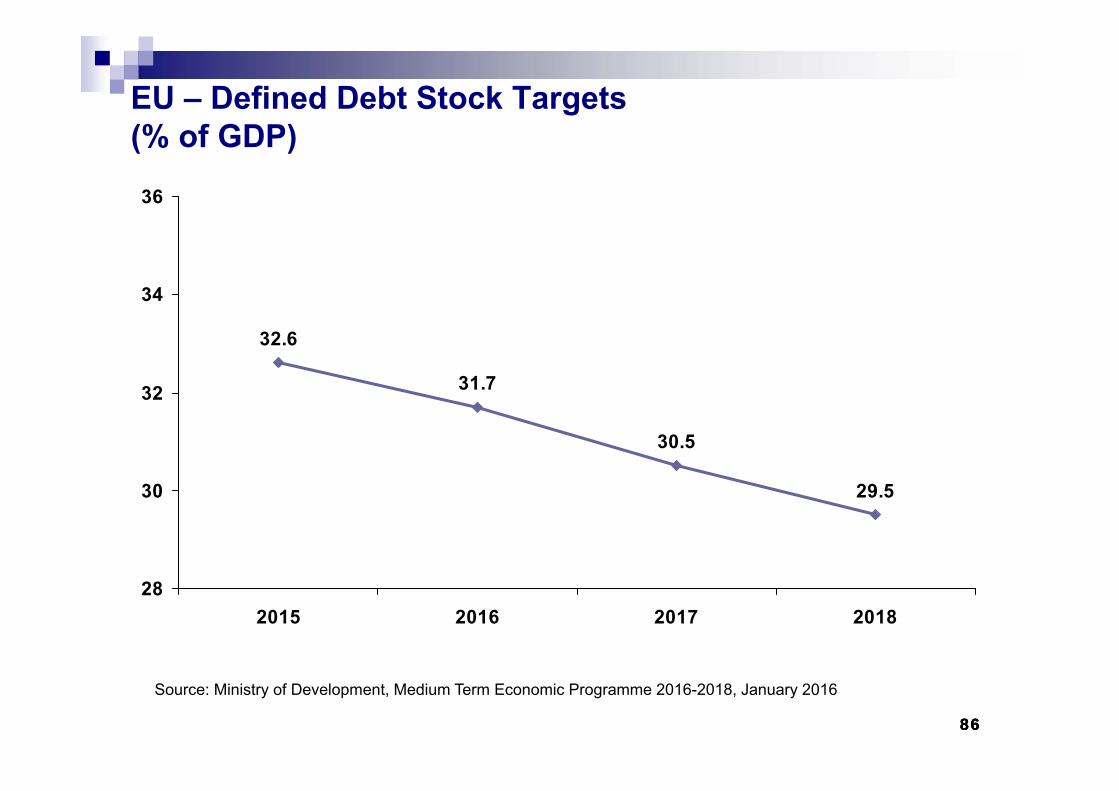
EU – Defined Debt Stock Targets (% of GDP)
32.6
31.7
30.5
29.5
28
30
32
34
36
2015 2016 2017 2018
Source: Ministry of Development, Medium Term Economic Programme 2016-2018, January 2016
878787
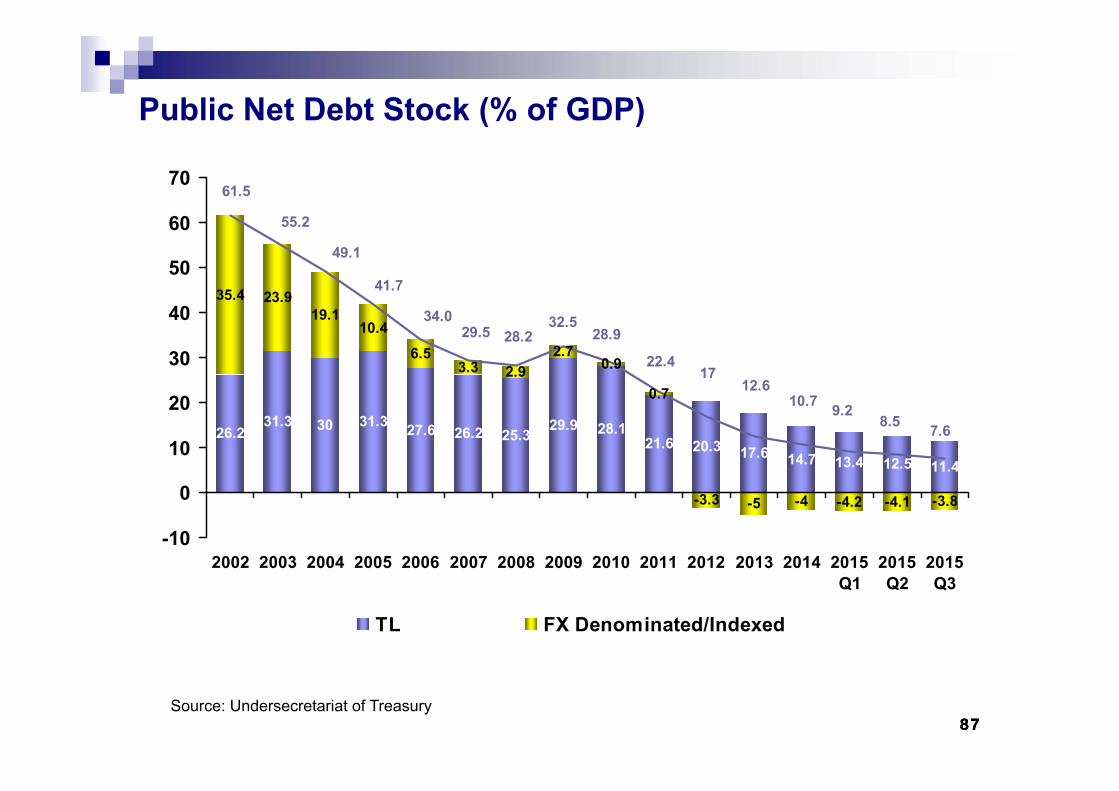
Public Net Debt Stock (% of GDP)
26.231.3 30 31.3 27.6 26.2 29.9 28.1
21.6 20.3 17.6 14.7 13.4 12.5 11.4
35.4 23.919.1
10.4
6.53.3 2.9
2.70.9
0.7
-3.3 -5 -4 -4.2 -4.1 -3.8
25.3 7.68.59.210.7
12.617
28.932.5
28.229.534.0
41.7
49.1
55.2
61.5
22.4
-10
0
10
20
30
40
50
60
70
2002 2003 2004 2005 2006 2007 2008 2009 2010 2011 2012 2013 2014 2015Q1
2015Q2
2015Q3
TL FX Denominated/Indexed
Source: Undersecretariat of Treasury
888888
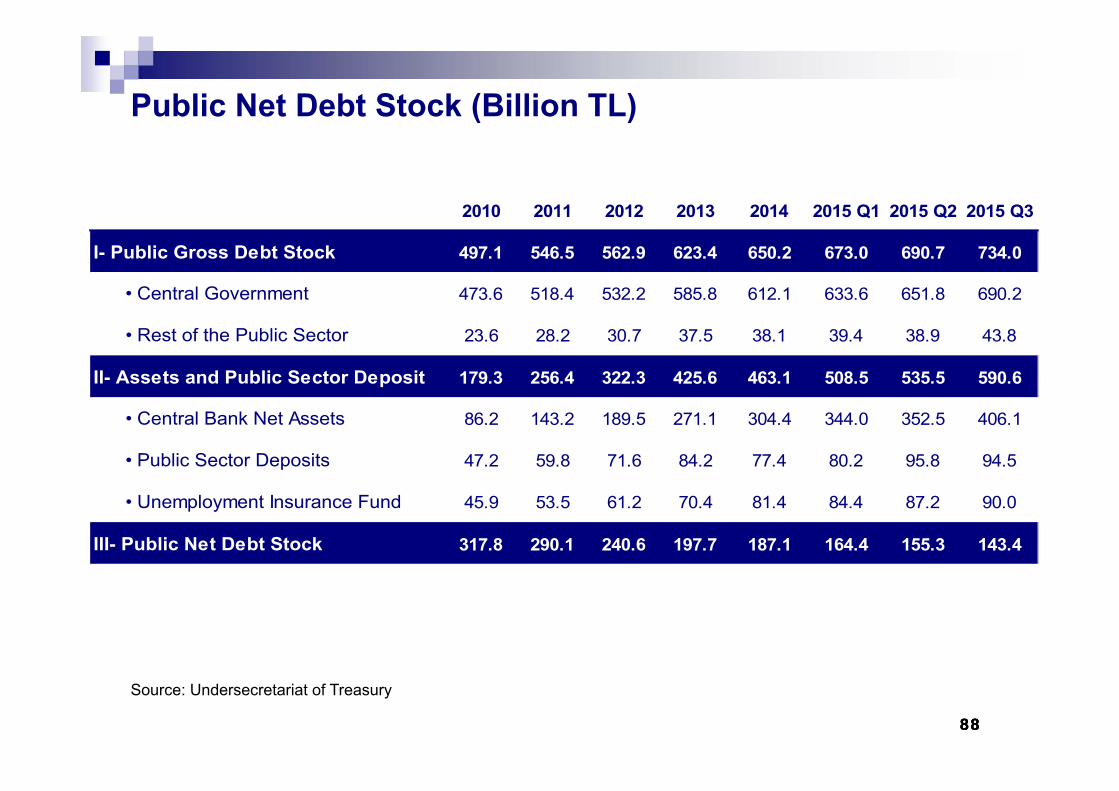
Public Net Debt Stock (Billion TL)
Source: Undersecretariat of Treasury
2010 2011 2012 2013 2014 2015 Q1 2015 Q2 2015 Q3
I- Public Gross Debt Stock 497.1 546.5 562.9 623.4 650.2 673.0 690.7 734.0
• Central Government 473.6 518.4 532.2 585.8 612.1 633.6 651.8 690.2
• Rest of the Public Sector 23.6 28.2 30.7 37.5 38.1 39.4 38.9 43.8
II- Assets and Public Sector Deposit 179.3 256.4 322.3 425.6 463.1 508.5 535.5 590.6
• Central Bank Net Assets 86.2 143.2 189.5 271.1 304.4 344.0 352.5 406.1
• Public Sector Deposits 47.2 59.8 71.6 84.2 77.4 80.2 95.8 94.5
• Unemployment Insurance Fund 45.9 53.5 61.2 70.4 81.4 84.4 87.2 90.0
III- Public Net Debt Stock 317.8 290.1 240.6 197.7 187.1 164.4 155.3 143.4
898989
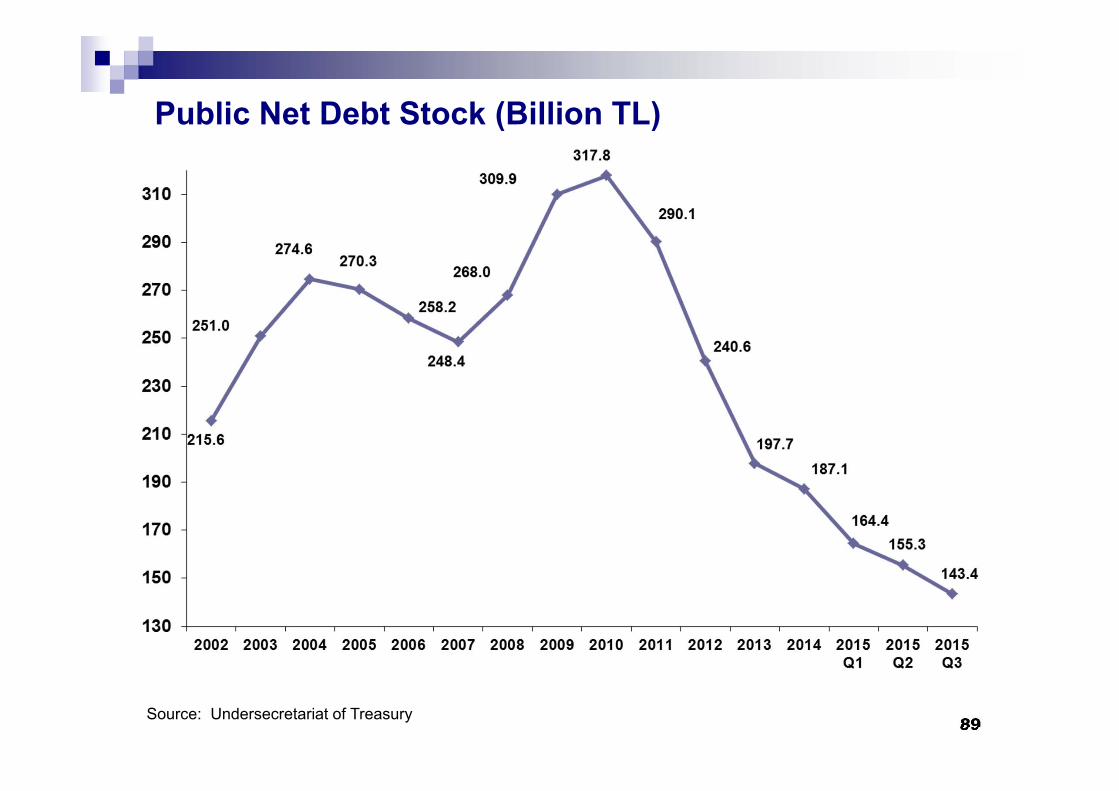
Public Net Debt Stock (Billion TL)
Source: Undersecretariat of Treasury
909090
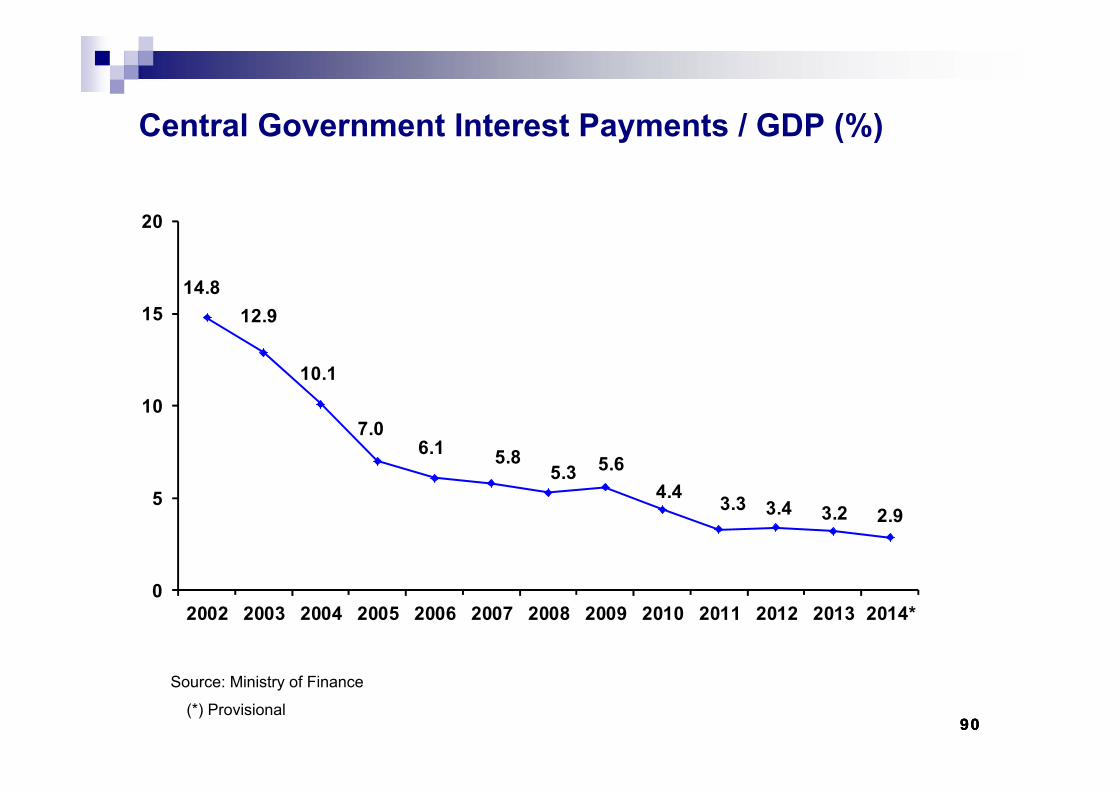
Central Government Interest Payments / GDP (%)
14.812.9
10.1
7.06.1 5.8
5.3 5.64.4 3.3 3.4 3.2 2.9
0
5
10
15
20
2002 2003 2004 2005 2006 2007 2008 2009 2010 2011 2012 2013 2014*
Source: Ministry of Finance
(*) Provisional
919191
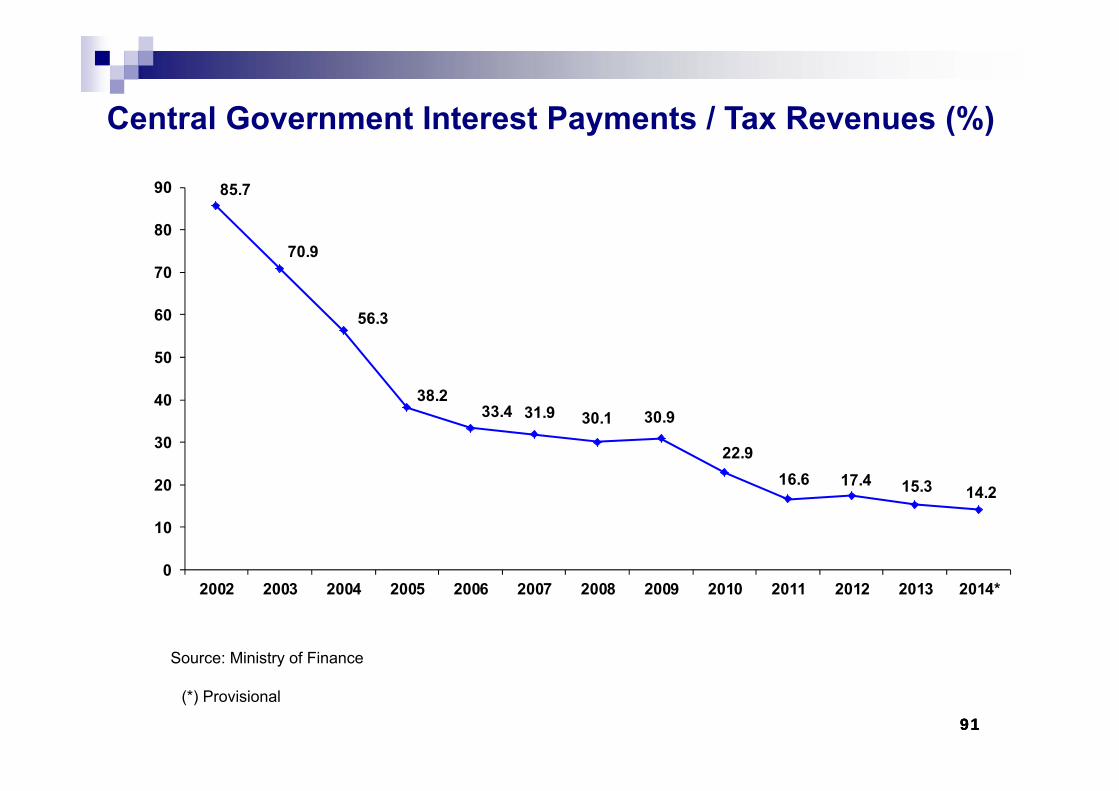
Central Government Interest Payments / Tax Revenues (%)
85.7
70.9
56.3
38.233.4 31.9 30.1 30.9
22.916.6 17.4 15.3 14.2
0
10
20
30
40
50
60
70
80
90
2002 2003 2004 2005 2006 2007 2008 2009 2010 2011 2012 2013 2014*
Source: Ministry of Finance
(*) Provisional
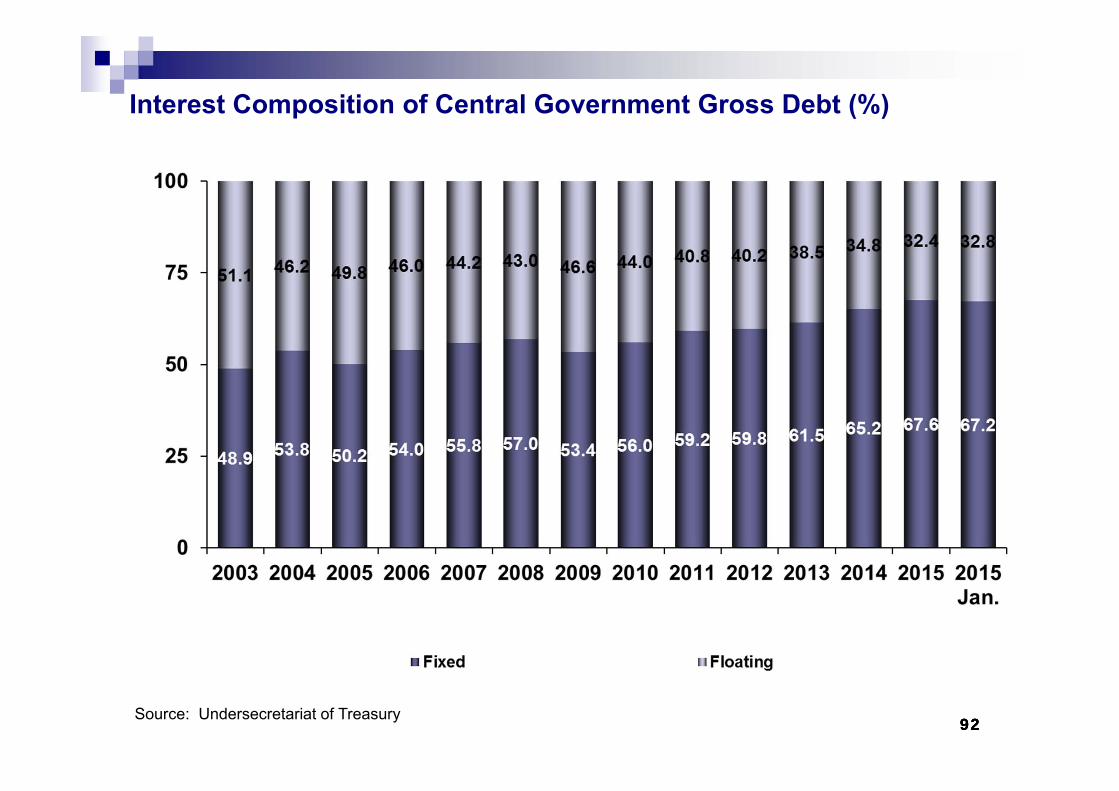
929292
Interest Composition of Central Government Gross Debt (%)
Source: Undersecretariat of Treasury
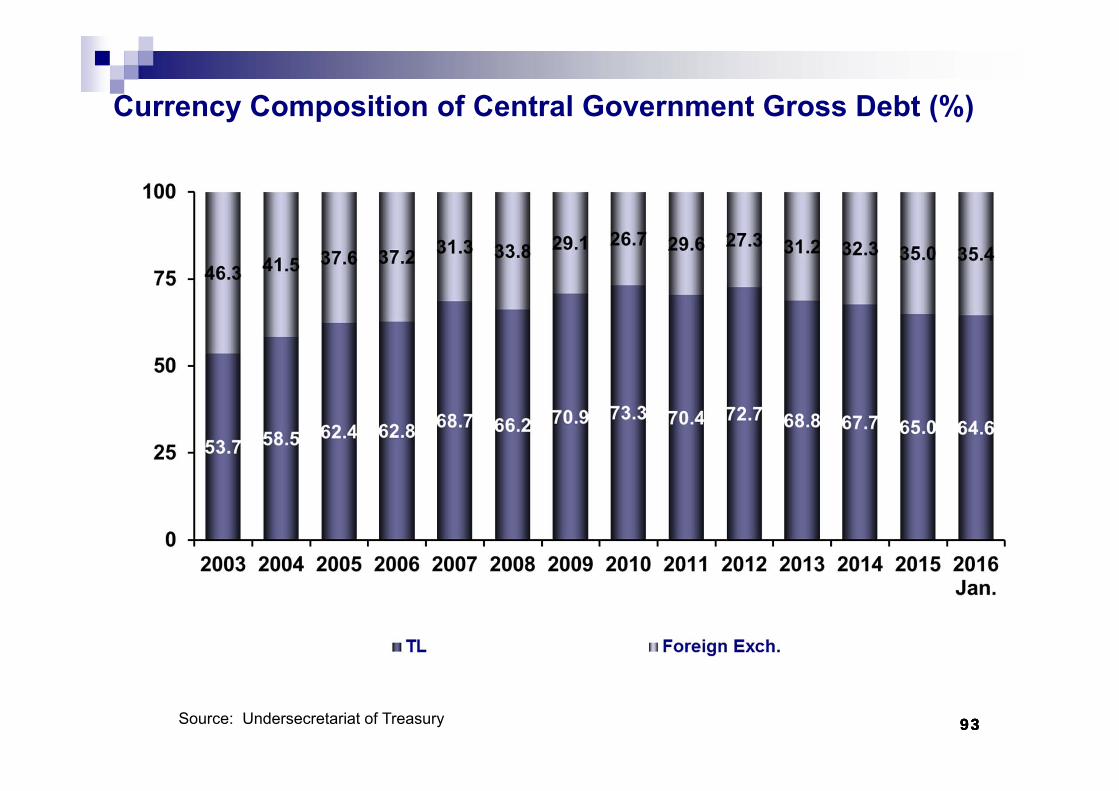
939393
Currency Composition of Central Government Gross Debt (%)
Source: Undersecretariat of Treasury
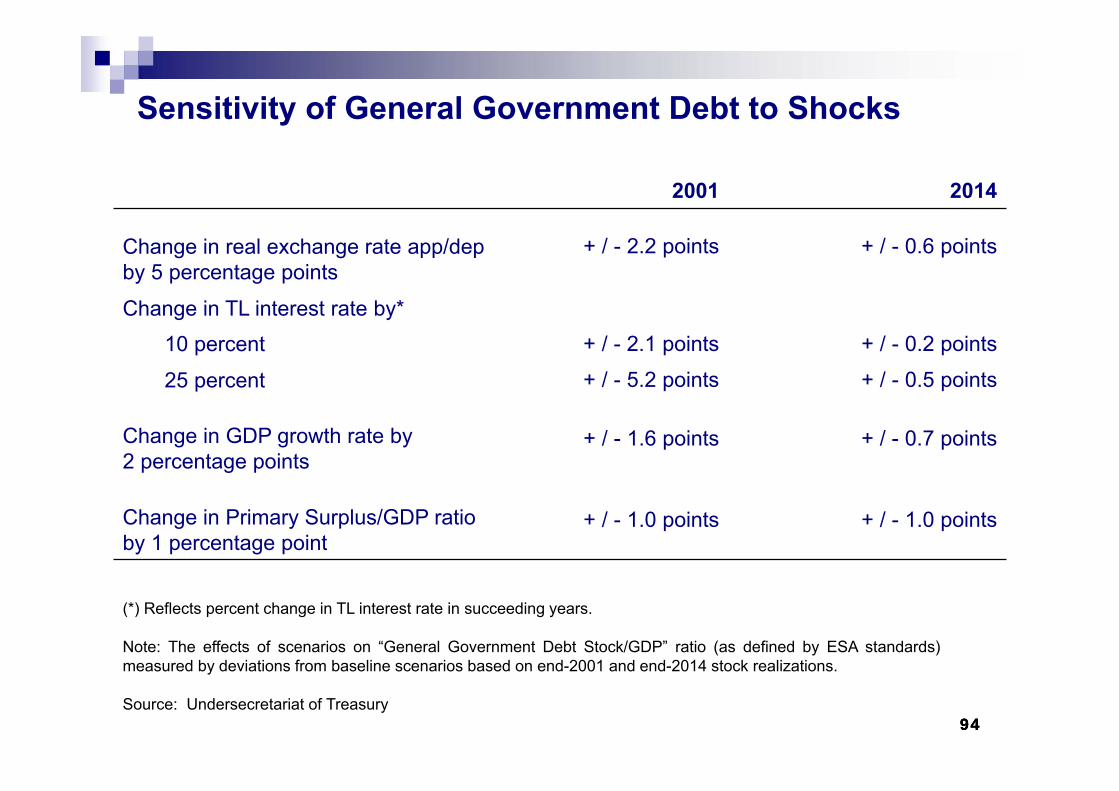
949494
Sensitivity of General Government Debt to Shocks
2001 2014
Change in real exchange rate app/depby 5 percentage points
+ / - 2.2 points + / - 0.6 points
Change in TL interest rate by*
10 percent + / - 2.1 points + / - 0.2 points
25 percent + / - 5.2 points + / - 0.5 points
Change in GDP growth rate by 2 percentage points
+ / - 1.6 points + / - 0.7 points
Change in Primary Surplus/GDP ratio by 1 percentage point
+ / - 1.0 points + / - 1.0 points
(*) Reflects percent change in TL interest rate in succeeding years.
Note: The effects of scenarios on “General Government Debt Stock/GDP” ratio (as defined by ESA standards)measured by deviations from baseline scenarios based on end-2001 and end-2014 stock realizations.
Source: Undersecretariat of Treasury
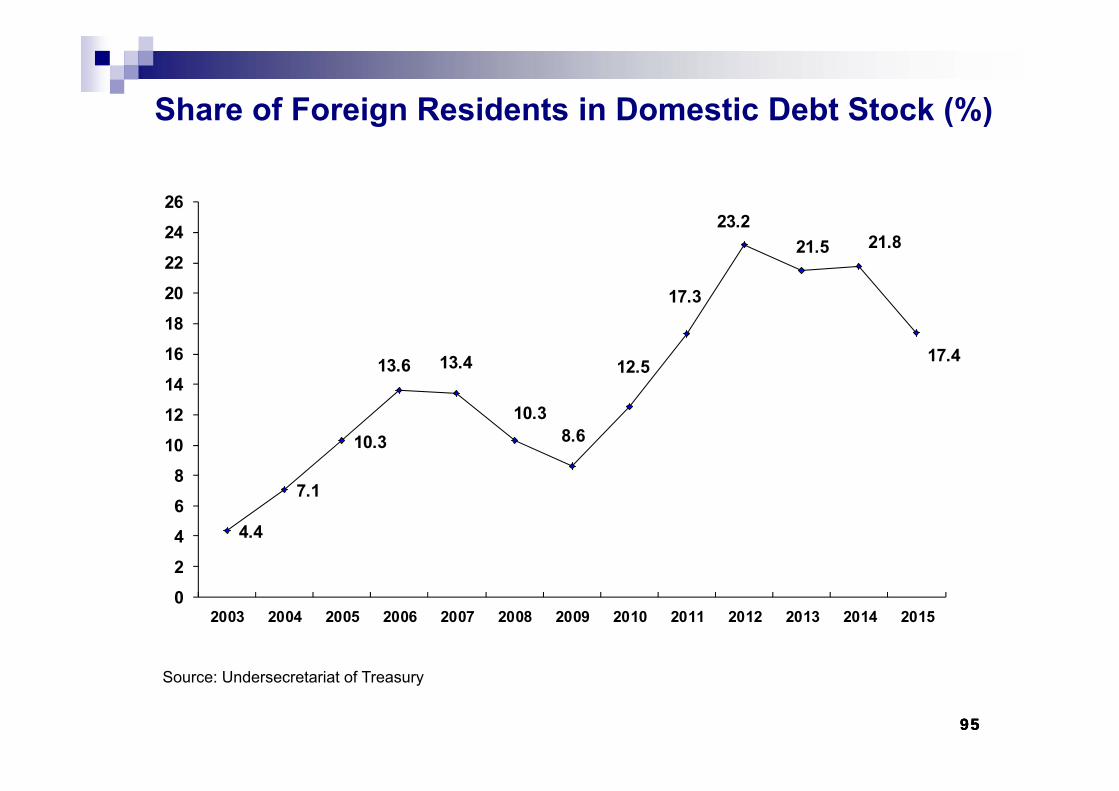
959595
Share of Foreign Residents in Domestic Debt Stock (%)
Source: Undersecretariat of Treasury
4.4
7.1
10.3
13.6 13.4
10.38.6
12.5
17.3
23.221.5 21.8
17.4
0
2
4
6
8
10
12
14
16
18
20
22
24
26
2003 2004 2005 2006 2007 2008 2009 2010 2011 2012 2013 2014 2015
969696
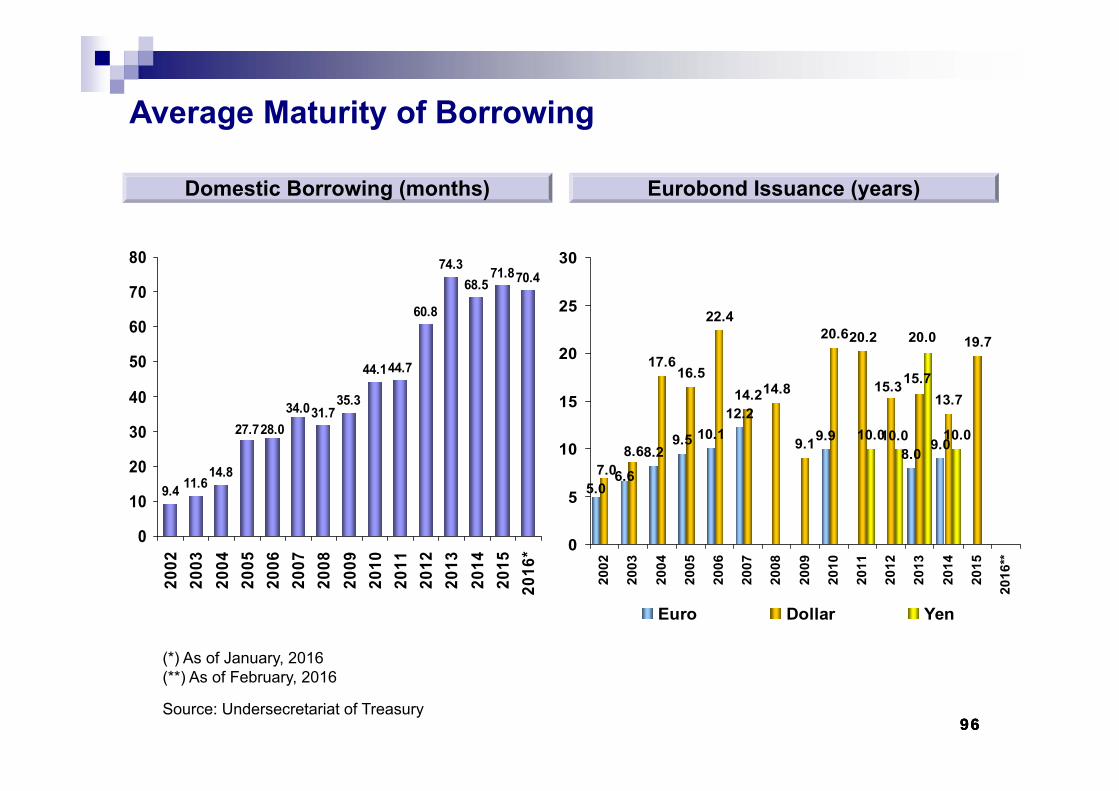
Average Maturity of Borrowing
Domestic Borrowing (months) Eurobond Issuance (years)
(*) As of January, 2016(**) As of February, 2016
Source: Undersecretariat of Treasury
9.4 11.614.8
31.735.3
44.144.7
60.8
74.368.5
71.870.4
34.028.027.7
0
10
20
30
40
50
60
70
80
2002
2003
2004
2005
2006
2007
2008
2009
2010
2011
2012
2013
2014
2015
2016
*
8.29.5 10.1
12.29.9
8.09.0
17.616.5
22.4
14.214.8
9.1
20.620.2
13.7
19.7
10.0 10.0
6.65.0
15.315.7
7.08.6
20.0
10.0
0
5
10
15
20
25
30
2002
2003
2004
2005
2006
2007
2008
2009
2010
2011
2012
2013
2014
2015
2016
**
Euro Dollar Yen
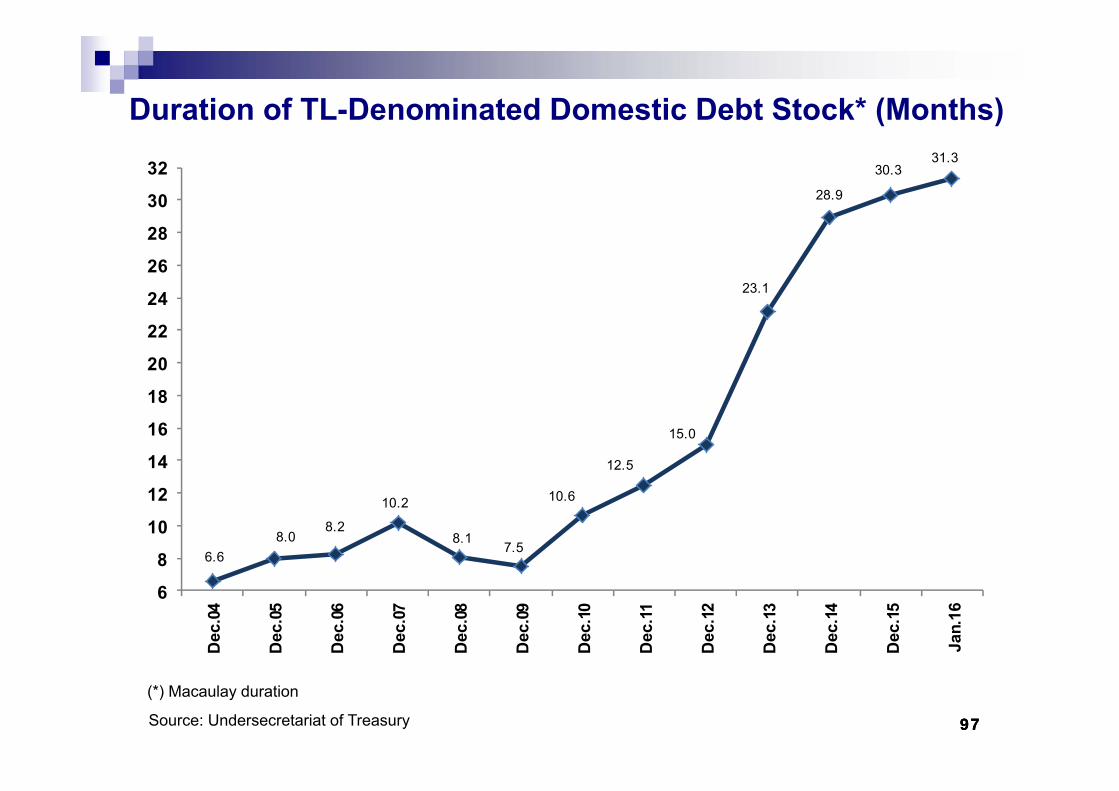
979797Source: Undersecretariat of Treasury
Duration of TL-Denominated Domestic Debt Stock* (Months)
6.68.0
8.2
10.2
8.17.5
10.6
12.5
15.0
23.1
28.9
30.331.3
6
8
10
12
14
16
18
20
22
24
26
28
30
32
Dec
.04
Dec
.05
Dec
.06
Dec
.07
Dec
.08
Dec
.09
Dec
.10
Dec
.11
Dec
.12
Dec
.13
Dec
.14
Dec
.15
Jan.
16
(*) Macaulay duration
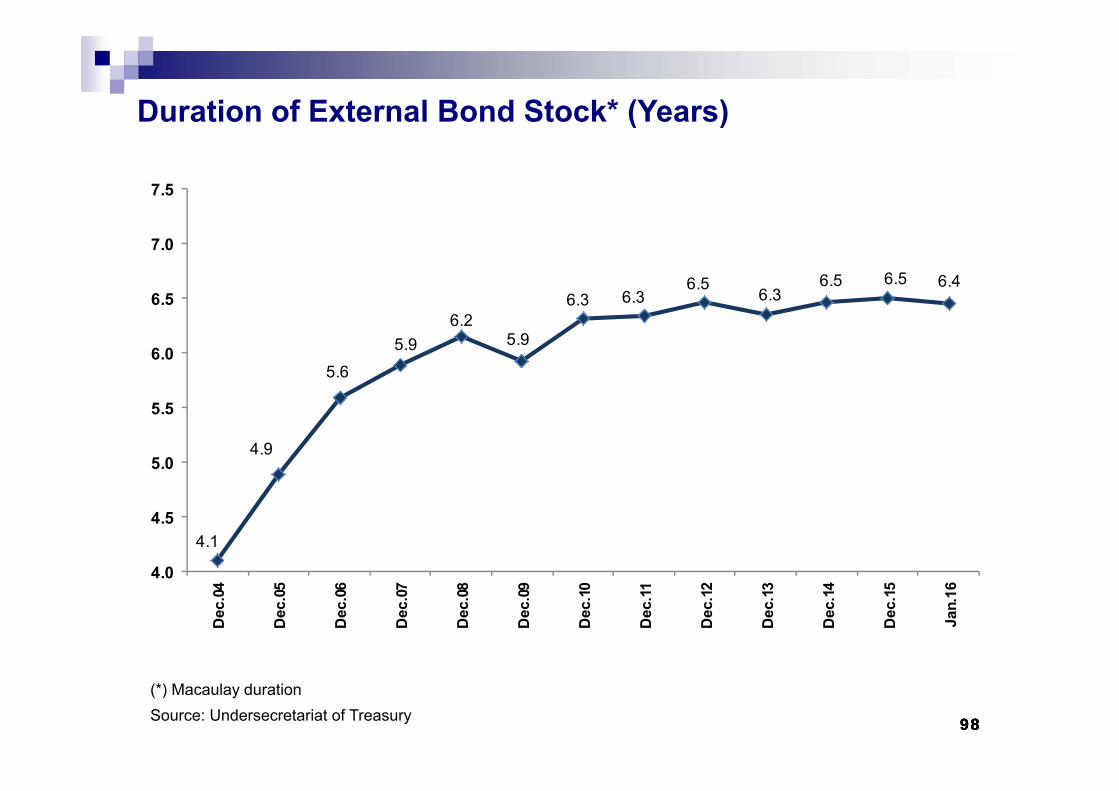
989898Source: Undersecretariat of Treasury
Duration of External Bond Stock* (Years)
4.1
4.9
5.6
5.96.2
5.9
6.3 6.36.5
6.36.5 6.5 6.4
4.0
4.5
5.0
5.5
6.0
6.5
7.0
7.5D
ec.0
4
Dec
.05
Dec
.06
Dec
.07
Dec
.08
Dec
.09
Dec
.10
Dec
.11
Dec
.12
Dec
.13
Dec
.14
Dec
.15
Jan.
16
(*) Macaulay duration
999999
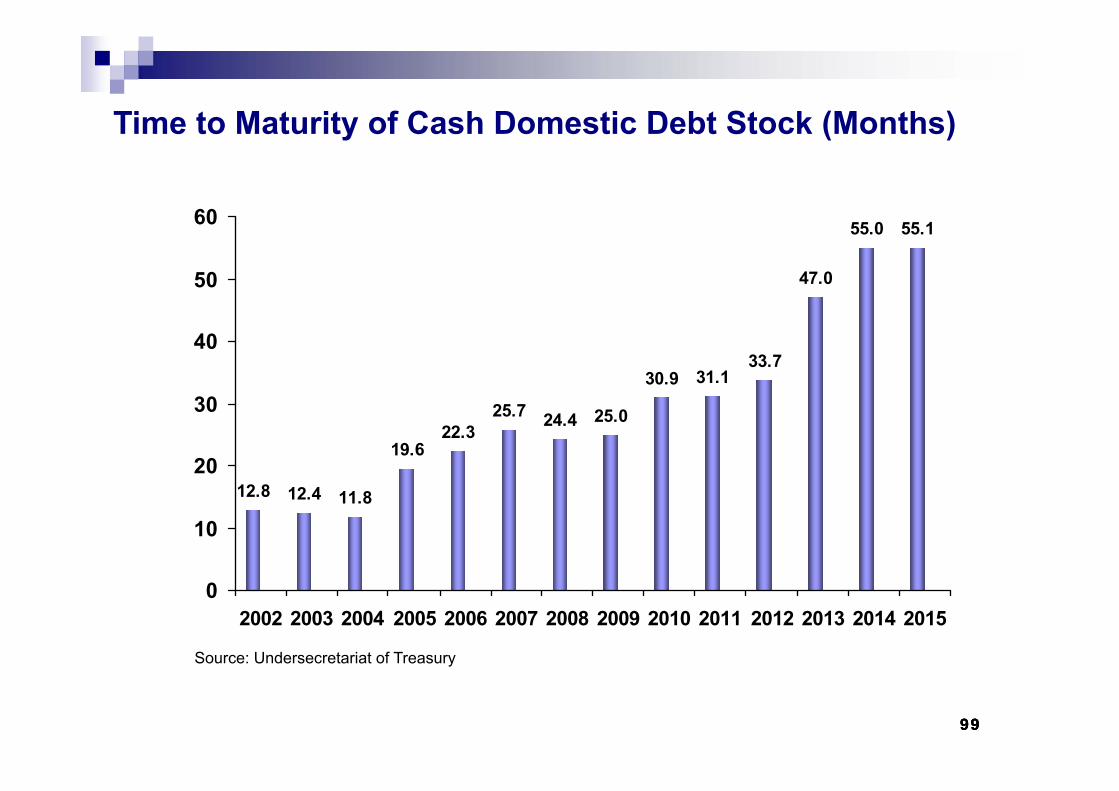
Time to Maturity of Cash Domestic Debt Stock (Months)
12.8 12.4 11.8
19.622.3
25.7 24.4 25.0
30.9 31.133.7
47.0
55.0 55.1
0
10
20
30
40
50
60
2002 2003 2004 2005 2006 2007 2008 2009 2010 2011 2012 2013 2014 2015
Source: Undersecretariat of Treasury
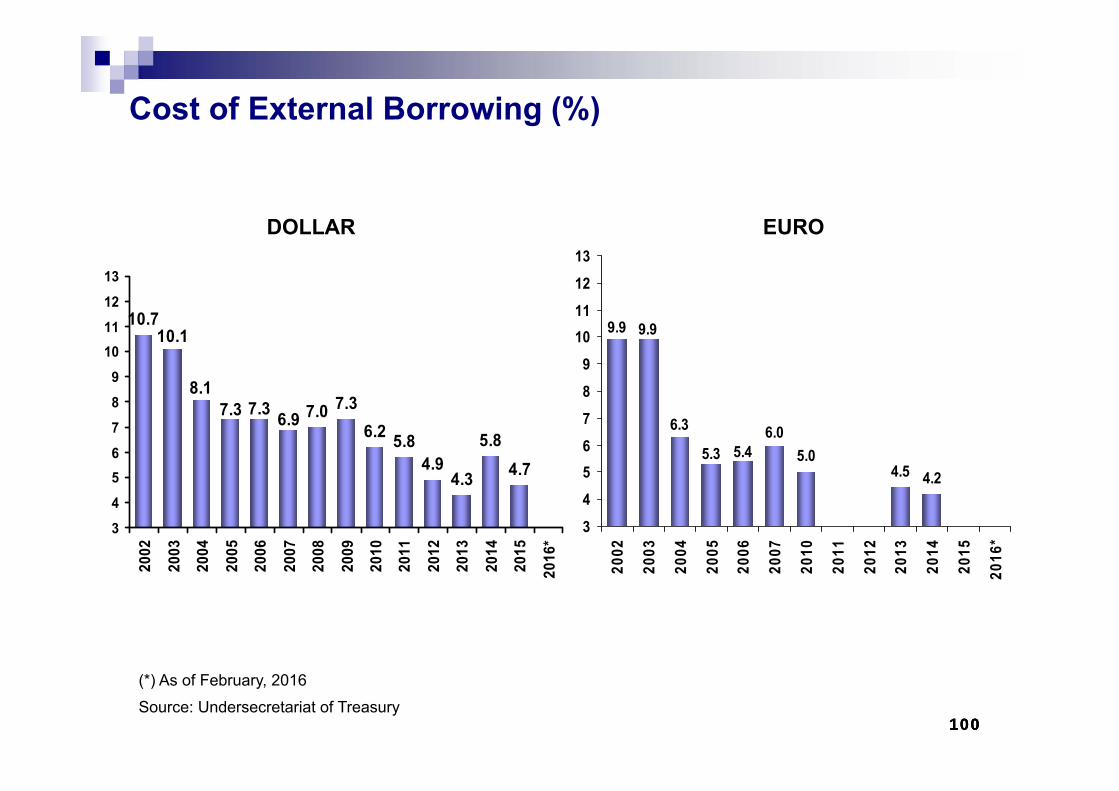
100100100
Cost of External Borrowing (%)
EURODOLLAR
4.5 4.25.0
6.05.45.3
6.3
9.9 9.9
3
4
56
7
8
9
1011
12
13
2002
2003
2004
2005
2006
2007
2010
2011
2012
2013
2014
2015
2016
*
(*) As of February, 2016
Source: Undersecretariat of Treasury
10.7
7.0 7.36.2 5.8
4.94.3
5.84.7
10.1
8.1
6.97.37.3
3
4
56
7
8
9
1011
12
13
2002
2003
2004
2005
2006
2007
2008
2009
2010
2011
2012
2013
2014
2015
2016
*
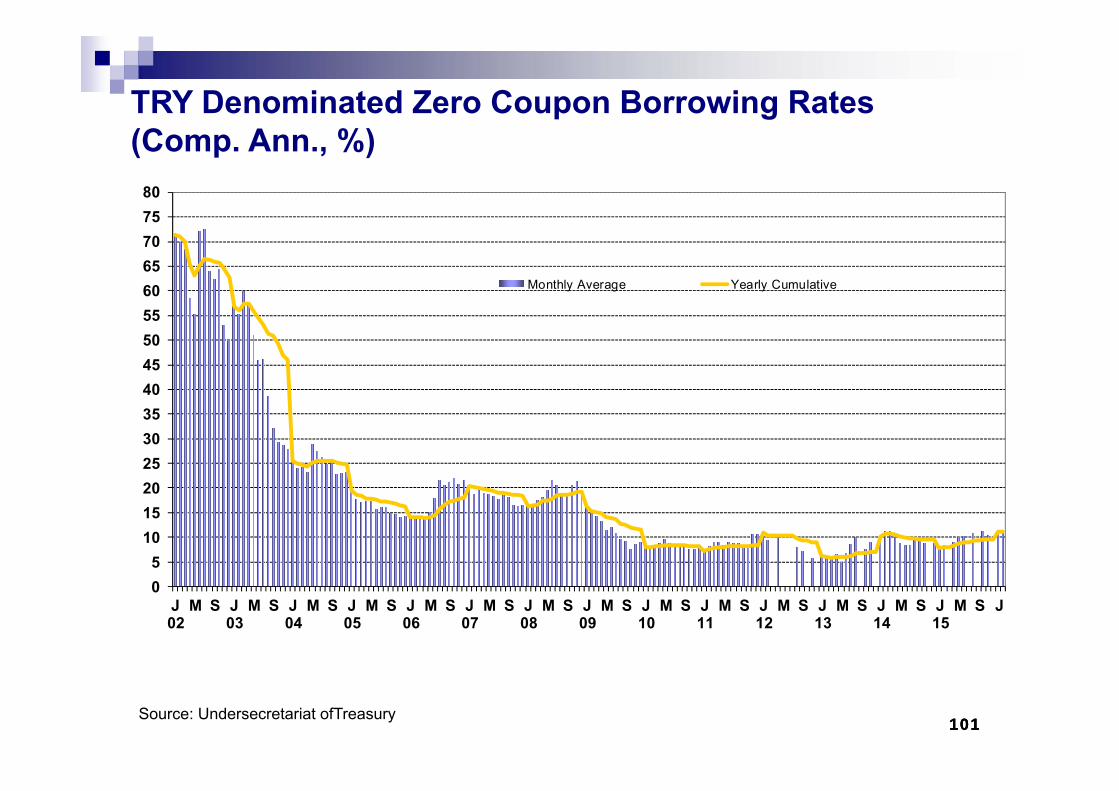
101101101
TRY Denominated Zero Coupon Borrowing Rates (Comp. Ann., %)
Source: Undersecretariat ofTreasury
05
101520253035404550556065707580
J02
M S J03
M S J04
M S J05
M S J06
M S J07
M S J08
M S J09
M S J10
M S J11
M S J12
M S J13
M S J14
M S J15
M S J
Monthly Average Yearly Cumulative
102102102
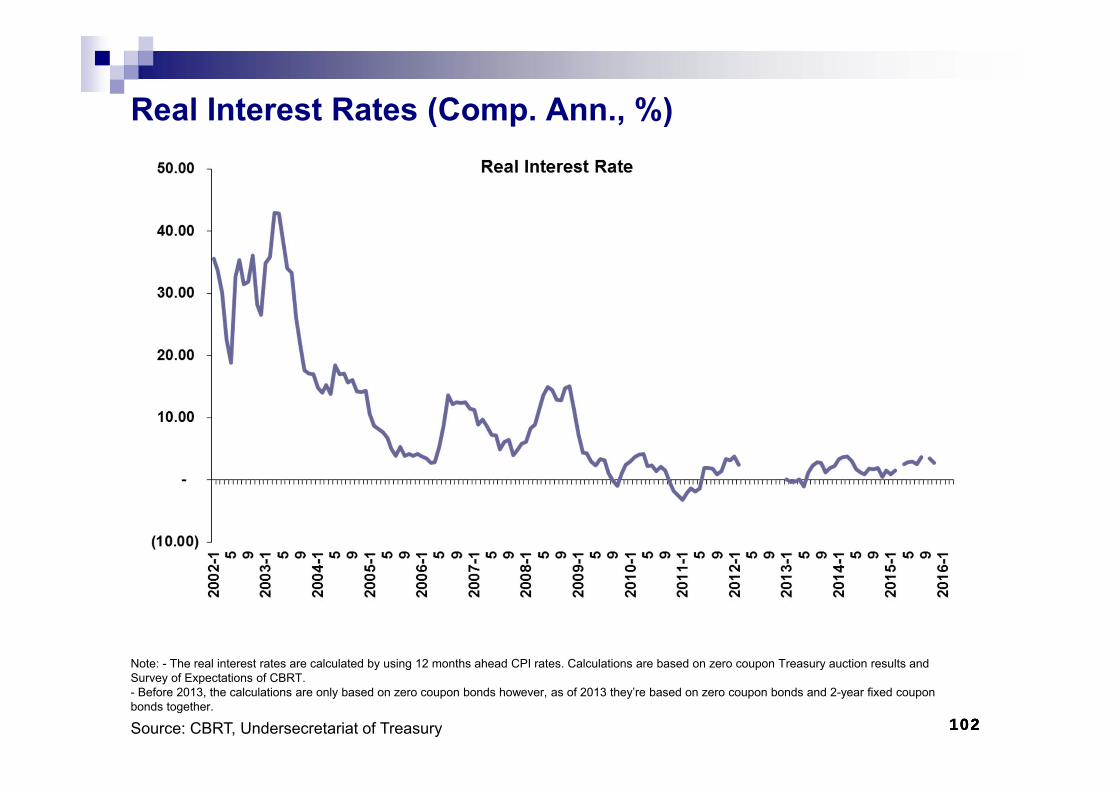
Real Interest Rates (Comp. Ann., %)
Note: - The real interest rates are calculated by using 12 months ahead CPI rates. Calculations are based on zero coupon Treasury auction results and Survey of Expectations of CBRT.- Before 2013, the calculations are only based on zero coupon bonds however, as of 2013 they’re based on zero coupon bonds and 2-year fixed coupon bonds together.
Source: CBRT, Undersecretariat of Treasury
103103103
0.4 0.0
-0.6
2.6
8.0
5.0
-2.4
-3.6-3.1 -2.6
1.0
-0.5-1.4 -1.8
-1.3
-4
-2
0
2
4
6
8
10
1999
2000
2001
2002
2003
2004
2005
2006
2007
2008
2009
2010
2011
2012
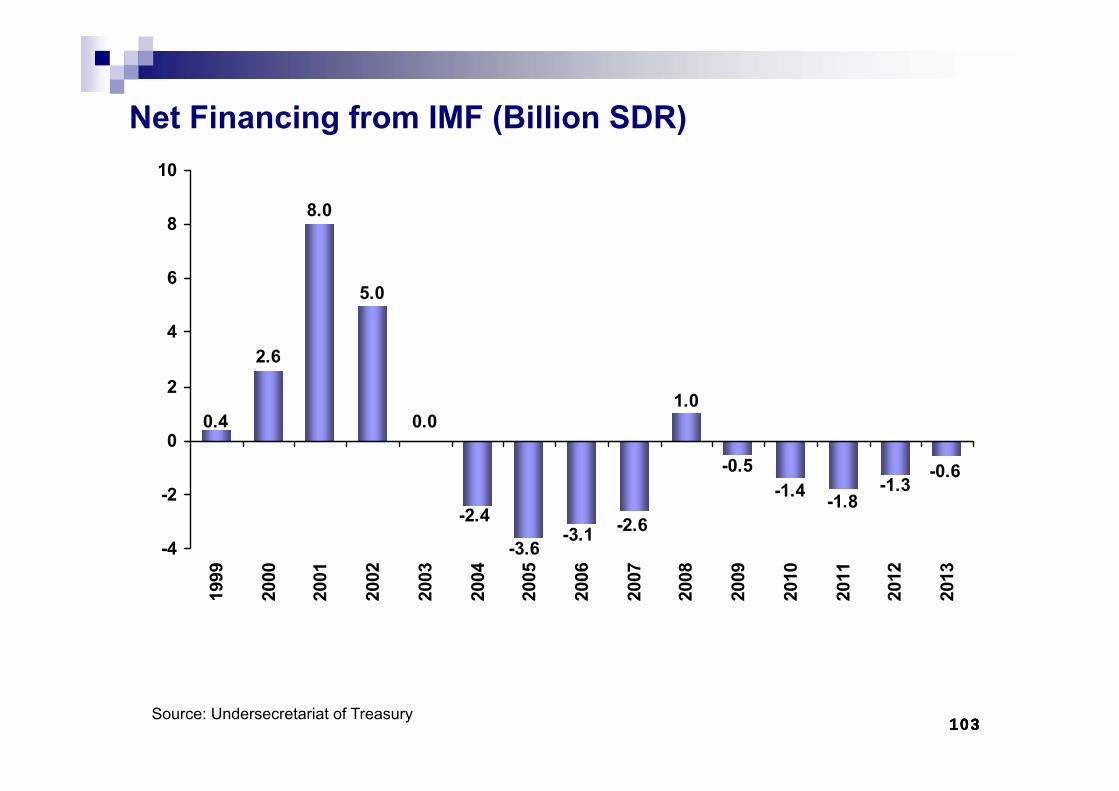
2013
Net Financing from IMF (Billion SDR)
Source: Undersecretariat of Treasury
104104104
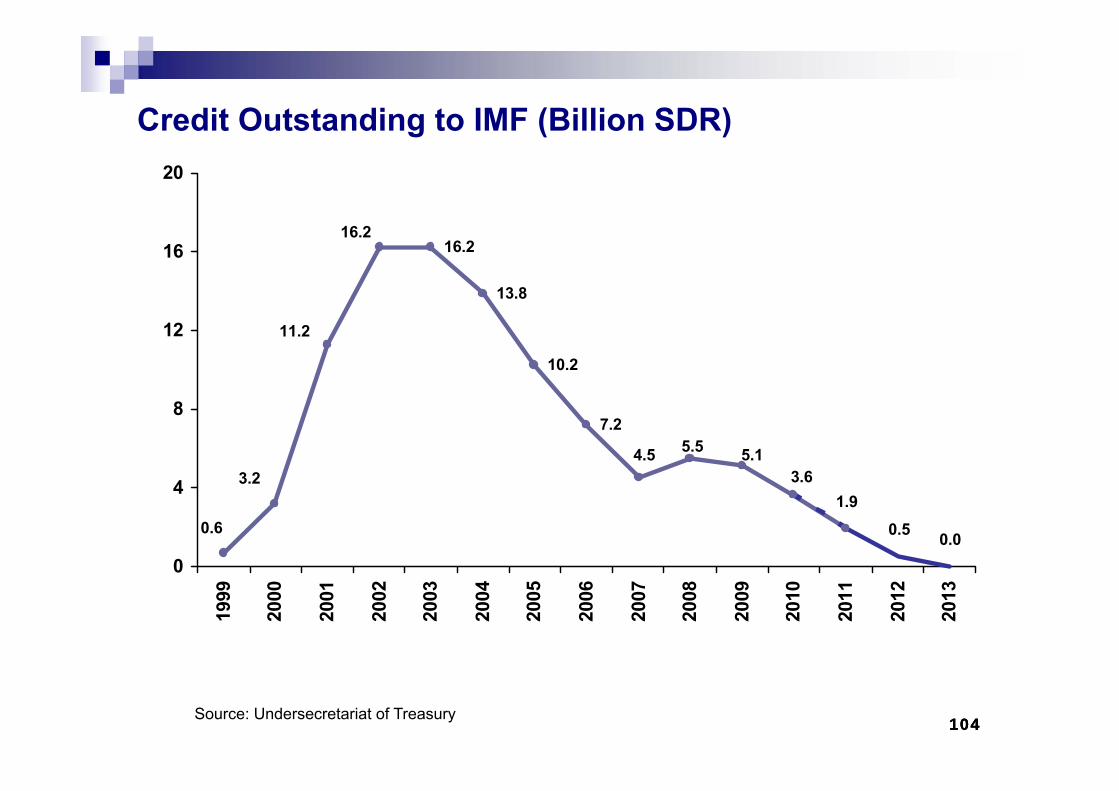
Credit Outstanding to IMF (Billion SDR)
Source: Undersecretariat of Treasury
16.2
13.8
10.2
7.2
1.90.5 0.0
4.5
0.6
3.2
16.2
11.2
5.5 5.13.6
0
4
8
12
16
20
1999
2000
2001
2002
2003
2004
2005
2006
2007
2008
2009
2010
2011
2012
2013
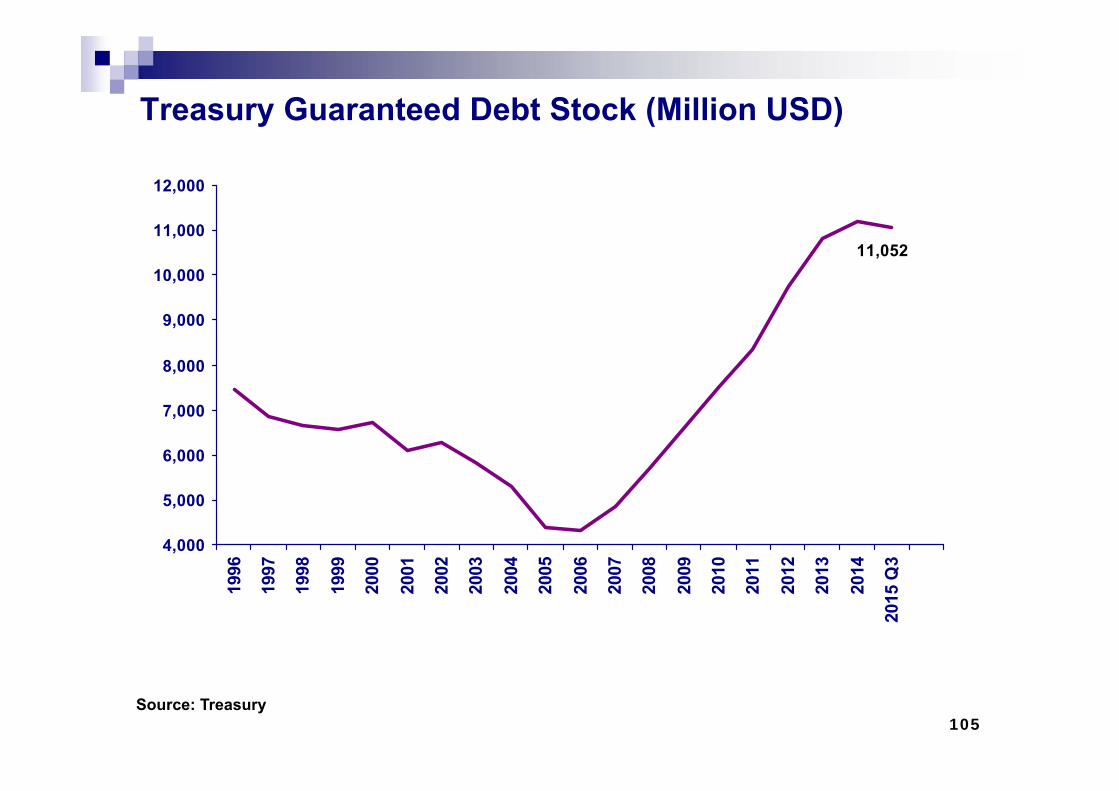
Treasury Guaranteed Debt Stock (Million USD)
Source: Treasury
11,052
4,000
5,000
6,000
7,000
8,000
9,000
10,000
11,000
12,000
1996
1997
1998
1999
2000
2001
2002
2003
2004
2005
2006
2007
2008
2009
2010
2011
2012
2013
2014
2015
Q3
105
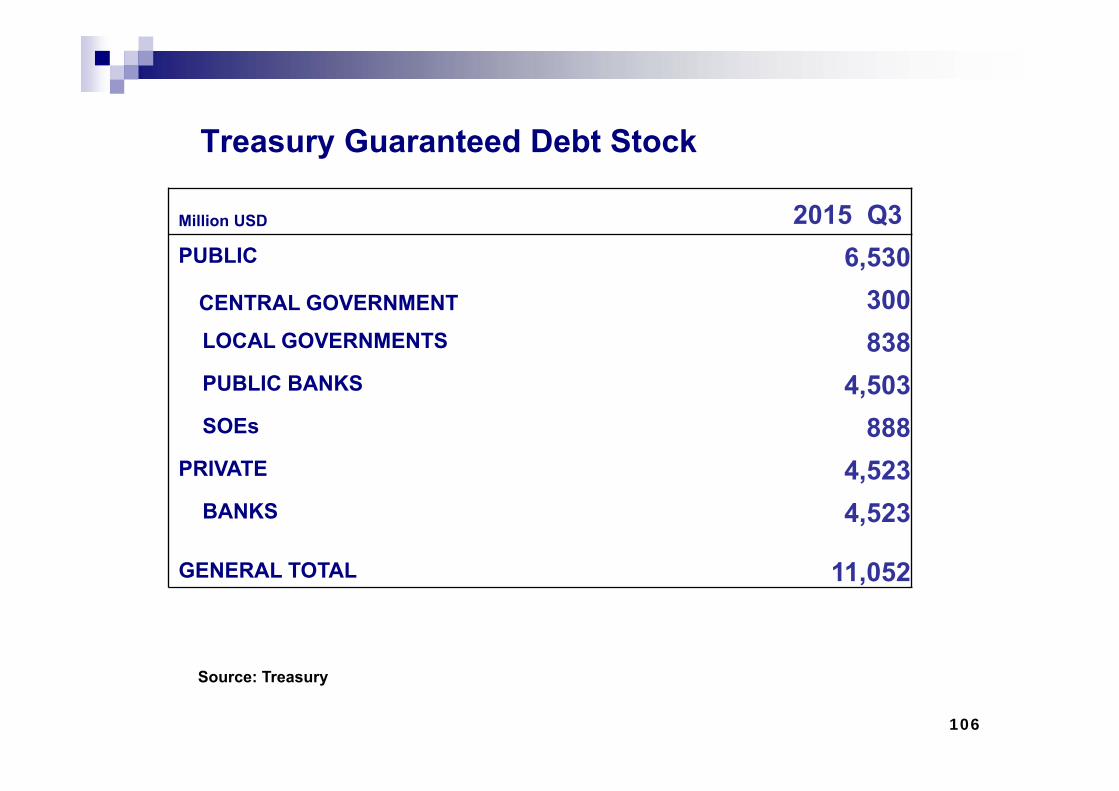
Treasury Guaranteed Debt Stock
Source: Treasury
Million USD 2015 Q3PUBLIC 6,530
CENTRAL GOVERNMENT 300LOCAL GOVERNMENTS 838PUBLIC BANKS 4,503SOEs 888
PRIVATE 4,523BANKS 4,523
GENERAL TOTAL 11,052
106
107
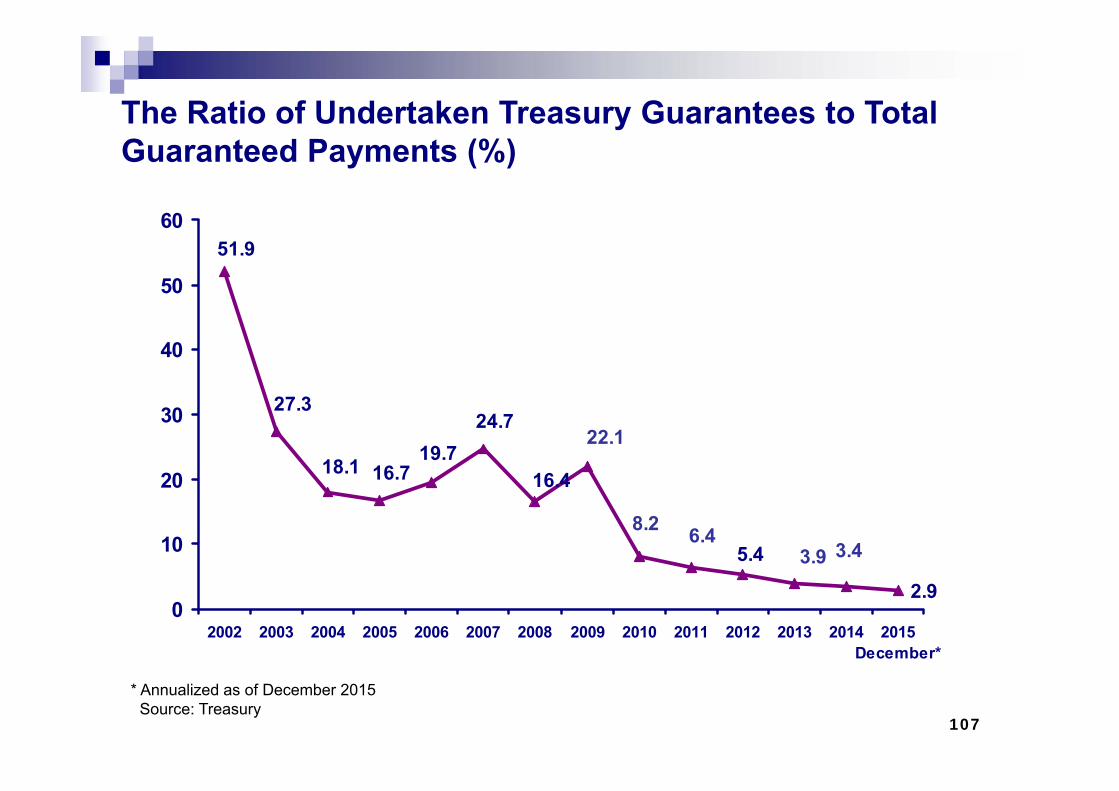
The Ratio of Undertaken Treasury Guarantees to Total Guaranteed Payments (%)
* Annualized as of December 2015Source: Treasury
2.9
3.4
51.9
27.3
18.1 16.719.7
24.7
16.4
22.1
8.23.9
6.45.4
0
10
20
30
40
50
60
2002 2003 2004 2005 2006 2007 2008 2009 2010 2011 2012 2013 2014 2015December*
0
100
200
300
400
500
2002
2003
2004
2005
2006
2007
2008
2009
2010
2011
2012
2013
2014
Dec
embe
r 201
5
Local Administrations SOEs Other
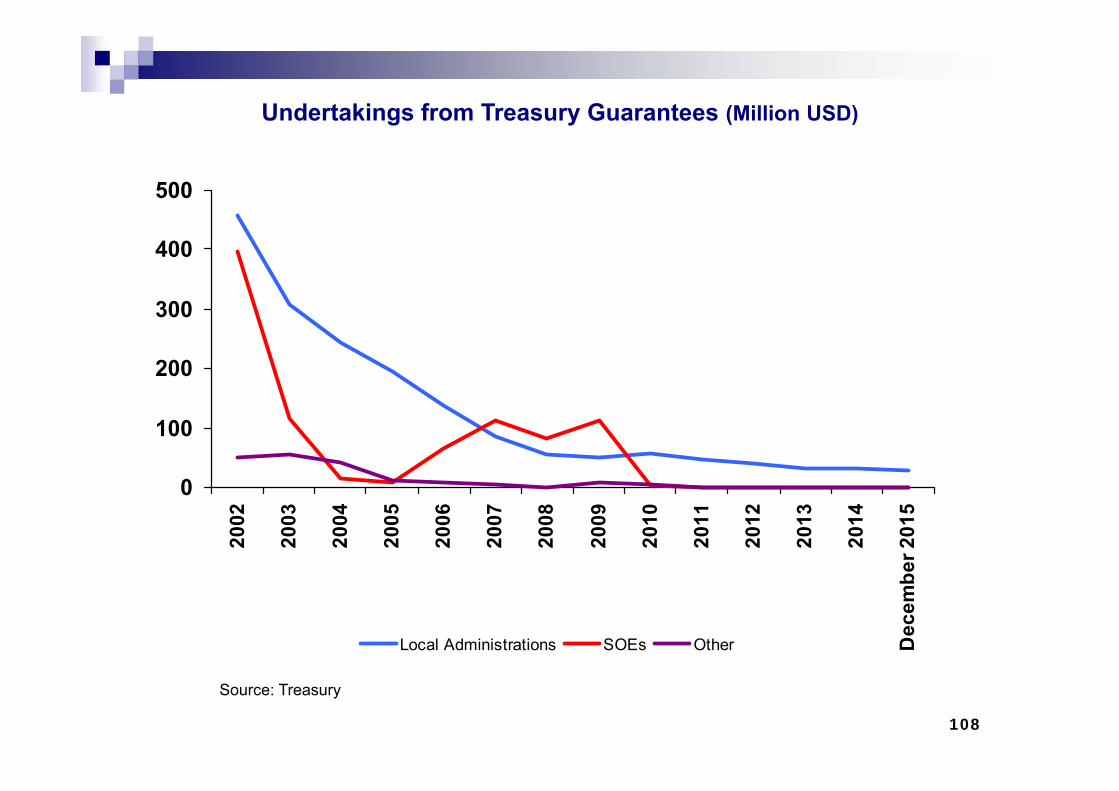
Undertakings from Treasury Guarantees (Million USD)
108
Source: Treasury
109109109
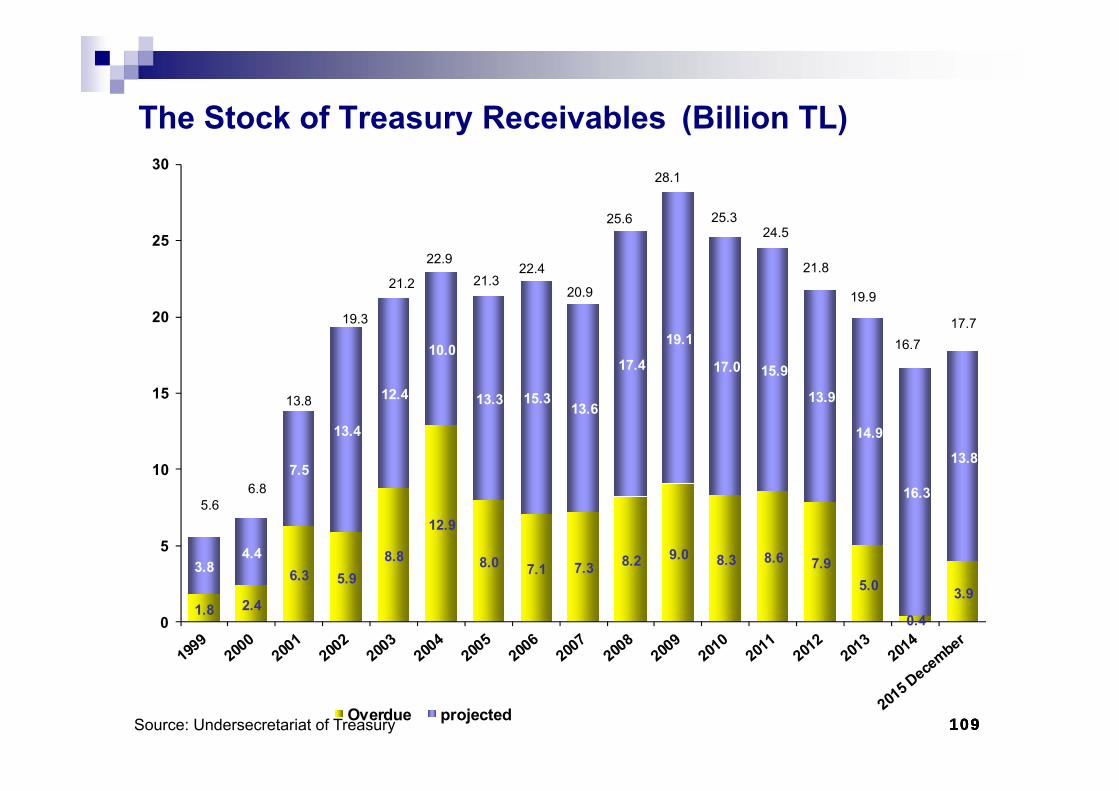
The Stock of Treasury Receivables (Billion TL)
Source: Undersecretariat of Treasury
1.8 2.4
6.3 5.98.8
12.9
8.0 7.1 7.3 8.2 9.0 8.3 8.6 7.95.0
0.4
3.9
3.84.4
7.5
13.4
12.4
10.0
13.3 15.313.6
17.4
19.1
17.0 15.9
13.9
14.9
16.3
13.8
0
5
10
15
20
25
30
Overdue projected
5.66.8
13.8
19.3
21.2
22.921.3
22.4
20.9
25.6
28.1
25.3
21.8
24.5
19.9
16.717.7
110
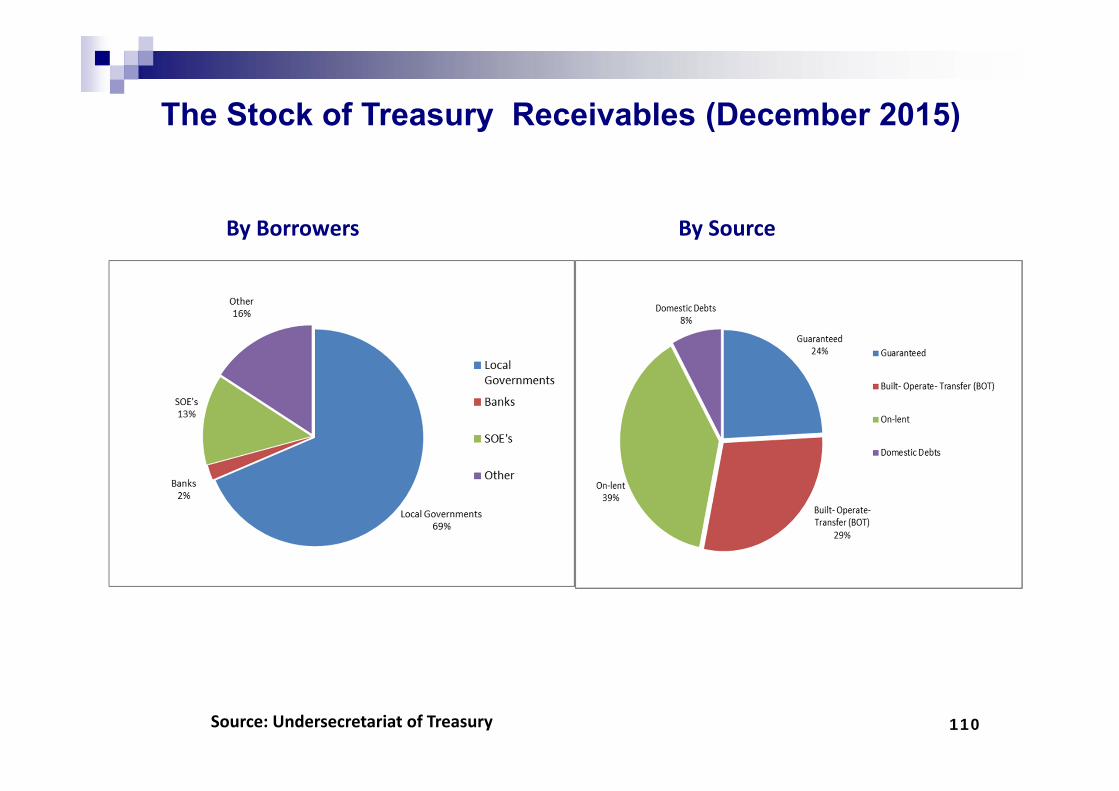
By Source
The Stock of Treasury Receivables (December 2015)
By Borrowers
Source: Undersecretariat of Treasury
111111111
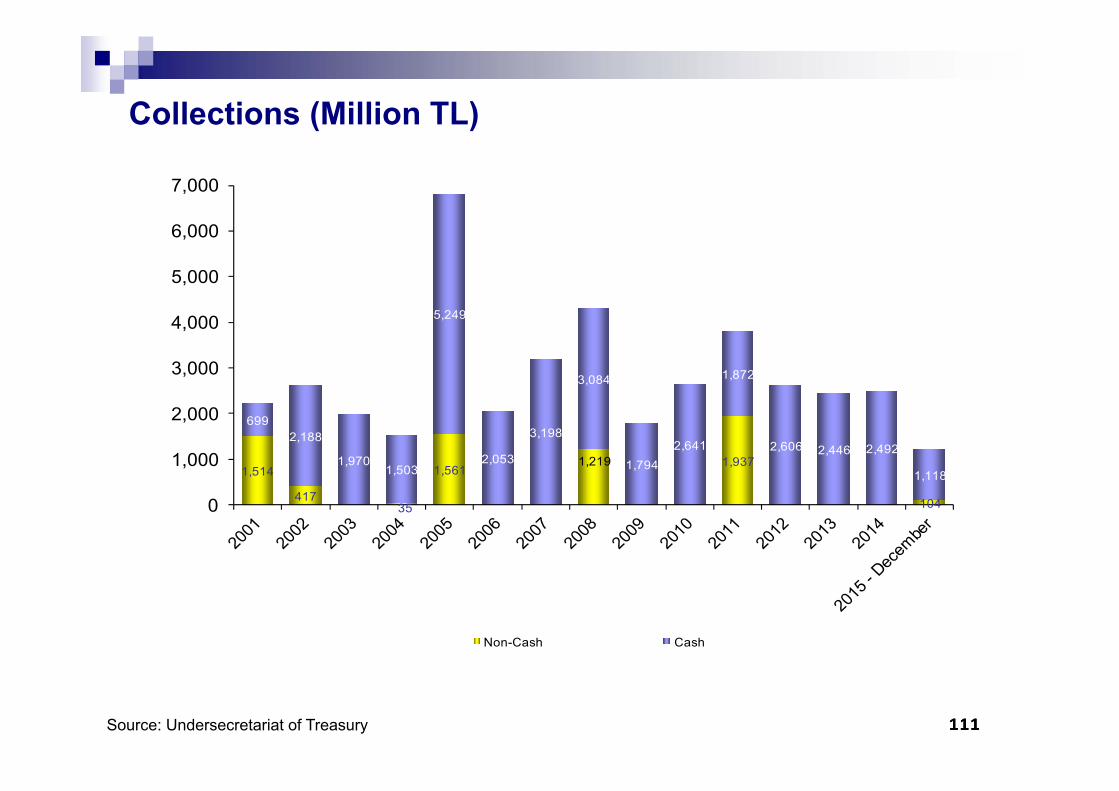
Collections (Million TL)
Source: Undersecretariat of Treasury
1,514
41735
1,5611,219 1,937
104
6992,188
1,9701,503
5,249
2,053
3,198
3,084
1,7942,641
1,872
2,606 2,446 2,492
1,118
0
1,000
2,000
3,000
4,000
5,000
6,000
7,000
Non-Cash Cash
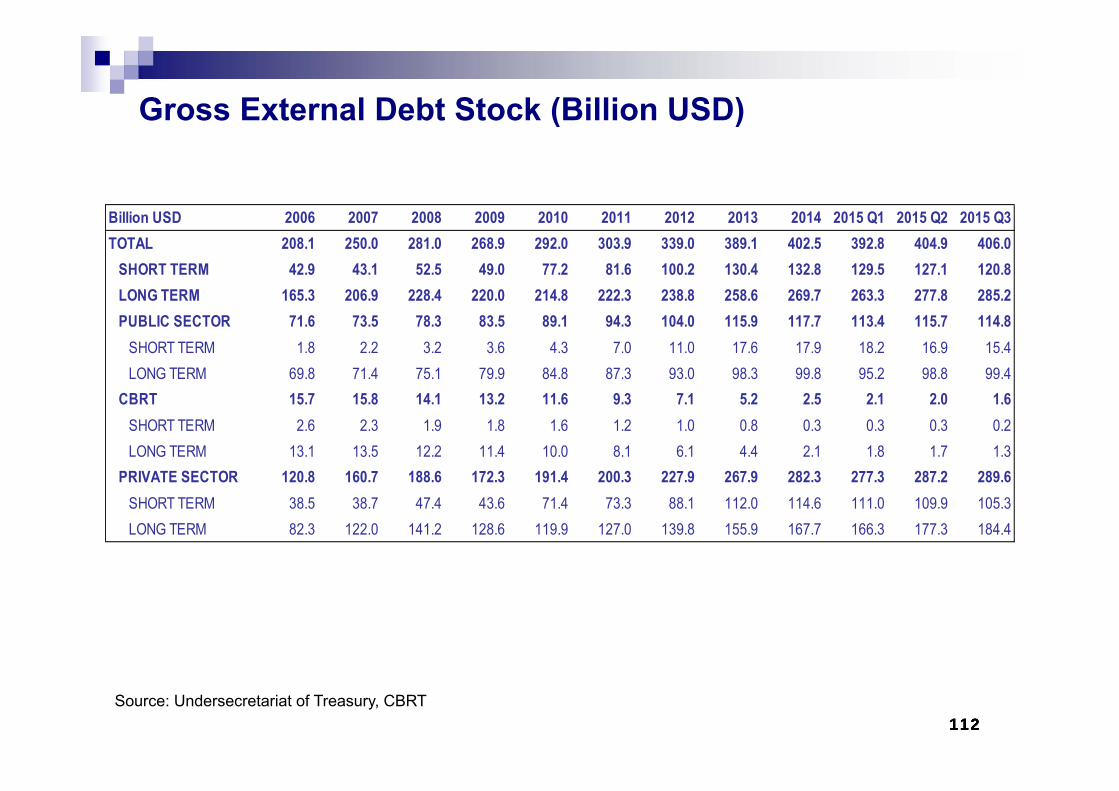
112112112
Gross External Debt Stock (Billion USD)
Source: Undersecretariat of Treasury, CBRT
Billion USD 2006 2007 2008 2009 2010 2011 2012 2013 2014 2015 Q1 2015 Q2 2015 Q3TOTAL 208.1 250.0 281.0 268.9 292.0 303.9 339.0 389.1 402.5 392.8 404.9 406.0 SHORT TERM 42.9 43.1 52.5 49.0 77.2 81.6 100.2 130.4 132.8 129.5 127.1 120.8 LONG TERM 165.3 206.9 228.4 220.0 214.8 222.3 238.8 258.6 269.7 263.3 277.8 285.2 PUBLIC SECTOR 71.6 73.5 78.3 83.5 89.1 94.3 104.0 115.9 117.7 113.4 115.7 114.8 SHORT TERM 1.8 2.2 3.2 3.6 4.3 7.0 11.0 17.6 17.9 18.2 16.9 15.4 LONG TERM 69.8 71.4 75.1 79.9 84.8 87.3 93.0 98.3 99.8 95.2 98.8 99.4 CBRT 15.7 15.8 14.1 13.2 11.6 9.3 7.1 5.2 2.5 2.1 2.0 1.6 SHORT TERM 2.6 2.3 1.9 1.8 1.6 1.2 1.0 0.8 0.3 0.3 0.3 0.2 LONG TERM 13.1 13.5 12.2 11.4 10.0 8.1 6.1 4.4 2.1 1.8 1.7 1.3 PRIVATE SECTOR 120.8 160.7 188.6 172.3 191.4 200.3 227.9 267.9 282.3 277.3 287.2 289.6 SHORT TERM 38.5 38.7 47.4 43.6 71.4 73.3 88.1 112.0 114.6 111.0 109.9 105.3 LONG TERM 82.3 122.0 141.2 128.6 119.9 127.0 139.8 155.9 167.7 166.3 177.3 184.4
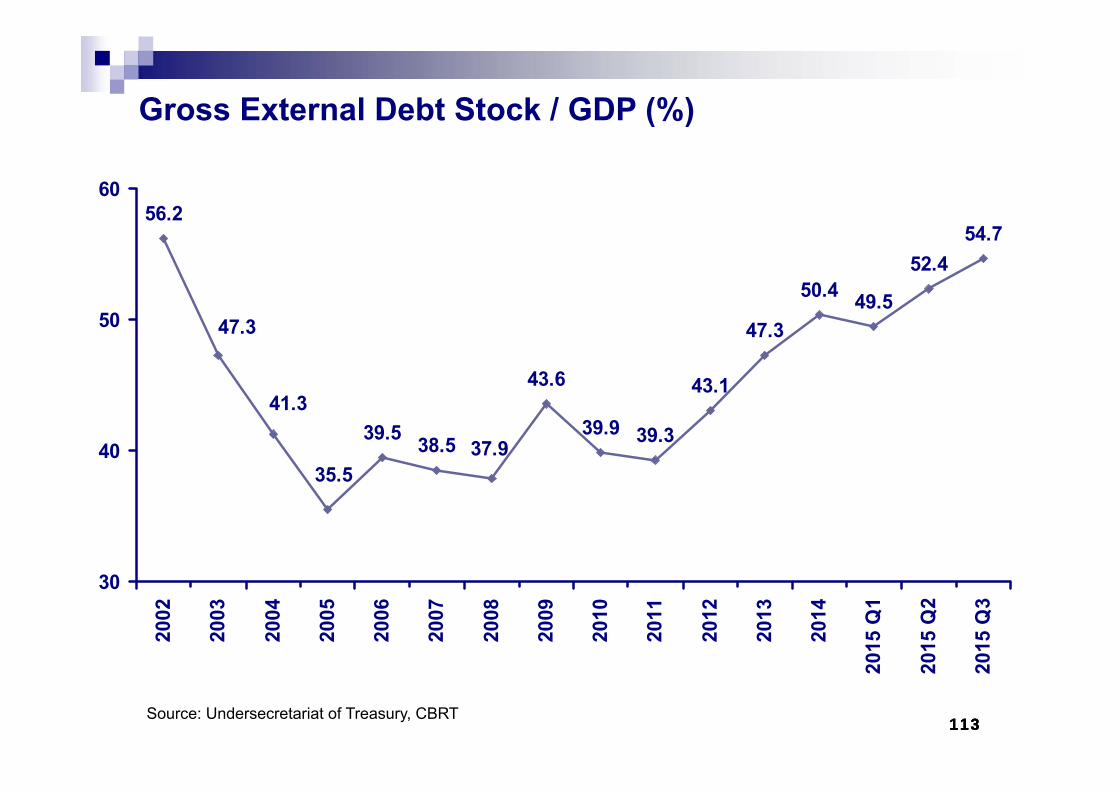
113113113Source: Undersecretariat of Treasury, CBRT
49.5
52.454.7
47.3
50.4
43.1
39.339.9
43.6
37.938.539.5
35.5
41.3
47.3
56.2
30
40
50
6020
02
2003
2004
2005
2006
2007
2008
2009
2010
2011
2012
2013
2014
2015
Q1
2015
Q2
2015
Q3
Gross External Debt Stock / GDP (%)
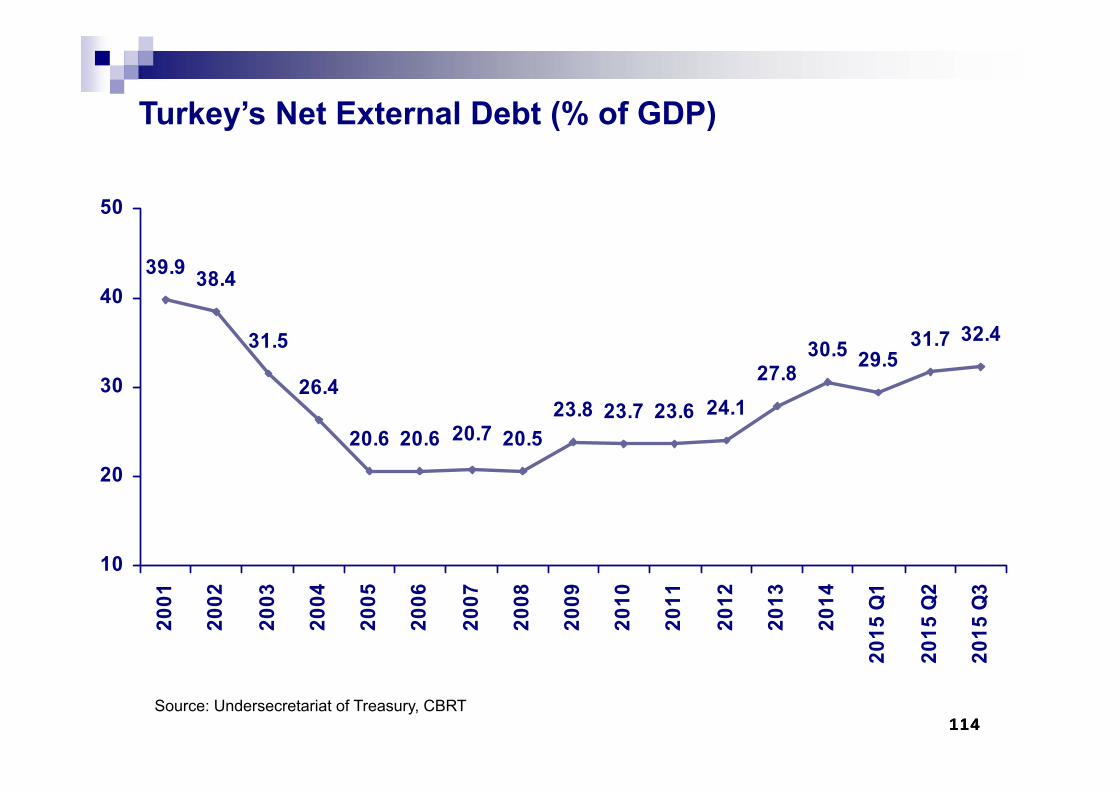
114114114
Turkey’s Net External Debt (% of GDP)
Source: Undersecretariat of Treasury, CBRT
29.531.7 32.4
30.527.8
23.820.720.620.6
26.4
31.5
38.439.9
20.523.7 23.6 24.1
10
20
30
40
50
2001
2002
2003
2004
2005
2006
2007
2008
2009
2010
2011
2012
2013
2014
2015
Q1
2015
Q2
2015
Q3
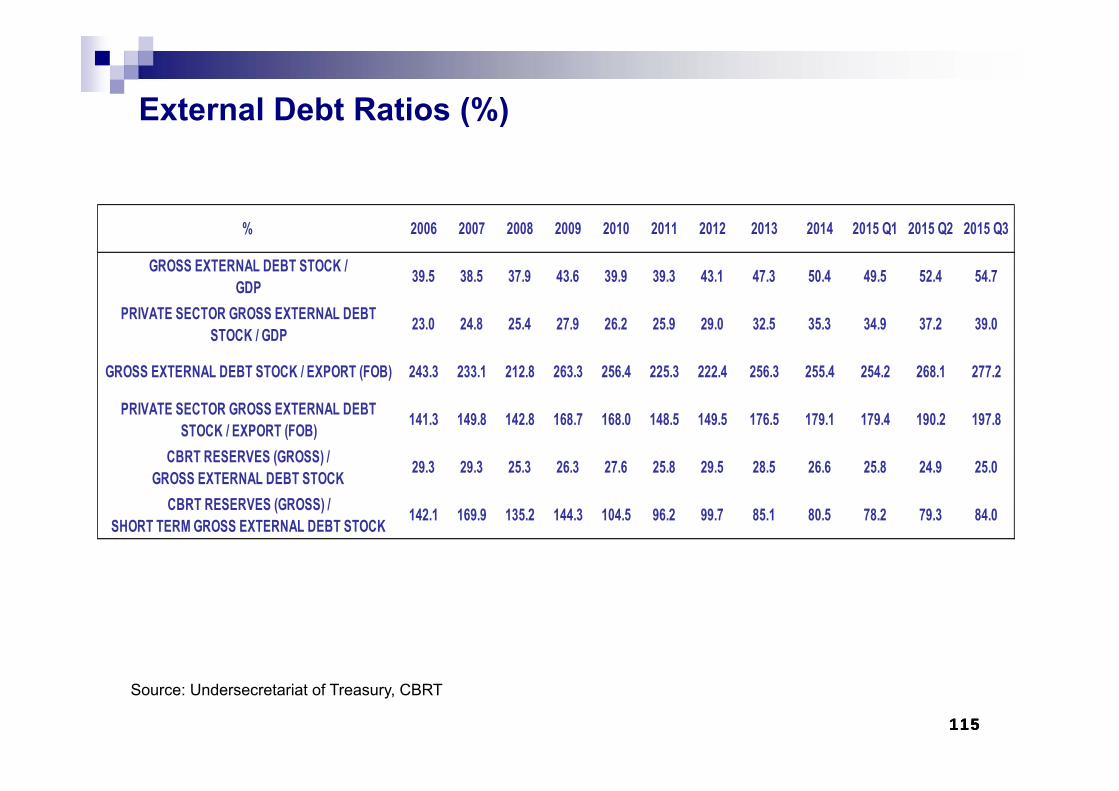
115115115
Source: Undersecretariat of Treasury, CBRT
External Debt Ratios (%)
% 2006 2007 2008 2009 2010 2011 2012 2013 2014 2015 Q1 2015 Q2 2015 Q3
GROSS EXTERNAL DEBT STOCK / GDP 39.5 38.5 37.9 43.6 39.9 39.3 43.1 47.3 50.4 49.5 52.4 54.7
PRIVATE SECTOR GROSS EXTERNAL DEBT STOCK / GDP 23.0 24.8 25.4 27.9 26.2 25.9 29.0 32.5 35.3 34.9 37.2 39.0
GROSS EXTERNAL DEBT STOCK / EXPORT (FOB) 243.3 233.1 212.8 263.3 256.4 225.3 222.4 256.3 255.4 254.2 268.1 277.2
PRIVATE SECTOR GROSS EXTERNAL DEBT STOCK / EXPORT (FOB) 141.3 149.8 142.8 168.7 168.0 148.5 149.5 176.5 179.1 179.4 190.2 197.8
CBRT RESERVES (GROSS) / GROSS EXTERNAL DEBT STOCK 29.3 29.3 25.3 26.3 27.6 25.8 29.5 28.5 26.6 25.8 24.9 25.0
CBRT RESERVES (GROSS) / SHORT TERM GROSS EXTERNAL DEBT STOCK 142.1 169.9 135.2 144.3 104.5 96.2 99.7 85.1 80.5 78.2 79.3 84.0

116116116
FINANCIAL SECTOR
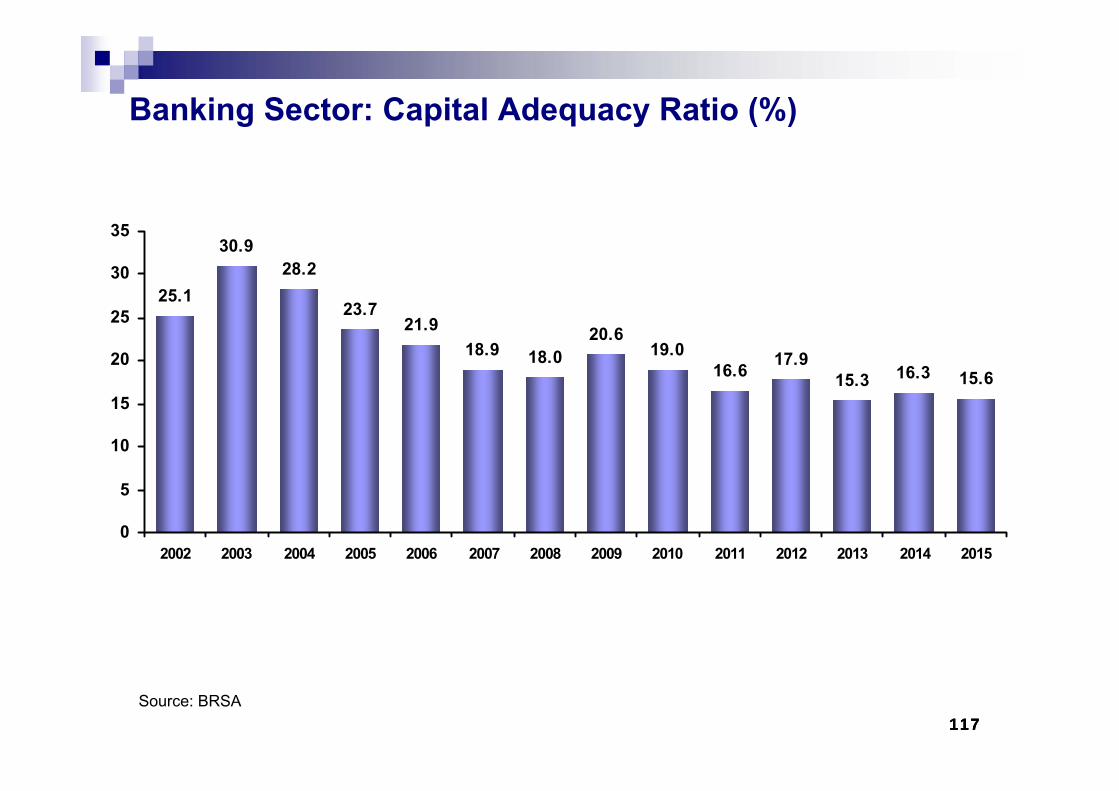
25.1
30.928.2
23.721.9
18.9 18.020.6
19.016.6 17.9
15.3 16.3 15.6
0
5
10
15
20
25
30
35
2002 2003 2004 2005 2006 2007 2008 2009 2010 2011 2012 2013 2014 2015
117117117
Banking Sector: Capital Adequacy Ratio (%)
Source: BRSA
118118118
0
4
8
12
16
20
24
2820
06-0
220
06-0
520
06-0
820
06-1
120
07-0
220
07-0
520
07-0
820
07-1
120
08-0
220
08-0
520
08-0
820
08-1
120
09-0
220
09-0
520
09-0
820
09-1
120
10-0
220
10-0
520
10-0
820
10-1
120
11-0
220
11-0
520
11-0
820
11-1
120
12-0
220
12-0
520
12-0
820
12-1
120
13-2
2013
-05
2013
-08
2013
-11
2014
-02
2014
-05
2014
-08
2014
-11
2015
-02
2015
-05
2015
-08
2015
-11
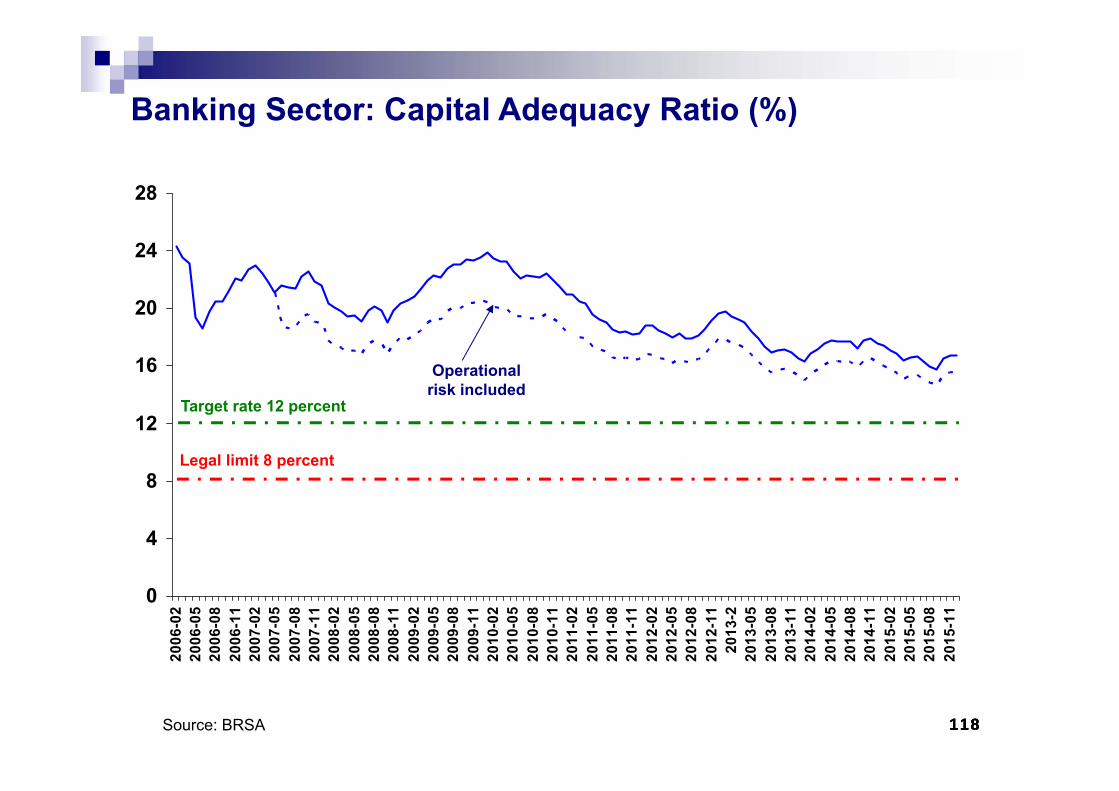
Target rate 12 percent
Legal limit 8 percent
Source: BRSA
Banking Sector: Capital Adequacy Ratio (%)
Operational risk included
119119119
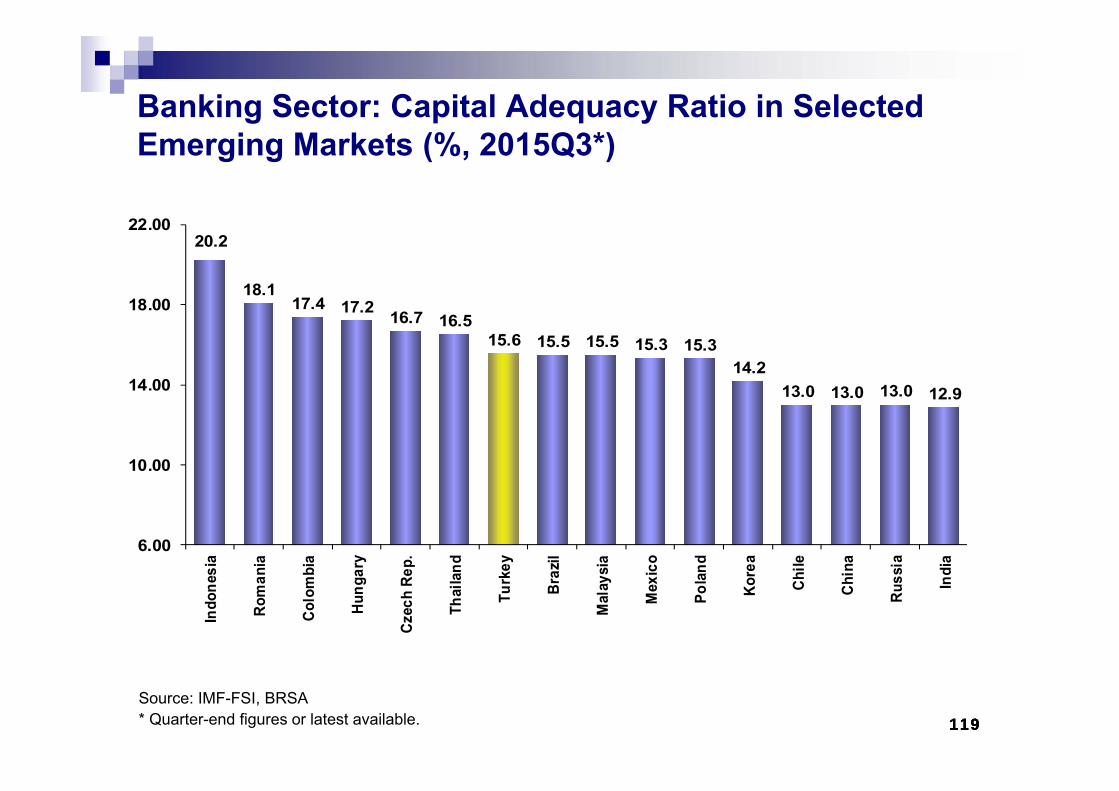
Banking Sector: Capital Adequacy Ratio in Selected Emerging Markets (%, 2015Q3*)
Source: IMF-FSI, BRSA* Quarter-end figures or latest available.
20.2
18.117.4 17.2 16.7 16.5
15.6 15.5 15.5 15.3 15.314.2
13.0 13.0 13.0 12.9
6.00
10.00
14.00
18.00
22.00In
done
sia
Rom
ania
Colo
mbi
a
Hung
ary
Czec
h Re
p.
Thai
land
Turk
ey
Braz
il
Mal
aysi
a
Mex
ico
Pola
nd
Kore
a
Chile
Chin
a
Russ
ia
Indi
a
120120120
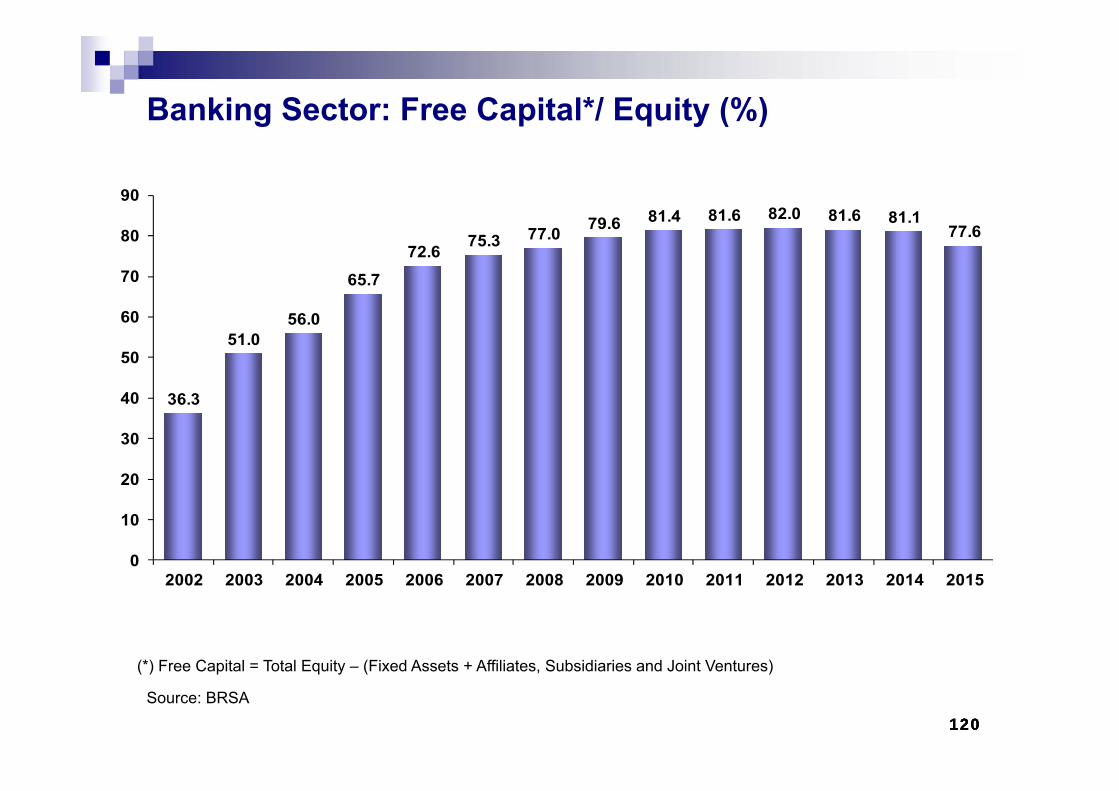
Banking Sector: Free Capital*/ Equity (%)
(*) Free Capital = Total Equity – (Fixed Assets + Affiliates, Subsidiaries and Joint Ventures)
Source: BRSA
36.3
51.056.0
65.772.6 75.3 77.0 79.6 81.4 81.6 82.0 81.6 81.1
77.6
0
10
20
30
40
50
60
70
80
90
2002 2003 2004 2005 2006 2007 2008 2009 2010 2011 2012 2013 2014 2015
121121121
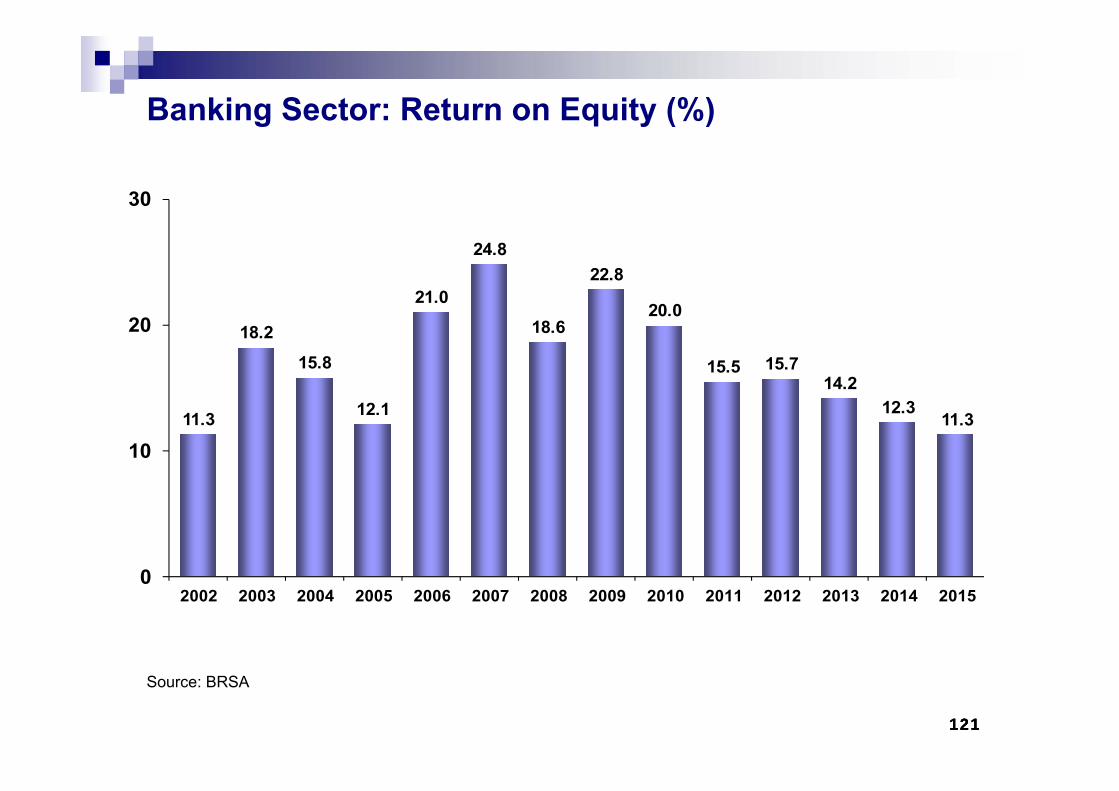
Banking Sector: Return on Equity (%)
Source: BRSA
11.3
18.2
15.8
12.1
21.0
24.8
18.6
22.8
20.0
15.5 15.714.2
12.311.3
0
10
20
30
2002 2003 2004 2005 2006 2007 2008 2009 2010 2011 2012 2013 2014 2015
122122122
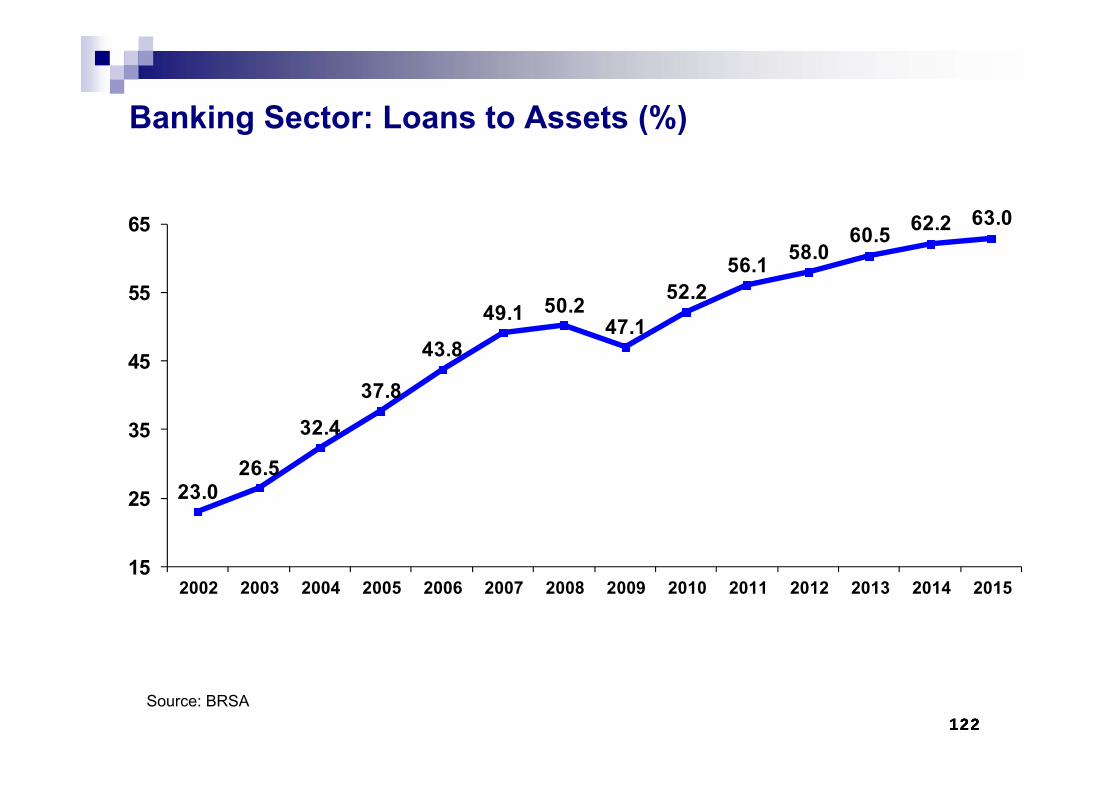
Banking Sector: Loans to Assets (%)
Source: BRSA
23.026.5
32.4
37.8
43.8
49.1 50.247.1
52.256.1 58.0
60.5 62.2 63.0
15
25
35
45
55
65
2002 2003 2004 2005 2006 2007 2008 2009 2010 2011 2012 2013 2014 2015
123123123
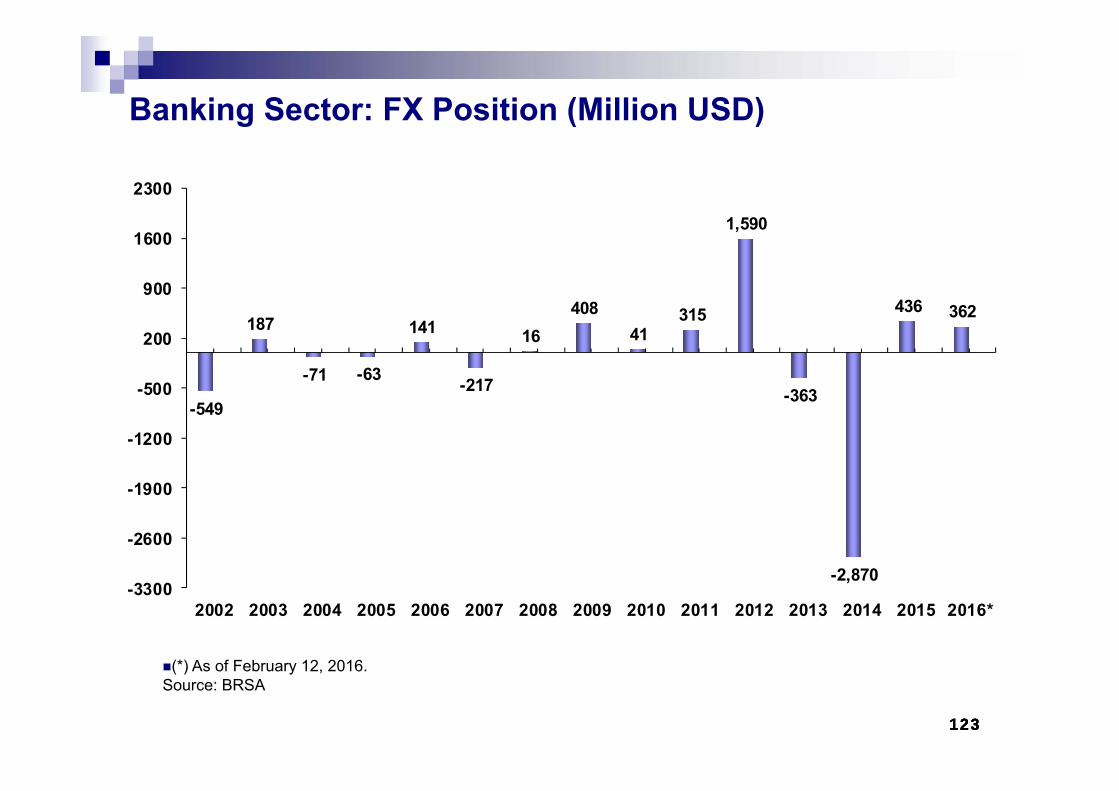
Banking Sector: FX Position (Million USD)
(*) As of February 12, 2016.Source: BRSA
-549
187
-71 -63
141
-217
16408
41315
1,590
-363
-2,870
436 362
-3300
-2600
-1900
-1200
-500
200
900
1600
2300
2002 2003 2004 2005 2006 2007 2008 2009 2010 2011 2012 2013 2014 2015 2016*
124124124
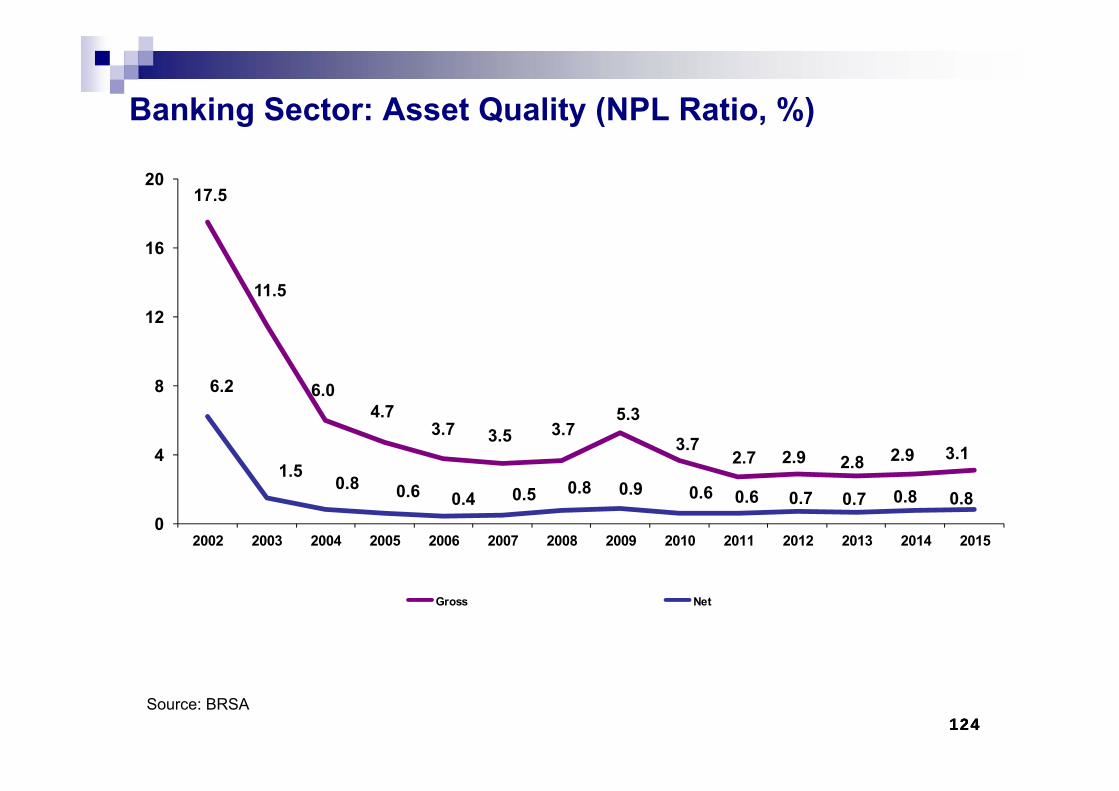
Banking Sector: Asset Quality (NPL Ratio, %)
Source: BRSA
17.5
11.5
6.04.7
3.7 3.5 3.75.3
3.72.7 2.9 2.8 2.9 3.1
6.2
1.50.8 0.6 0.4 0.5 0.8 0.9 0.6 0.6 0.7 0.7 0.8 0.8
0
4
8
12
16
20
2002 2003 2004 2005 2006 2007 2008 2009 2010 2011 2012 2013 2014 2015
Gross Net
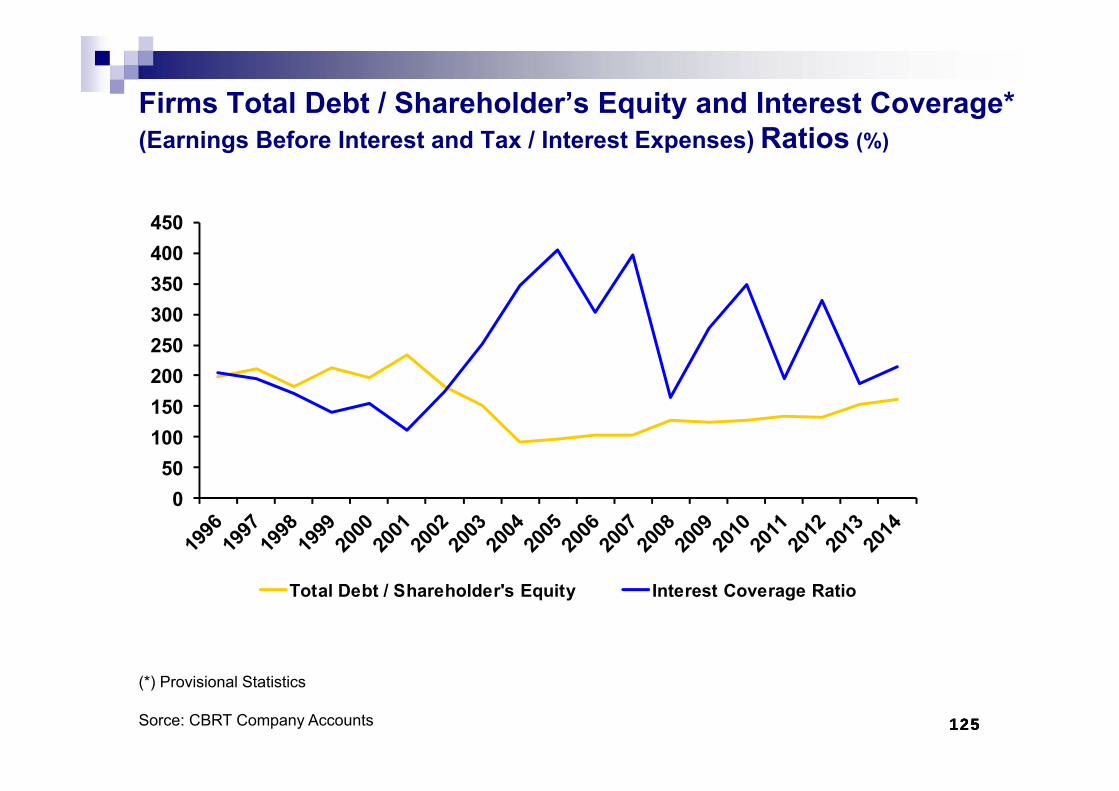
125125125
Firms Total Debt / Shareholder’s Equity and Interest Coverage* (Earnings Before Interest and Tax / Interest Expenses) Ratios (%)
(*) Provisional Statistics
Sorce: CBRT Company Accounts
050
100150200250300350400450
Total Debt / Shareholder's Equity Interest Coverage Ratio
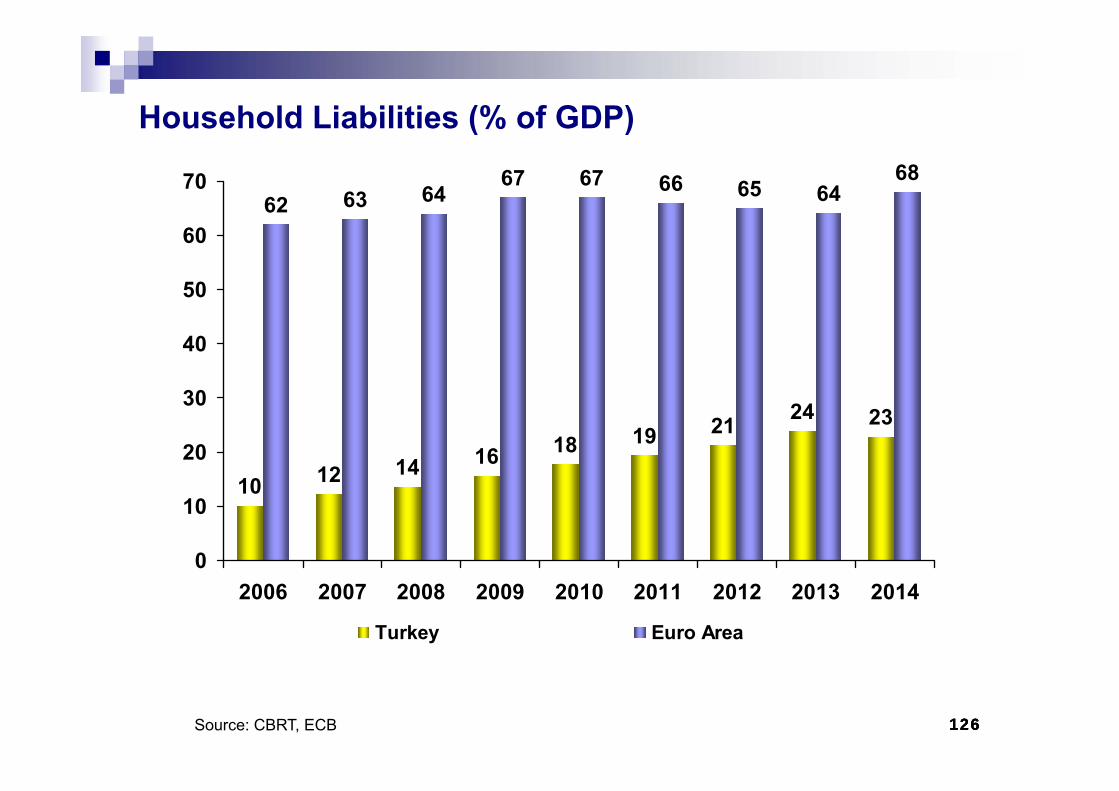
126126126
Household Liabilities (% of GDP)
10 12 14 16 18 19 21 24 23
62 63 6467 67 66 65 64
68
0
10
20
30
40
50
60
70
2006 2007 2008 2009 2010 2011 2012 2013 2014
Turkey Euro Area
Source: CBRT, ECB
127127127
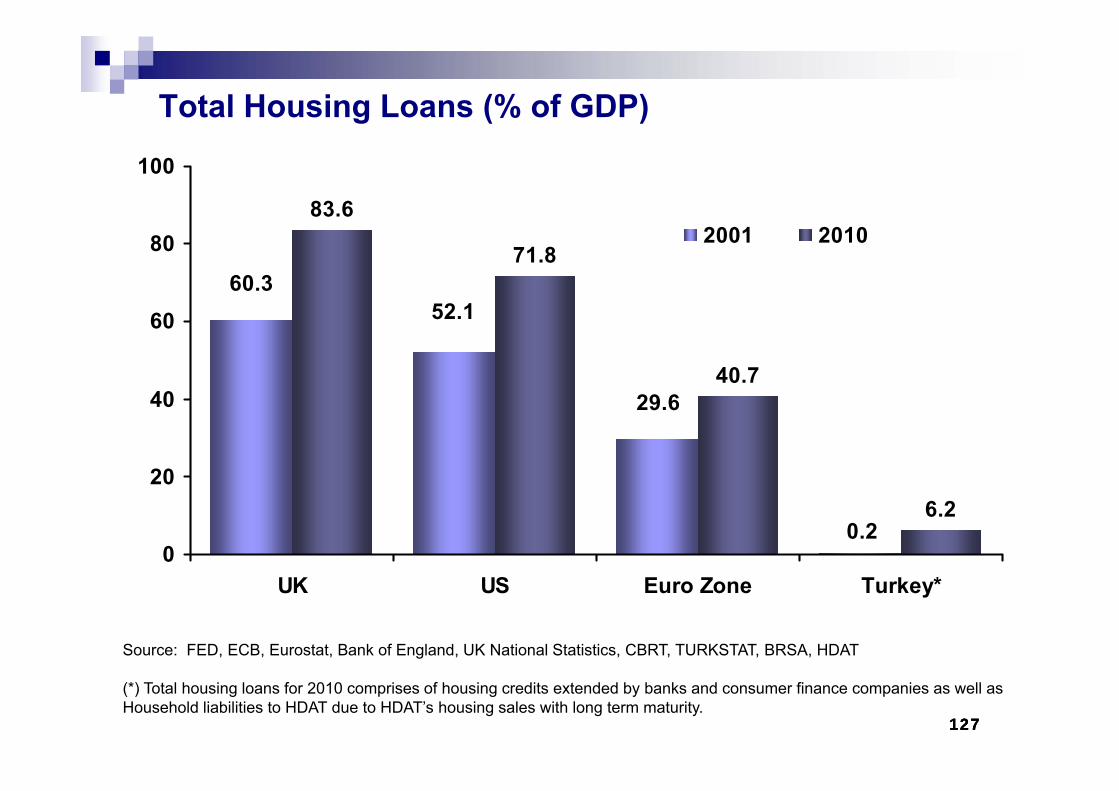
Total Housing Loans (% of GDP)
Source: FED, ECB, Eurostat, Bank of England, UK National Statistics, CBRT, TURKSTAT, BRSA, HDAT
(*) Total housing loans for 2010 comprises of housing credits extended by banks and consumer finance companies as well as Household liabilities to HDAT due to HDAT’s housing sales with long term maturity.
83.6
71.8
40.7
6.20.2
60.352.1
29.6
0
20
40
60
80
100
UK US Euro Zone Turkey*
2001 2010
128128128
MARKET INDICATORS
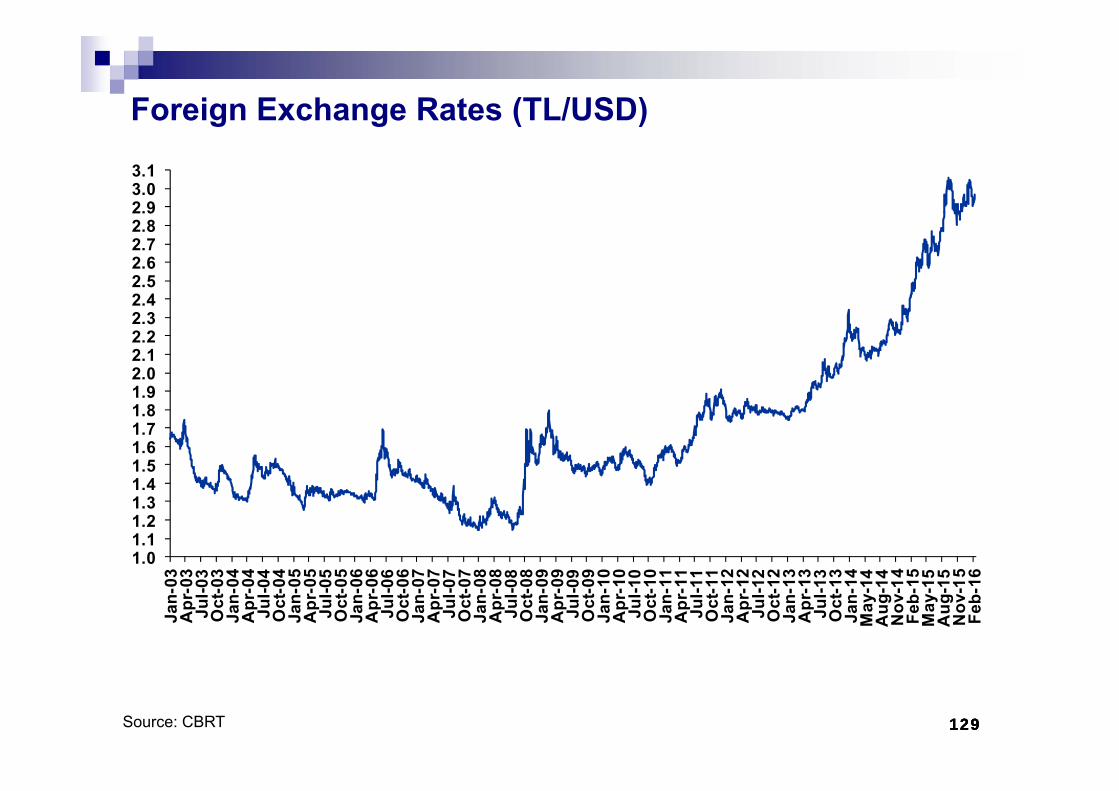
129129129
Foreign Exchange Rates (TL/USD)
Source: CBRT
1.01.11.21.31.41.51.61.71.81.92.02.12.22.32.42.52.62.72.82.93.03.1
Jan-
03A
pr-0
3Ju
l-03
Oct
-03
Jan-
04A
pr-0
4Ju
l-04
Oct
-04
Jan-
05A
pr-0
5Ju
l-05
Oct
-05
Jan-
06A
pr-0
6Ju
l-06
Oct
-06
Jan-
07A
pr-0
7Ju
l-07
Oct
-07
Jan-
08A
pr-0
8Ju
l-08
Oct
-08
Jan-
09A
pr-0
9Ju
l-09
Oct
-09
Jan-
10A
pr-1
0Ju
l-10
Oct
-10
Jan-
11A
pr-1
1Ju
l-11
Oct
-11
Jan-
12A
pr-1
2Ju
l-12
Oct
-12
Jan-
13A
pr-1
3Ju
l-13
Oct
-13
Jan-
14M
ay-1
4A
ug-1
4N
ov-1
4Fe
b-15
May
-15
Aug
-15
Nov
-15
Feb-
16
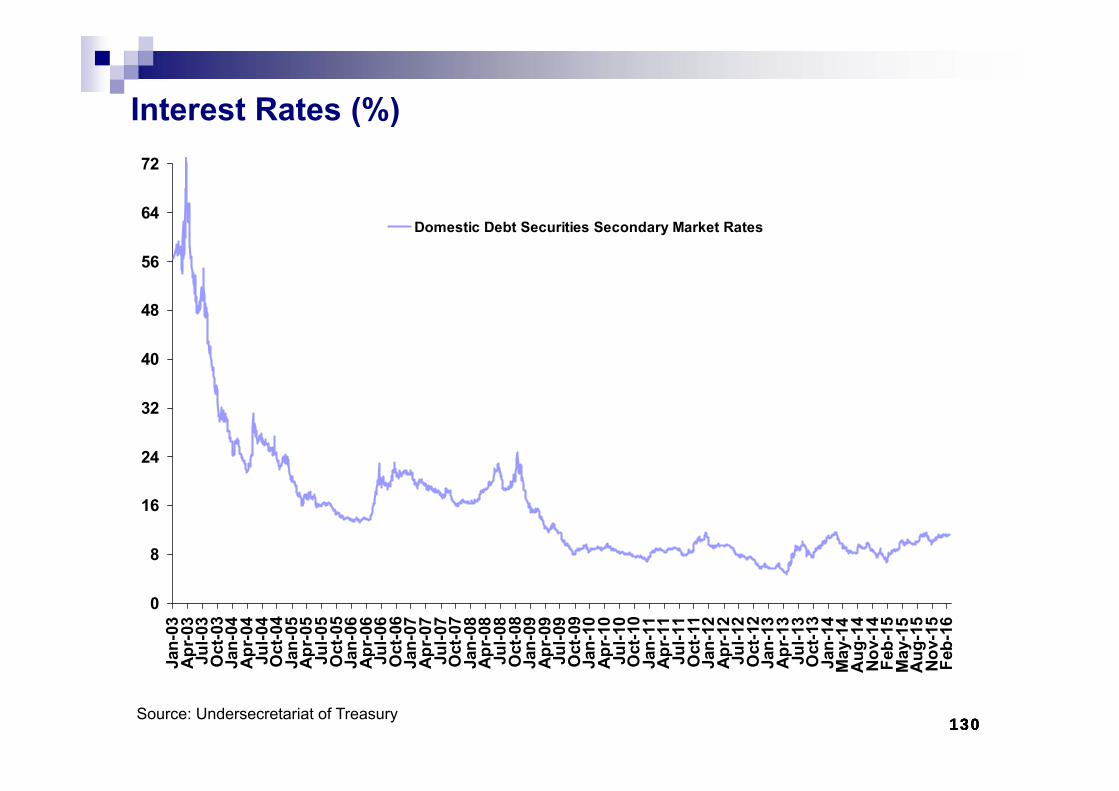
130130130
Interest Rates (%)
Source: Undersecretariat of Treasury
0
8
16
24
32
40
48
56
64
72Ja
n-03
Apr
-03
Jul-0
3O
ct-0
3Ja
n-04
Apr
-04
Jul-0
4O
ct-0
4Ja
n-05
Apr
-05
Jul-0
5O
ct-0
5Ja
n-06
Apr
-06
Jul-0
6O
ct-0
6Ja
n-07
Apr
-07
Jul-0
7O
ct-0
7Ja
n-08
Apr
-08
Jul-0
8O
ct-0
8Ja
n-09
Apr
-09
Jul-0
9O
ct-0
9Ja
n-10
Apr
-10
Jul-1
0O
ct-1
0Ja
n-11
Apr
-11
Jul-1
1O
ct-1
1Ja
n-12
Apr
-12
Jul-1
2O
ct-1
2Ja
n-13
Apr
-13
Jul-1
3O
ct-1
3Ja
n-14
May
-14
Aug
-14
Nov
-14
Feb-
15M
ay-1
5A
ug-1
5N
ov-1
5Fe
b-16
Domestic Debt Securities Secondary Market Rates
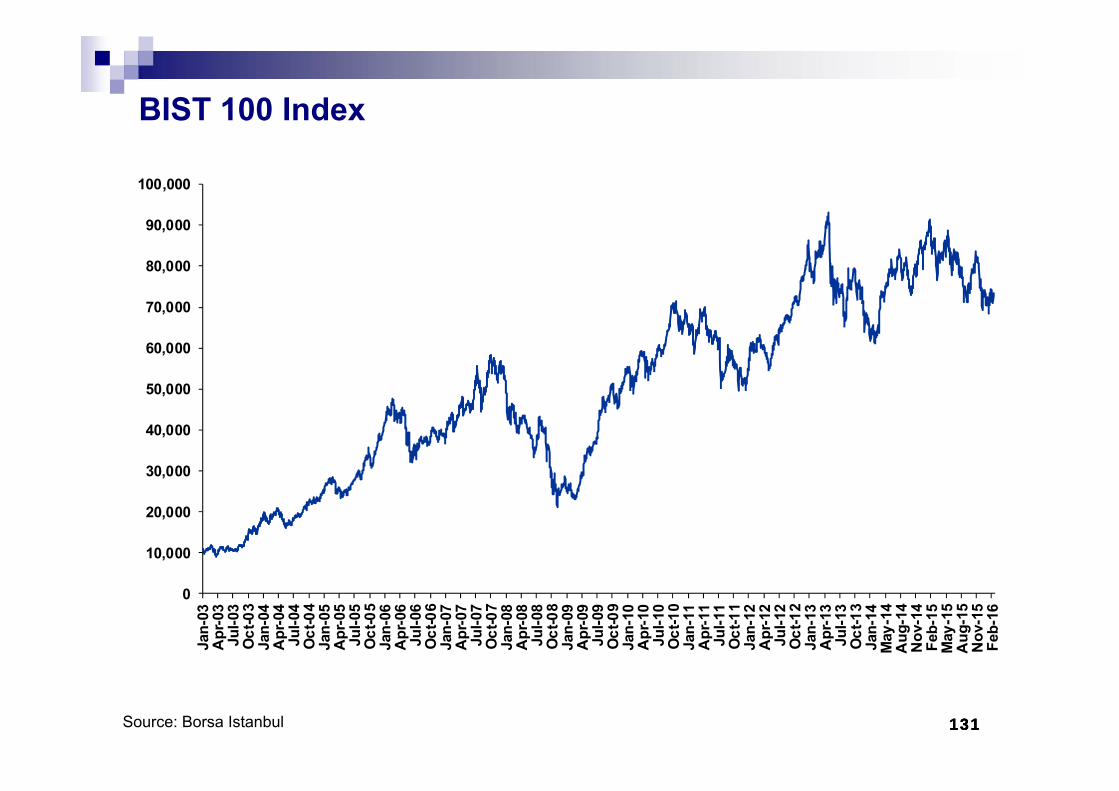
131131131
BIST 100 Index
0
10,000
20,000
30,000
40,000
50,000
60,000
70,000
80,000
90,000
100,000Ja
n-03
Apr
-03
Jul-0
3O
ct-0
3Ja
n-04
Apr
-04
Jul-0
4O
ct-0
4Ja
n-05
Apr
-05
Jul-0
5O
ct-0
5Ja
n-06
Apr
-06
Jul-0
6O
ct-0
6Ja
n-07
Apr
-07
Jul-0
7O
ct-0
7Ja
n-08
Apr
-08
Jul-0
8O
ct-0
8Ja
n-09
Apr
-09
Jul-0
9O
ct-0
9Ja
n-10
Apr
-10
Jul-1
0O
ct-1
0Ja
n-11
Apr
-11
Jul-1
1O
ct-1
1Ja
n-12
Apr
-12
Jul-1
2O
ct-1
2Ja
n-13
Apr
-13
Jul-1
3O
ct-1
3Ja
n-14
May
-14
Aug
-14
Nov
-14
Feb-
15M
ay-1
5A
ug-1
5N
ov-1
5Fe
b-16
Source: Borsa Istanbul
132132132
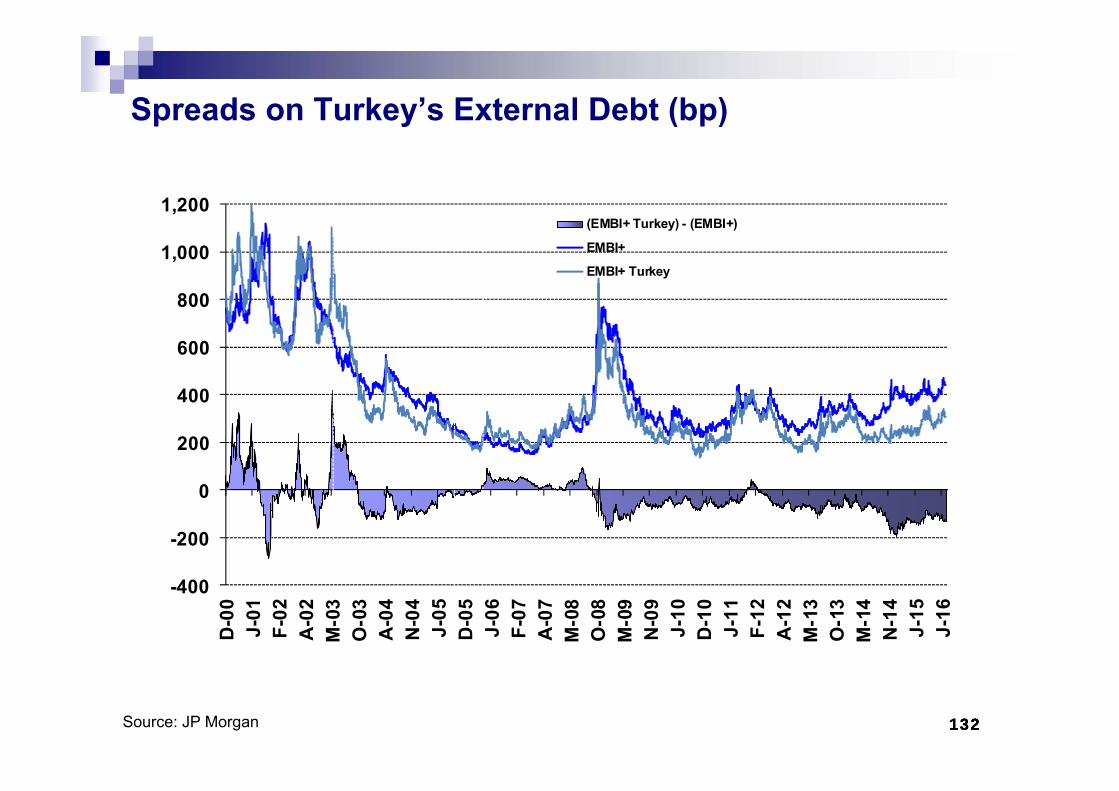
Spreads on Turkey’s External Debt (bp)
Source: JP Morgan
-400
-200
0
200
400
600
800
1,000
1,200D
-00
J-01
F-02
A-0
2M
-03
O-0
3A
-04
N-0
4J-
05D
-05
J-06
F-07
A-0
7M
-08
O-0
8M
-09
N-0
9J-
10D
-10
J-11
F-12
A-1
2M
-13
O-1
3M
-14
N-1
4J-
15J-
16
(EMBI+ Turkey) - (EMBI+)
EMBI+
EMBI+ Turkey
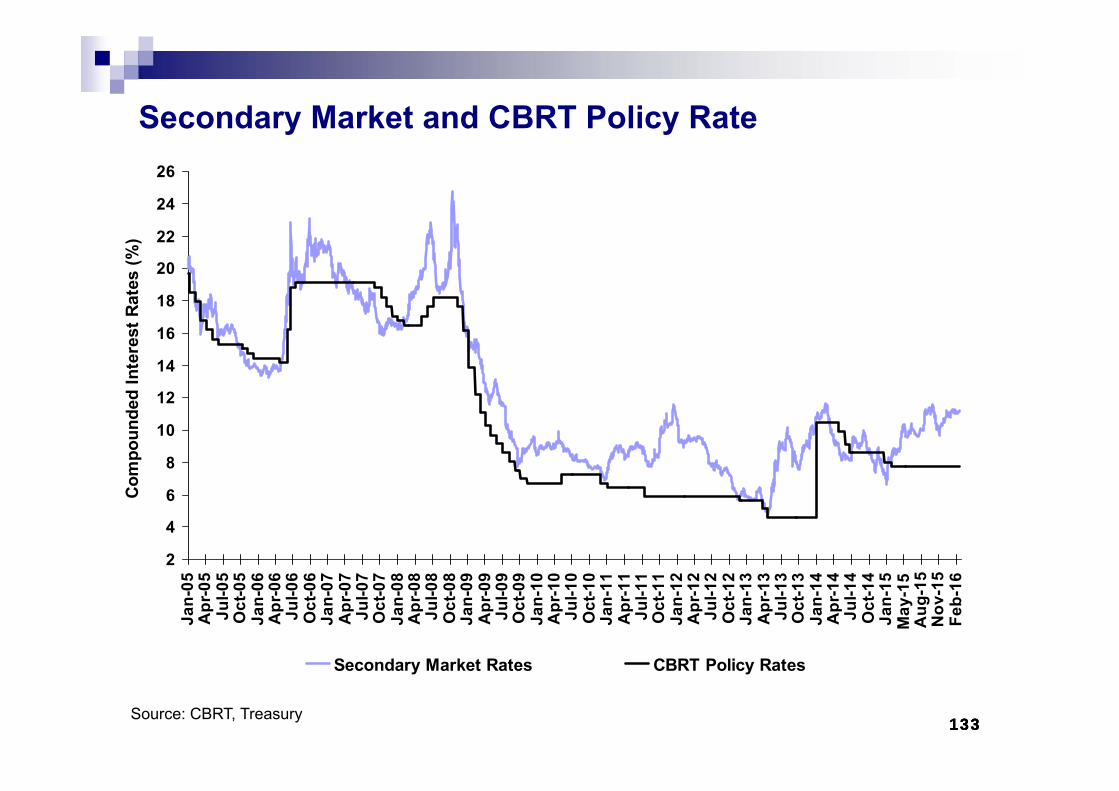
133133133
Secondary Market and CBRT Policy Rate
Source: CBRT, Treasury
2
4
6
8
10
12
14
16
18
20
22
24
26Ja
n-05
Apr
-05
Jul-0
5O
ct-0
5Ja
n-06
Apr
-06
Jul-0
6O
ct-0
6Ja
n-07
Apr
-07
Jul-0
7O
ct-0
7Ja
n-08
Apr
-08
Jul-0
8O
ct-0
8Ja
n-09
Apr
-09
Jul-0
9O
ct-0
9Ja
n-10
Apr
-10
Jul-1
0O
ct-1
0Ja
n-11
Apr
-11
Jul-1
1O
ct-1
1Ja
n-12
Apr
-12
Jul-1
2O
ct-1
2Ja
n-13
Apr
-13
Jul-1
3O
ct-1
3Ja
n-14
Apr
-14
Jul-1
4O
ct-1
4Ja
n-15
May
-15
Aug
-15
Nov
-15
Feb-
16
Com
poun
ded
Inte
rest
Rat
es (%
)
Secondary Market Rates CBRT Policy Rates
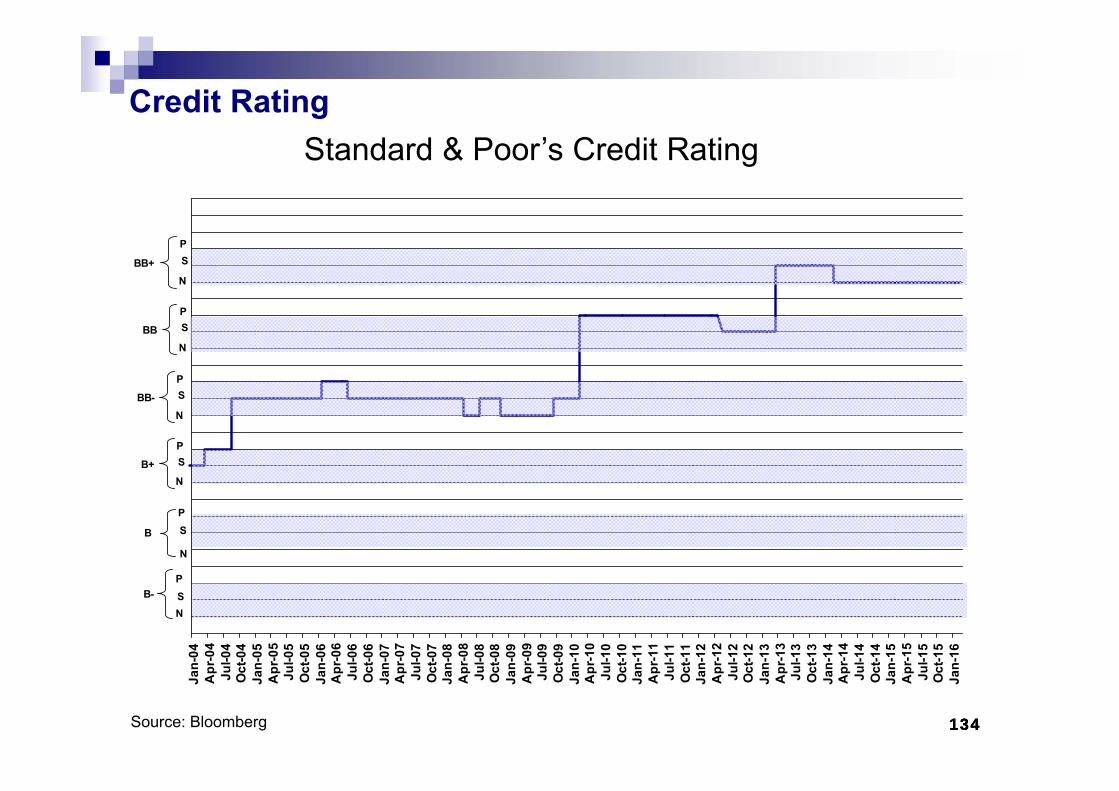
134134134
Credit RatingStandard & Poor’s Credit Rating
Source: Bloomberg
Jan-
04A
pr-0
4Ju
l-04
Oct
-04
Jan-
05A
pr-0
5Ju
l-05
Oct
-05
Jan-
06A
pr-0
6Ju
l-06
Oct
-06
Jan-
07A
pr-0
7Ju
l-07
Oct
-07
Jan-
08A
pr-0
8Ju
l-08
Oct
-08
Jan-
09A
pr-0
9Ju
l-09
Oct
-09
Jan-
10A
pr-1
0Ju
l-10
Oct
-10
Jan-
11A
pr-1
1Ju
l-11
Oct
-11
Jan-
12A
pr-1
2Ju
l-12
Oct
-12
Jan-
13A
pr-1
3Ju
l-13
Oct
-13
Jan-
14A
pr-1
4Ju
l-14
Oct
-14
Jan-
15A
pr-1
5Ju
l-15
Oct
-15
Jan-
16
N
SP
BB-
N
SP
B
NSP
B-
N
SP
BB
N
SP
BB+
N
SP
B+
135135135
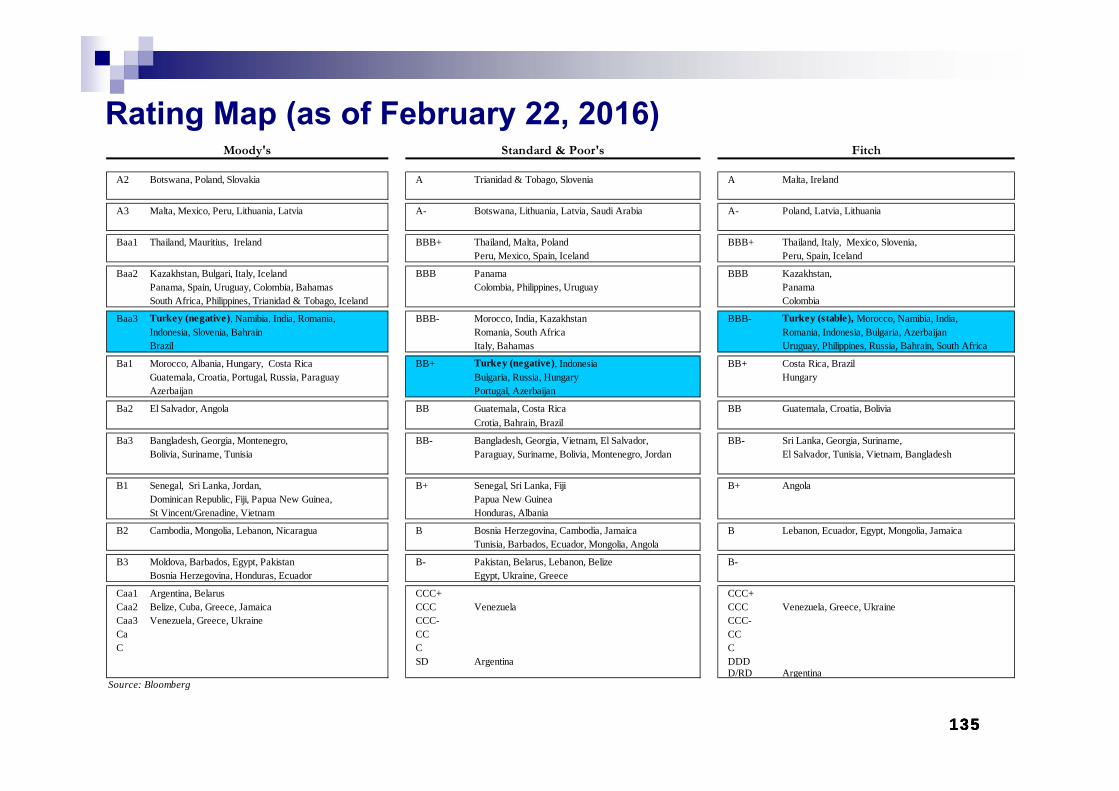
Rating Map (as of February 22, 2016)
A2 Botswana, Poland, Slovakia A Trianidad & Tobago, Slovenia A Malta, Ireland
A3 Malta, Mexico, Peru, Lithuania, Latvia A- Botswana, Lithuania, Latvia, Saudi Arabia A- Poland, Latvia, Lithuania
Baa1 Thailand, Mauritius, Ireland BBB+ Thailand, Malta, Poland BBB+ Thailand, Italy, Mexico, Slovenia,Peru, Mexico, Spain, Iceland Peru, Spain, Iceland
Baa2 Kazakhstan, Bulgari, Italy, Iceland BBB Panama BBB Kazakhstan, Panama, Spain, Uruguay, Colombia, Bahamas Colombia, Philippines, Uruguay PanamaSouth Africa, Philippines, Trianidad & Tobago, Iceland Colombia
Baa3 Turkey (negative), Namibia, India, Romania, BBB- Morocco, India, Kazakhstan BBB- Turkey (stable), Morocco, Namibia, India, Indonesia, Slovenia, Bahrain Romania, South Africa Romania, Indonesia, Bulgaria, AzerbaijanBrazil Italy, Bahamas Uruguay, Philippines, Russia, Bahrain, South Africa
Ba1 Morocco, Albania, Hungary, Costa Rica BB+ Turkey (negative), Indonesia BB+ Costa Rica, BrazilGuatemala, Croatia, Portugal, Russia, Paraguay Bulgaria, Russia, Hungary HungaryAzerbaijan Portugal, Azerbaijan
Ba2 El Salvador, Angola BB Guatemala, Costa Rica BB Guatemala, Croatia, BoliviaCrotia, Bahrain, Brazil
Ba3 Bangladesh, Georgia, Montenegro, BB- Bangladesh, Georgia, Vietnam, El Salvador, BB- Sri Lanka, Georgia, Suriname,Bolivia, Suriname, Tunisia Paraguay, Suriname, Bolivia, Montenegro, Jordan El Salvador, Tunisia, Vietnam, Bangladesh
B1 Senegal, Sri Lanka, Jordan, B+ Senegal, Sri Lanka, Fiji B+ AngolaDominican Republic, Fiji, Papua New Guinea, Papua New GuineaSt Vincent/Grenadine, Vietnam Honduras, Albania
B2 Cambodia, Mongolia, Lebanon, Nicaragua B Bosnia Herzegovina, Cambodia, Jamaica B Lebanon, Ecuador, Egypt, Mongolia, JamaicaTunisia, Barbados, Ecuador, Mongolia, Angola
B3 Moldova, Barbados, Egypt, Pakistan B- Pakistan, Belarus, Lebanon, Belize B-Bosnia Herzegovina, Honduras, Ecuador Egypt, Ukraine, Greece
Caa1 Argentina, Belarus CCC+ CCC+Caa2 Belize, Cuba, Greece, Jamaica CCC Venezuela CCC Venezuela, Greece, UkraineCaa3 Venezuela, Greece, Ukraine CCC- CCC-Ca CC CCC C C
SD Argentina DDDD/RD Argentina
Source: Bloomberg
Moody's Standard & Poor's Fitch
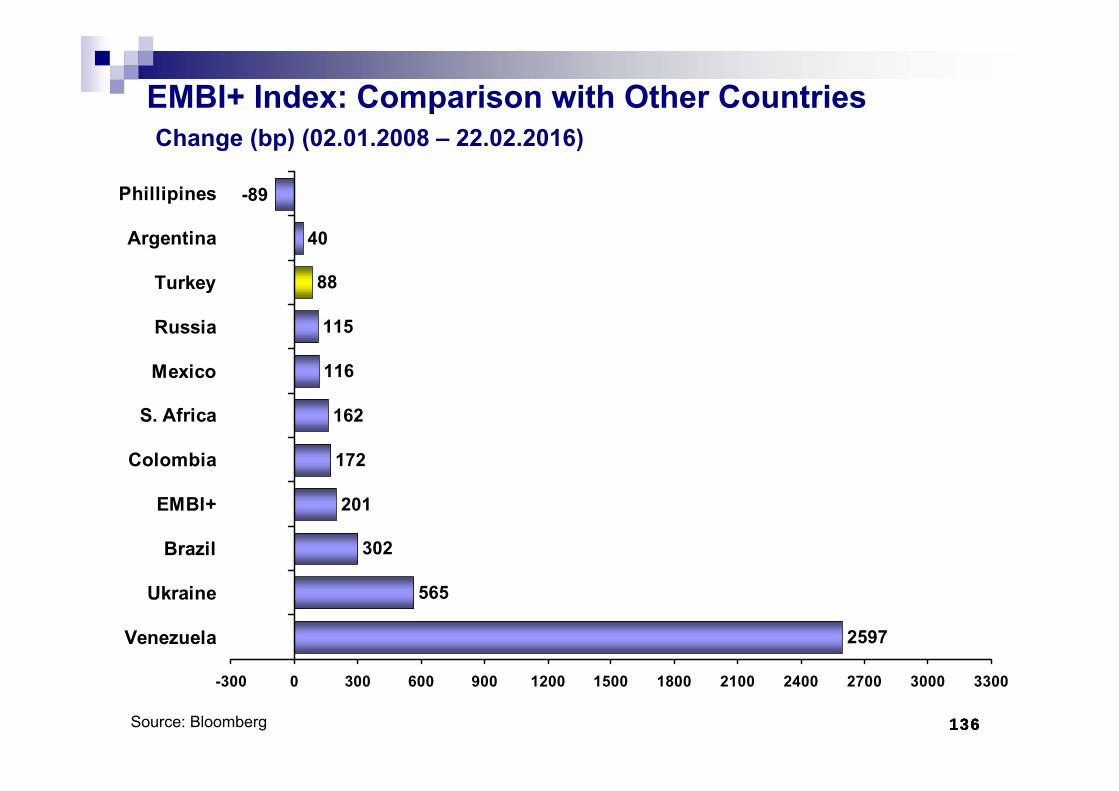
136136136
EMBI+ Index: Comparison with Other CountriesChange (bp) (02.01.2008 – 22.02.2016)
Source: Bloomberg
2597
565
302
201
172
162
116
115
88
40
-89
-300 0 300 600 900 1200 1500 1800 2100 2400 2700 3000 3300
Venezuela
Ukraine
Brazil
EMBI+
Colombia
S. Africa
Mexico
Russia
Turkey
Argentina
Phillipines
137137137
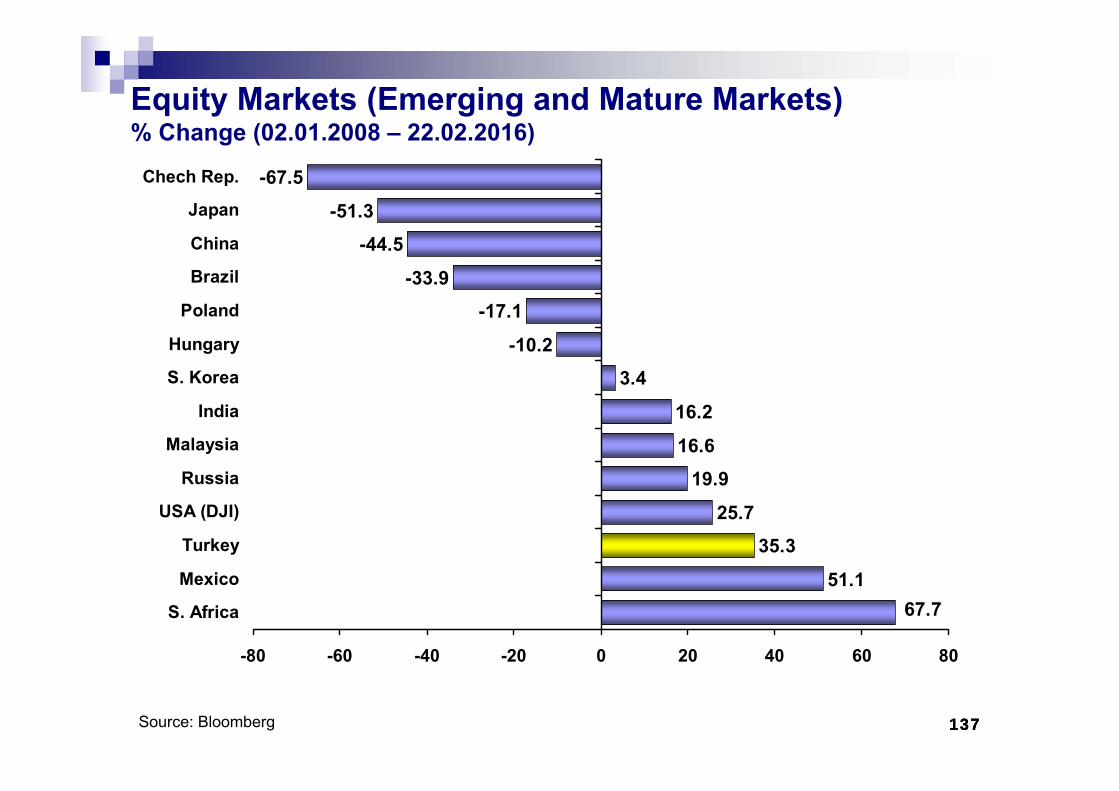
Equity Markets (Emerging and Mature Markets)% Change (02.01.2008 – 22.02.2016)
Source: Bloomberg
51.1
35.325.7
19.916.6
16.2
3.4-10.2
-17.1-33.9
-44.5
-51.3
-67.5
67.7
-80 -60 -40 -20 0 20 40 60 80
S. Africa
Mexico
Turkey
USA (DJI)
Russia
Malaysia
India
S. Korea
Hungary
Poland
Brazil
China
Japan
Chech Rep.
138138138
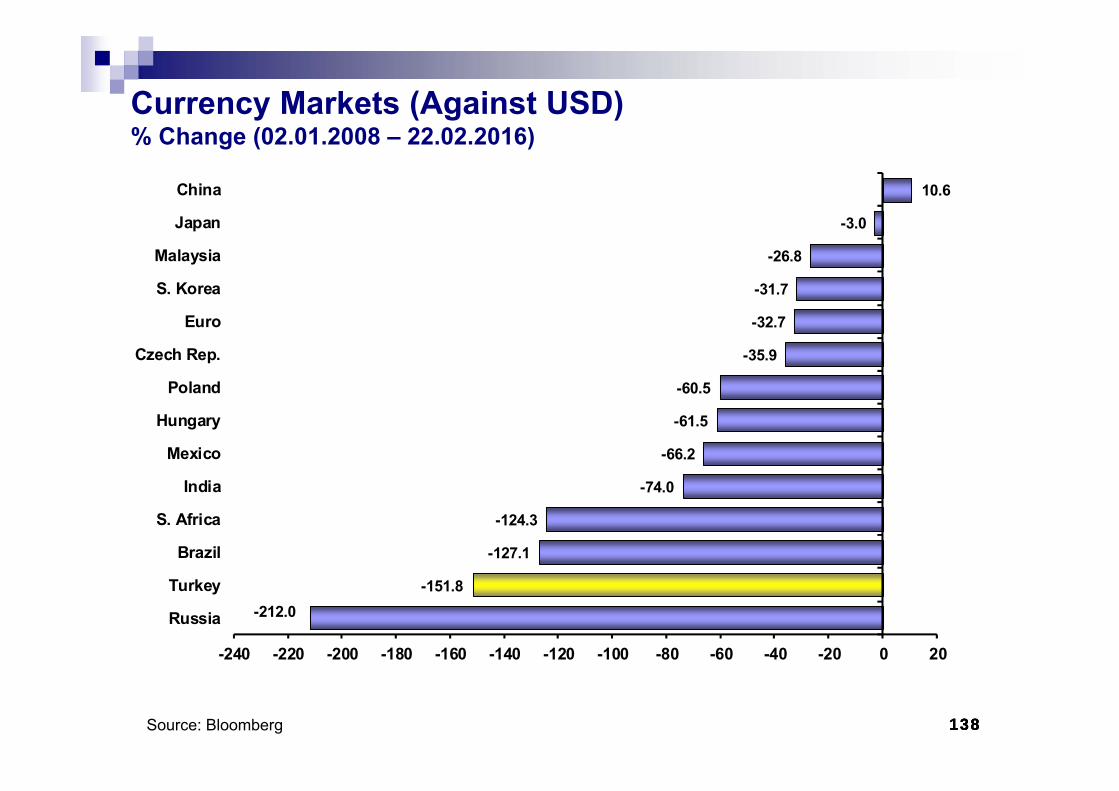
Currency Markets (Against USD)% Change (02.01.2008 – 22.02.2016)
Source: Bloomberg
-212.0-151.8
-127.1
-124.3
-74.0
-66.2
-61.5
-60.5
-35.9
-32.7
-31.7
-26.8
-3.0
10.6
-240 -220 -200 -180 -160 -140 -120 -100 -80 -60 -40 -20 0 20
Russia
Turkey
Brazil
S. Africa
India
Mexico
Hungary
Poland
Czech Rep.
Euro
S. Korea
Malaysia
Japan
China

139139139
INVESTMENT ENVIRONMENT
140140140
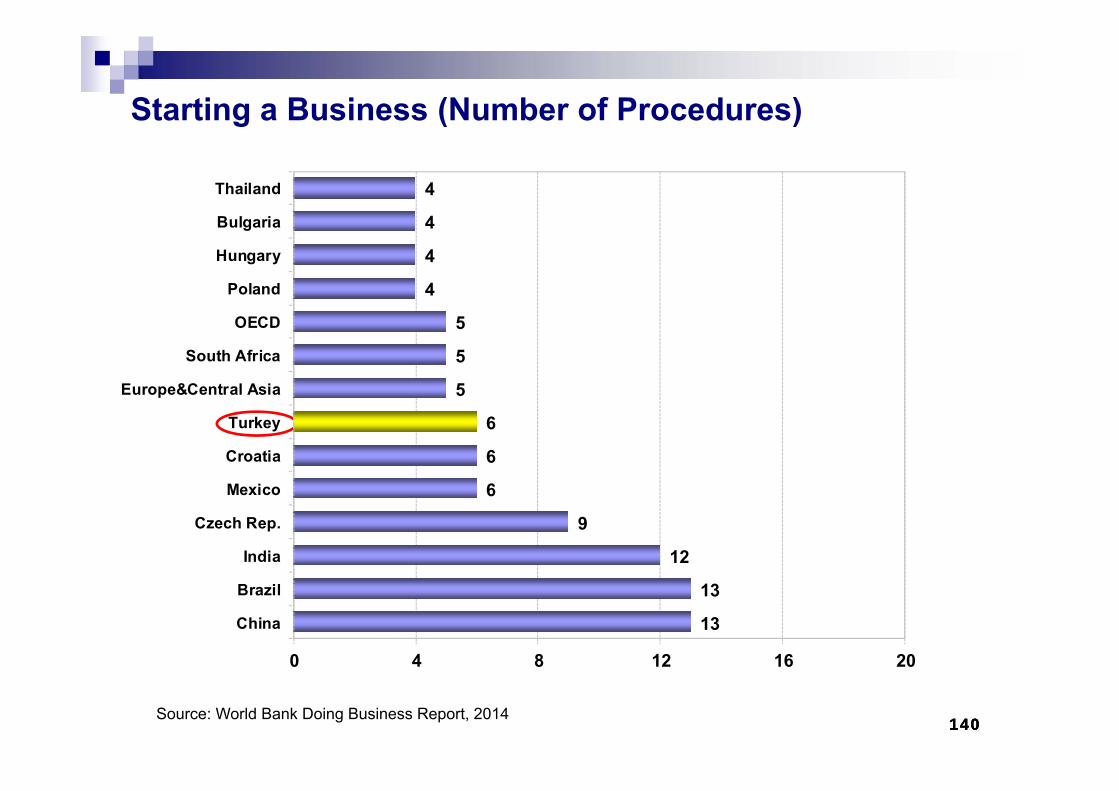
Starting a Business (Number of Procedures)
Source: World Bank Doing Business Report, 2014
13
13
12
9
6
6
6
5
5
5
4
4
4
4
0 4 8 12 16 20
China
Brazil
India
Czech Rep.
Mexico
Croatia
Turkey
Europe&Central Asia
South Africa
OECD
Poland
Hungary
Bulgaria
Thailand
141141141
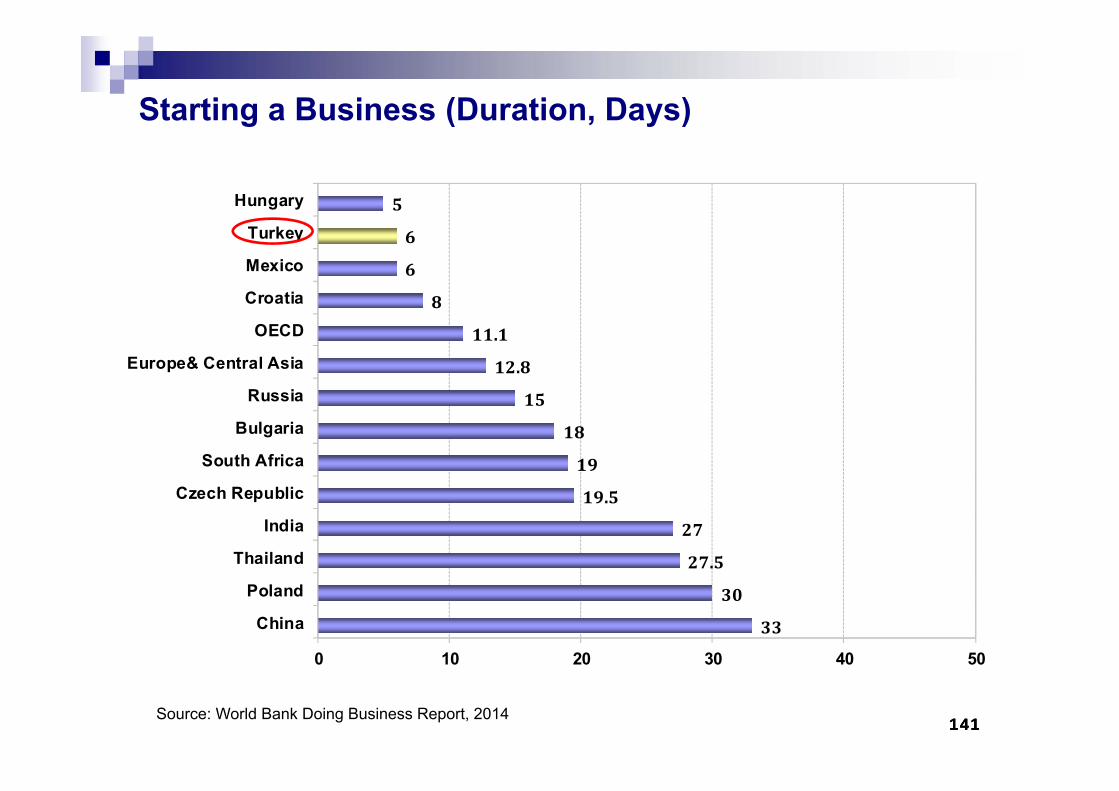
Starting a Business (Duration, Days)
33
30
27.5
27
19.5
19
18
15
12.8
11.1
8
6
6
5
0 10 20 30 40 50
China
Poland
Thailand
India
Czech Republic
South Africa
Bulgaria
Russia
Europe& Central Asia
OECD
Croatia
Mexico
Turkey
Hungary
Source: World Bank Doing Business Report, 2014
142142142
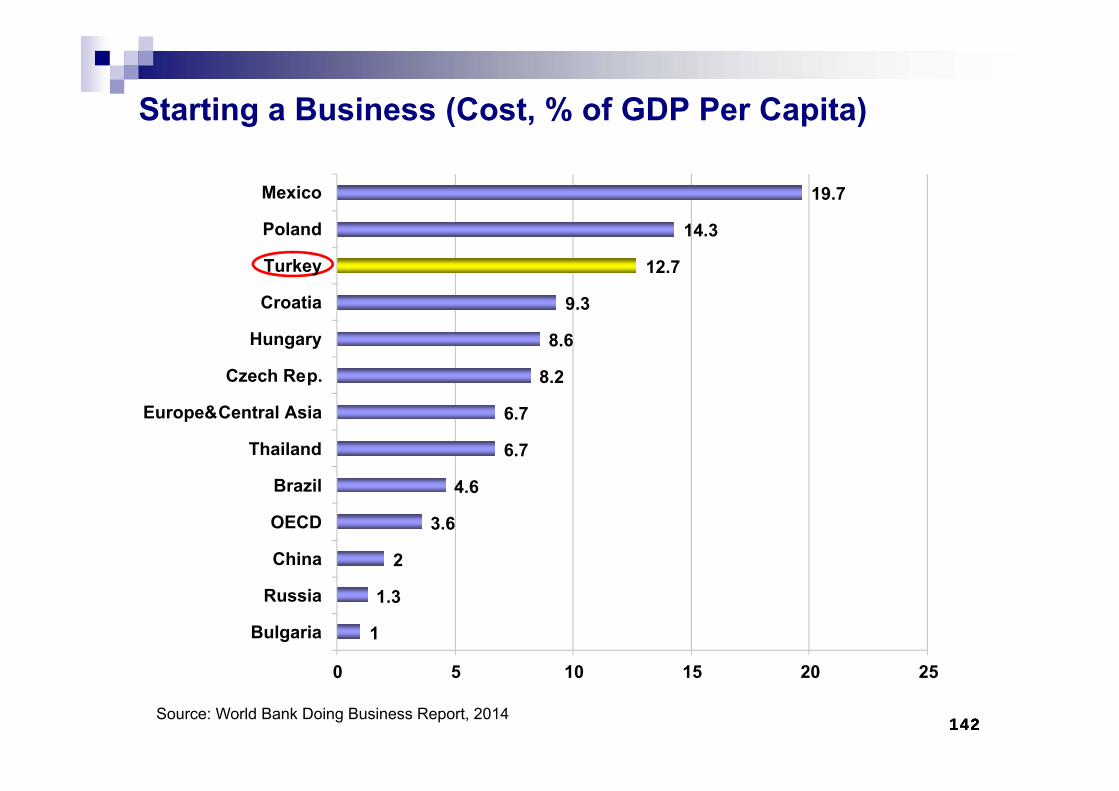
Starting a Business (Cost, % of GDP Per Capita)
Source: World Bank Doing Business Report, 2014
1
1.3
2
3.6
4.6
6.7
6.7
8.2
8.6
9.3
12.7
14.3
19.7
0 5 10 15 20 25
Bulgaria
Russia
China
OECD
Brazil
Thailand
Europe&Central Asia
Czech Rep.
Hungary
Croatia
Turkey
Poland
Mexico
143143143
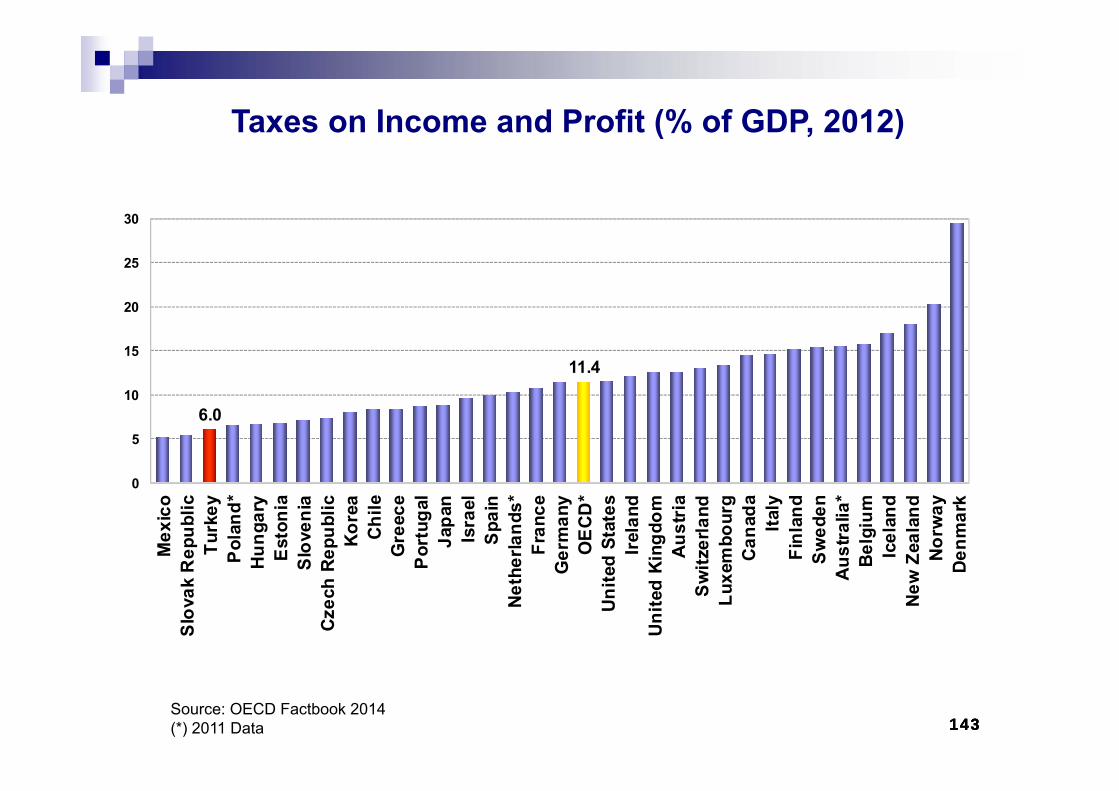
Taxes on Income and Profit (% of GDP, 2012)
Source: OECD Factbook 2014(*) 2011 Data
6.0
11.4
0
5
10
15
20
25
30
Mex
ico
Slo
vak
Rep
ublic
Turk
eyP
olan
d*H
unga
ryE
ston
iaS
love
nia
Cze
ch R
epub
licK
orea
Chi
leG
reec
eP
ortu
gal
Japa
nIs
rael
Spa
inN
ethe
rland
s*Fr
ance
Ger
man
yO
EC
D*
Uni
ted
Stat
esIr
elan
dU
nite
d K
ingd
omA
ustr
iaS
witz
erla
ndLu
xem
bour
gC
anad
aIta
lyFi
nlan
dS
wed
enA
ustr
alia
*B
elgi
umIc
elan
dN
ew Z
eala
ndN
orw
ayD
enm
ark
144144144
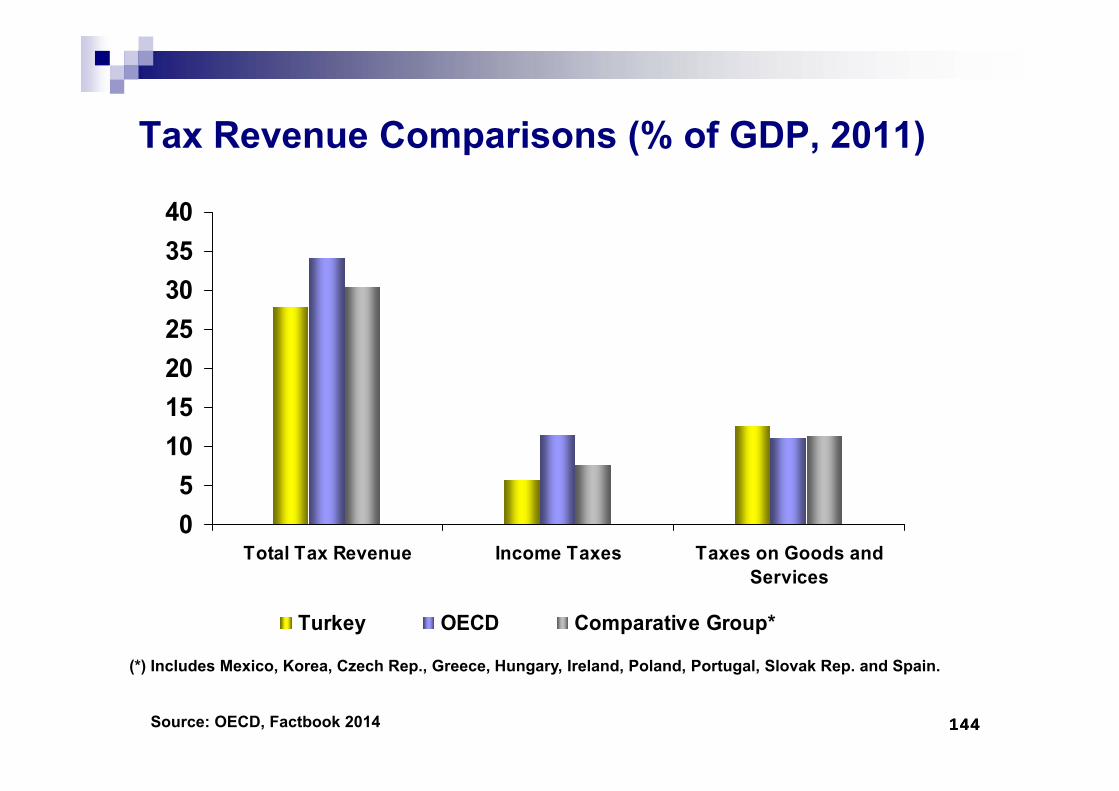
Tax Revenue Comparisons (% of GDP, 2011)
(*) Includes Mexico, Korea, Czech Rep., Greece, Hungary, Ireland, Poland, Portugal, Slovak Rep. and Spain.
Source: OECD, Factbook 2014
05
10152025303540
Total Tax Revenue Income Taxes Taxes on Goods andServices
Turkey OECD Comparative Group*
145145145
RELATIONS with the IMF and EU
146146146
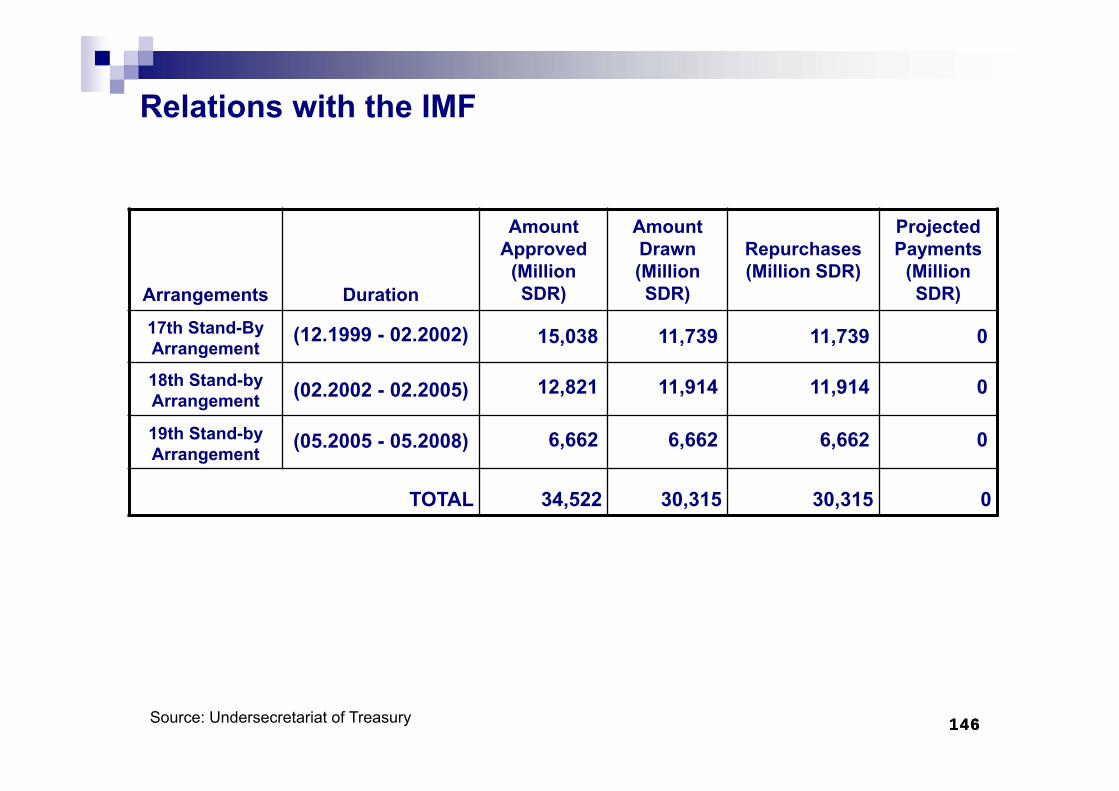
Relations with the IMF
Arrangements Duration
Amount Approved
(Million SDR)
Amount Drawn(Million SDR)
Repurchases(Million SDR)
Projected Payments
(Million SDR)
17th Stand-By Arrangement
(12.1999 - 02.2002) 15,038 11,739 11,739 0
18th Stand-by Arrangement (02.2002 - 02.2005) 12,821 11,914 11,914 0
19th Stand-by Arrangement
(05.2005 - 05.2008) 6,662 6,662 6,662 0
TOTAL 34,522 30,315 30,315 0
Source: Undersecretariat of Treasury
147147147
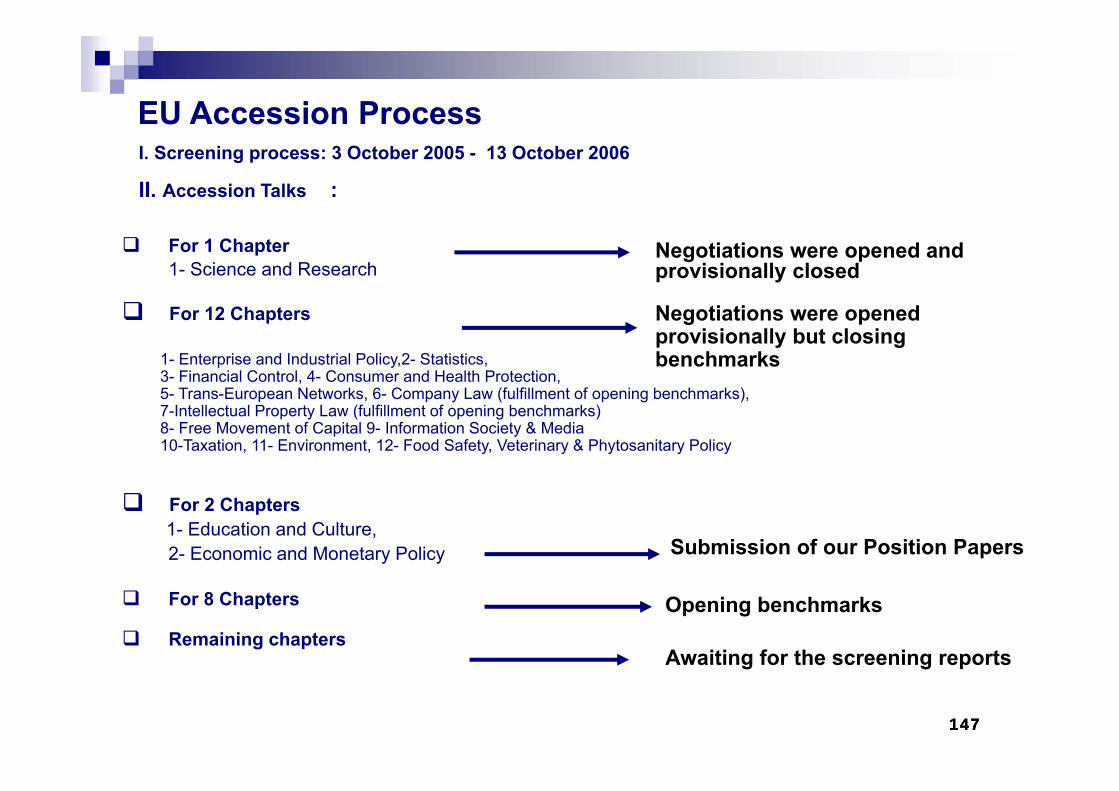
For 1 Chapter1- Science and Research
For 12 Chapters
For 2 Chapters1- Education and Culture,2- Economic and Monetary Policy
For 8 Chapters
Remaining chapters
EU Accession Process
Negotiations were opened and provisionally closed
Negotiations were opened provisionally but closingbenchmarks
Submission of our Position Papers
Opening benchmarks
Awaiting for the screening reports
I. Screening process: 3 October 2005 - 13 October 2006
II. Accession Talks :
1- Enterprise and Industrial Policy,2- Statistics, 3- Financial Control, 4- Consumer and Health Protection, 5- Trans-European Networks, 6- Company Law (fulfillment of opening benchmarks), 7-Intellectual Property Law (fulfillment of opening benchmarks) 8- Free Movement of Capital 9- Information Society & Media 10-Taxation, 11- Environment, 12- Food Safety, Veterinary & Phytosanitary Policy

148148148
SOCIAL SECURITY
149149149
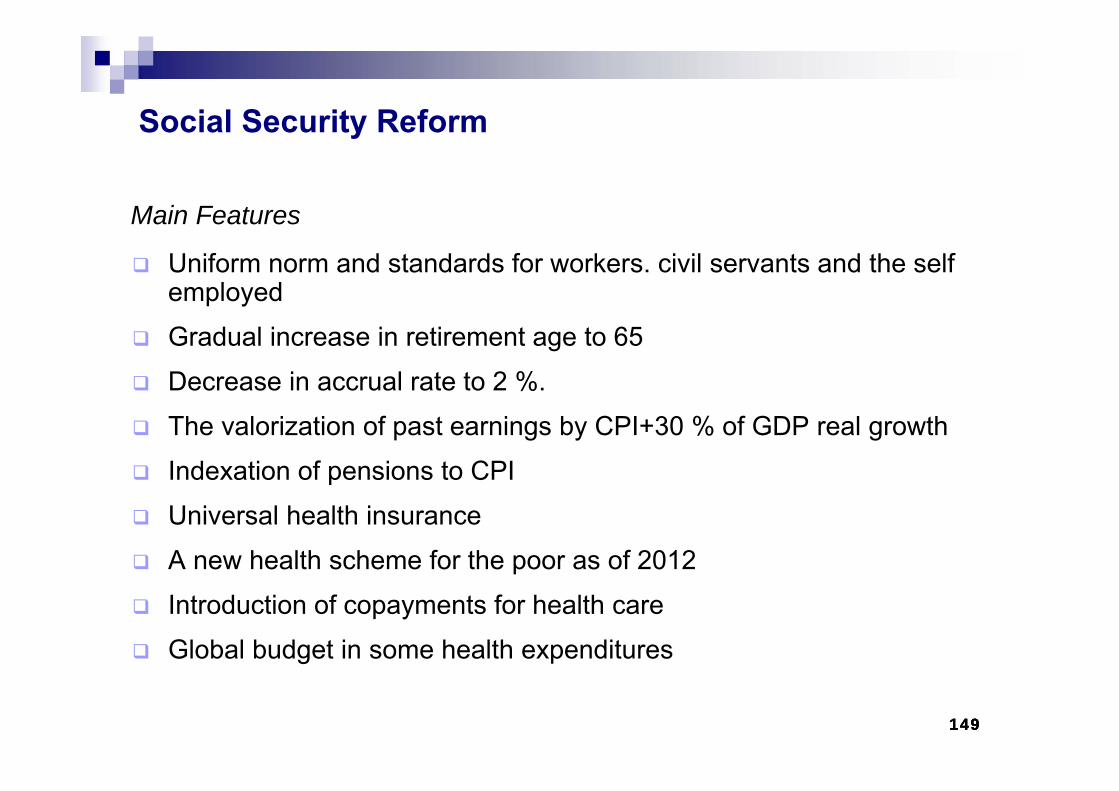
Social Security Reform
Uniform norm and standards for workers. civil servants and the self employed
Gradual increase in retirement age to 65
Decrease in accrual rate to 2 %.
The valorization of past earnings by CPI+30 % of GDP real growth
Indexation of pensions to CPI
Universal health insurance
A new health scheme for the poor as of 2012
Introduction of copayments for health care
Global budget in some health expenditures
Main Features
150150150
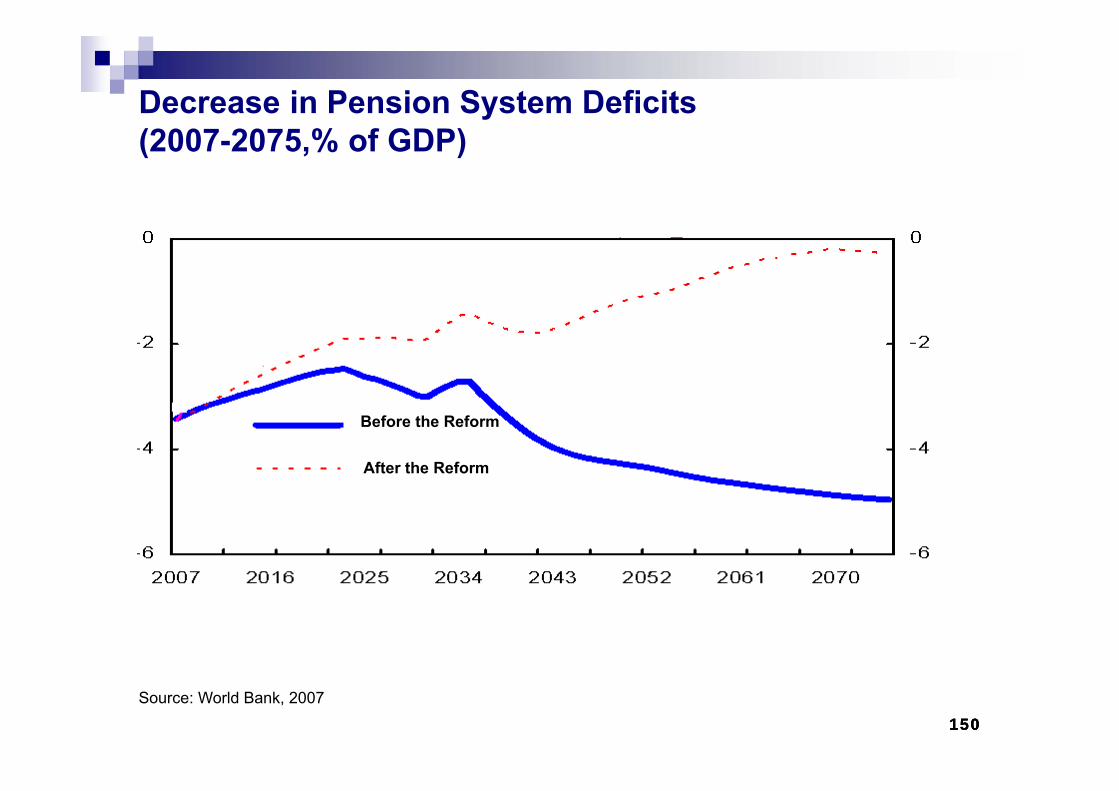
Decrease in Pension System Deficits (2007-2075,% of GDP)
Source: World Bank, 2007
Before the Reform
After the Reform
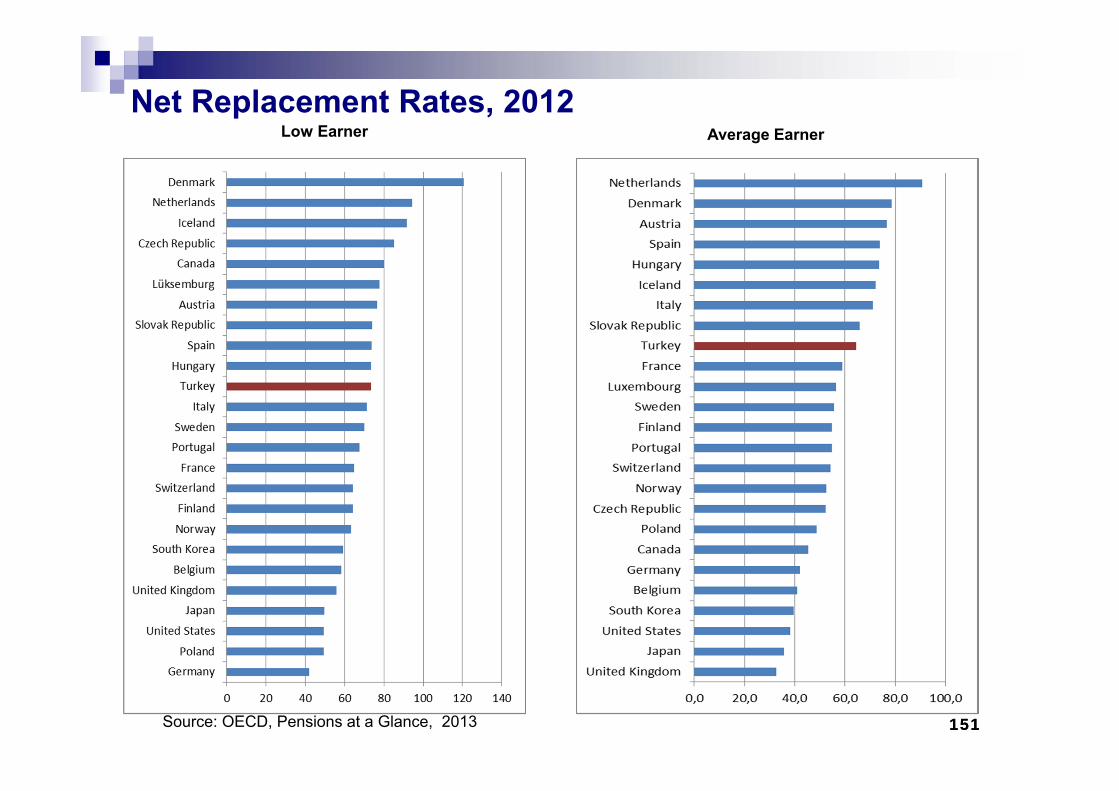
151151
Net Replacement Rates, 2012
Source: OECD, Pensions at a Glance, 2013
Low Earner Average Earner
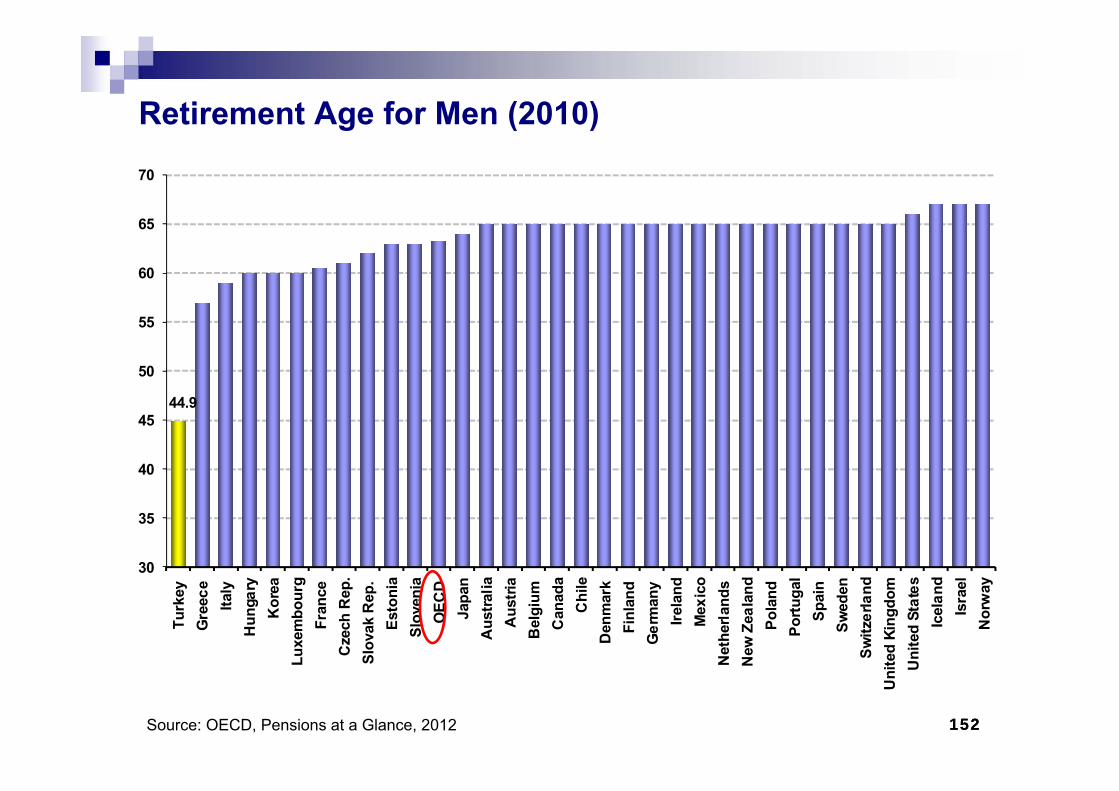
152152
Retirement Age for Men (2010)
44.9
30
35
40
45
50
55
60
65
70Tu
rkey
Gre
ece
Italy
Hun
gary
Kor
eaLu
xem
bour
gFr
ance
Cze
ch R
ep.
Slov
ak R
ep.
Esto
nia
Slov
enia
OEC
DJa
pan
Aus
tralia
Aus
tria
Bel
gium
Can
ada
Chi
leD
enm
ark
Finl
and
Ger
man
yIre
land
Mex
ico
Net
herla
nds
New
Zea
land
Pola
ndPo
rtuga
lSp
ain
Swed
enSw
itzer
land
Uni
ted
King
dom
Uni
ted
Stat
esIc
elan
dIs
rael
Nor
way
Source: OECD, Pensions at a Glance, 2012
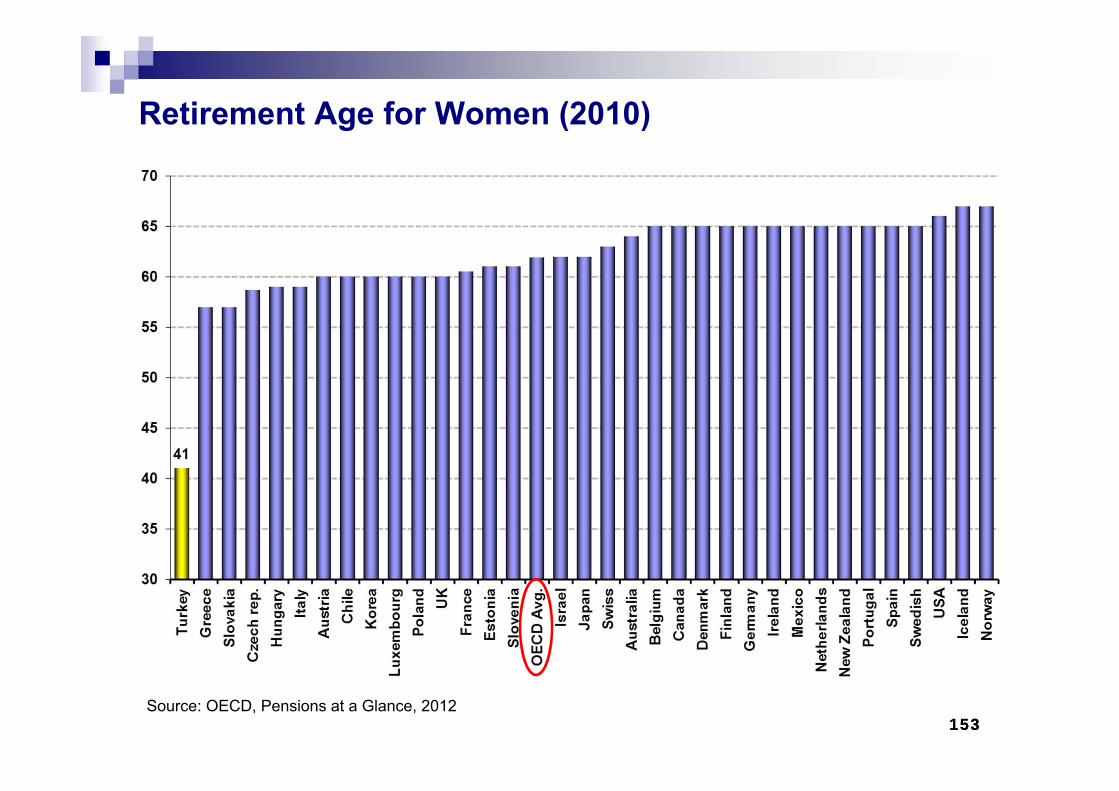
153153
Retirement Age for Women (2010)
Source: OECD, Pensions at a Glance, 2012
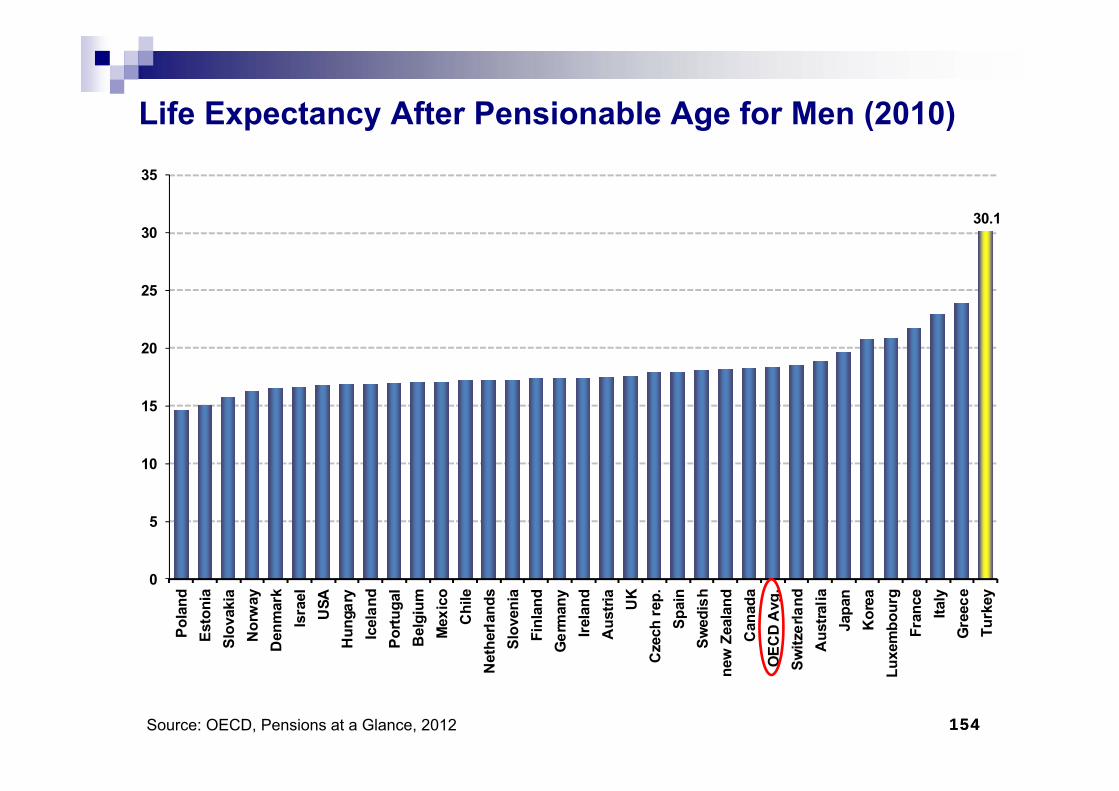
154154
Life Expectancy After Pensionable Age for Men (2010)
30.1
0
5
10
15
20
25
30
35Po
land
Esto
nia
Slov
akia
Nor
way
Den
mar
kIs
rael
USA
Hun
gary
Icel
and
Portu
gal
Bel
gium
Mex
ico
Chi
leN
ethe
rland
sSl
oven
iaFi
nlan
dG
erm
any
Irela
ndA
ustri
aU
KC
zech
rep.
Spai
nSw
edis
hne
w Z
eala
ndC
anad
aO
ECD
Avg
.Sw
itzer
land
Aus
tralia
Japa
nK
orea
Luxe
mbo
urg
Fran
ceIta
lyG
reec
eTu
rkey
Source: OECD, Pensions at a Glance, 2012
155155
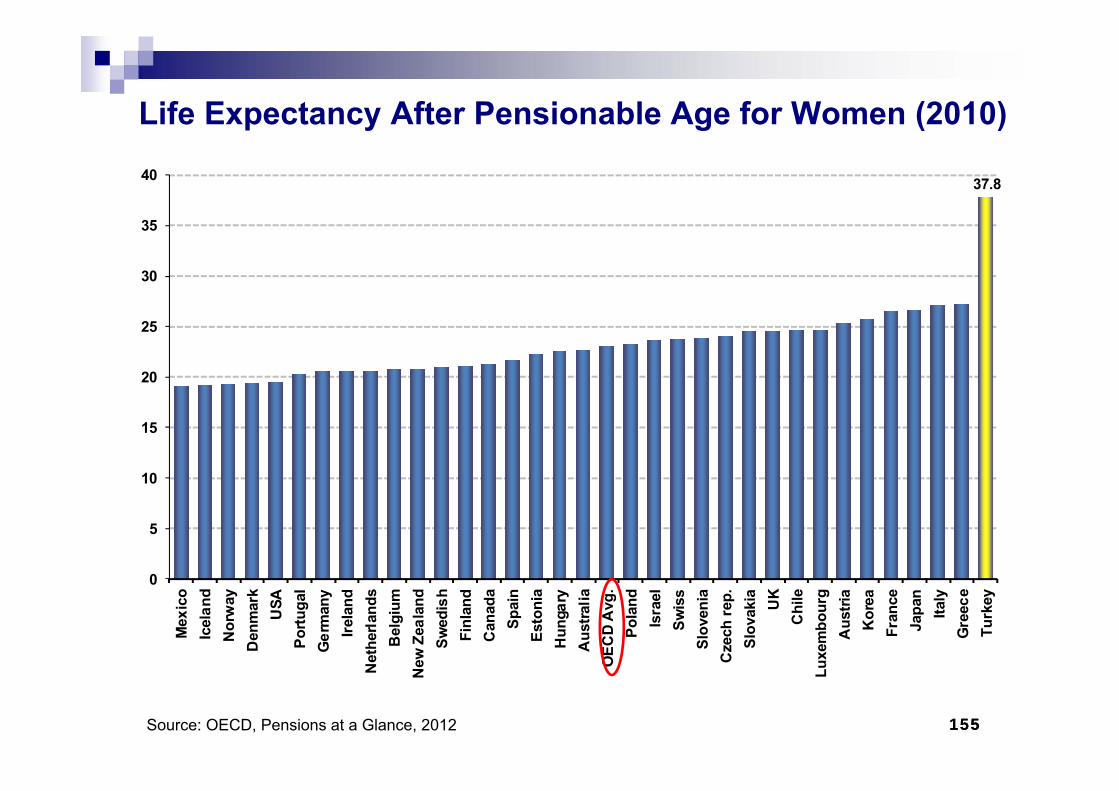
Life Expectancy After Pensionable Age for Women (2010)
37.8
0
5
10
15
20
25
30
35
40M
exic
oIc
elan
dN
orw
ayD
enm
ark
USA
Portu
gal
Ger
man
yIre
land
Net
herla
nds
Bel
gium
New
Zea
land
Swed
ish
Finl
and
Can
ada
Spai
nEs
toni
aH
unga
ryA
ustra
liaO
ECD
Avg
.Po
land
Isra
elSw
iss
Slov
enia
Cze
ch re
p.Sl
ovak
ia UK
Chi
leLu
xem
bour
gA
ustri
aK
orea
Fran
ceJa
pan
Italy
Gre
ece
Turk
ey
Source: OECD, Pensions at a Glance, 2012

156156156
LABOR MARKET
157157157
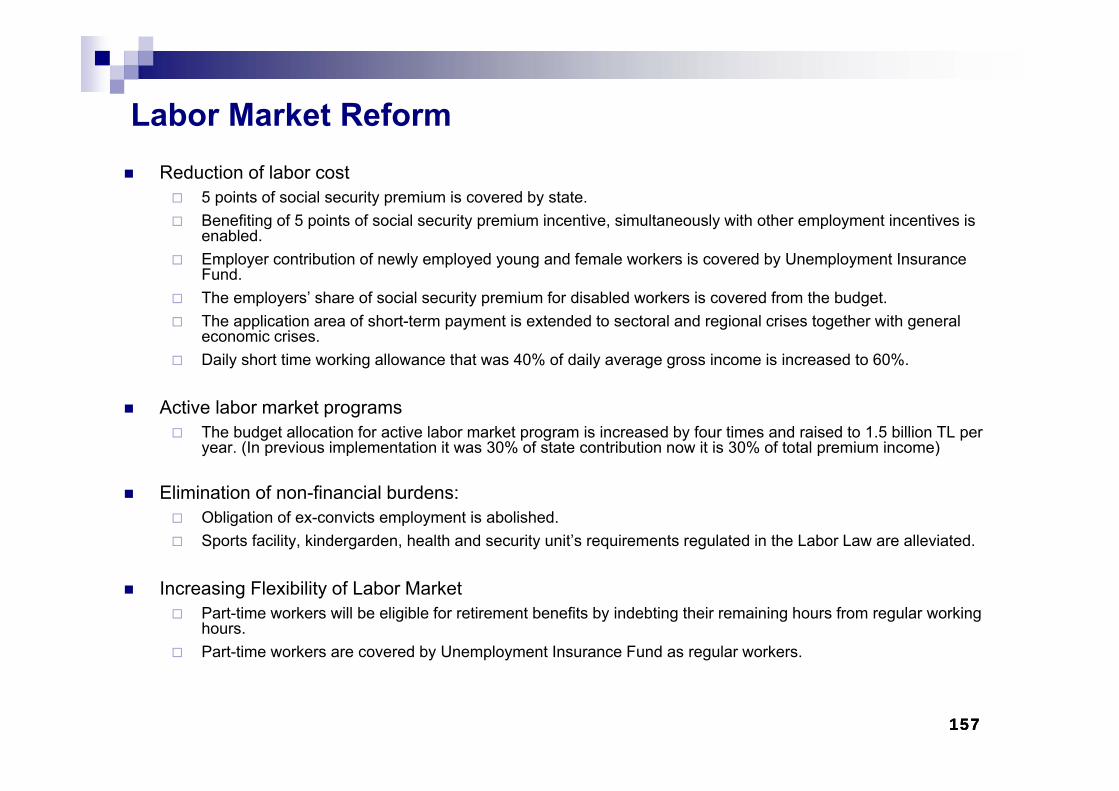
Labor Market ReformReduction of labor cost
5 points of social security premium is covered by state.Benefiting of 5 points of social security premium incentive, simultaneously with other employment incentives is enabled.Employer contribution of newly employed young and female workers is covered by Unemployment InsuranceFund.The employers’ share of social security premium for disabled workers is covered from the budget.The application area of short-term payment is extended to sectoral and regional crises together with general economic crises. Daily short time working allowance that was 40% of daily average gross income is increased to 60%.
Active labor market programsThe budget allocation for active labor market program is increased by four times and raised to 1.5 billion TL peryear. (In previous implementation it was 30% of state contribution now it is 30% of total premium income)
Elimination of non-financial burdens:Obligation of ex-convicts employment is abolished.Sports facility, kindergarden, health and security unit’s requirements regulated in the Labor Law are alleviated.
Increasing Flexibility of Labor MarketPart-time workers will be eligible for retirement benefits by indebting their remaining hours from regular working hours.Part-time workers are covered by Unemployment Insurance Fund as regular workers.
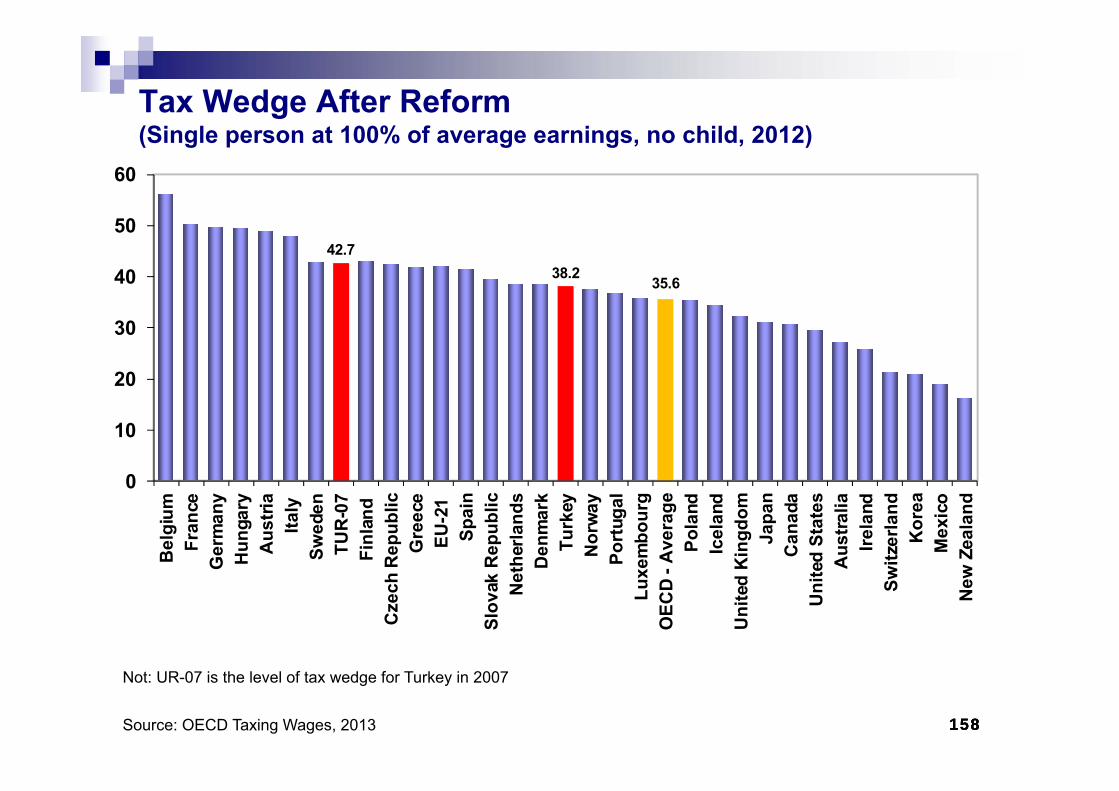
158158158Source: OECD Taxing Wages, 2013
Not: UR-07 is the level of tax wedge for Turkey in 2007
42.738.2 35.6
0
10
20
30
40
50
60B
elgi
umFr
ance
Ger
man
yH
unga
ryA
ustri
a It
aly
Swed
enTU
R-0
7 F
inla
ndC
zech
Rep
ublic
Gre
ece
EU
-21
Spai
nSl
ovak
Rep
ublic
Net
herla
nds
Den
mar
kTu
rkey
Nor
way
Port
ugal
Luxe
mbo
urg
OEC
D - A
vera
gePo
land
Icel
and
Uni
ted
Kin
gdom
Japa
nC
anad
aU
nite
d St
ates
Aus
tralia
Irela
ndSw
itzer
land
Kor
eaM
exic
oN
ew Z
eala
nd
Tax Wedge After Reform(Single person at 100% of average earnings, no child, 2012)
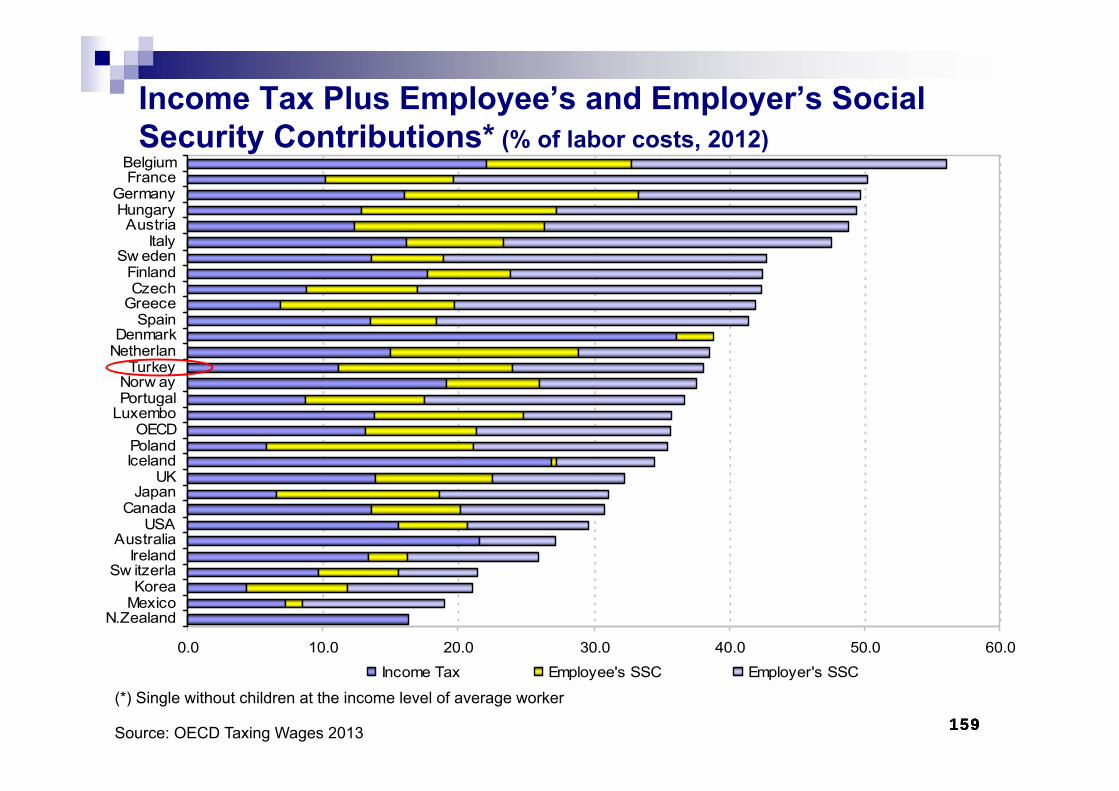
159159159(*) Single without children at the income level of average worker
Source: OECD Taxing Wages 2013
0.0 10.0 20.0 30.0 40.0 50.0 60.0
N.ZealandMexicoKorea
Sw itzerlaIreland
AustraliaUSA
CanadaJapan
UKIcelandPolandOECD
LuxemboPortugalNorw ayTurkey
NetherlanDenmark
SpainGreeceCzechFinland
Sw edenItaly
AustriaHungaryGermany
FranceBelgium
Income Tax Employee's SSC Employer's SSC
Income Tax Plus Employee’s and Employer’s Social Security Contributions* (% of labor costs, 2012)
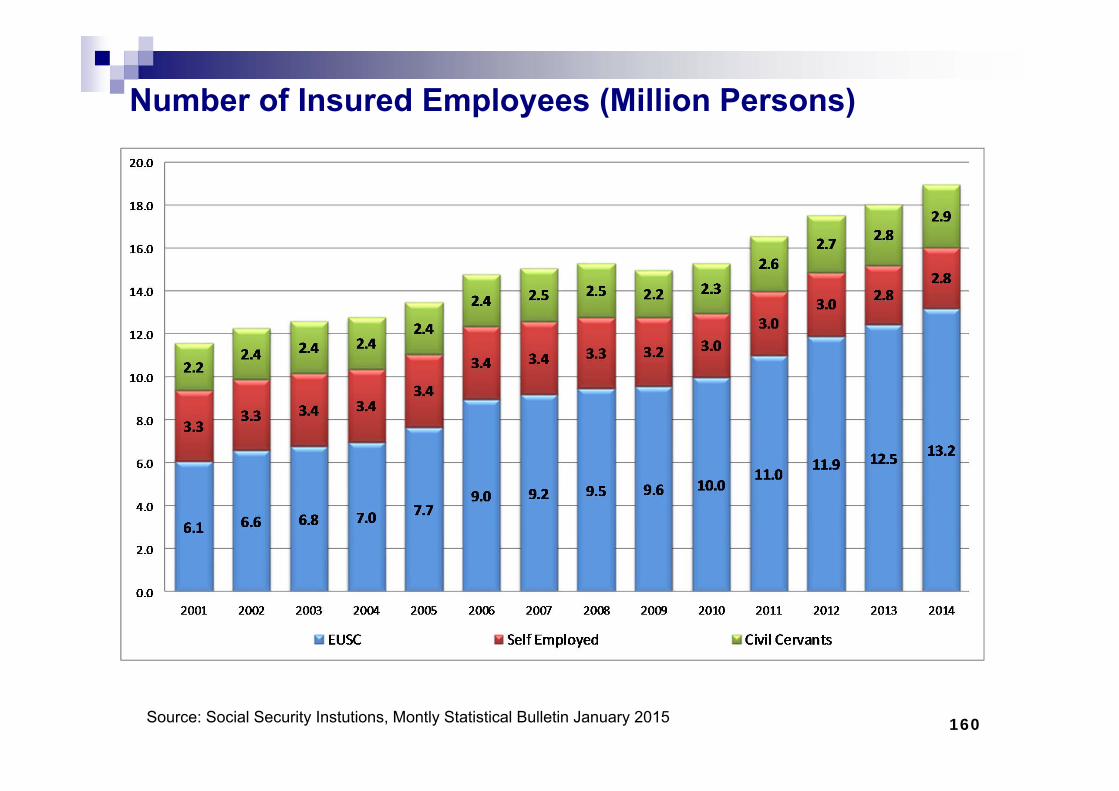
160
Number of Insured Employees (Million Persons)
Source: Social Security Instutions, Montly Statistical Bulletin January 2015
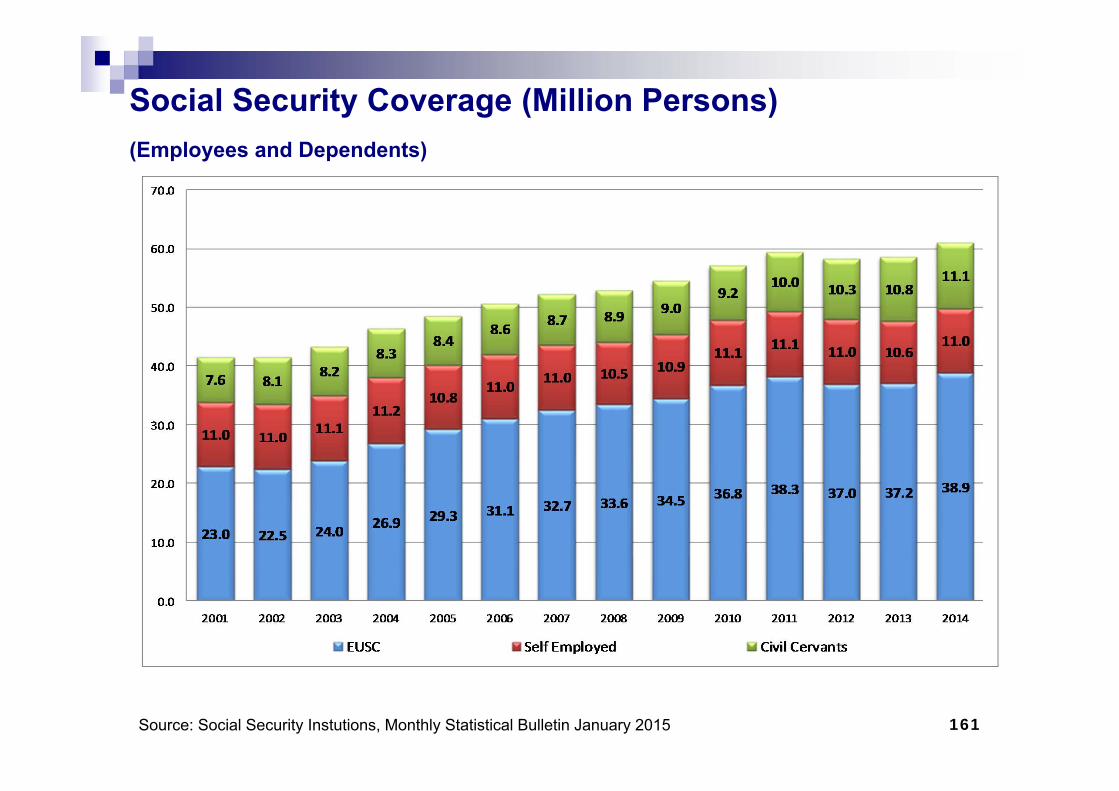
161
Social Security Coverage (Million Persons) (Employees and Dependents)
Source: Social Security Instutions, Monthly Statistical Bulletin January 2015
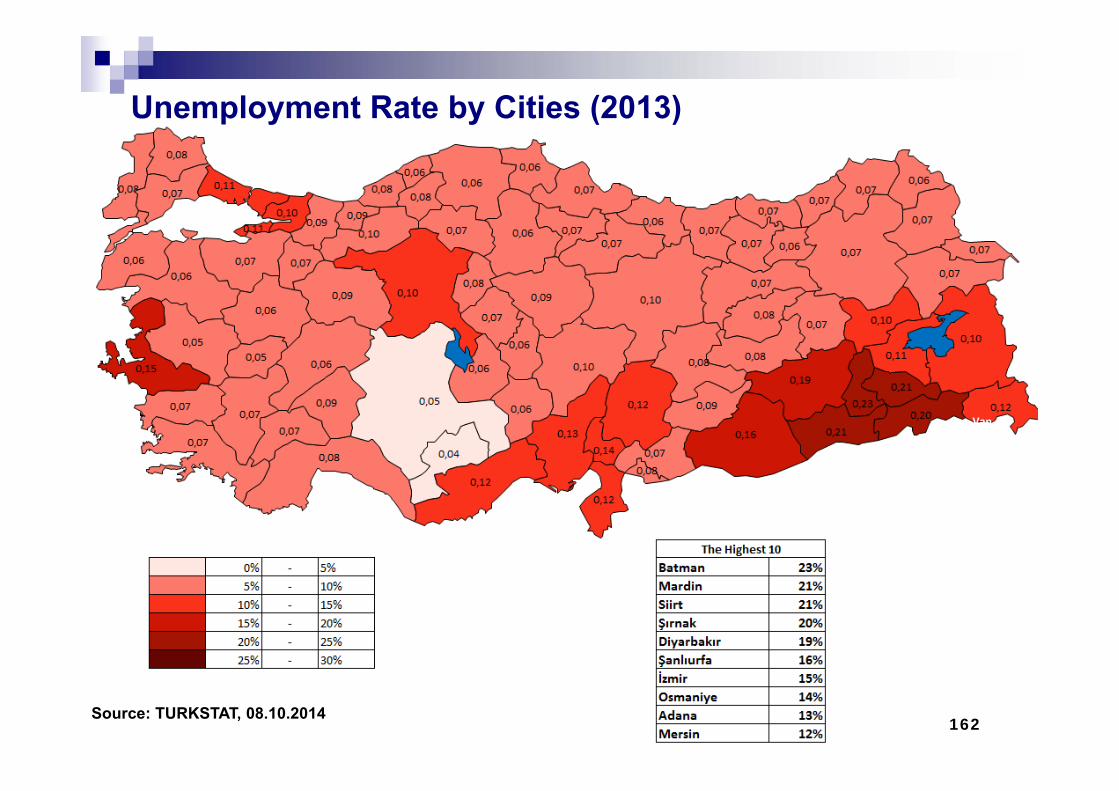
Unemployment Rate by Cities (2013)
Source: TURKSTAT, 08.10.2014
Van
162
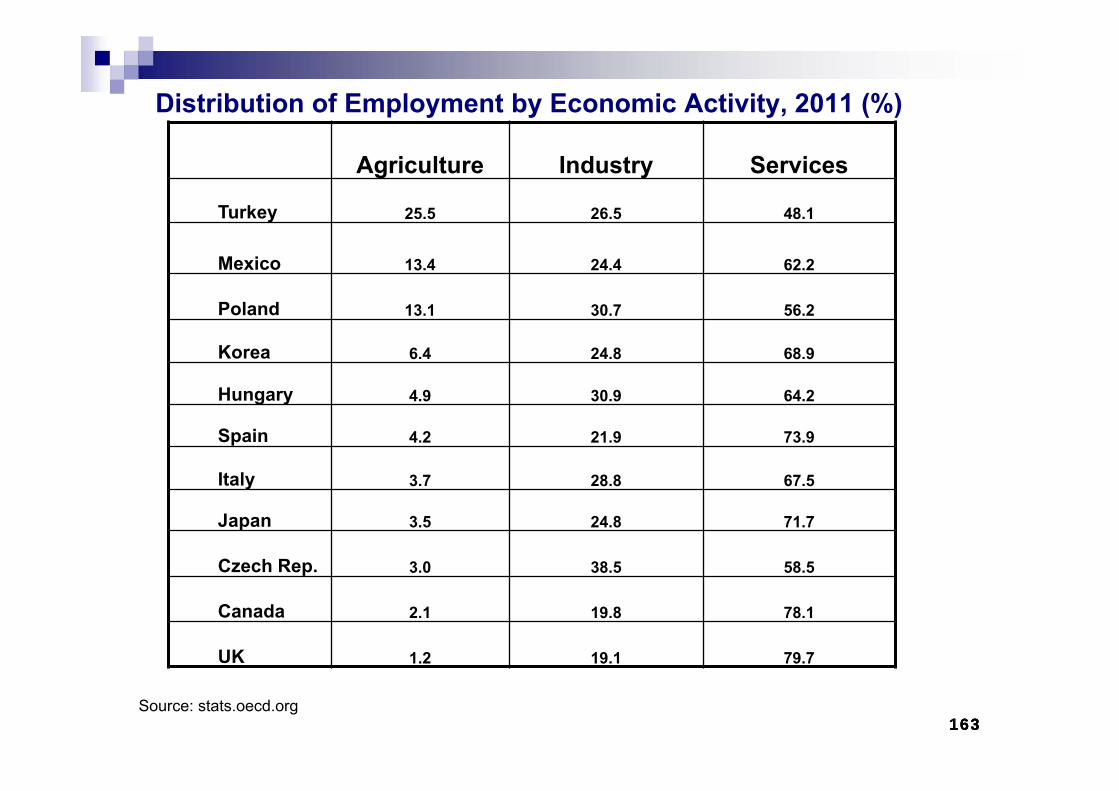
163163163Source: stats.oecd.org
Agriculture Industry Services
Turkey 25.5 26.5 48.1
Mexico 13.4 24.4 62.2
Poland 13.1 30.7 56.2
Korea 6.4 24.8 68.9
Hungary 4.9 30.9 64.2
Spain 4.2 21.9 73.9
Italy 3.7 28.8 67.5
Japan 3.5 24.8 71.7
Czech Rep. 3.0 38.5 58.5
Canada 2.1 19.8 78.1
UK 1.2 19.1 79.7
Distribution of Employment by Economic Activity, 2011 (%)
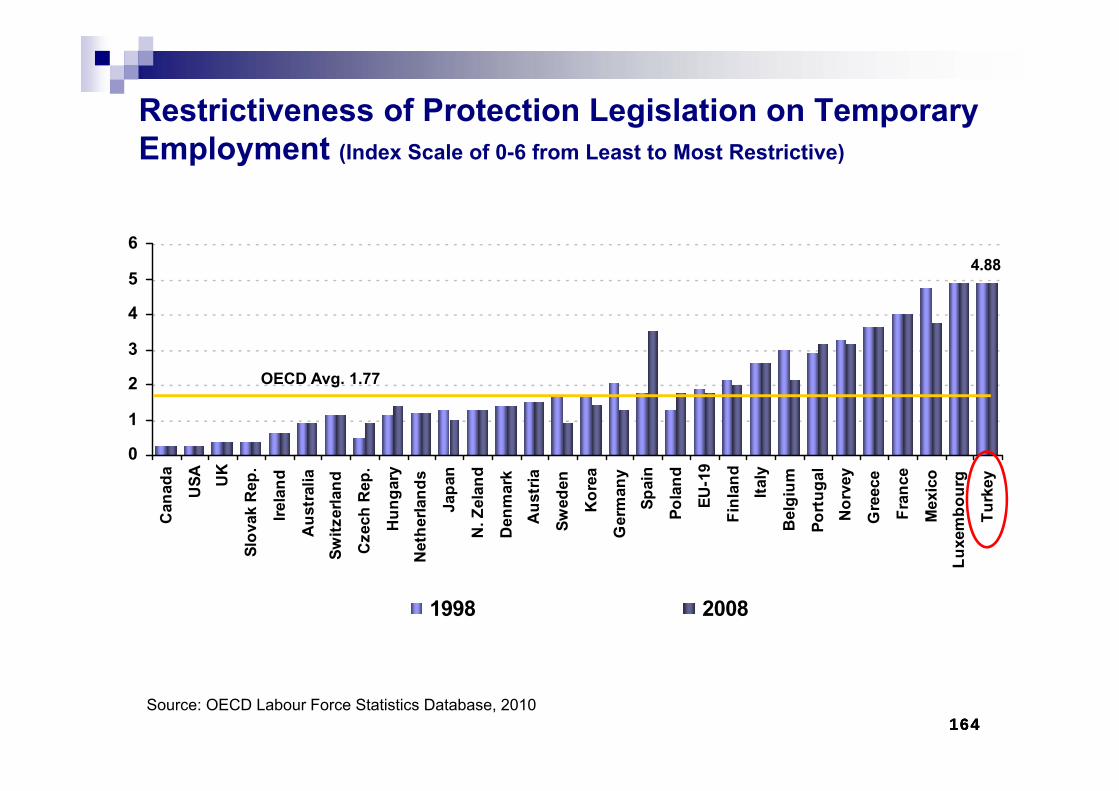
164164164
Restrictiveness of Protection Legislation on Temporary Employment (Index Scale of 0-6 from Least to Most Restrictive)
4.88
0
1
2
3
4
5
6
Can
ada
USA U
K
Slov
ak R
ep.
Irela
nd
Aus
tral
iaSw
itzer
land
Cze
ch R
ep.
Hun
gary
Net
herla
nds
Japa
n
N. Z
elan
d
Den
mar
kA
ustr
ia
Swed
en
Kor
ea
Ger
man
ySp
ain
Pola
nd
EU-1
9
Finl
and
Italy
Bel
gium
Port
ugal
Nor
vey
Gre
ece
Fran
ce
Mex
ico
Luxe
mbo
urg
Turk
ey
1998 2008
OECD Avg. 1.77
Source: OECD Labour Force Statistics Database, 2010
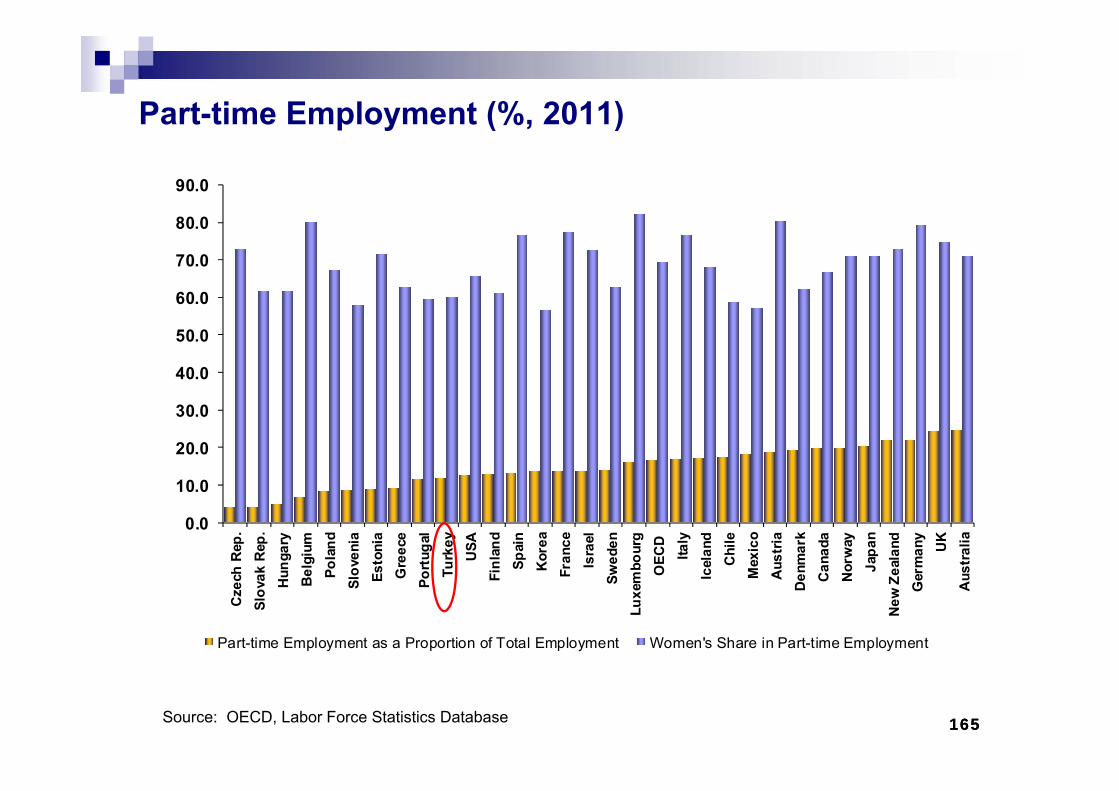
165165
Part-time Employment (%, 2011)
0.0
10.0
20.0
30.0
40.0
50.0
60.0
70.0
80.0
90.0
Cze
ch R
ep.
Slov
ak R
ep.
Hun
gary
Bel
gium
Pola
ndSl
oven
iaEs
toni
aG
reec
ePo
rtug
alTu
rkey
USA
Finl
and
Spai
nK
orea
Fran
ceIs
rael
Swed
enLu
xem
bour
gO
ECD
Italy
Icel
and
Chi
leM
exic
oA
ustr
iaD
enm
ark
Can
ada
Nor
way
Japa
nN
ew Z
eala
ndG
erm
any
UK
Aus
tral
ia
Part-time Employment as a Proportion of Total Employment Women's Share in Part-time Employment
Source: OECD, Labor Force Statistics Database
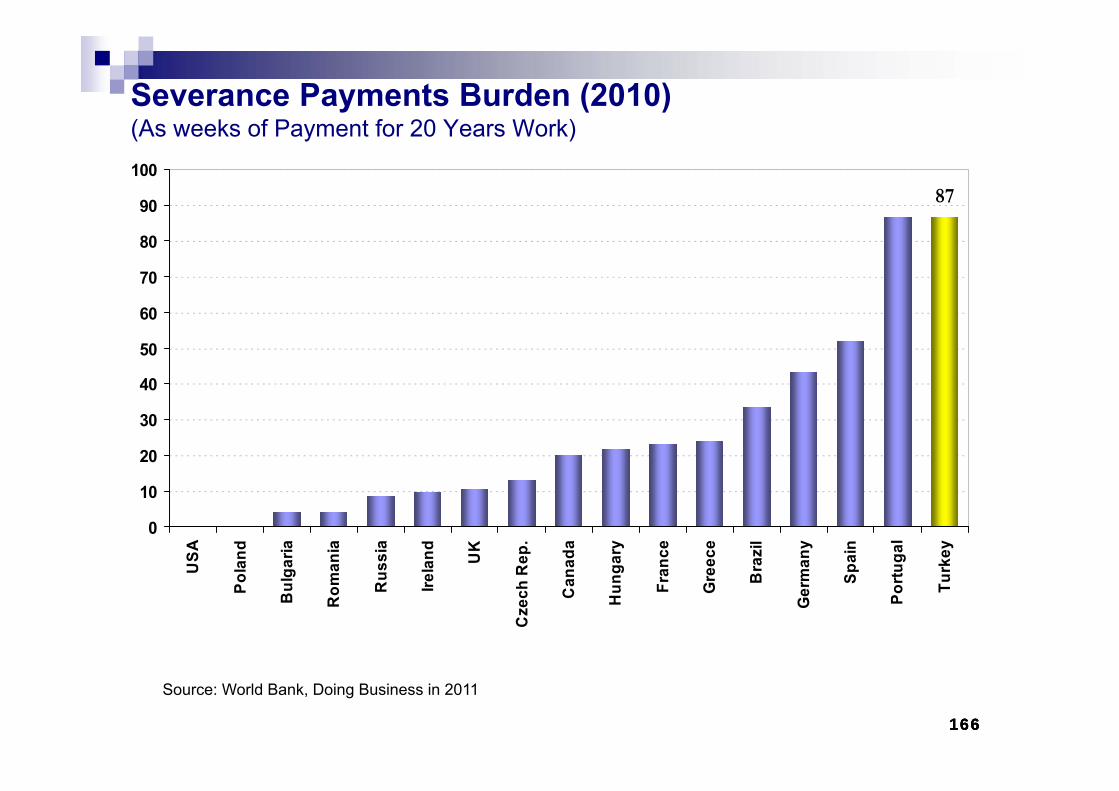
166166166
Severance Payments Burden (2010) (As weeks of Payment for 20 Years Work)
87
0
10
20
30
40
50
60
70
80
90
100U
SA
Pola
nd
Bul
garia
Rom
ania
Rus
sia
Irela
nd UK
Cze
ch R
ep.
Can
ada
Hun
gary
Fran
ce
Gre
ece
Bra
zil
Ger
man
y
Spai
n
Portu
gal
Turk
ey
Source: World Bank, Doing Business in 2011
167167167
R&D
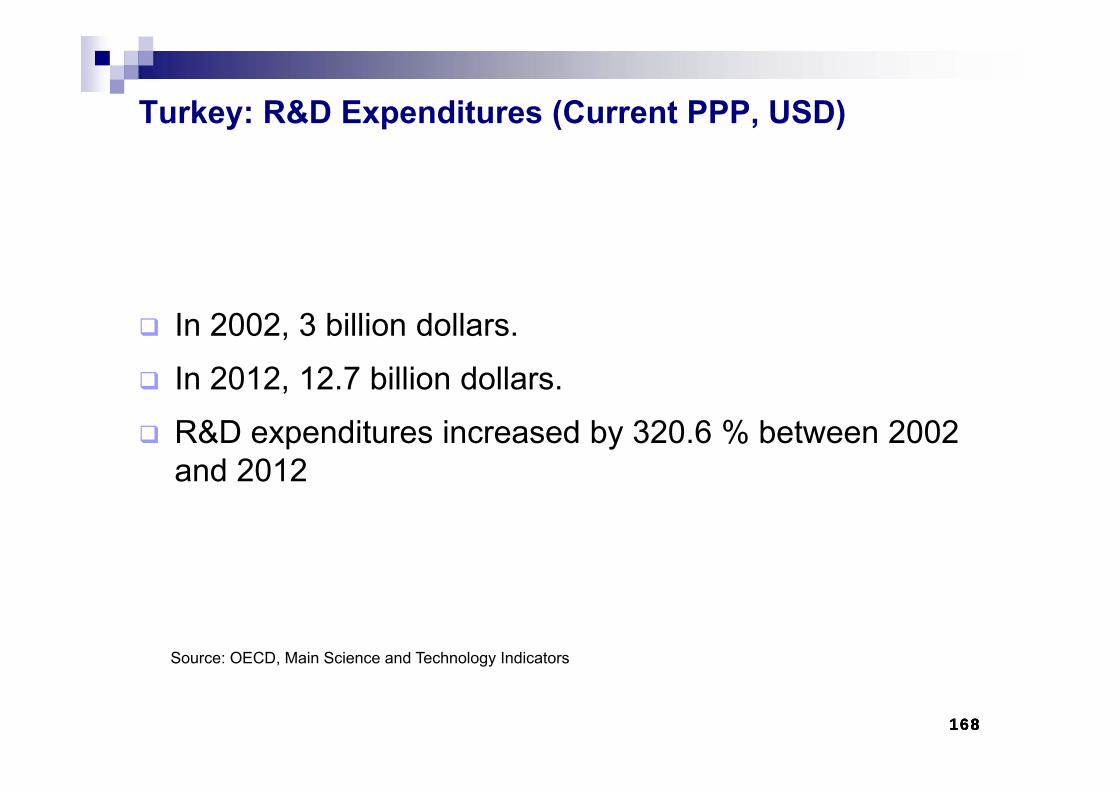
168168168
In 2002, 3 billion dollars.
In 2012, 12.7 billion dollars.
R&D expenditures increased by 320.6 % between 2002 and 2012
Turkey: R&D Expenditures (Current PPP, USD)
Source: OECD, Main Science and Technology Indicators
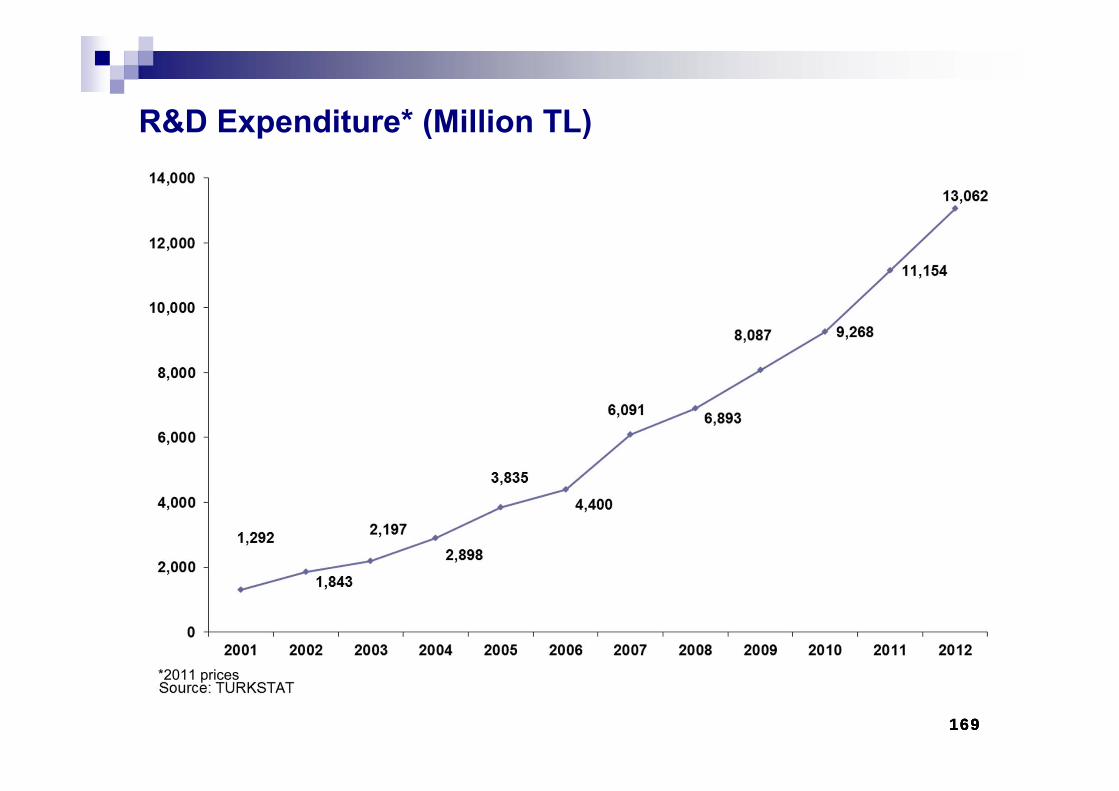
169169169
R&D Expenditure* (Million TL)
*2011 prices
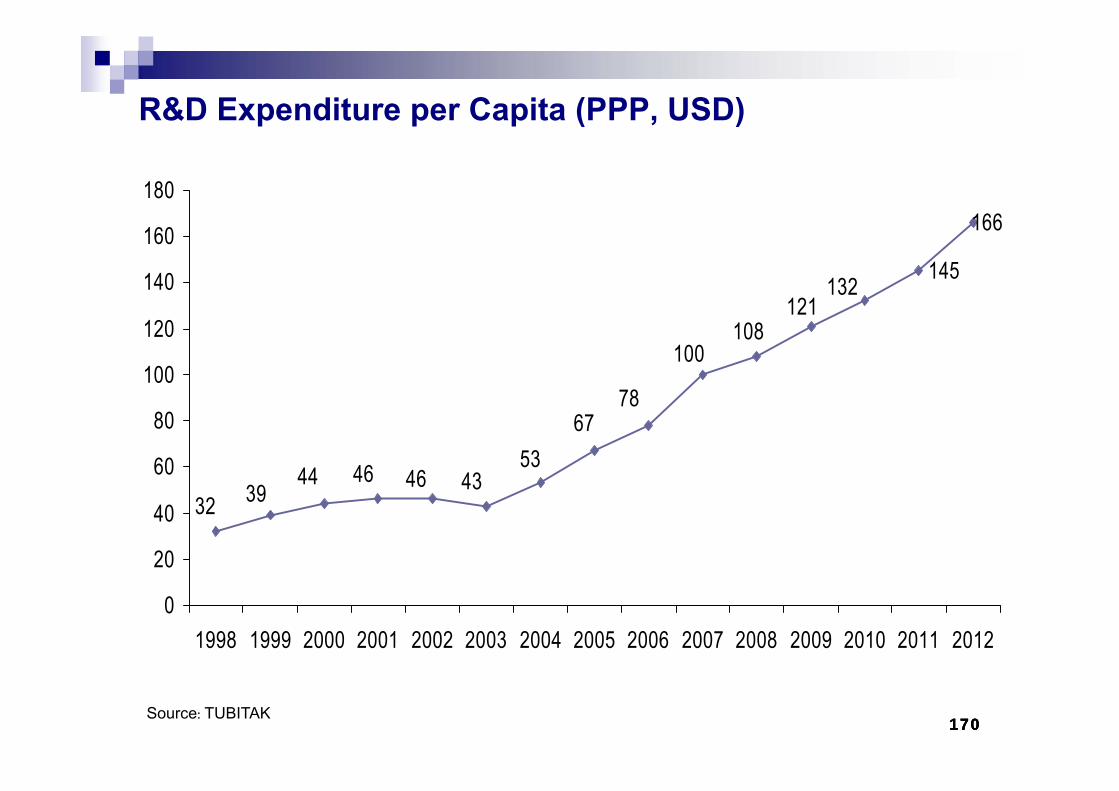
170170170
R&D Expenditure per Capita (PPP, USD)
145
166
132121
108100
7867
5343464644
3932
0
20
40
60
80
100
120
140
160
180
1998 1999 2000 2001 2002 2003 2004 2005 2006 2007 2008 2009 2010 2011 2012
Source: TUBITAK
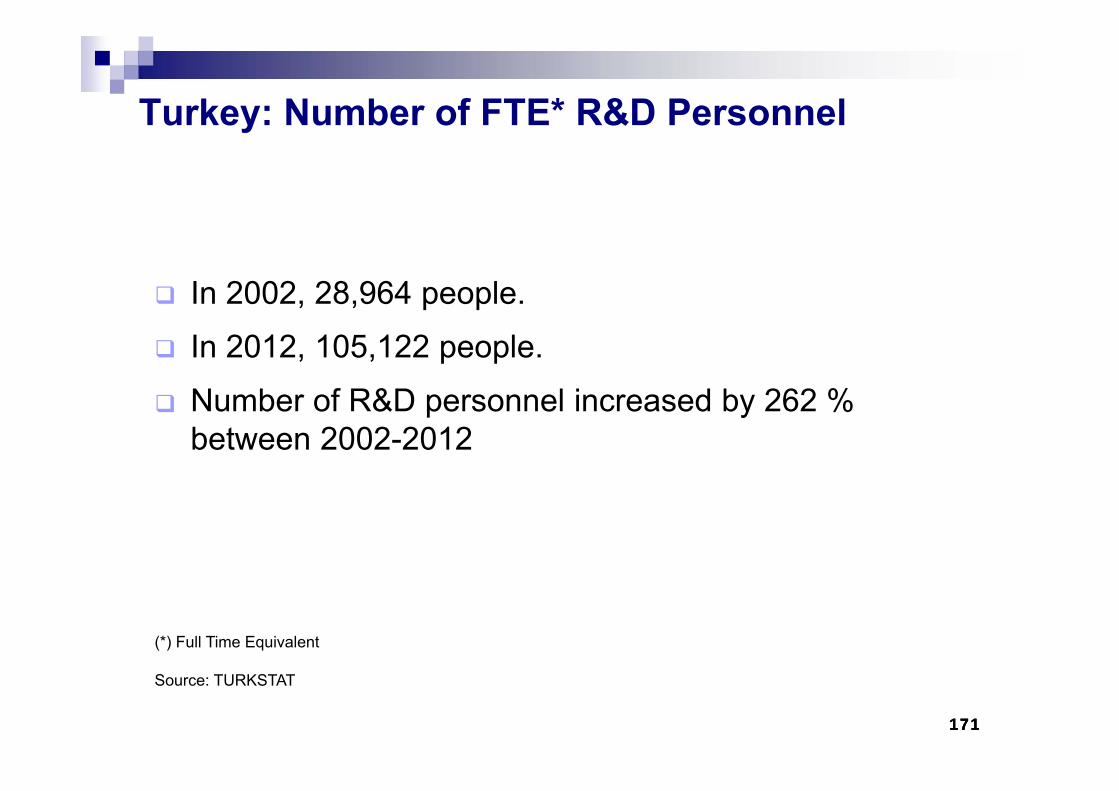
171171171
In 2002, 28,964 people.
In 2012, 105,122 people.
Number of R&D personnel increased by 262 % between 2002-2012
Turkey: Number of FTE* R&D Personnel
(*) Full Time Equivalent
Source: TURKSTAT
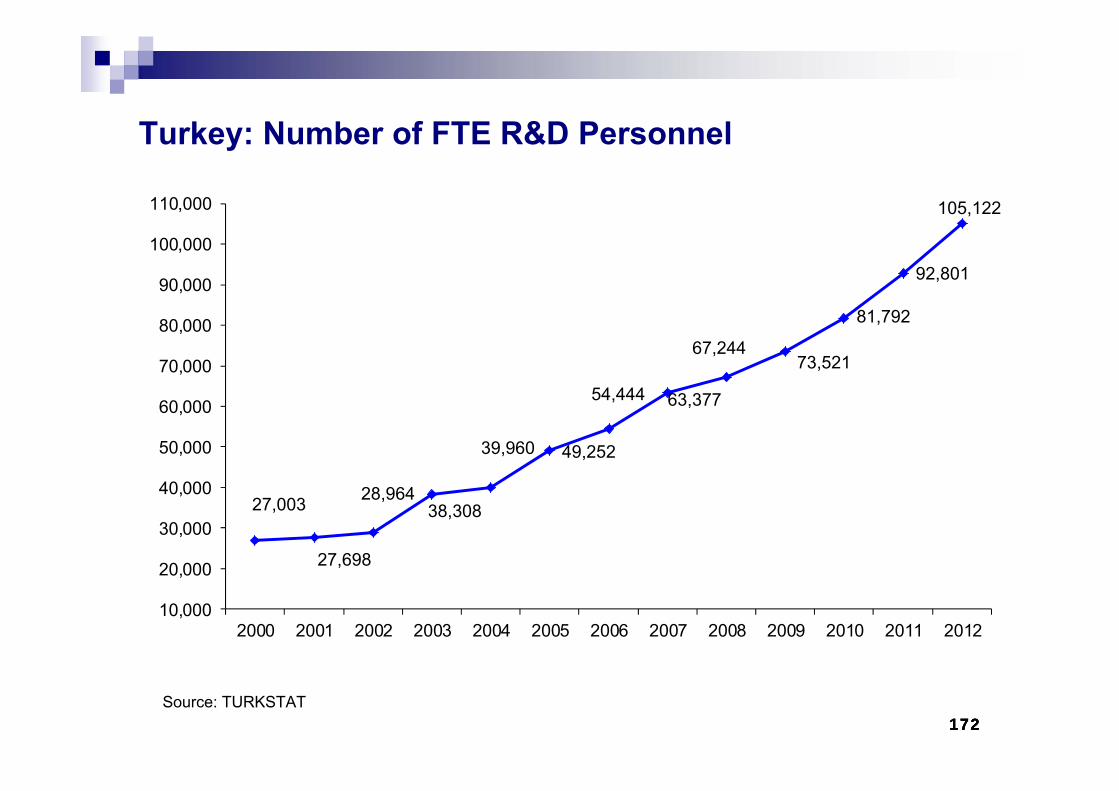
172172172
Turkey: Number of FTE R&D Personnel
Source: TURKSTAT
27,003
27,698
28,96438,308
39,960 49,252
54,444 63,377
67,24473,521
81,792
92,801
105,122
10,000
20,000
30,000
40,000
50,000
60,000
70,000
80,000
90,000
100,000
110,000
2000 2001 2002 2003 2004 2005 2006 2007 2008 2009 2010 2011 2012
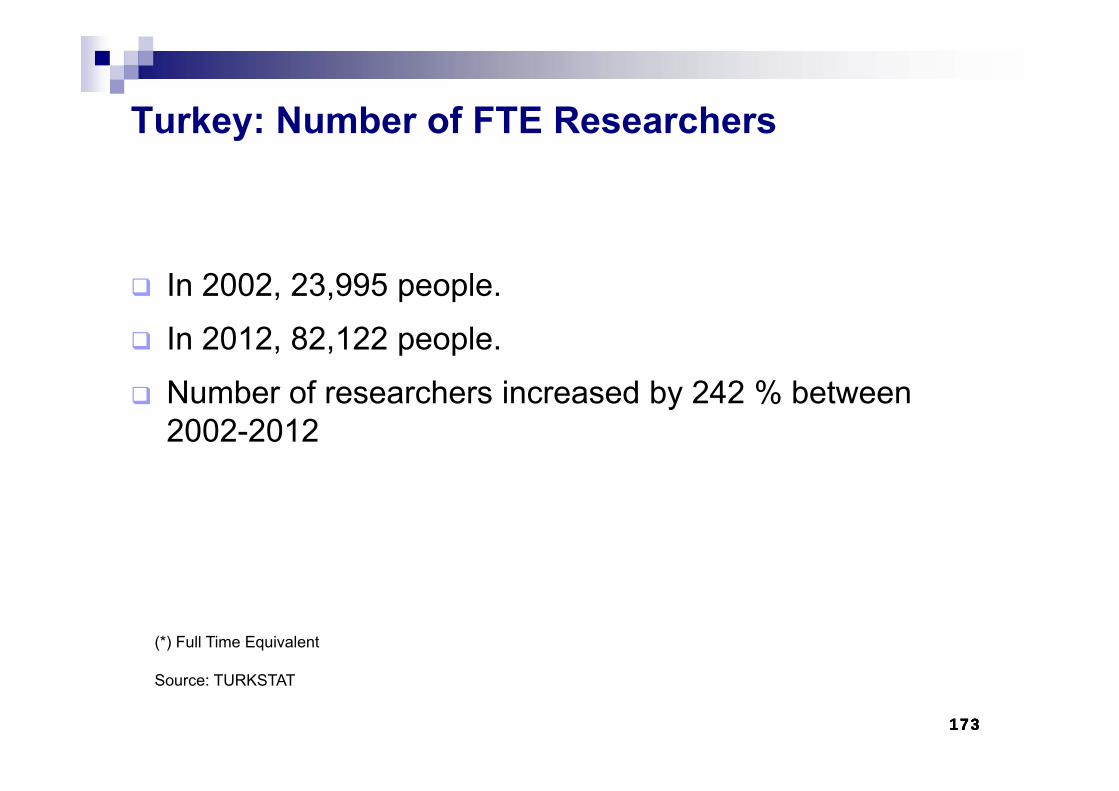
173173173
In 2002, 23,995 people.
In 2012, 82,122 people.
Number of researchers increased by 242 % between 2002-2012
Turkey: Number of FTE Researchers
(*) Full Time Equivalent
Source: TURKSTAT
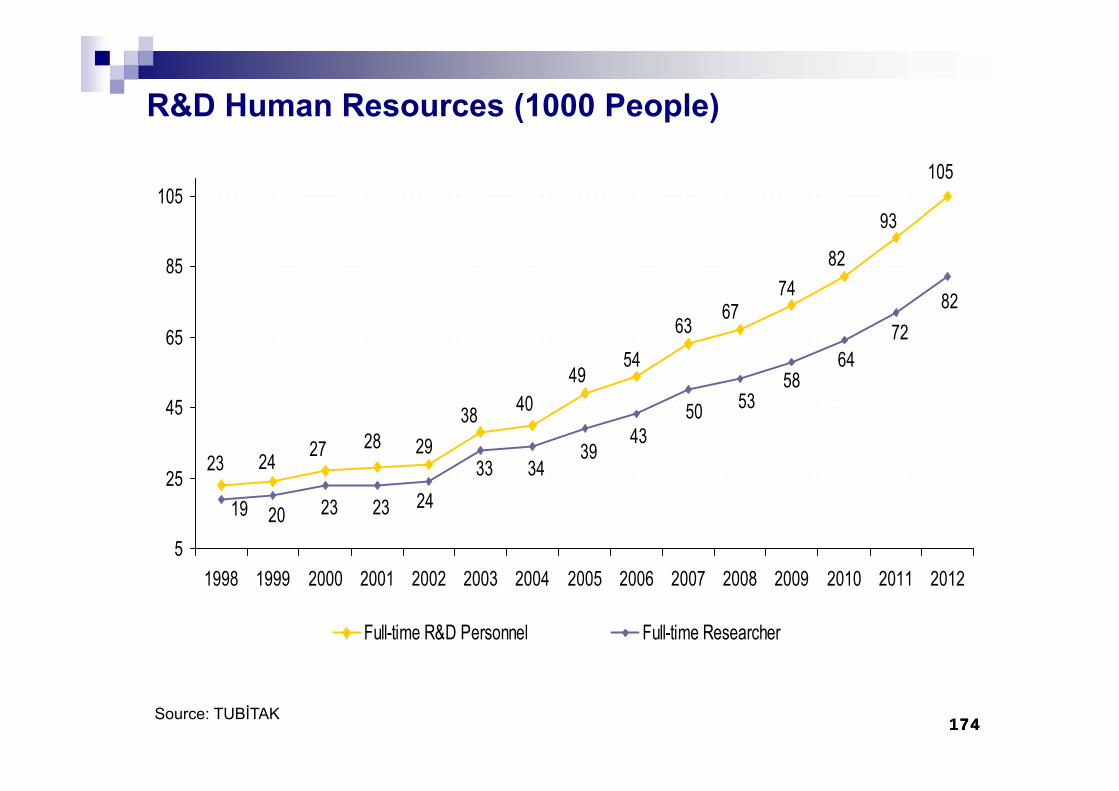
174174174
R&D Human Resources (1000 People)
Source: TUBİTAK
23 24 27 28 2938 40
4954
6367
7482
93
105
8272
6458
535043
393433
24232319 205
25
45
65
85
105
1998 1999 2000 2001 2002 2003 2004 2005 2006 2007 2008 2009 2010 2011 2012
Full-time R&D Personnel Full-time Researcher
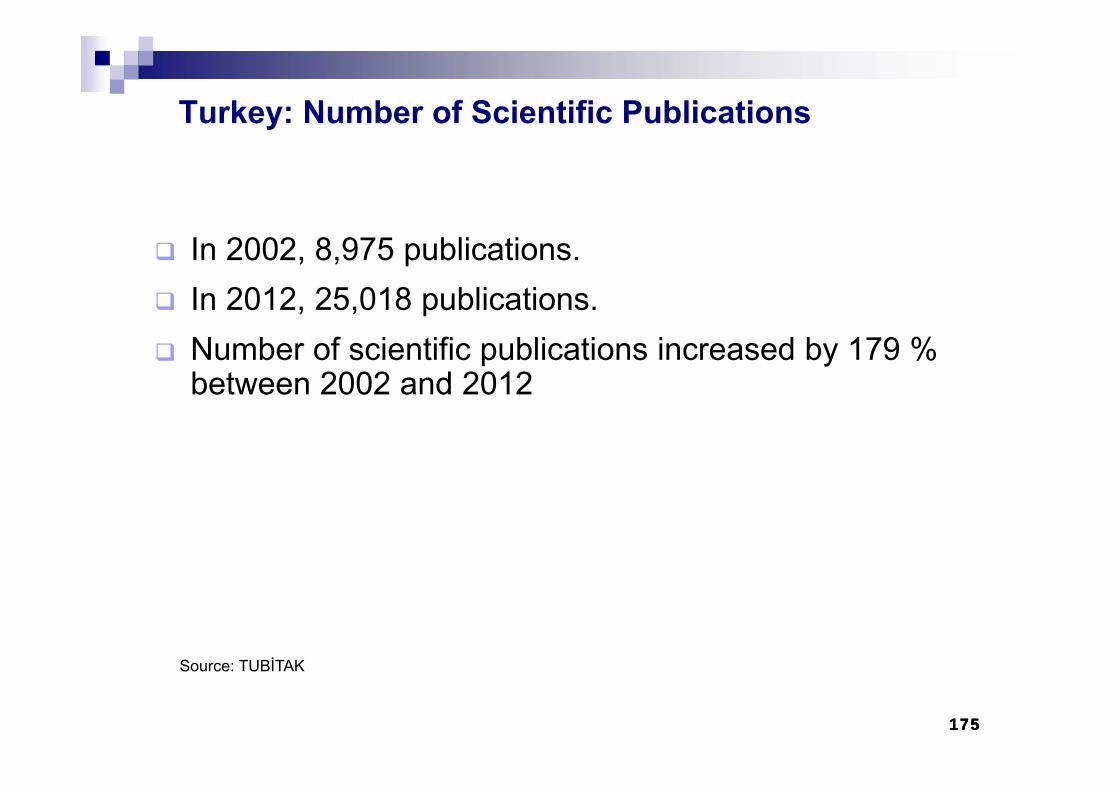
175175175
In 2002, 8,975 publications. In 2012, 25,018 publications.Number of scientific publications increased by 179 % between 2002 and 2012
Turkey: Number of Scientific Publications
Source: TUBİTAK
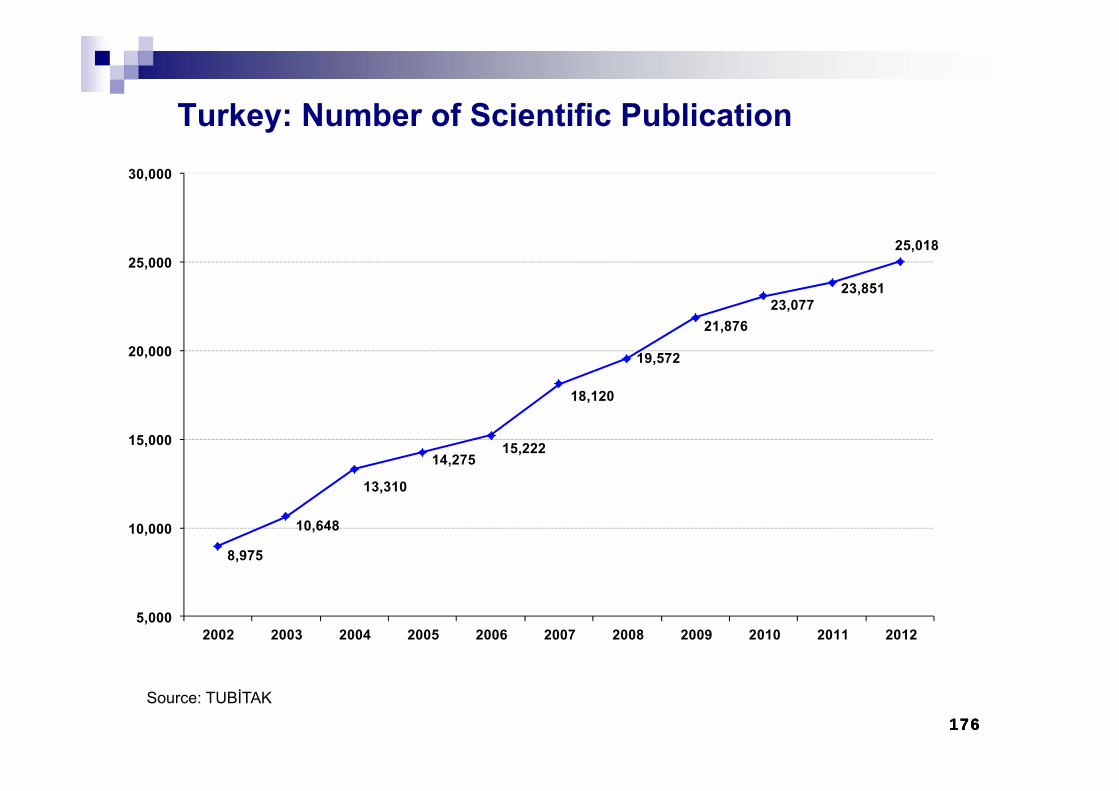
176176176
Turkey: Number of Scientific Publication
8,975
10,648
13,310
14,27515,222
18,120
19,572
21,87623,077
23,851
25,018
5,000
10,000
15,000
20,000
25,000
30,000
2002 2003 2004 2005 2006 2007 2008 2009 2010 2011 2012
Source: TUBİTAK
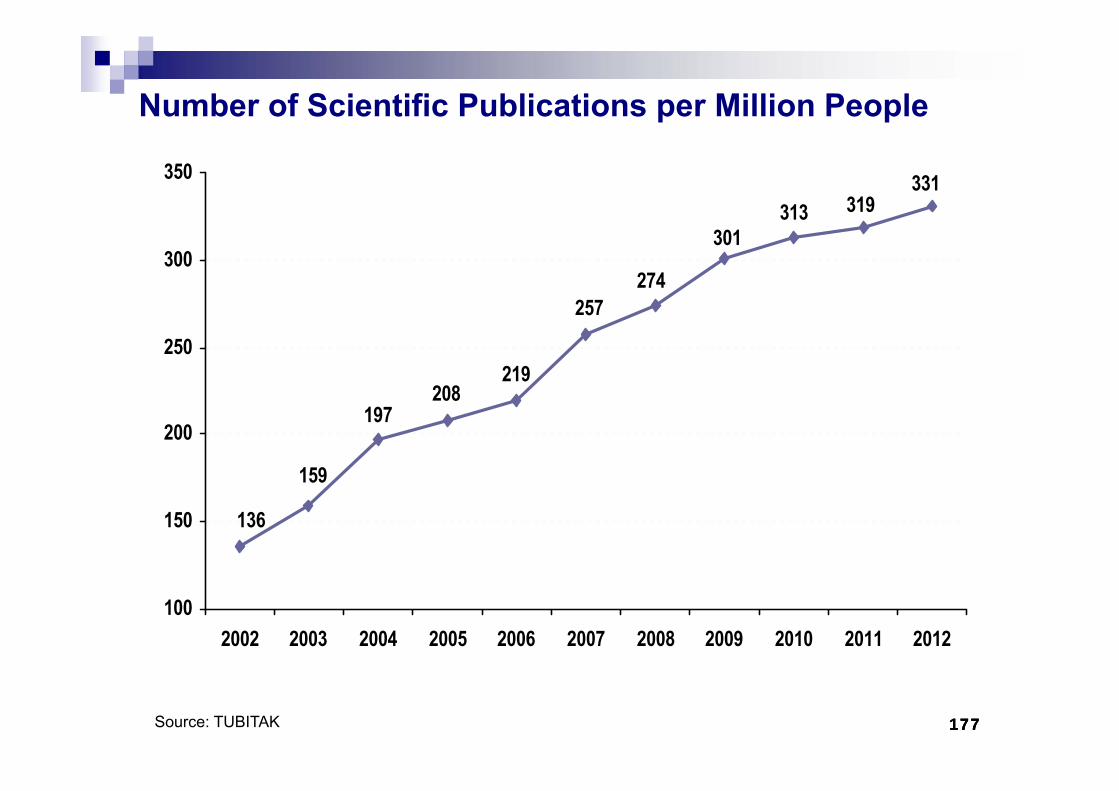
177177177
Number of Scientific Publications per Million People
Source: TUBITAK
331319313
301
274257
219208
197
159
136
100
150
200
250
300
350
2002 2003 2004 2005 2006 2007 2008 2009 2010 2011 2012
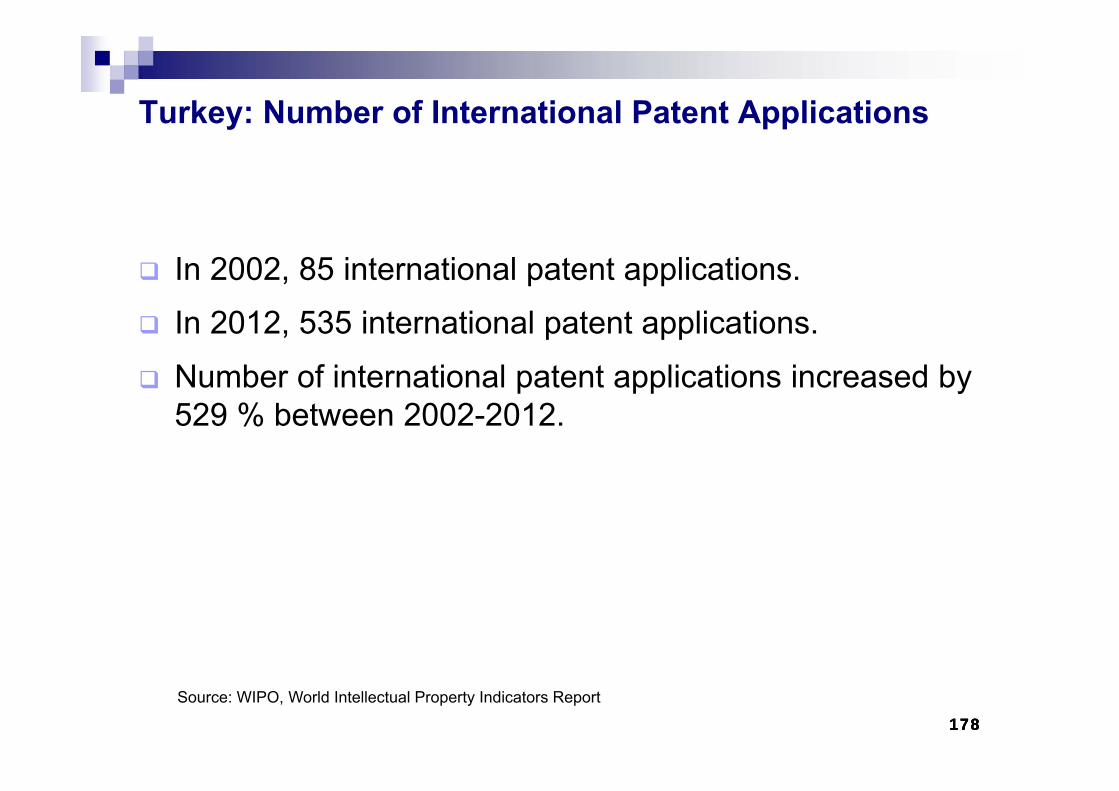
178178178
In 2002, 85 international patent applications.
In 2012, 535 international patent applications.
Number of international patent applications increased by 529 % between 2002-2012.
Turkey: Number of International Patent Applications
Source: WIPO, World Intellectual Property Indicators Report
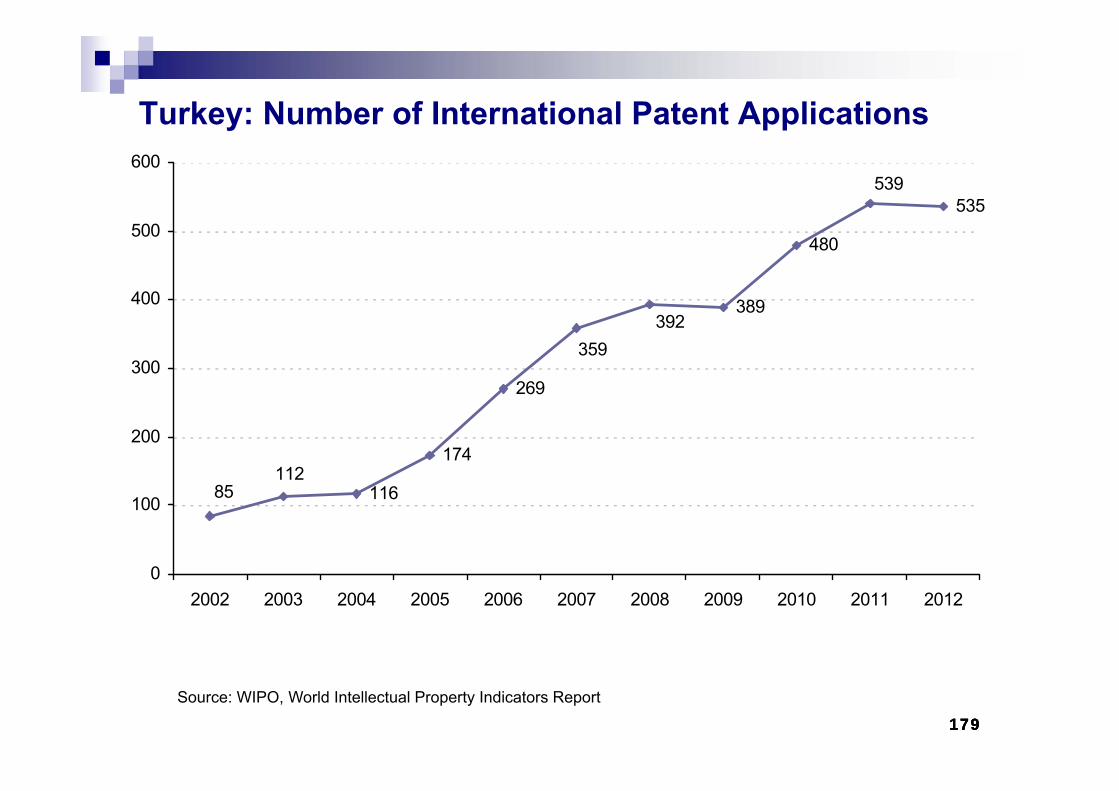
179179179
Turkey: Number of International Patent Applications
Source: WIPO, World Intellectual Property Indicators Report
116
174
269
389
480
535
392
539
85112
359
0
100
200
300
400
500
600
2002 2003 2004 2005 2006 2007 2008 2009 2010 2011 2012
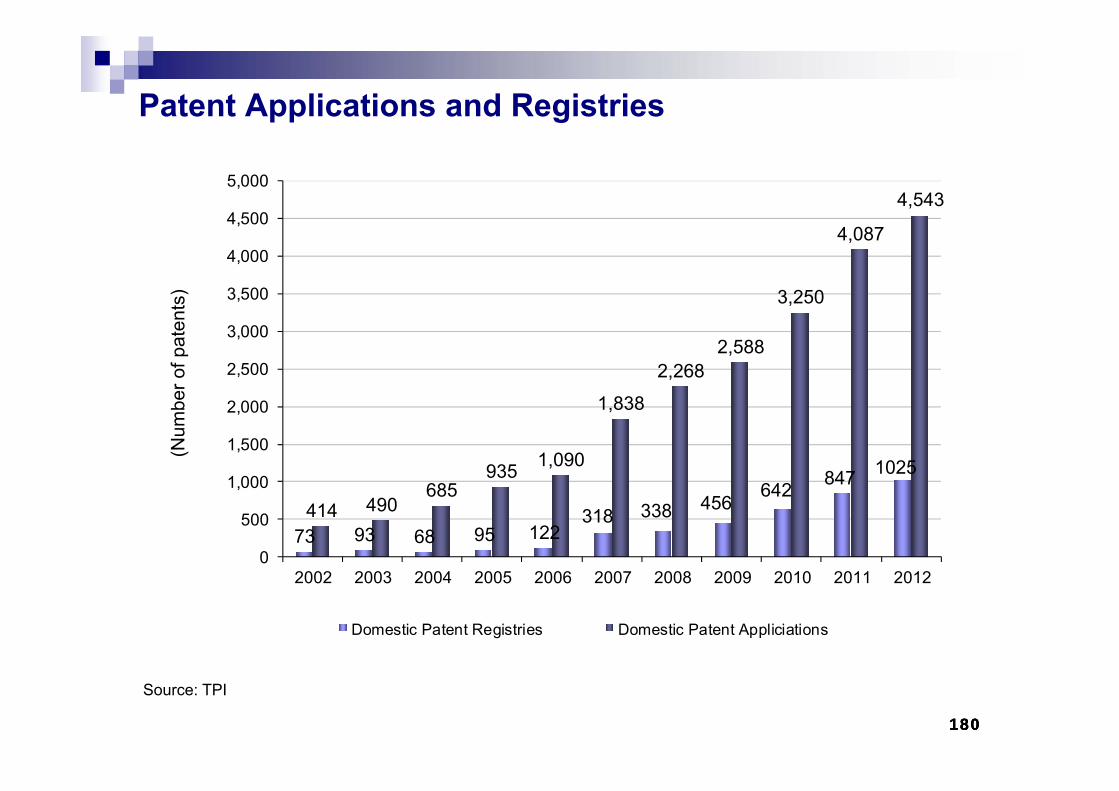
180180180
Patent Applications and Registries
Source: TPI
73 93 68 95 122318 338 456
642 847 1025
414 490685
935 1,090
1,838
2,2682,588
3,250
4,087
4,543
0
500
1,000
1,500
2,000
2,500
3,000
3,500
4,000
4,500
5,000
2002 2003 2004 2005 2006 2007 2008 2009 2010 2011 2012
(Num
ber o
f pat
ents
)
Domestic Patent Registries Domestic Patent Appliciations
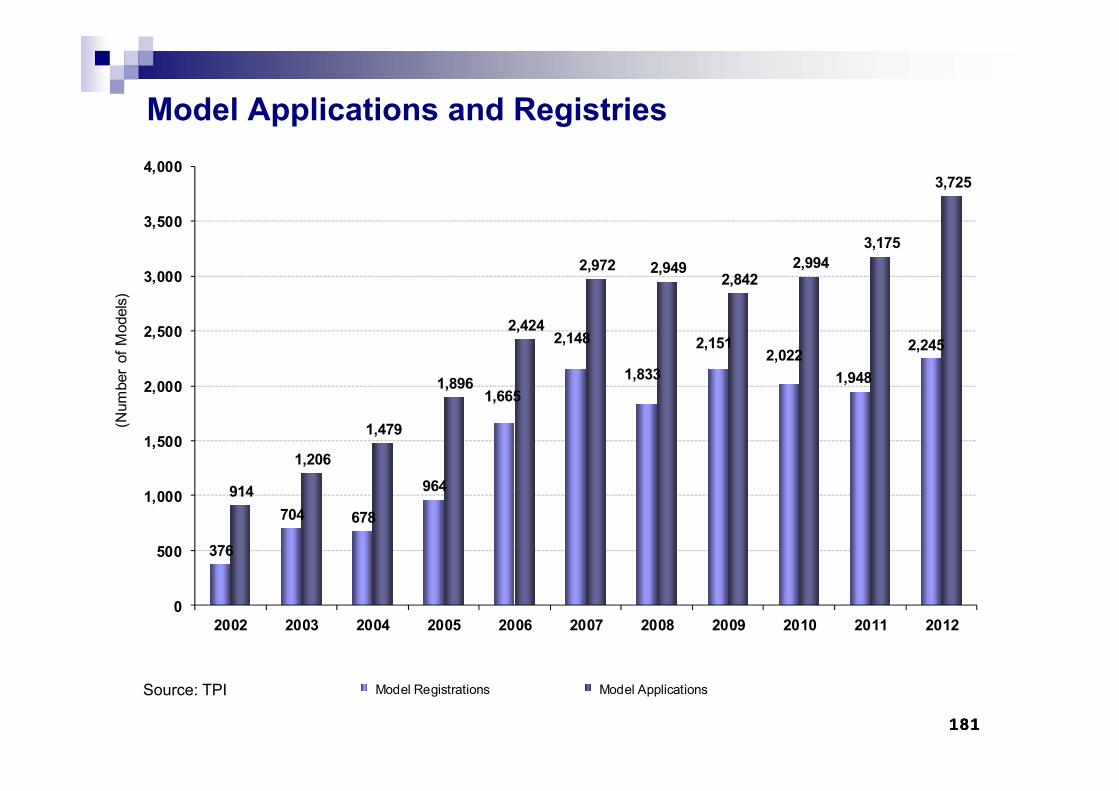
181181181
Model Applications and Registries
376
704 678
964
1,665
2,148
1,833
2,1512,022
1,948
2,245
914
1,206
1,479
1,896
2,424
2,972 2,9492,842
2,9943,175
3,725
0
500
1,000
1,500
2,000
2,500
3,000
3,500
4,000
2002 2003 2004 2005 2006 2007 2008 2009 2010 2011 2012
(Num
ber
of M
odel
s)
Model Registrations Model ApplicationsSource: TPI

182182182
ENERGY SECTOR
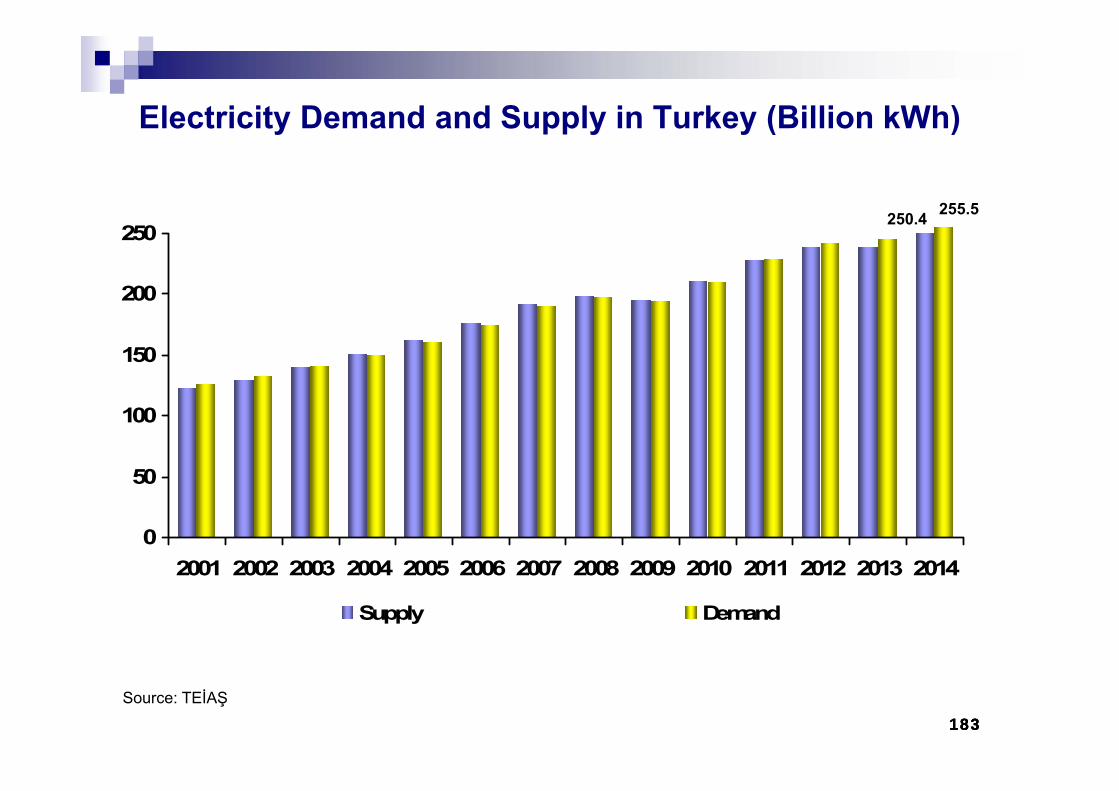
183183183
Electricity Demand and Supply in Turkey (Billion kWh)
Source: TEİAŞ
0
50
100
150
200
250
2001 2002 2003 2004 2005 2006 2007 2008 2009 2010 2011 2012 2013 2014
Supply Demand
250.4 255.5
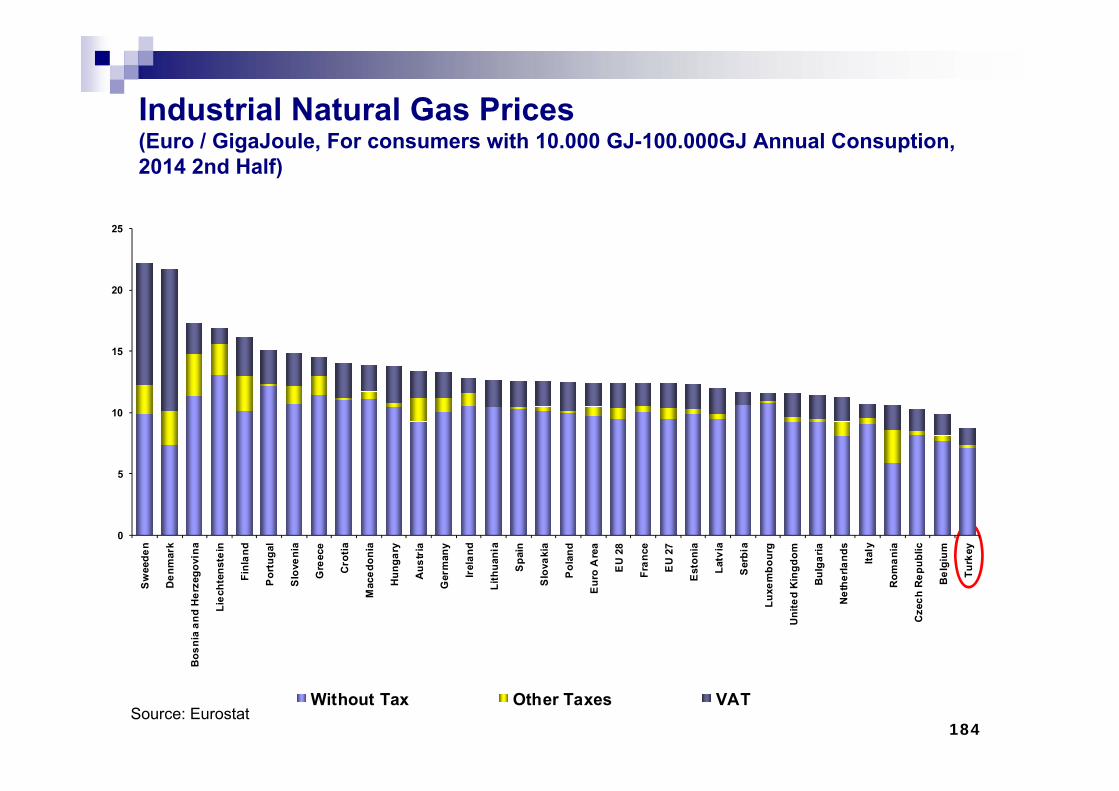
184Source: Eurostat
0
5
10
15
20
25
Sw
eede
n
Den
mar
k
Bos
nia
and
Her
zego
vina
Liec
hten
stei
n
Finl
and
Por
tuga
l
Slo
veni
a
Gre
ece
Cro
tia
Mac
edon
ia
Hun
gary
Aus
tria
Ger
man
y
Irel
and
Lith
uani
a
Spa
in
Slo
vaki
a
Pol
and
Eur
o A
rea
EU
28
Fran
ce
EU
27
Est
onia
Latv
ia
Ser
bia
Luxe
mbo
urg
Uni
ted
Kin
gdom
Bul
garia
Net
herla
nds
Italy
Rom
ania
Cze
ch R
epub
lic
Bel
gium
Turk
ey
Without Tax Other Taxes VAT
Industrial Natural Gas Prices(Euro / GigaJoule, For consumers with 10.000 GJ-100.000GJ Annual Consuption, 2014 2nd Half)
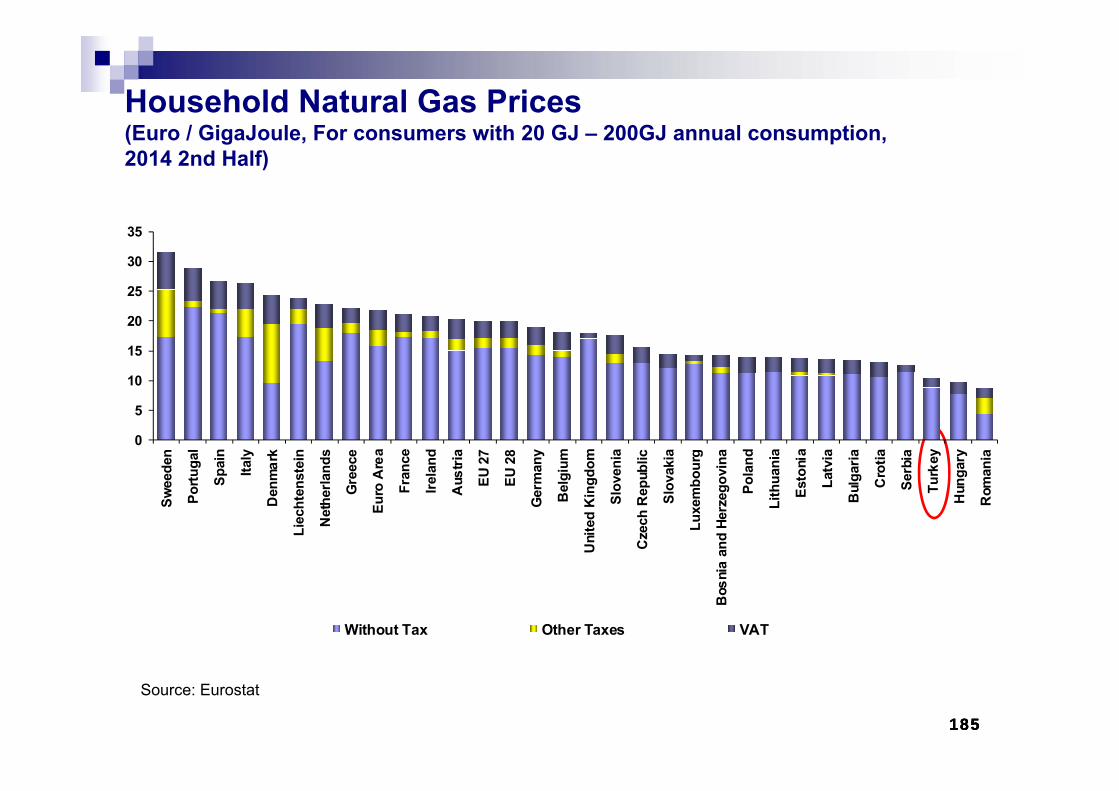
185185185
Source: Eurostat
0
5
10
15
20
25
30
35
Swee
den
Portu
gal
Spai
n
Italy
Den
mar
k
Liec
hten
stei
n
Net
herla
nds
Gre
ece
Euro
Are
a
Fran
ce
Irela
nd
Aus
tria
EU 2
7
EU 2
8
Ger
man
y
Bel
gium
Uni
ted
Kin
gdom
Slov
enia
Cze
ch R
epub
lic
Slov
akia
Luxe
mbo
urg
Bos
nia
and
Herz
egov
ina
Pola
nd
Lith
uani
a
Esto
nia
Latv
ia
Bul
garia
Cro
tia
Serb
ia
Turk
ey
Hun
gary
Rom
ania
Without Tax Other Taxes VAT
Household Natural Gas Prices(Euro / GigaJoule, For consumers with 20 GJ – 200GJ annual consumption,2014 2nd Half)
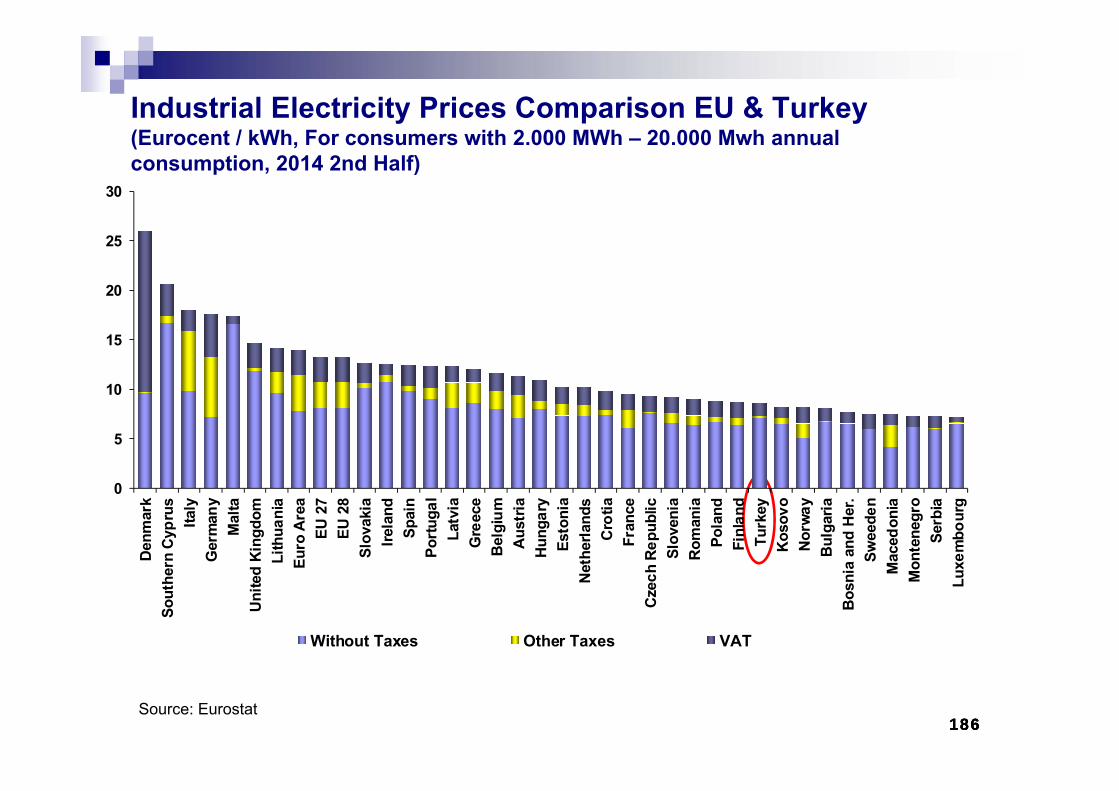
186186186Source: Eurostat
0
5
10
15
20
25
30
Den
mar
kSo
uthe
rn C
ypru
sIta
lyG
erm
any
Mal
taU
nite
d K
ingd
omLi
thua
nia
Euro
Are
aEU
27
EU 2
8Sl
ovak
iaIre
land
Spai
nPo
rtug
alLa
tvia
Gre
ece
Bel
gium
Aus
tria
Hun
gary
Esto
nia
Net
herla
nds
Cro
tiaFr
ance
Cze
ch R
epub
licSl
oven
iaR
oman
iaPo
land
Finl
and
Turk
eyK
osov
oN
orw
ayB
ulga
riaB
osni
a an
d H
er.
Swee
den
Mac
edon
iaM
onte
negr
oSe
rbia
Luxe
mbo
urg
Without Taxes Other Taxes VAT
Industrial Electricity Prices Comparison EU & Turkey(Eurocent / kWh, For consumers with 2.000 MWh – 20.000 Mwh annual consumption, 2014 2nd Half)
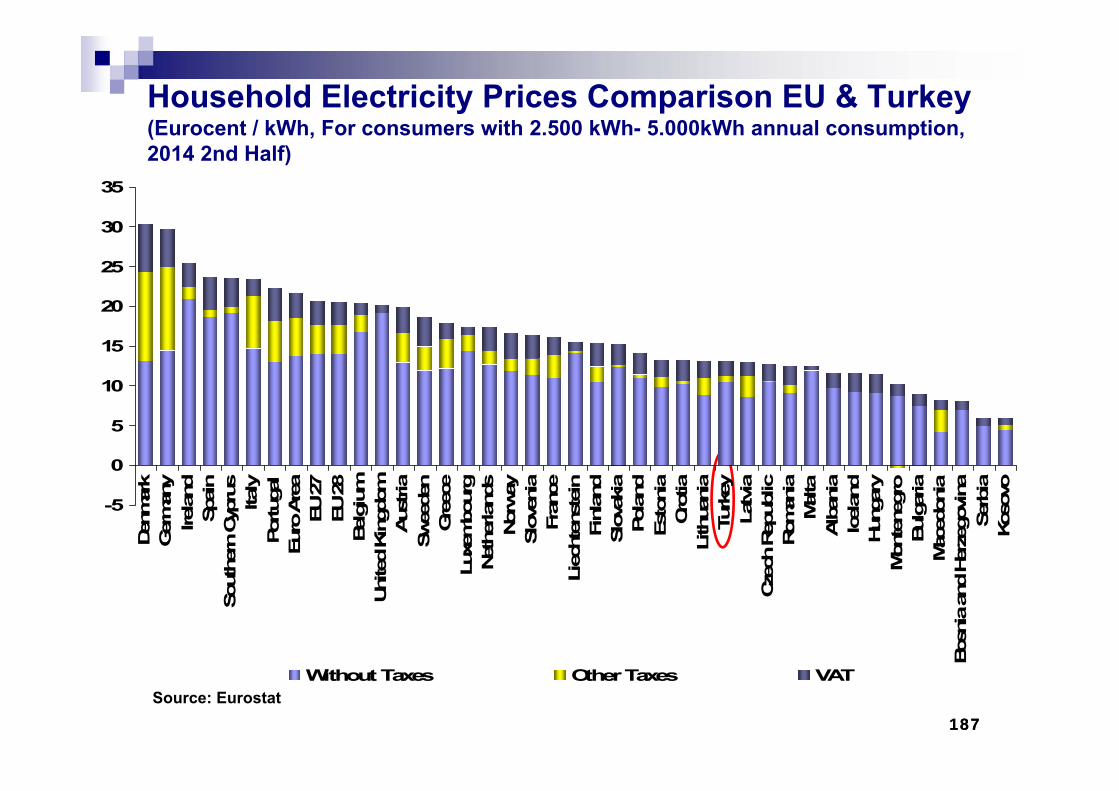
187187
-5
0
5
10
15
20
25
30
35
Den
mar
kGer
man
yIre
land
Spain
Sout
hern
Cyp
rus
Italy
Portug
alEu
ro A
rea
EU 27
EU 28
Belgi
umUni
ted
Kin
gdom
Aus
tria
Swee
den
Gre
ece
Luxe
mbo
urg
Net
herla
nds
Nor
way
Slov
enia
Fran
ceLi
echt
enst
ein
Finl
and
Slov
akia
Poland
Esto
nia
Cro
tiaLi
thua
nia
Turk
eyLa
tvia
Cze
ch R
epub
licRom
ania
Malta
Alb
ania
Icelan
dHun
gary
Mon
tene
gro
Bul
garia
Mac
edon
iaBos
nia an
d Her
zego
vina
Serb
iaKos
ovo
Without Taxes Other Taxes VAT
Household Electricity Prices Comparison EU & Turkey(Eurocent / kWh, For consumers with 2.500 kWh- 5.000kWh annual consumption, 2014 2nd Half)
Source: Eurostat

February 2016
TURKISH ECONOMY
Undersecretary of Treasury