Embed Size (px)
Citation preview

Valuation
The Science

Valuation
• Art– Intangibles that make give the investment
value• Science–Determining the correct number by using
math• Voodoo–Making it fit in your portfolio

• The Art of Valuation (7 M’s)– Market– Management– Momentum– Model– Money– Magic– Match
What’d We Learn Last Time

So Now What?
Now that we understand the company, we need to develop some tangible estimates of the
actual intrinsic value of the business

Where to Start
How do we value an apple tree?

What are our options?
• Main Methods–Discounted Cash
Flow Analysis–Multiples Method• Precedent
Transactions• Trading Comps
• Tons of Others– Liquidation Value–Replacement
Value– LBO Model– Sum of Parts

DCF Model
A DCF values a company based on the Present Value of its Cash Flows and the Present Value
of its Terminal Value.

FREE CASH FLOW SUMMARY
Home depot Lowe’s
NOPLATDepreciation
Gross cash flow
Investment in operating working capitalNet capital expendituresInvestment in capitalized operating leasesInvestments in intangibles and goodwillDecrease (increase) in other operating assetsIncrease (decrease) in accumulated othercomprehensive income
Gross investment
Free cash flow
2001 2002 2003 2001 2002 2003
3,208 756
3,964
834 (3,063)
(775)(113)105
(153)
(3,165)
799
3,981 895
4,876
(194)(2,688)
(430)(164)
31 138
(3,307)
1,569
5,083 1,075
6,157
72 (3,970)
(664)(259)277 172
(4,372)
1,785
5,185 1,193
6,378
(294)(3,399)
(721)(92)58
0
(4,448)
1,930
5,741 1,321
7,062
(318)(3,708)
(780)(99)62
0
(4,843)
2,219
6,342 1,459
7,801
(344)(4,036)
(842)(107)
67
0
(5,261)
2,539
$ Million
LAN-ZWB887-20050620-13749-ZWB
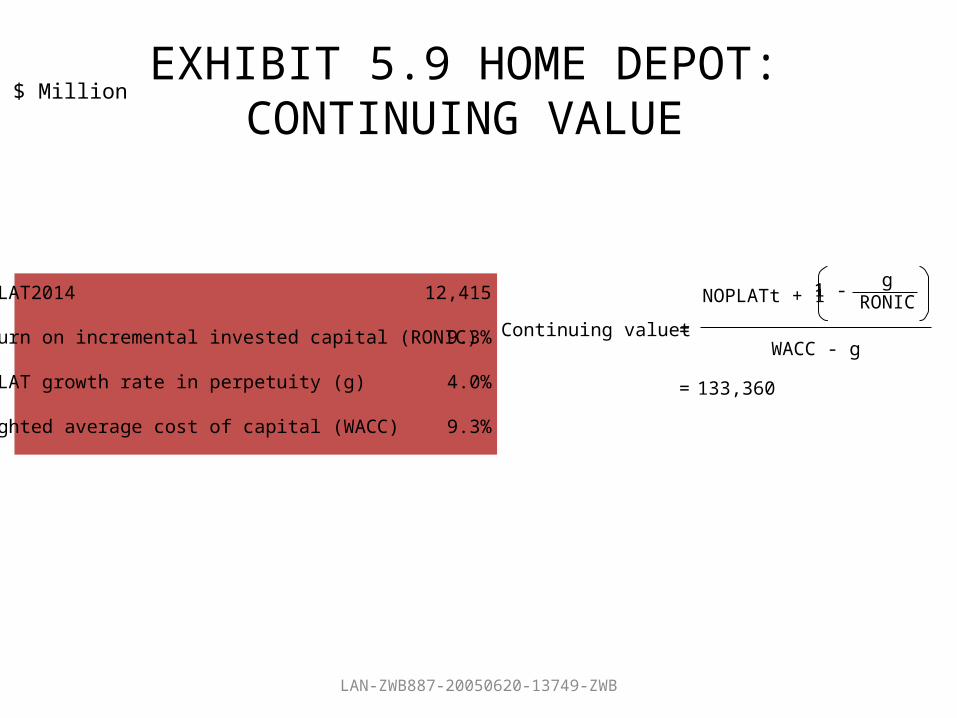
EXHIBIT 5.9 HOME DEPOT: CONTINUING VALUE
$ Million
NOPLAT2014
Return on incremental invested capital (RONIC)
NOPLAT growth rate in perpetuity (g)
Weighted average cost of capital (WACC)
12,415
9.3%
4.0%
9.3%
Continuing valuet =
NOPLATt + 1 1 - gRONIC
WACC - g
= 133,360

ENTERPRISE DCF VALUATION
Year
Free cash flow (FCF)$ Million
Discount factor @ 9.3%
Present value of FCF$ Million
2004200520062007200820092010201120122013Continuing value
1,9302,2192,5392,8933,2833,7114,1804,6915,2465,849
133,360
0.9150.8370.7660.7000.6410.5860.5360.4910.4490.4110.411
Present value of cash flow
Mid-year adjustment factor
Value of operations
Value of excess cash Value of other nonoperating assets
Enterprise value
Number of shares (at fiscal year-end 2003, million)
Estimated share value (Dollars)
1,766 1,857 1,944 2,026 2,104 2,175 2,241 2,301 2,355 2,402
54,757
75,928
1,046
79,384
1,609 84
81,077
2,257
32.41
Value of debt Value of capitalized operating leases
(1,365)(6,554)
73,158Equity value
Summary
• Step 1– Forecast Future Cash Flows and a Terminal Value
• Step 2– Discount back at the appropriate WACC
• Step 3– Divide by the number of outstanding shares to
find the intrinsic value of the share prices

Using Market Multiples to Determine Relative Valuation
• Ratios that are commonly used to determine relative valuation:– EV/Revenue– EV/EBITDA– EV/EBIT– P/E (Share Price / Earnings per Share)– P/BV (Share Price / Book Value).

Some other Multiples ….
• Technology (Internet): – EV / Unique Visitors, EV / Pageviews
• Retail / Airlines: – EV / EBITDAR (Earnings Before Interest, Taxes, Depreciation,
Amortization & Rent) • Energy:
– P / MCFE, P / MCFE / D (MCFE = 1 Million Cubic Foot Equivalent, MCFE/D = MCFE per Day), P / NAV (Share Price / Net Asset Value)
• Real Estate Investment Trusts (REITs): – Price / FFO, Price / AFFO (Funds From Operations, Adjusted
Funds From Operations

Market Multiples

Market Multiples
• Determining the Appropriate Multiple– Finding Comparable Firms– Adjustments within the Sample• Growth Rate• Risk• “Quality of Earnings”

LAN-ZWB887-20050624-13827-ZWB
ADJUSTED TO ENTERPRISE VALUE MULTIPLES$ Million
Home Depot Lowe’s
Lowe’sHome Depot Difference
Raw enterprise value multiple
Adjusted enterprise value multiple
8.7
8.9
9.3
9.4
(6.6%)
(5.1%)
3,755
39,075
42,830
1,365
74,250
75,615
Outstanding debt
Market value of equity
Enterprise value
2,762
(1,033)
44,559
6,554
(1,609)
80,560
Capitalized operating leases
Excess cash
Adjusted enterprise value
4,589
154
4,743
8,691
340
9,031
2005 EBITA
Implied interest from leases
Adjusted 2005 EBITA

LAN-ZWB887-20050624-13827-ZWB
COMPARING EBITA AND EBITDA MULTIPLES
Company B
Multiples
Company Boutsourcesmanufacturing toanother company
Enterprise value ($ Million)
Enterprise value/EBITDA
Enterprise value/EBITA
Depreciation
EBITA
150.0
6.0
7.5
(5)
20
100
(35)
(40)
25
Company A
150.0
3.0
7.5
(30)
20
100
(10)
(40)
50
Revenues
Raw materials
Operating costs
EBITDA
Company BCompany A
$ Million


Final Notes
• Everything is: – Personal– Relative
• And the true price of something is only as much as something is willing to pay for it!
The End

The Digital FrontierBusiness Strategies for a Web 2.0 World
IDH3931 (M 7, W 7-8)


![HVS - Art Science of Hotel Valuation in an Economic Downturn[1]](https://img.pdfslide.net/doc/110x75/55cf9ca6550346d033aa908b/hvs-art-science-of-hotel-valuation-in-an-economic-downturn1.jpg)