Embed Size (px)
Citation preview
invest.gov.tr
WHY INVEST IN TURKEY?
invest.gov.tr
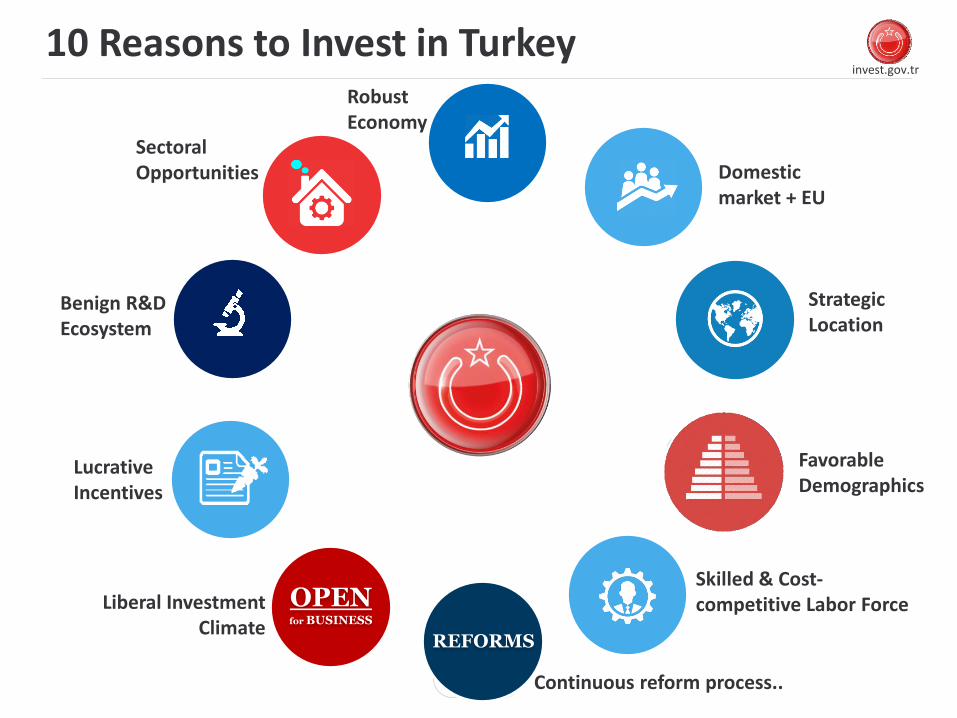
10 Reasons to Invest in Turkey
Strategic Location
Robust Economy
Domestic market + EU
Liberal Investment Climate
Benign R&D Ecosystem
Sectoral Opportunities
Favorable Demographics
Skilled & Cost-competitive Labor Force
Lucrative Incentives
Continuous reform process..
REFORMS
OPENfor BUSINESS
invest.gov.tr
100
125
150
175
200
225
250
275
20
01
20
02
20
03
20
04
20
05
20
06
20
07
20
08
20
09
20
10
20
11
20
12
20
13
20
14
20
15
20
16
20
17
20
18
20
19
20
20
20
21
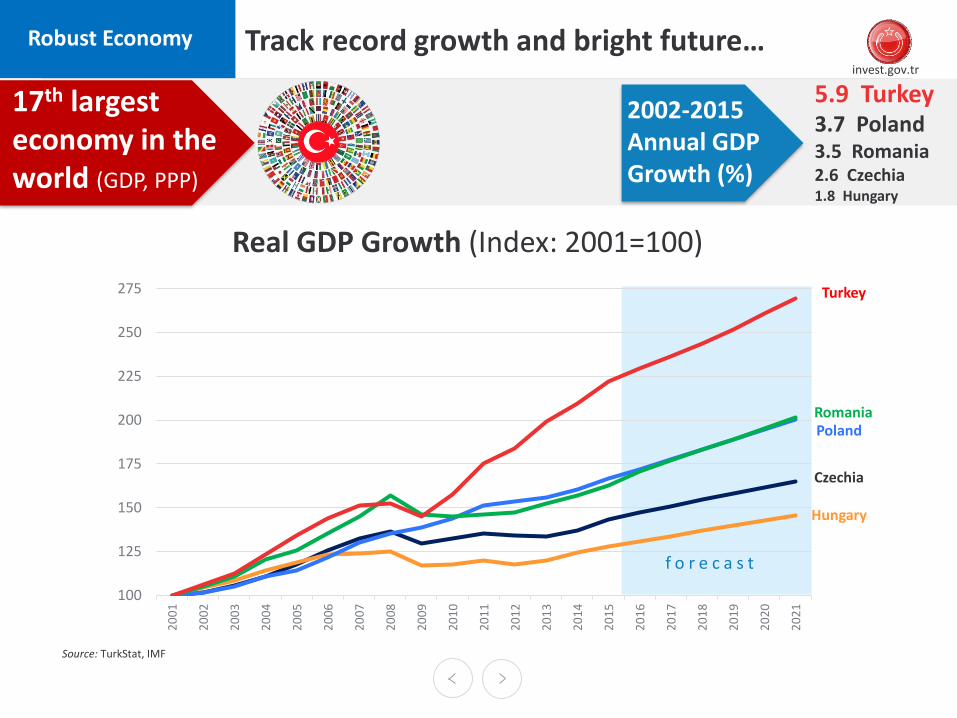
Real GDP Growth (Index: 2001=100)
Source: TurkStat, IMF
Track record growth and bright future…
5.9 Turkey3.7 Poland3.5 Romania2.6 Czechia1.8 Hungary
Turkey
PolandRomania
Czechia
Hungary
f o r e c a s t
Robust Economy
2002-2015 Annual GDP Growth (%)
17th largest economy in the world (GDP, PPP)
invest.gov.tr
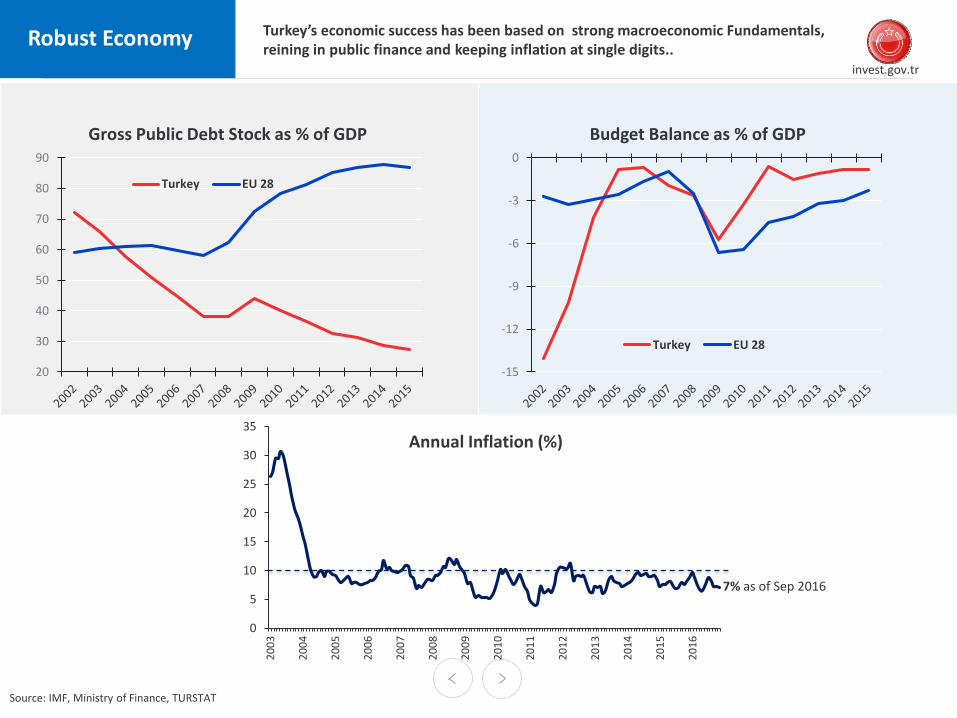
Source: IMF, Ministry of Finance, TURSTAT
Turkey’s economic success has been based on strong macroeconomic Fundamentals, reining in public finance and keeping inflation at single digits..
Robust Economy
20
30
40
50
60
70
80
90
Gross Public Debt Stock as % of GDP
Turkey EU 28
-15
-12
-9
-6
-3
0
Budget Balance as % of GDP
Turkey EU 28
0
5
10
15
20
25
30
35
20
03
20
04
20
05
20
06
20
07
20
08
20
09
20
10
20
11
20
12
20
13
20
14
20
15
20
16
Annual Inflation (%)
7% as of Sep 2016
invest.gov.tr
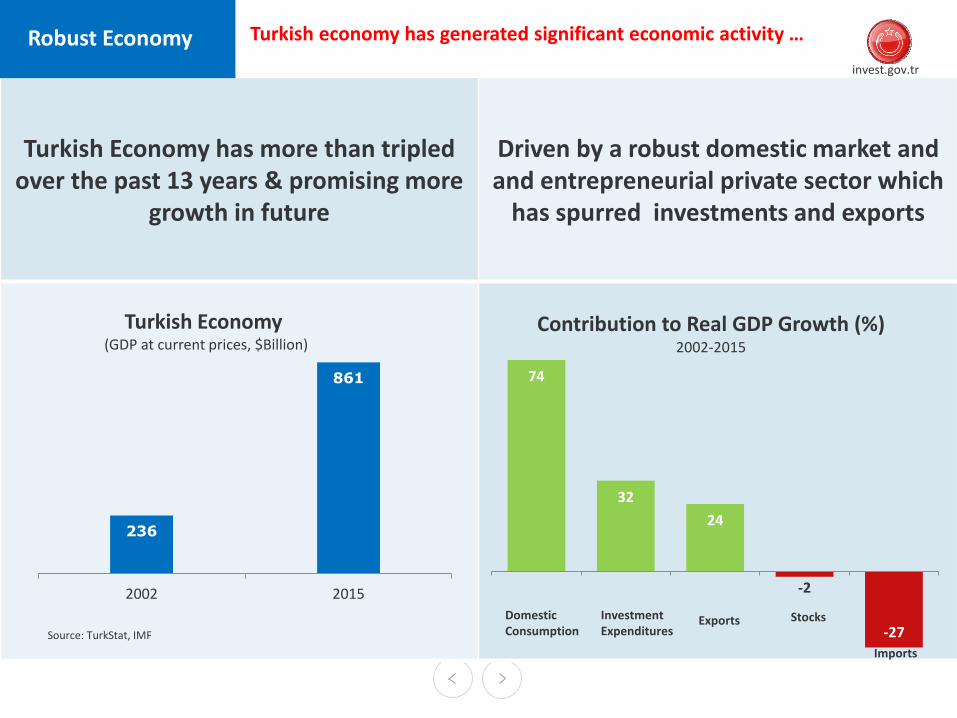
Turkish Economy has more than tripledover the past 13 years & promising more
growth in future
Driven by a robust domestic market and and entrepreneurial private sector which
has spurred investments and exports
Source: TurkStat, IMF
Turkish economy has generated significant economic activity …
74
32
24
-2
-27
Contribution to Real GDP Growth (%) 2002-2015
DomesticConsumption
Investment Expenditures
Stocks
Imports
Exports
236
861
2002 2015
Turkish Economy (GDP at current prices, $Billion)
Robust Economy

invest.gov.tr
Source: IMF, Turkstat, Pew Research; The poor live on $2 or less daily, low income on $2.01-10, middle income on $10.01-20, upper-middle income on $20.01-50, and high income on more than $50; figures expressed in 2011 purchasing power parities (PPP) in 2011 prices.
Turkey’s economic growth has paved the way for the emergence of a sizeable middle-class…
Domestic market + EU
Poor
Low Income
Middle Income
Upper-Middle Income
High Income
2001 2011
43.6 million
13.4 million
3.9 million
0.6 million
33.9 million
25.8 million
10.6 million
1.4 million
1.4 million2.6 million
$56.084
$43.902 $40.952
$37.653 $32.479
$29.867 $27.222
$11.014 $9.452 $9.243 $8.670 $8.141
US (1)
UK (2)Germany (3)
France (4)Japan (5)
Italy (6)Korea (7)
Turkey (8)Mexico (9)Russia (10)Brazil (11)China (12)
GDP per capita ranking in countries with population over 50 million
Among countries with population over 50 million, only 8 countries have GDP per capita over $10.000
$3.581
$11.014
2002 2015
Tripling Income per capita (GDP per capita, current prices)
invest.gov.tr
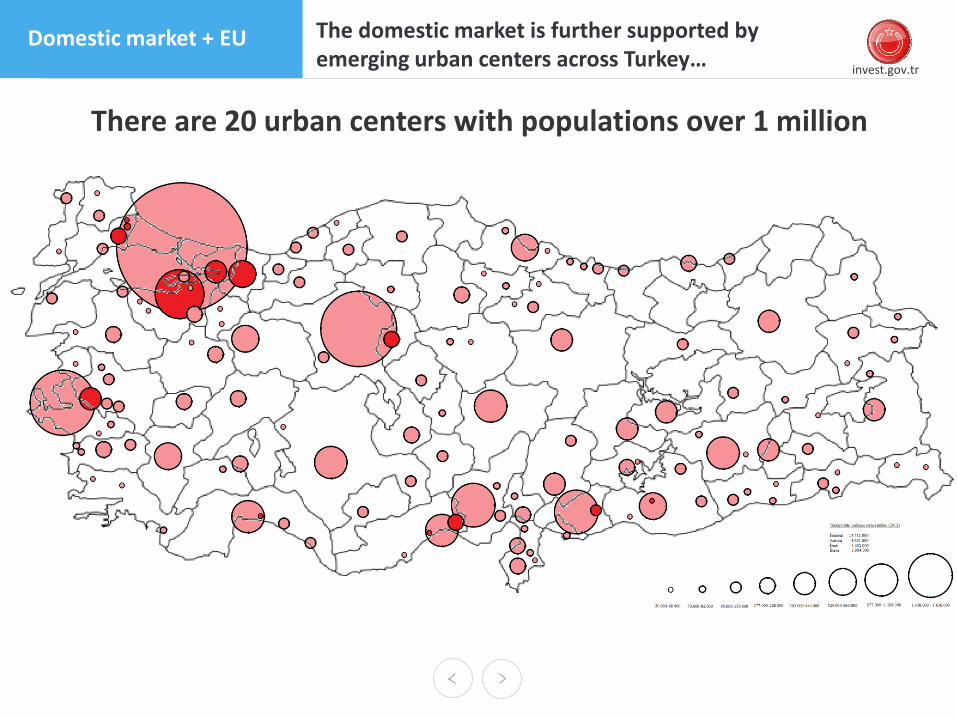
The domestic market is further supported by emerging urban centers across Turkey…
Domestic market + EU
There are 20 urban centers with populations over 1 million
invest.gov.tr
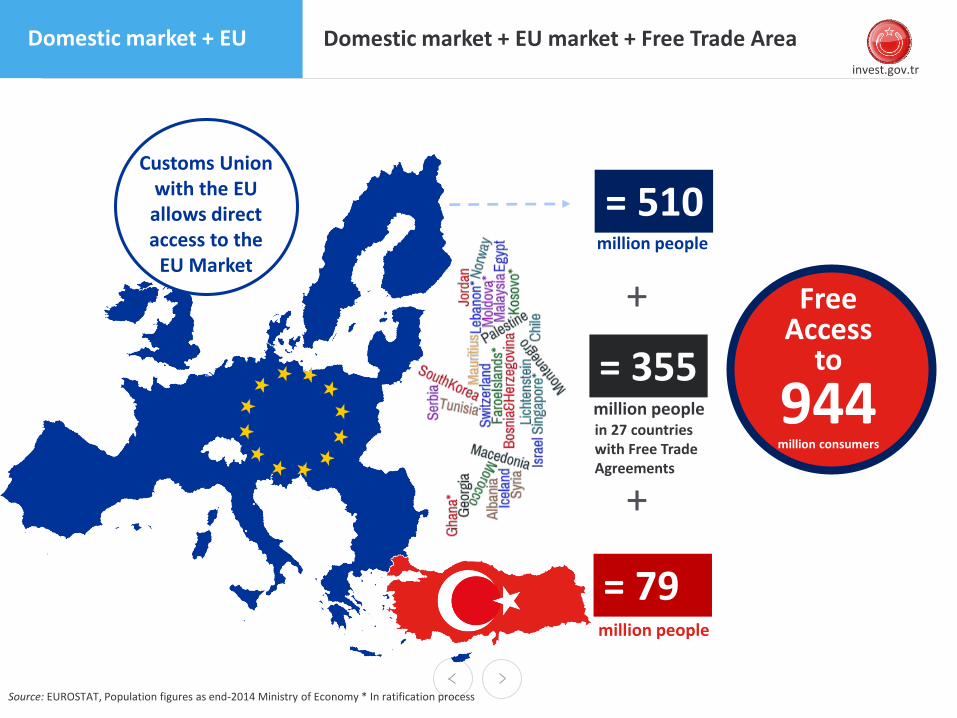
Domestic market + EU market + Free Trade Area
Source: EUROSTAT, Population figures as end-2014 Ministry of Economy * In ratification process
Domestic market + EU
Access to = 510
= 79
in 27 countries with Free Trade Agreements
million people
million people
Customs Union with the EU allows direct access to the
EU Market
= 355
+
+
million people
Free Access
to
944million consumers
invest.gov.tr
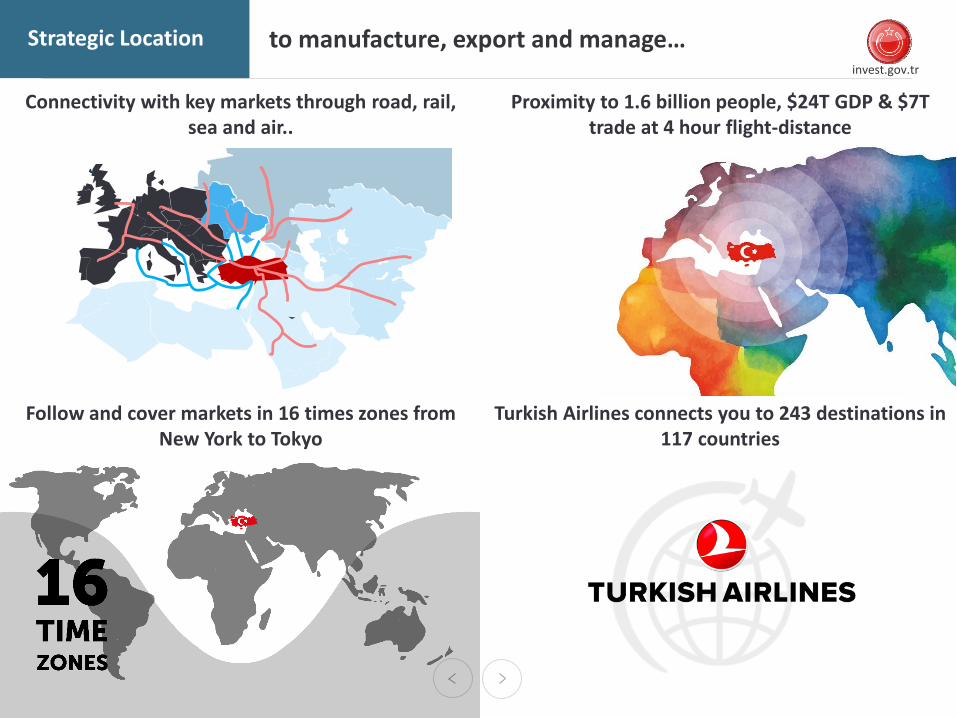
Connectivity with key markets through road, rail, sea and air..
Proximity to 1.6 billion people, $24T GDP & $7T trade at 4 hour flight-distance
Follow and cover markets in 16 times zones from New York to Tokyo
Turkish Airlines connects you to 243 destinations in 117 countries
to manufacture, export and manage… Strategic Location

invest.gov.tr
Already a manufacturing & export hub for global companies..
As well as a management hub managing dozens of countries from Turkey..
90 countries
80 countries
67 countries
52 countries
Production base for MENA
Using Turkey as Super Hub
Its largest production facilityIn the world
Exporting 85% of its production
Exporting 77% of its production
to manufacture, export and manage… Strategic Location
“Besides regional proximity to our clients, İstanbul provides appropriate infrastructure, convenient airport links, and a good quality of life for our staff.”
Dimitris Tsitsiragos, Vice-President, IFC
80 countries
invest.gov.tr
5 3 1 1 3 5
0-4
10-14
20-24
30-34
40-44
50-54
60-64
70-74
80-84
90+
Female Male
5 3 1 1 3 5
0-4
10-14
20-24
30-34
40-44
50-54
60-64
70-74
80-84
90+
Female Male
90
100
110
120
2014 2017 2020 2023 2026 2029 2032 2035
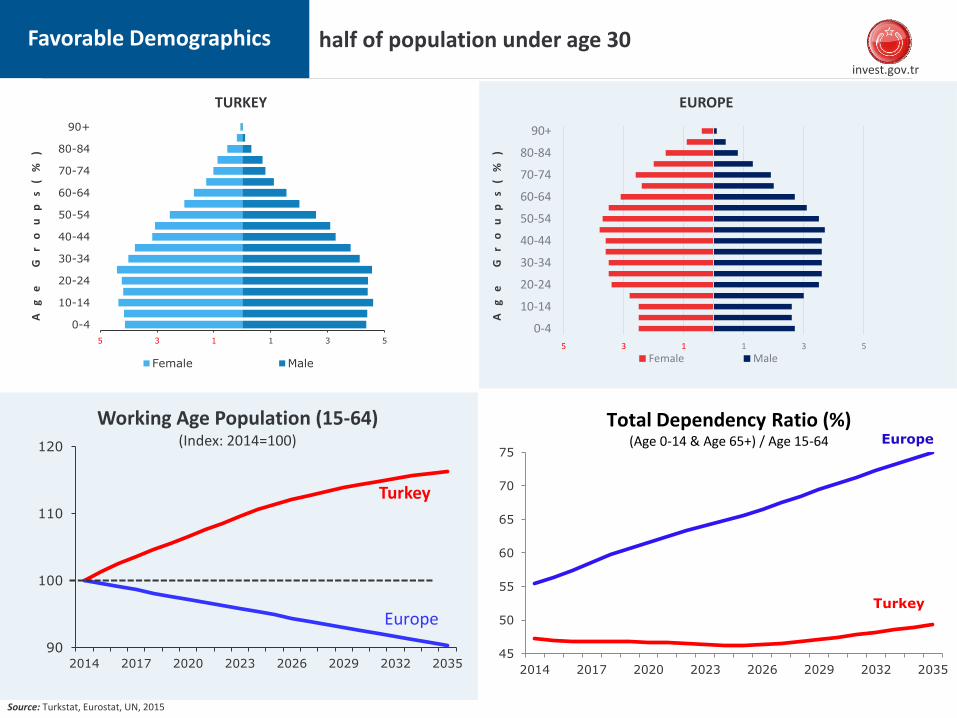
Working Age Population (15-64)(Index: 2014=100)
Europe
Turkey
Source: Turkstat, Eurostat, UN, 2015
Ag
e
Gr
ou
ps
(%
)
EUROPETURKEY
45
50
55
60
65
70
75
2014 2017 2020 2023 2026 2029 2032 2035
Total Dependency Ratio (%)(Age 0-14 & Age 65+) / Age 15-64 Europe
Turkey
half of population under age 30A
ge
G
ro
up
s(
%)
Favorable Demographics
invest.gov.tr
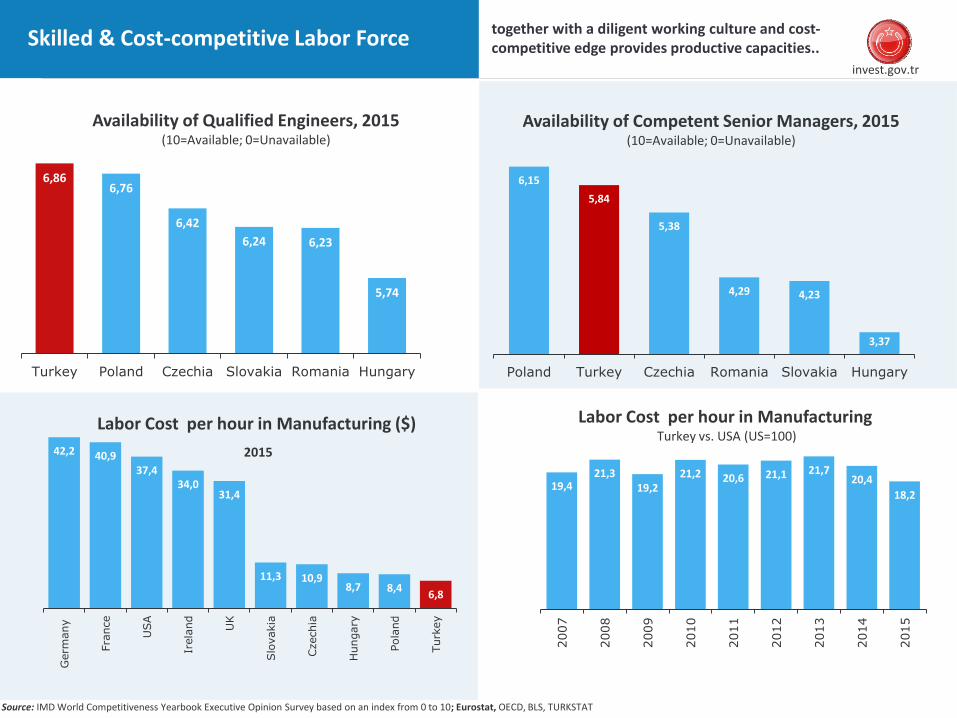
Source: IMD World Competitiveness Yearbook Executive Opinion Survey based on an index from 0 to 10; Eurostat, OECD, BLS, TURKSTAT
6,15
5,84
5,38
4,29 4,23
3,37
Poland Turkey Czechia Romania Slovakia Hungary
42,2 40,937,4
34,031,4
11,3 10,98,7 8,4
6,8
Germ
any
Fra
nce
USA
Irela
nd
UK
Slo
vakia
Czechia
Hungary
Pola
nd
Turk
ey
6,866,76
6,42
6,24 6,23
5,74
Turkey Poland Czechia Slovakia Romania Hungary
19,421,3
19,221,2 20,6 21,1 21,7
20,4
18,2
2007
2008
2009
2010
2011
2012
2013
2014
2015
together with a diligent working culture and cost-competitive edge provides productive capacities..
Availability of Qualified Engineers, 2015(10=Available; 0=Unavailable)
Labor Cost per hour in ManufacturingTurkey vs. USA (US=100)
Availability of Competent Senior Managers, 2015(10=Available; 0=Unavailable)
Labor Cost per hour in Manufacturing ($)
2015
Skilled & Cost-competitive Labor Force
invest.gov.tr
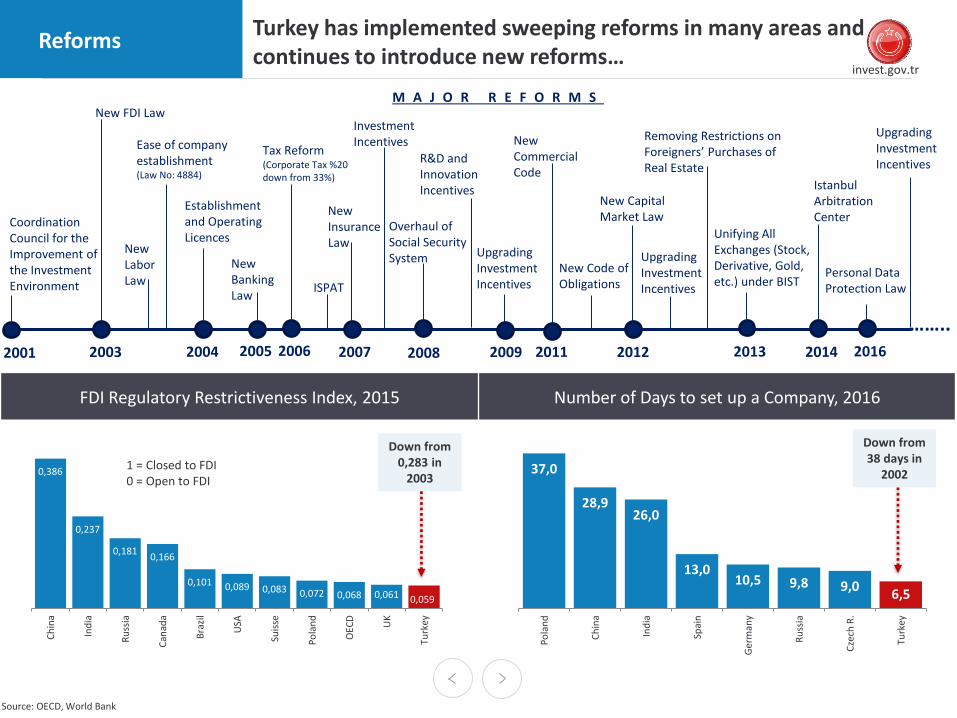
M A J O R R E F O R M S
Turkey has implemented sweeping reforms in many areas and continues to introduce new reforms…
Increasing use of English for business
Internationally-mindedpeople
Reforms
FDI Regulatory Restrictiveness Index, 2015 Number of Days to set up a Company, 2016
0,386
0,237
0,1810,166
0,101 0,089 0,083 0,072 0,068 0,061 0,059
Ch
ina
Ind
ia
Ru
ssia
Can
ada
Bra
zil
USA
Suis
se
Po
lan
d
OEC
D
UK
Turk
ey
1 = Closed to FDI 0 = Open to FDI
37,0
28,926,0
13,010,5 9,8 9,0
6,5
Po
lan
d
Ch
ina
Ind
ia
Spai
n
Ger
man
y
Ru
ssia
Cze
ch R
.
Turk
ey
Source: OECD, World Bank
Down from 38 days in
2002
2006
Tax Reform (Corporate Tax %20 down from 33%)
2003
New FDI Law
……..
ISPAT
2005
New Banking Law
2008
Overhaul of Social Security System
2011
New Commercial Code
New Code of Obligations
2012
New Capital Market Law
New Labor Law
2014
Istanbul Arbitration Center
Ease of company establishment (Law No: 4884)
Investment Incentives
R&D and Innovation Incentives
2009
Upgrading Investment Incentives
Upgrading Investment Incentives
2016
Upgrading Investment Incentives
Down from 0,283 in
2003
2007
New InsuranceLaw
Personal Data Protection Law
Establishment and Operating Licences
2004
Removing Restrictions on Foreigners’ Purchases of Real Estate
2013
Unifying All Exchanges (Stock,Derivative, Gold, etc.) under BIST
2001
Coordination Council for the Improvement of the Investment Environment
invest.gov.tr
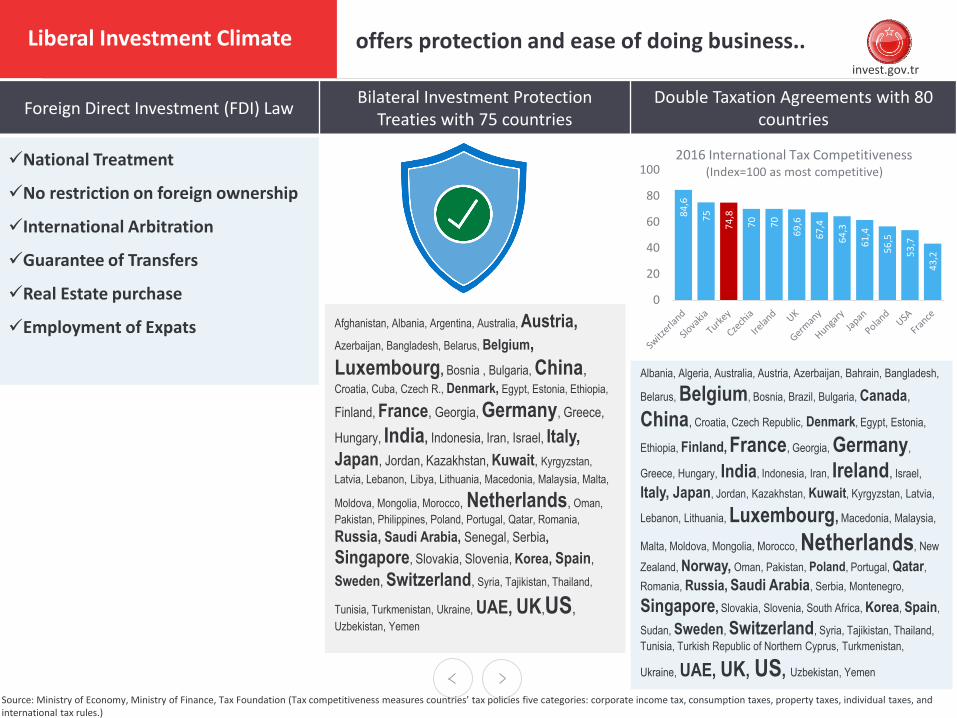
Foreign Direct Investment (FDI) Law Bilateral Investment Protection
Treaties with 75 countries Double Taxation Agreements with 80
countries
National Treatment
No restriction on foreign ownership
International Arbitration
Guarantee of Transfers
Real Estate purchase
Employment of Expats
offers protection and ease of doing business..
Source: Ministry of Economy, Ministry of Finance, Tax Foundation (Tax competitiveness measures countries’ tax policies five categories: corporate income tax, consumption taxes, property taxes, individual taxes, and international tax rules.)
Liberal Investment Climate
84
,6
75
74
,8
70
70
69
,6
67
,4
64
,3
61
,4
56
,5
53
,7
43
,2
0
20
40
60
80
1002016 International Tax Competitiveness
(Index=100 as most competitive)
Afghanistan, Albania, Argentina, Australia, Austria,
Azerbaijan, Bangladesh, Belarus, Belgium,
Luxembourg, Bosnia , Bulgaria, China,Croatia, Cuba, Czech R., Denmark, Egypt, Estonia, Ethiopia,
Finland, France, Georgia, Germany, Greece,
Hungary, India, Indonesia, Iran, Israel, Italy,
Japan, Jordan, Kazakhstan, Kuwait, Kyrgyzstan,
Latvia, Lebanon, Libya, Lithuania, Macedonia, Malaysia, Malta,
Moldova, Mongolia, Morocco, Netherlands, Oman,
Pakistan, Philippines, Poland, Portugal, Qatar, Romania,
Russia, Saudi Arabia, Senegal, Serbia,
Singapore, Slovakia, Slovenia, Korea, Spain,
Sweden, Switzerland, Syria, Tajikistan, Thailand,
Tunisia, Turkmenistan, Ukraine, UAE, UK,US,Uzbekistan, Yemen
Albania, Algeria, Australia, Austria, Azerbaijan, Bahrain, Bangladesh,
Belarus, Belgium, Bosnia, Brazil, Bulgaria, Canada,
China, Croatia, Czech Republic, Denmark, Egypt, Estonia,
Ethiopia, Finland, France, Georgia, Germany,
Greece, Hungary, India, Indonesia, Iran, Ireland, Israel,
Italy, Japan, Jordan, Kazakhstan, Kuwait, Kyrgyzstan, Latvia,
Lebanon, Lithuania, Luxembourg, Macedonia, Malaysia,
Malta, Moldova, Mongolia, Morocco, Netherlands, New
Zealand, Norway, Oman, Pakistan, Poland, Portugal, Qatar,
Romania, Russia, Saudi Arabia, Serbia, Montenegro,
Singapore, Slovakia, Slovenia, South Africa, Korea, Spain,
Sudan, Sweden, Switzerland, Syria, Tajikistan, Thailand,
Tunisia, Turkish Republic of Northern Cyprus, Turkmenistan,
Ukraine, UAE, UK, US, Uzbekistan, Yemen
invest.gov.tr
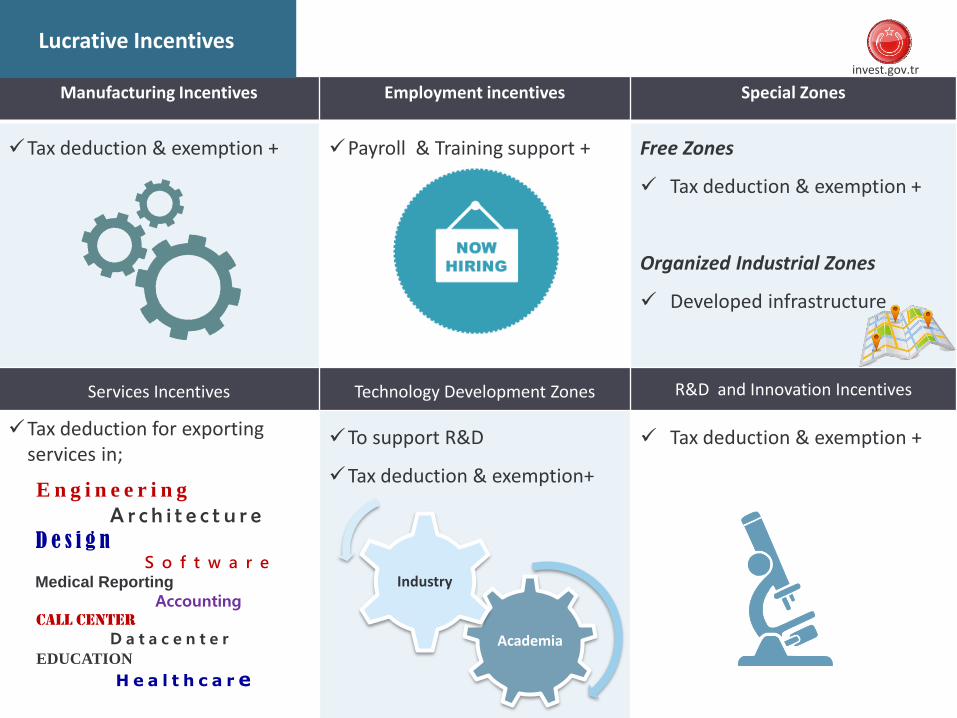
Manufacturing Incentives Employment incentives Special Zones
Tax deduction & exemption + Payroll & Training support + Free Zones
Tax deduction & exemption +
Organized Industrial Zones
Developed infrastructure
Services Incentives Technology Development Zones R&D and Innovation Incentives
Tax deduction for exporting services in;
E n g i n e e r i n g
A r c h i t e c t u r eD e s i g n
S o f t w a r eMedical Reporting
AccountingCall Center
D a t a c e n t e rEDUCATION
H e a l t h c a r e
To support R&D
Tax deduction & exemption+
Tax deduction & exemption +
Academia
Industry
Lucrative Incentives
invest.gov.tr
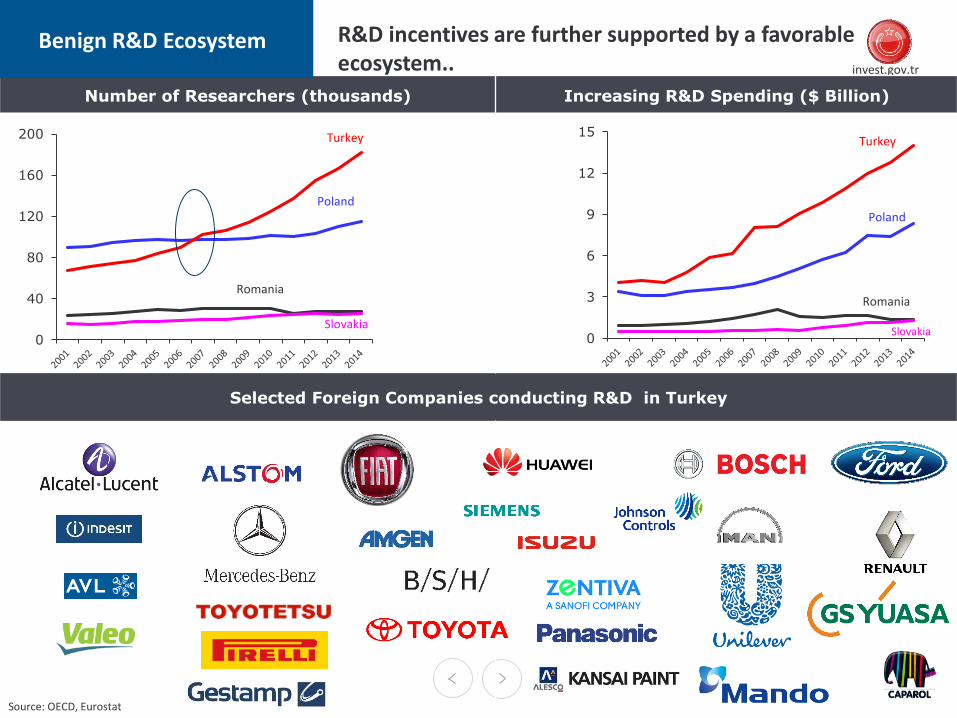
Number of Researchers (thousands) Increasing R&D Spending ($ Billion)
Selected Foreign Companies conducting R&D in Turkey
Source: OECD, Eurostat
0
3
6
9
12
15Turkey
Slovakia
Romania
Poland
0
40
80
120
160
200 Turkey
Slovakia
Romania
Poland
R&D incentives are further supported by a favorable ecosystem..
Benign R&D Ecosystem
invest.gov.tr
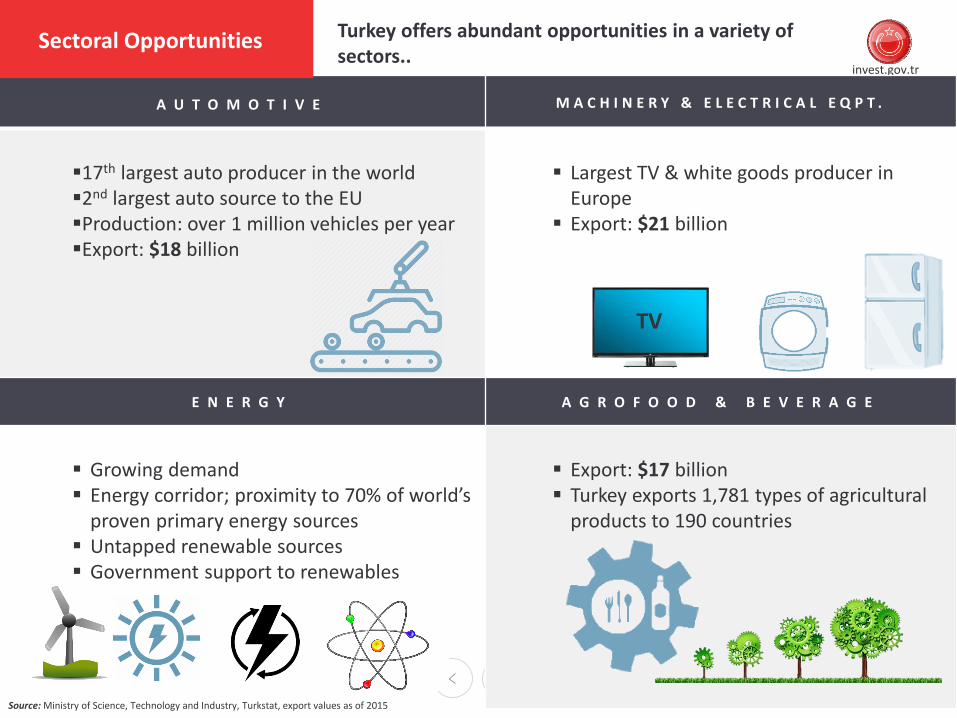
A U T O M O T I V E M A C H I N E R Y & E L E C T R I C A L E Q P T .
17th largest auto producer in the world2nd largest auto source to the EUProduction: over 1 million vehicles per yearExport: $18 billion
Largest TV & white goods producer in Europe
Export: $21 billion
E N E R G Y A G R O F O O D & B E V E R A G E
Growing demand Energy corridor; proximity to 70% of world’s
proven primary energy sources Untapped renewable sources Government support to renewables
Export: $17 billion Turkey exports 1,781 types of agricultural
products to 190 countries
Source: Ministry of Science, Technology and Industry, Turkstat, export values as of 2015
Turkey offers abundant opportunities in a variety of sectors..
Sectoral Opportunities
TV
invest.gov.tr
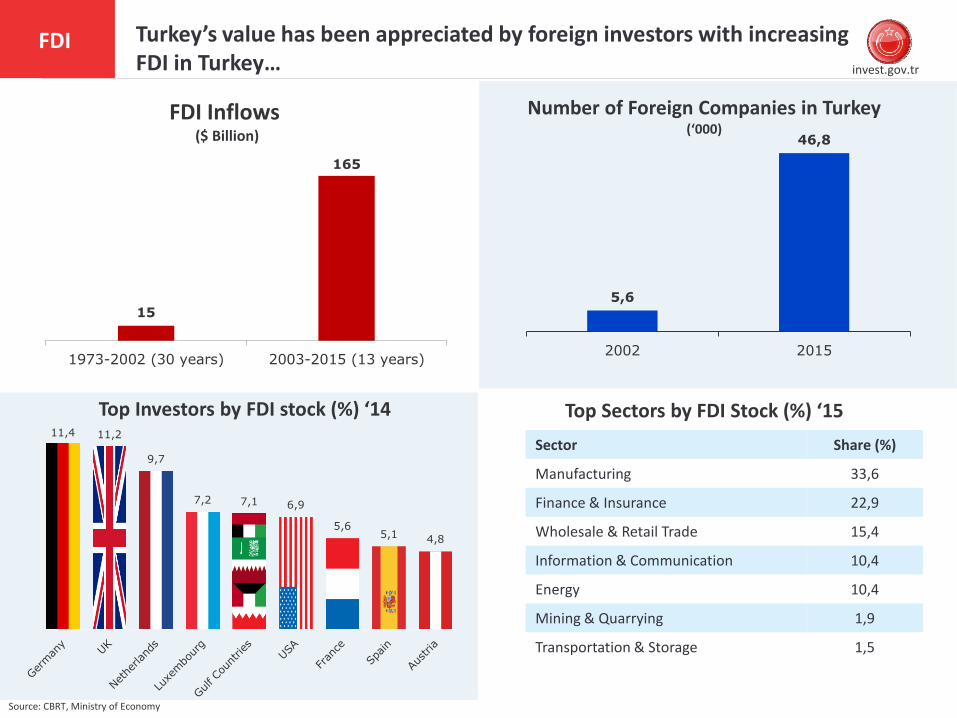
Source: CBRT, Ministry of Economy
Turkey’s value has been appreciated by foreign investors with increasing FDI in Turkey…
15
165
1973-2002 (30 years) 2003-2015 (13 years)
FDI Inflows ($ Billion)
Number of Foreign Companies in Turkey (‘000)
5,6
46,8
2002 2015
Top Sectors by FDI Stock (%) ‘15
Sector Share (%)
Manufacturing 33,6
Finance & Insurance 22,9
Wholesale & Retail Trade 15,4
Information & Communication 10,4
Energy 10,4
Mining & Quarrying 1,9
Transportation & Storage 1,5
FDI
Top Investors by FDI stock (%) ‘1411,4 11,2
9,7
7,2 7,1 6,9
5,65,1 4,8
invest.gov.tr
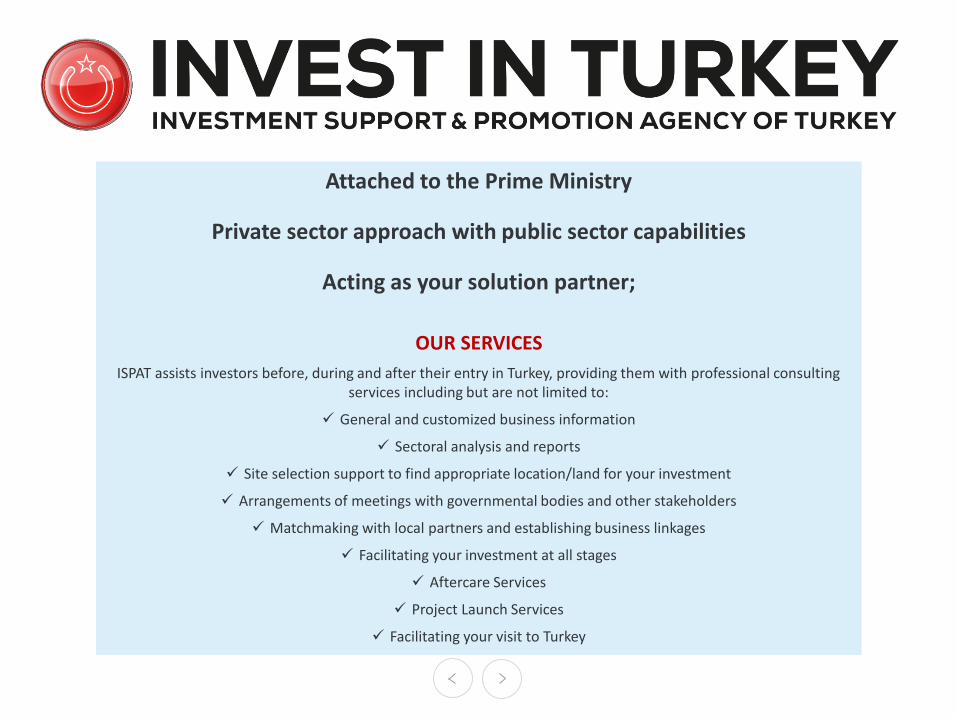
Attached to the Prime Ministry
Private sector approach with public sector capabilities
Acting as your solution partner;
OUR SERVICES
ISPAT assists investors before, during and after their entry in Turkey, providing them with professional consulting services including but are not limited to:
General and customized business information
Sectoral analysis and reports
Site selection support to find appropriate location/land for your investment
Arrangements of meetings with governmental bodies and other stakeholders
Matchmaking with local partners and establishing business linkages
Facilitating your investment at all stages
Aftercare Services
Project Launch Services
Facilitating your visit to Turkey
invest.gov.tr
THANK YOU!
invest.gov.tr