Embed Size (px)
DESCRIPTION
Citation preview

2004 Annual Report
local presenceglobal reach
Fueling Relationships Around The World

World Fuel Services is a global leader in the downstream
marketing and financing of aviation and marine fuel
products and related services. As the marketer of choice in the
aviation and shipping industries, World Fuel Services provides
fuel and services at more than 2,500 airports and seaports
worldwide. With 42 offices strategically located throughout the
world, World Fuel Services offers its customers a value-added
outsource service for the supply, quality control, logistical support
and price risk management of marine and aviation fuel.
Our mission is to sustain long-term, profitable growth for
shareholders and maintain a global leadership position in the
downstream marketing and financing of aviation and marine fuel
products and related services. We will accomplish this by providing
exceptional service and value to customers and suppliers and main-
taining a corporate environment that provides employees with
opportunities for personal and professional advancement.
corporate overview
mission statement
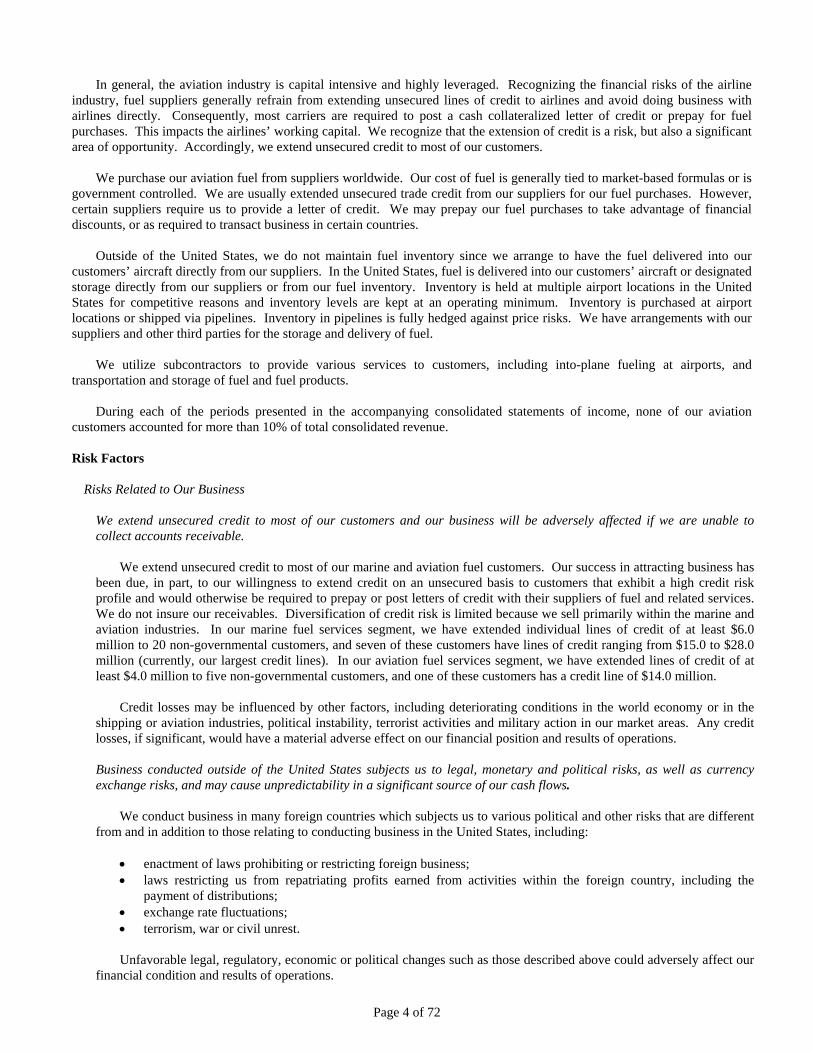
’04’03 ’04’03
$2,671.6
$5,654.4
$22.2
$28.6
Revenue(in millions)
Net Income(in millions)
’04’03 ’04’03
$400.9
$712.2
$149.7
$188.5
Total Assets(in millions)
Stockholders’ Equity(in millions)
Revenue(in millions)
Income FromOperations
As of, and for the As of, and for theAs of, and for the Year Year Ended Nine Months EndedEnded December 31, December 31, December 31,
2004 2003* Change 2002* 2002*
(In thousands, except diluted earnings per share data and financial ratios) (Unaudited)
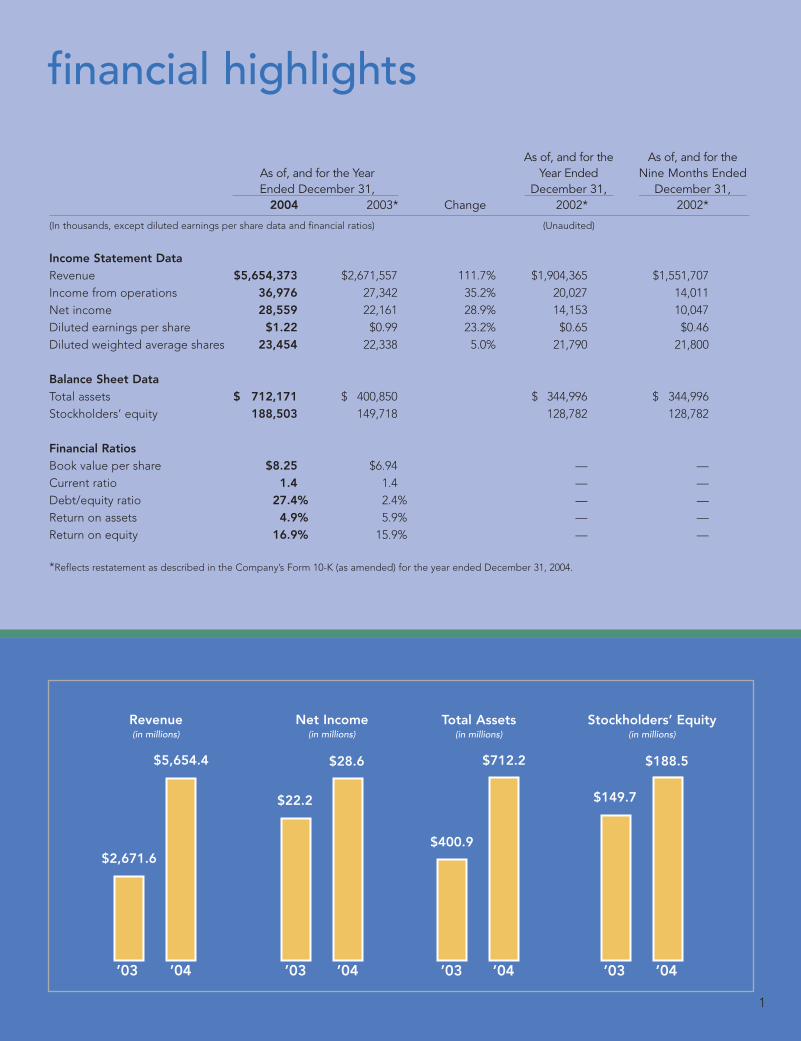
Income Statement DataRevenue $5,654,373 $2,671,557 111.7% $1,904,365 $1,551,707Income from operations 36,976 27,342 35.2% 20,027 14,011Net income 28,559 22,161 28.9% 14,153 10,047Diluted earnings per share $1.22 $0.99 23.2% $0.65 $0.46Diluted weighted average shares 23,454 22,338 5.0% 21,790 21,800
Balance Sheet DataTotal assets $ 712,171 $ 400,850 $ 344,996 $ 344,996Stockholders’ equity 188,503 149,718 128,782 128,782
Financial RatiosBook value per share $8.25 $6.94 — —Current ratio 1.4 1.4 — —Debt/equity ratio 27.4% 2.4% — —Return on assets 4.9% 5.9% — —Return on equity 16.9% 15.9% — —
*Reflects restatement as described in the Company’s Form 10-K (as amended) for the year ended December 31, 2004.
financial highlights
1

2004 was a great year in every area of our business and wewere very pleased with the results. Our global team hasdelivered strong financial performance for our shareholders
and made tremendous progress in advancing our business modelin every industry segment and in every region of the world. We areexcited about the prospects for further growth and we believe weare well positioned for 2005.
For The Year 2004:For 2004, total revenue for the Company was $5.7 billion, anincrease of $3.0 billion, or 112%, versus 2003. The revenueincrease was a result of both growth in volume and increasedprices. Diluted earnings per share increased by 23% from $0.99 to$1.22. The per share results have been adjusted to reflect the two-for-one stock split that became effective February 1, 2005. Ourexcellent 2004 performance propels World Fuel Services into2005 with strong business momentum.
Financial Strengths:The Company is anchored by a solid balance sheet. At December 31,2004, our cash balance was $64 million, with working capital of$181 million and shareholders’ equity of $189 million. Assetsmanaged by the Company exceeded $712 million. In Septemberof 2004, our $100 million revolving credit facility was increased to$150 million and the syndicate now includes LaSalle Bank, HSBC,
Merrill Lynch, JPMorganChase, Israeli Discount Bank,Commercebank N.A., Regions Bank and the InternationalBank of Miami.
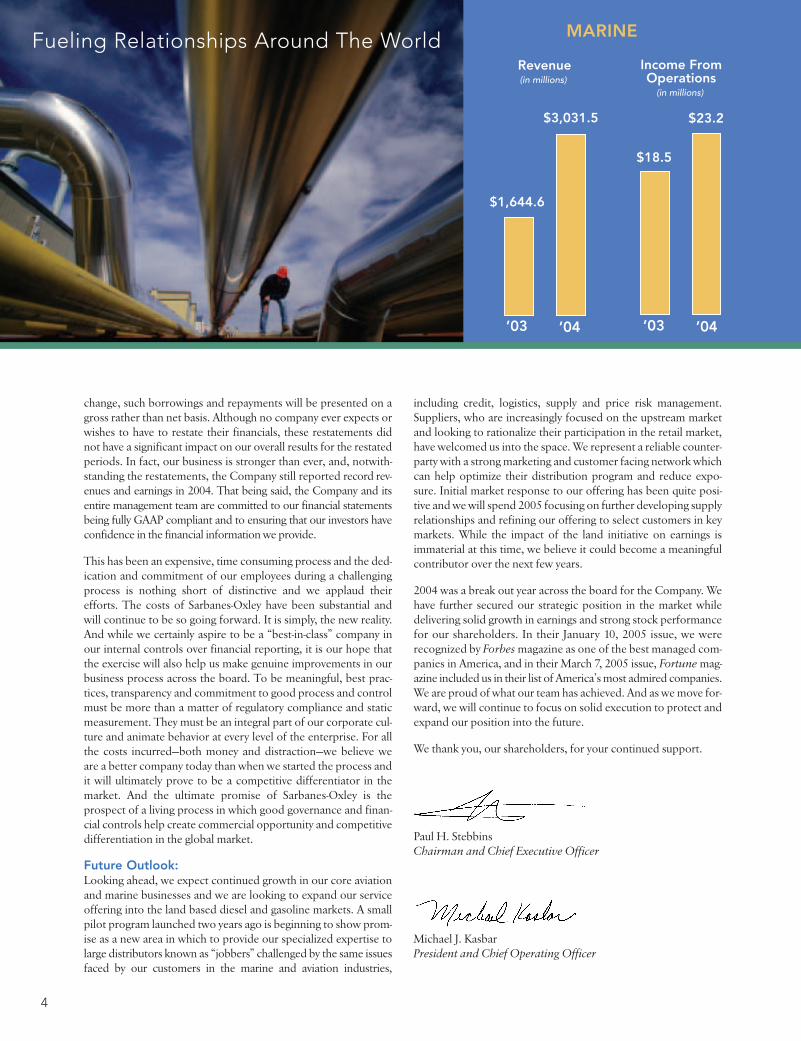
Marine Business:The results for our marine segment improved significantly in 2004reflecting increased volume and improved margins across all mar-ket segments. A strong supply position, new account acquisitionand a healthy operating environment for the shipping industry allcontributed to the strong result. The acquisition of the TrampGroup of companies represented a major success and the finan-cial and commercial integration of Tramp is yielding good results.We reorganized our global marine management team in an effortto put our key commercial leaders in a position to better drive theoverall commercial result. They have demonstrated great leader-ship and stepped up our global marketing which has been success-ful in securing a number of new accounts as well as new volumefrom existing accounts in the United States, Europe and the FarEast. Our supply specialization initiative has enabled us to consoli-date our purchasing in a number of major markets and strengthenour supply relationships. The shipping industry reported recordresults in 2004 and the prospects are good for a strong market inthe near term. In 2005, we will be focused on execution and con-tinued improvement in our service offering. Spot and contract pur-chasing, port arbitrage, forward purchasing, fuel quality control,
To Our Shareholders:
Fueling Relationships Around The World
local presenceglobal reach
2
Paul H. StebbinsChairman andChief Executive Officer
Michael J. KasbarPresident andChief Operating Officer

logistics and operational support all feature in our value propositionto global customers in the supply and purchasing communities.
Aviation Business:In our aviation segment, 2004 was a year of continued successacross the spectrum. By continuing to diversify our portfolio, wehave continued to diversify our exposure to risk in any one seg-ment of the market. We achieved growth in each of our key targetmarkets: passenger, cargo, charter, corporate and military. And inspite of high oil prices and the much publicized financial woes ofthe U.S. flag carriers, many parts of the market remain buoyantwith robust activity in U.N. charters, relief flights, global cargomovements, military activity and corporate travel. Our largest cen-ters of activity—the United States, United Kingdom, andSingapore—all posted strong results and we were pleased to seebetter-than-expected results from our smaller satellite offices inColombia and Russia. After eight years of developing our positionin China, we opened an office in Beijing on March 1, 2005. Thedirector of our newest office is the former director of fuel procure-ment for Air China and is highly regarded in the international avia-tion community. We have learned from our marine business thathaving local representation in China is important to the businessmodel and we are excited about the prospects for growth in thisenormous emerging market.
On the services and logistics front, we continue to refine anddevelop our business model in fuel management and expectgrowth in this area in 2005. Our overall volume has grown as wecontinue to demonstrate our ability to add value to our supply andpurchasing partners in a growing number of key markets. With thecontinuing changes in the industry, our supply partners are work-ing with us more closely to aggregate demand, de-risk their port-folios and enhance their global marketing. This has significantlyraised our profile with the purchasing community. In the mostrecent Armbrust survey of 71 global airlines, World Fuel Serviceswas ranked the best regional jet fuel marketer in North America.Our team achieved high marks for best staff, best organizationalstructure, most innovative, best informed and most improved.This public validation of our service offering is a much deserved trib-ute to our global team and what they have done to firmly establish
World Fuel Services as a global leader in the fuel services business.We see tremendous promise in this area and have hired awell-known industry expert to develop sales and supplyalliances with large fleets.
One of our most exciting areas of growth has been in the corpo-rate space. We continue to focus on large aircraft and fractionalfleets and in 2004 entered into fuel procurement agreements withSentient Jets and Delta Air Elite. Both programs are off to a greatstart. Baseops, our flight services business, had its best year everand our alliance with Jeppesen has resulted in over 500 new fuelcustomers. We have achieved global acceptance of our brand andfirmly established World Fuel Services as the leading fuel solutionsprovider for general aviation.
Accounting Changes/Sarbanes-Oxley:Our greatest challenge in 2004 had nothing to do with our busi-ness strategy or the commercial operating environment, butrather with accounting protocol and Section 404 of Sarbanes-Oxley. In March and May of 2005, we announced that theCompany’s historical financial statements would need to berestated and that as a result of such restatement managementwould conclude that the Company had three material weaknessesin its internal controls over financial reporting. The restatementand associated material weaknesses were directly attributable tothree required changes in our accounting. The first of thesechanges related to the timing of when we recognize revenue. As aresult of this change, sales and sales-related costs will be recordedbased on the date fuel or related services are delivered, asopposed to the date related documentation is received from ourthird party service providers as had been our prior practice. Thiswill require us to make estimates going forward. The secondchange related to how we account for inventory derivatives.Under the changed protocol, unrealized gains and losses relatingto inventory derivatives will be recorded in the statements ofincome as opposed to the balance sheet. These unrealized gainsor losses will ultimately be offset with the profit or loss on prod-uct sales in future periods. The third and last change related to thepresentation of borrowings and repayments under our revolvingcredit facility in the statement of cash flows. As a result of this
3
’04’03 ’04’03
$2,671.6
$5,654.4
$22.2
$28.6
Revenue(in millions)
Net Income(in millions)
’04’03 ’04’03
$400.9
$712.2
$149.7
$188.5
Total Assets(in millions)
Stockholders’ Equity(in millions)
0
500
1000
1500
2000
2500
3000
0
5
10
15
20
25
30
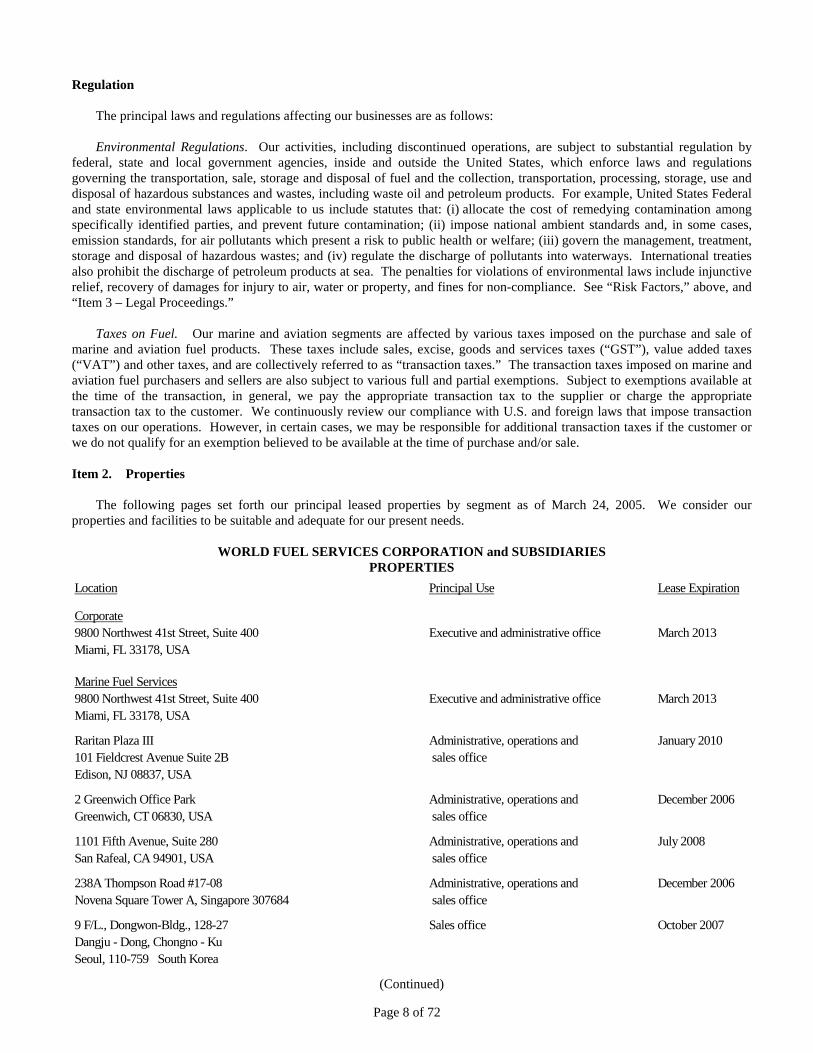
’04’03
$1,027.0
$2,622.9
Revenue(in millions)
Income FromOperations
(in millions)
’04’03
$22.0
$29.1
0
500
1000
1500
2000
2500
3000
3500
0
5
10
15
20
25
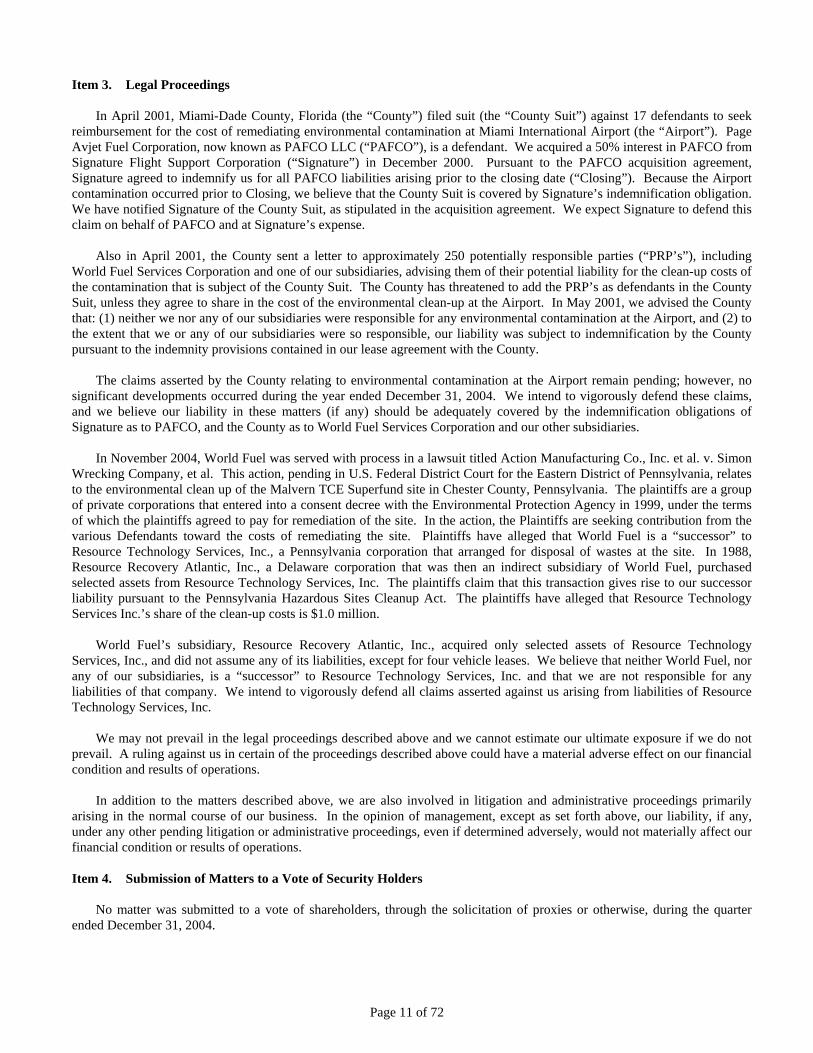
’04’03
$1,644.6
$3,031.5
Revenue(in millions)
Income FromOperations
(in millions)
’04’03
$18.5
$23.2
’04’03 ’04’03
$2,671.6
$5,654.4
$22.2
$28.6
Revenue(in millions)
Net Income(in millions)
’04’03 ’04’03
$400.9
$712.2
$149.7
$188.5
Total Assets(in millions)
Stockholders’ Equity(in millions)
0
500
1000
1500
2000
2500
3000
0
5
10
15
20
25
30
’04’03
$1,027.0
$2,622.9
Revenue(in millions)
Income FromOperations
(in millions)
’04’03
$22.0
$29.1
0
500
1000
1500
2000
2500
3000
3500
0
5
10
15
20
25
’04’03
$1,644.6
$3,031.5
Revenue(in millions)
Income FromOperations
(in millions)
’04’03
$18.5
$23.2
AVIATION
change, such borrowings and repayments will be presented on agross rather than net basis. Although no company ever expects orwishes to have to restate their financials, these restatements didnot have a significant impact on our overall results for the restatedperiods. In fact, our business is stronger than ever, and, notwith-standing the restatements, the Company still reported record rev-enues and earnings in 2004. That being said, the Company and itsentire management team are committed to our financial statementsbeing fully GAAP compliant and to ensuring that our investors haveconfidence in the financial information we provide.
This has been an expensive, time consuming process and the ded-ication and commitment of our employees during a challengingprocess is nothing short of distinctive and we applaud theirefforts. The costs of Sarbanes-Oxley have been substantial andwill continue to be so going forward. It is simply, the new reality.And while we certainly aspire to be a “best-in-class” company inour internal controls over financial reporting, it is our hope thatthe exercise will also help us make genuine improvements in ourbusiness process across the board. To be meaningful, best prac-tices, transparency and commitment to good process and controlmust be more than a matter of regulatory compliance and staticmeasurement. They must be an integral part of our corporate cul-ture and animate behavior at every level of the enterprise. For allthe costs incurred—both money and distraction—we believe weare a better company today than when we started the process andit will ultimately prove to be a competitive differentiator in themarket. And the ultimate promise of Sarbanes-Oxley is theprospect of a living process in which good governance and finan-cial controls help create commercial opportunity and competitivedifferentiation in the global market.
Future Outlook:Looking ahead, we expect continued growth in our core aviationand marine businesses and we are looking to expand our serviceoffering into the land based diesel and gasoline markets. A smallpilot program launched two years ago is beginning to show prom-ise as a new area in which to provide our specialized expertise tolarge distributors known as “jobbers” challenged by the same issuesfaced by our customers in the marine and aviation industries,
including credit, logistics, supply and price risk management.Suppliers, who are increasingly focused on the upstream marketand looking to rationalize their participation in the retail market,have welcomed us into the space. We represent a reliable counter-party with a strong marketing and customer facing network whichcan help optimize their distribution program and reduce expo-sure. Initial market response to our offering has been quite posi-tive and we will spend 2005 focusing on further developing supplyrelationships and refining our offering to select customers in keymarkets. While the impact of the land initiative on earnings isimmaterial at this time, we believe it could become a meaningfulcontributor over the next few years.
2004 was a break out year across the board for the Company. Wehave further secured our strategic position in the market whiledelivering solid growth in earnings and strong stock performancefor our shareholders. In their January 10, 2005 issue, we wererecognized by Forbes magazine as one of the best managed com-panies in America, and in their March 7, 2005 issue, Fortune mag-azine included us in their list of America’s most admired companies.We are proud of what our team has achieved. And as we move for-ward, we will continue to focus on solid execution to protect andexpand our position into the future.
We thank you, our shareholders, for your continued support.
Paul H. StebbinsChairman and Chief Executive Officer
Michael J. KasbarPresident and Chief Operating Officer
MARINEFueling Relationships Around The World
4
’04’03 ’04’03
$2,671.6
$5,654.4
$22.2
$28.6
Revenue(in millions)
Net Income(in millions)
’04’03 ’04’03
$400.9
$712.2
$149.7
$188.5
Total Assets(in millions)
Stockholders’ Equity(in millions)
0
500
1000
1500
2000
2500
3000
0
5
10
15
20
25
30
’04’03
$1,027.0
$2,622.9
Revenue(in millions)
Income FromOperations
(in millions)
’04’03
$22.0
$29.1
0
500
1000
1500
2000
2500
3000
3500
0
5
10
15
20
25
’04’03
$1,644.6
$3,031.5
Revenue(in millions)
Income FromOperations
(in millions)
’04’03
$18.5
$23.2
’04’03 ’04’03
$2,671.6
$5,654.4
$22.2
$28.6
Revenue(in millions)
Net Income(in millions)
’04’03 ’04’03
$400.9
$712.2
$149.7
$188.5
Total Assets(in millions)
Stockholders’ Equity(in millions)
0
500
1000
1500
2000
2500
3000
0
5
10
15
20
25
30
’04’03
$1,027.0
$2,622.9
Revenue(in millions)
Income FromOperations
(in millions)
’04’03
$22.0
$29.1
0
500
1000
1500
2000
2500
3000
3500
0
5
10
15
20
25
’04’03
$1,644.6
$3,031.5
Revenue(in millions)
Income FromOperations
(in millions)
’04’03
$18.5
$23.2

Board of Directors
Paul H. StebbinsChairman and Chief Executive OfficerWorld Fuel Services Corporation
Michael J. KasbarPresident and Chief Operating OfficerWorld Fuel Services Corporation
Ken BakshiMember of the Compensation Committee andGovernance CommitteeChief Executive OfficerRow 2 Technologies (Software Development)
John R. BenbowChairman of the Compensation Committee andGovernance CommitteeMember of the Audit CommitteeSelf-employed, Construction Management ConsultantFormerly President, Benbow & Associates, Inc.(Construction Management)
Richard A. KassarMember of the Audit Committee andGovernance CommitteeSenior Vice President and Chief FinancialOfficer, The Meow Mix Company (Consumer Products)
Myles KleinMember of the Audit Committee andGovernance CommitteePrincipal, Myles Klein, P.A.(Certified Public Accountants)
J. Thomas PresbyChairman of the Audit Committee andMember of the Governance CommitteeRetired Partner, Deloitte & Touche Tohmatsu(Certified Public Accountants)
Jerome SidelMember of the Compensation Committee andGovernance CommitteePresident, New York Store Leasing, Inc.(Services)
Corporate Headquarters
World Fuel Services Corporation9800 Northwest 41st Street, Suite 400Miami, Florida 33178Telephone: (305) 428-8000Fax: (305) 392-5621Website: www.worldfuel.com
Annual Meeting
The Annual Meeting is to be heldJune 20, 2005 at 11:00 a.m. at theCompany’s corporate headquarters.
Executive Officers
Paul H. StebbinsChairman and Chief Executive OfficerWorld Fuel Services Corporation
Michael J. KasbarPresident and Chief Operating OfficerWorld Fuel Services Corporation
Francis X. SheaExecutive Vice President andChief Risk and Administrative OfficerWorld Fuel Services Corporation
Robert S. TocciExecutive Vice President andChief Financial OfficerWorld Fuel Services Corporation
Michael S. ClementiPresident and Chief Operating OfficerWorld Fuel Services, Inc.
Legal Counsel
R. Alexander Lake, Jr.General Counsel and Corporate SecretaryWorld Fuel Services Corporation
Shutts & Bowen LLPMiami, Florida
IndependentPublic Accountants
PricewaterhouseCoopers LLPMiami, Florida
Stock Listing
Common Stock is traded on the New York Stock Exchange (NYSE) under the symbol: INT
Transfer Agent and Registrar
For change of address, lost stock certificatesand other stock certificate-related inquiries,please contact:
American Stock Transfer & Trust Company59 Maiden LaneNew York, New York 10038Telephone: (800) 937-5449Telephone: (718) 921-8124Fax: (718) 236-2641Website: www.amstock.com
Stockholder Inquiries
For copies of the Company’s recent newsreleases and Securities and ExchangeCommission (SEC) filings, including Forms10-K and 10-Q, free of charge, please contact:
Investor RelationsAlexander Garcia Senior Vice President of M&A andFinancial PlanningWorld Fuel Services CorporationTelephone: (305) 428-8064Fax: (305) 392-5621e-mail: [email protected]
[email protected] RelationsAllen & Caron Inc.156 Fifth Avenue, Suite 934New York, New York 10010Telephone: (212) 691-8087Fax: (212) 691-8116e-mail: [email protected]
For copies of materials filed by the Companywith the SEC, please contact:
SEC’s Public Reference Room450 Fifth Street, N.W.Washington, D.C. 20549Telephone: (800) SEC-0330
The SEC also maintains a website of materialselectronically filed by the Company, such asreports, proxy and information statements,and other information, at www.sec.gov.
CORPORATE INFORMATION
Sarbanes Oxley and NYSE Officer Certifications
Pursuant to Section 303A.12(a) of the New York Stock Exchange (“NYSE”) listing standards,on June 24, 2004 our Chief Executive Officer filed with the NYSE the annual certificationstating that he was not aware of any violation by World Fuel of the corporate governance list-ing standards of the NYSE. In addition, our annual report on Form 10-K for the year endedDecember 31, 2004 includes the certifications required by Section 302 of the Sarbanes OxleyAct of 2002, signed by our Chief Executive Officer, Chief Operating Officer, Chief FinancialOfficer and Chief Risk and Administrative Officer.

United States9800 N.W. 41st Street, Suite 400Miami, Florida 33178Telephone: (305) 428-8000Fax: (305) 392-5621
333 Cypress Run, Suite 200Houston, Texas 77094Telephone: (281) 556-2400Fax: (281) 556-2557
4995 East Anderson AvenueFresno, California 93727Telephone: (559) 252-7140Fax: (559) 252-7180
201 S. Orange Avenue, Suite 1575Orlando, Florida 32801Telephone: (407) 206-5300Fax: (407) 206-5369
6011 West Tree DriveAnchorage, Alaska 99507Telephone: (907) 346-4419Fax: (907) 346-4421
325 North RoadSenoia, Georgia 30276Telephone: (770) 599-3162Fax: (770) 599-1370
United KingdomKingfisher House, Northwood ParkGatwick Road, CrawleyWest Sussex, RH10 2XN,United KingdomTelephone: 44 1293 400333 (World Fuel)Fax: 44 1293 404333 (World Fuel)Telephone: 44 1293 400777 (Baseops)Telephone: 44 1293 400888 (AirData)Fax: 44 1293 400666 (AirData)
Singapore238A Thompson Road #17-08Novena Square Tower A,Singapore 307684Telephone: 65 6256 3166Fax: 65 6356 3166
Costa RicaOficentro Ejecutivo La Sabana SurEdificio #7, Piso 2San Jose, Costa RicaTelephone: 506 296 4328Fax: 506 296 4338
MexicoAvenida Fuerza Aerea Mexicana #465, Colonia Federal15700 Mexico, D.F.Telephone: 52 55 717 812Fax: 52 55 717 818
ColombiaCalle 93B No. 11A-33, oficina 303Bogota, ColombiaTelephone: 57 1 618 4858Fax: 57 1 618 4857
RussiaSlavjanskaya Business Ctr, 8th Fl.Europe Square 2, Moscow 121059Russian FederationTelephone: 7 095 941 8640Fax: 7 095 941 8639
ChinaRoom 906, Building 113Shaoyaojubelli,Chao Yang DistrictBeijing, China
BrazilAv Rio Branco 181/3004Rio de Janeiro, Brazil 20040 007
MARINE FUEL SERVICES DIRECTORY OF OFFICES
AVIATION FUEL SERVICES DIRECTORY OF OFFICES
United States9800 N.W. 41st Street, Suite 400Miami, Florida 33178Telephone: (305) 428-8000Fax: (305) 392-5621
Raritan Plaza III101 Fieldcrest Avenue, Suite 2BEdison, New Jersey 08837Telephone: (732) 623-2400Fax: (732) 623-2401
2 Greenwich Office ParkGreenwich, Connecticut 06830Telephone: (203) 863-0001Fax: (203) 863-0055
1101 Fifth Avenue, Suite 280San Rafael, California 94901Telephone: (415) 925-1995Fax: (415) 925-1998
5825 Osceola RoadBethesda, Maryland 20816Telephone: (301) 229-9826Fax: (301) 229-9827
Singapore238A Thomson Road #17-08Novena Square Tower A,Singapore 307684Telephone: 65 6215 6999Fax: 65 6215 6902
70 Sheraton Way #17-01AMarina House, Singapore 79118Telephone: 00 65 6 221255Fax: 00 65 6 2270420
South Korea9 F/L., Dongwon-Bldg., 128-27Dangju-Dong, Chongno-KuSeoul, Korea 110-759Telephone: 822 739-0437Fax: 822 739-0599
ChinaNo. 1 Pudong AvenueMarine Tower, Room 1206Shanghai, China 200120Telephone: 86 21 6886 0671Fax: 86 21 6886 1547
Hong KongYam Tze Commercial Bldg.Unit A, 18th Floor23 Thomson RoadWanchai, Hong KongTelephone: 852 2520-0157Fax: 852 2865-1700
Japan4th Floor, Tozan Building, 4-4-2Nihonbashi Hon-Cho, Chuo-KuTokyo, Japan 103-0023Telephone: 81 3 3245 0379Fax: 81 3 3245 0389
United KingdomWestminster Tower3 Albert EmbankmentLondon SE1 7SP, United Kingdom Telephone: 44 207 840 2222Fax: 44 207 840 2233
15-17 Elmfield RoadBromley, Kent BR1 1LTUnited KingdomTelephone: 44 2083 157777Fax: 44 20 8315 7788
7 Priory Tee ParkSaxon Park, Saxon WayHessle, HullEast Yorkshire HU13 9PB, EnglandTelephone: 44 1482 629669Fax: 44 1482 629691
DenmarkGammelbyved 2Karise, Denmark 4653Telephone: 45 5678 8200Fax: 45 5678 8222
GermanyBremer 2, D-28816 StuhrBremen, GermanyTelephone: 49 421 165 610Fax: 49 421 165 6161
NorwayNiels Juels Gate 11BOslo 0272, NorwayTelephone: 47 2308-6780Fax: 47 2308-6799
NetherlandsVasteland 63011 BK Rotterdam, NetherlandsTelephone: 31 10 4000-888Fax: 31 10 4117-593
GreecePoseidonos 60 Avenue, Third FloorGlyfada 166-75Athens, GreeceTelephone: 30 10-898-5920 Fax: 30 10-898-5680
United Arab EmiratesAl Moosa Tower 2, Suite 904Sheikh Zayed Road,P.O. Box 24676Dubai, United Arab EmiratesTelephone: 971 4-331-0400Fax: 971 4-331-0078
TurkeyYener Sok, Ayaz Apr No. 123D-3 Erenkoy,Istanbul, TurkeyTelephone: 90 216 411 4127Fax: 90 216 411 4160
Russia34 ap. 3 Georgiy DimitrovStr 236000Kaliningrad, RussiaTelephone: 7 011 255 1036Fax: 7 011 255 5150
South AfricaThe Foundry, 4th Floor, Unit 1Cardiff Road,Green Point, South Africa 8001Telephone: 27 21 425 4443Fax: 27 21 425 4052
Costa RicaOficentro Ejecutivo La Sabana SurEdificio #7, Piso 2San Jose, Costa RicaTelephone: 506 220 0716Fax: 506 290 0893
ChileAvenida Libertad 798, Suite 301Vina del Mar, ChileTelephone: 56 32 460 155Fax: 56 32 460 105
BrazilAv Rio Branco 181/3004Rio de Janeiro, Brazil 20040 007 Telephone: 55 2125 792118Fax: 55 21 25 279574
ArgentinaTucuman 373 Pis 3, 1049 CFBuenos Aires, ArgentinaTelephone: 54 11 4312 2600Fax: 54 11 4312 9496

senior management
Paul H. StebbinsChairman andChief Executive Officer
Michael J. KasbarPresident and Chief Operating Officer
Michael S. ClementiPresident and Chief Operating Officer World Fuel Services, Inc.
Francis X. SheaExecutive Vice Presidentand Chief Risk andAdministrative Officer
Robert S. TocciExecutive Vice President andChief Financial Officer
R. Alexander Lake, Jr.General Counsel andCorporate Secretary

UNITED STATES SECURITIES AND EXCHANGE COMMISSION
Washington, DC 20549 FORM 10-K/A (Amendment No. 1)
(Mark One)
[X] ANNUAL REPORT PURSUANT TO SECTION 13 OR 15(d) OF THE SECURITIES EXCHANGE ACT OF 1934
FOR THE FISCAL YEAR ENDED DECEMBER 31, 2004
[ ] TRANSITION REPORT PURSUANT TO SECTION 13 OR 15(d) OF THE SECURITIES EXCHANGE ACT OF
1934
FOR THE TRANSITION PERIOD FROM ____________________ TO ____________________
COMMISSION FILE NUMBER 1-9533
WORLD FUEL SERVICES CORPORATION (Exact name of registrant as specified in its charter)
Florida
(State or other jurisdiction of incorporation or organization) 59-2459427
(I.R.S. Employer Identification No.)
9800 Northwest 41st Street, Suite 400 Miami, Florida
(Address of Principal Executive Offices)
33178
(Zip Code)
Registrant’s Telephone Number, including area code: (305) 428-8000
Securities registered pursuant to Section 12(b) of the Act:
Title of each class:
Name of each exchange on which registered:
Common Stock, par value $0.01 per share
New York Stock Exchange
Securities registered pursuant to Section 12(g) of the Act: None
Indicate by check mark whether the registrant (1) has filed all reports required to be filed by Section 13 or 15(d) of the
Securities Exchange Act of 1934 during the preceding 12 months (or for such shorter period that the registrant was required to file such reports), and (2) has been subject to such filing requirements for the past 90 days. Yes X No .
Indicate by check mark if disclosure of delinquent filers pursuant to Item 405 of Regulation S-K is not contained herein,
and will not be contained, to the best of Registrant’s knowledge, in definitive proxy or information statements incorporated by reference in Part III of this Form 10-K or any amendment to the Form 10-K [ ].
Indicate by check mark whether the registrant is an accelerated filer (as defined in Rule 12b-2 of the Act.) Yes X No
. The aggregate market value of the voting stock (which consists solely of shares of common stock) held by non-affiliates
of the registrant was $572.0 million (computed by reference to the closing sale price as of March 24, 2005). The registrant had 22,867,000 shares of common stock, par value $.01 per share, net of treasury stock, issued and
outstanding as of March 24, 2005.
Documents incorporated by reference:
Part III – Specified Portions of the Registrant’s Definitive Proxy Statement for the 2005 Annual Meeting of Shareholders.

EXPLANATORY NOTE
This Amendment No. 1 on Form 10-K/A (this “Form 10-K/A”) to the Company’s Annual Report on Form 10-K for the period ended December 31, 2004, initially filed with the Securities and Exchange Commission (the “SEC”) on March 31, 2005 (the “Original 10-K Filing”), is being filed to restate the Company’s consolidated statements of cash flows for the years ended December 31, 2004, 2003 and 2002, including the nine months ended December 31, 2002, and the notes related thereto, to reflect the correction of the presentation of borrowings and repayments under the Company’s revolving credit facility. The restatement is described in more detail in Note 2b) to “Item 8 – Financial Statements and Supplementary Data.” This Form 10-K/A also reflects the correction of summary quarterly information related to inventory derivatives in Note 10 to Item 8 and the correction of certain typographical errors.
For the convenience of the reader, this Form 10-K/A sets forth the Original 10-K Filing in its entirety, as amended. With
the exception of changes necessary to reflect the above described items, no other information in the Original 10-K Filing has been amended. Additionally, this Form 10-K/A does not reflect other events transpiring after the date of the Original Form 10-K Filing. Pursuant to the rules of the SEC, Item 15 of Part IV of the Original Filing has been amended to contain currently dated certifications from the Company’s Chief Executive Officer, Chief Operating Officer, Chief Financial Officer and Chief Risk and Administrative Officer, as required by Sections 302 and 906 of the Sarbanes-Oxley Act of 2002. The certifications of the Company’s Chief Executive Officer, Chief Operating Officer, Chief Financial Officer and Chief Risk and Administrative Officer are attached to this Form 10-K/A as Exhibits 31.1, 31.2, 31.3, 31.4, and 32.1.
The Original 10-K Filing reflected the restatement of our previously reported financial statements for the years ended
December 31, 2003 and 2002, the nine months ended December 31, 2002, and the year ended March 31, 2002. The restatement reflects the correction of the cutoff procedures used by the Company for recognizing sales and sales related costs. The restatement is described in more detail in Note 2a) to “Item 8 – Financial Statements and Supplementary Data.”

TABLE OF CONTENTS
PagePART I.
Item 1. Business 1 Item 2. Properties 8 Item 3. Legal Proceedings 11 Item 4. Submission of Matters to a Vote of Security Holders 11
PART II.
Item 5. Market for Registrant’s Common Equity, Related Stockholder Matters and Issuer Purchasesof Equity Securities
12
Item 6. Selected Financial Data 13 Item 7. Management’s Discussion and Analysis of Financial Condition and Results of Operations 17 Item 7A. Quantitative and Qualitative Disclosures About Market Risk 28 Item 8. Financial Statements and Supplementary Data 30 Item 9. Changes in and Disagreements with Independent Registered Public Accounting Firm on
Accounting and Financial Disclosure
30 Item 9A. Controls and Procedures 30 Item 9B. Other Information 31
PART III.
Item 10. Directors and Executive Officers of the Registrant 32 Item 11. Executive Compensation 32 Item 12. Security Ownership of Certain Beneficial Owners and Management and Related Stockholder
Matters
32 Item 13. Certain Relationships and Related Transactions 32 Item 14. Principal Accountant Fees and Services 32
PART IV.
Item 15. Exhibits and Financial Statement Schedules 33

PART I Item 1. Business Overview World Fuel Services Corporation (the “Company”) was incorporated in Florida in July 1984 and along with its consolidated subsidiaries is referred to collectively in this Annual Report on Form 10-K as “World Fuel,” “we,” “our” and “us.” We market fuel and related services to marine and aviation customers throughout the world. In our marine fuel services business, we offer marine fuel and related services to a broad base of customers, including international container and tanker fleets, and time-charter operators, as well as to the United States and foreign governments. In our aviation fuel services business, we offer aviation fuel and related services to passenger, cargo and charter airlines, as well as corporate customers and the United States and foreign governments. We provide competitive prices, credit terms, fuel management and price risk management services, and single-supplier convenience. We also offer flight plans and weather reports to our corporate aviation customers.
In August 2002, we changed our fiscal year-end from March 31st to a calendar year-end of December 31st. We initiated
this change so we could be more directly comparable to other public companies that use a calendar year for their fiscal year. This change was first effective with respect to the nine months ended December 31, 2002. The results for the calendar year ended December 31, 2002, presented in this Form 10-K for comparison, are unaudited. The 2002 calendar year results combined the audited results for the nine months ended December 31, 2002 and the unaudited results for the three months ended March 31, 2002.
The Company corrected its cutoff procedures to recognize revenues and sales related costs at the time fuel deliveries are
made and related services are performed. The Company had historically recorded revenue and sales related costs when supporting documentation relating to fuel deliveries and related services had been received from third parties utilized by the Company to provide fuel and related services. As a result, we have restated our previously reported financial statements for the years ended December 31, 2003 and 2002, and the nine months ended December 31, 2002. In addition, the Company’s presentation of borrowings and repayments under its revolving credit facility was corrected to present such borrowings and repayments on a gross rather than net basis. As a result, we have restated our previously reported statements of cash flows for the years ended December 31, 2004, 2003 and 2002, and the nine months ended December 31, 2002. These restatements are described in more detail in Note 2 to “Item 8 – Financial Statements and Supplementary Data.”
Our executive offices are located at 9800 Northwest 41st Street, Suite 400, Miami, Florida 33178 and our telephone number at this address is (305) 428-8000. Our website is located at www.wfscorp.com. Our website and information contained on our website are not part of this Annual Report on Form 10-K and are not incorporated by reference in this Annual Report on Form 10-K. A copy of our latest Form 10-K, Form 10-Q, and other SEC filings can be obtained, free of charge, on our website. These SEC filings are added to the website as soon as reasonably practicable. In addition, our Code of Corporate Conduct and Ethics, Board of Directors’ committee charters, and Corporate Governance Principles are available on our website. The public may read and copy any materials we file with the SEC at the SEC’s Public Reference Room at 450 Fifth Street, N.W., Washington, D.C. 20549. The public may obtain information about the operation of the Public Reference Room by calling the SEC at 1-800-SEC-0330. The SEC maintains an internet site at www.sec.gov that contains reports, proxy and information statements and other information related to issuers that file electronically with the SEC. Our marine fuel services business is conducted from offices located in the United States, United Kingdom, Denmark, Norway, Russia, Germany, Costa Rica, Brazil, Chile, Argentina, Greece, Turkey, South Africa, China, South Korea, Singapore, Japan, Hong Kong, The Netherlands, and the United Arab Emirates. Our aviation fuel services business is conducted from offices located in the United States, United Kingdom, Russia, China, Singapore, Mexico, Brazil, Colombia and Costa Rica. See “Item 2 - Properties” for a list of principal offices by business segment and “Exhibit 21.1 - Subsidiaries of the Registrant” included in this Form 10-K for a list of our subsidiaries. Financial information with respect to our business segments and the geographic areas of our business is provided in Note 9 to the accompanying consolidated financial statements included in this Form 10-K.
Page 1 of 72

Forward-Looking Statements
This Form 10-K and the information incorporated by reference in it include “forward-looking statements” within the meaning of the federal securities laws. In addition, we, or our executive officers on our behalf, may from time to time make forward-looking statements in reports and other documents we file with the SEC or in oral statements made to the press, potential investors or others. All statements that are not historical facts are “forward-looking statements.” The words “estimate,” “project,” “intend,” “expect,” “believe,” “anticipate,” “plan,” and similar expressions identify forward-looking statements. These forward-looking statements include statements regarding our expected financial position, business, financing plans, business strategy, business prospects, revenues, working capital, liquidity, capital needs, interest costs and income, in each case relating to subsidiaries or business segments within our company or to our company as a whole, as well as statements regarding acquisitions, potential acquisitions and the benefits of acquisitions.
Forward-looking statements are estimates and projections reflecting our best judgment and involve a number of risks and
uncertainties that could cause actual results to differ materially from those suggested by the forward-looking statements. These statements are based on our management’s beliefs and assumptions, which in turn are based on currently available information. Examples of forward-looking statements in this report include but are not limited to our expectations regarding our ability to generate operating cash flows and to fund our working capital and capital expenditure requirements. Important assumptions relating to the forward-looking statements include, among others, assumptions regarding demand for our products, the cost and availability of fuel from suppliers, pricing levels, the timing and cost of capital expenditures, outcomes of pending litigation, competitive conditions, general economic conditions and synergies relating to acquisitions, joint ventures and alliances. These assumptions could prove inaccurate. Although we believe that the estimates and projections reflected in the forward-looking statements are reasonable, our expectations may prove to be incorrect. Important factors that could cause actual results to differ materially from the results and events anticipated or implied by such forward-looking statements include:
• our ability to collect accounts receivable; • changes in the political, economic or regulatory conditions in the markets in which we operate; • currency exchange fluctuations; • non-performance of third party service providers; • our failure to hedge certain financial risks associated with our business and our price risk management services; • non-performance by counterparties to derivatives contracts; • uninsured losses; • our ability to retain and attract senior management and other key employees; • our ability to manage growth; • our ability to integrate acquired businesses; • the outcome of legal or regulatory proceedings to which we are or may become a party; • adverse conditions in the shipping and aviation industries; • material disruptions in the availability or supply of oil; • changes in the market price of petroleum; • increased levels of competition; • compliance or lack of compliance with various environmental and other applicable laws and regulations; • our failure to comply with restrictions in our credit agreements; • increases in interest rates; • other risks, described below in “— Risk Factors” and from time to time in our other SEC filings.
We believe these forward-looking statements are reasonable. However, you should not place undue reliance on any forward-looking statements, which are based on current expectations. Further, forward-looking statements speak only as of the date they are made, and we undertake no obligation to update publicly any of them in light of new information or future events. For these statements, we claim the protection of the safe harbor for forward-looking statements contained in Section 27A of the Securities Act and Section 21E of the Securities Exchange Act of 1934.
Page 2 of 72

Description of Business Our principal business consists of providing marine fuel services to a broad base of international shipping companies and to the United States and foreign governments, and aviation fuel services to passenger, cargo and charter airlines, as well as corporate customers and the United States and foreign governments. We currently employ 606 people worldwide, of which 218 are employed in our marine fuel services business, 267 are employed in our aviation fuel services business, and 121 are employed in corporate.
Marine Fuel Services
We market marine fuel and related services to a broad base of customers, including international container and tanker fleets, and time charter operators, as well as to the United States and foreign governments. Marine fuel and related services are provided throughout most of the world under the following trade names: World Fuel, Trans-Tec, Bunkerfuels, Oil Shipping, Marine Energy, Norse Bunker, Casa Petro, and Tramp Oil. Through our extensive network of strategically located sales offices, we provide our customers global market intelligence and rapid access to quality and competitively priced marine fuel, 24-hours a day, every day of the year. Our marine related services include management services for the procurement of fuel, cost control through the use of price hedging instruments, quality control and claims management. Our customers need cost effective and professional fuel services because the cost of fuel is a major component of a vessel’s operating overhead. As an increasing number of ship owners, time charter operators, and suppliers continue to outsource their marine fuel purchasing and/or marketing needs, our value added services have become an integral part of the oil and transportation industries’ push to shed non-core functions and reduce costs. Suppliers use our global sales, marketing and financial infrastructure to sell a spot or ratable volume of product to a diverse, international purchasing community. End customers use our real time analysis of the availability, quality, and price of marine fuels in ports worldwide to maximize their competitive position. In our marine operations, we primarily act as a reseller. When acting as a reseller, we purchase fuel from a supplier, mark it up, and resell the fuel to a customer. We extend unsecured credit to most of our customers. We also act as a broker and as a source of market information for the end user, negotiate the transaction by arranging the fuel purchase contract between the supplier and the end user, and expedite the arrangements for the delivery of fuel. For this service, we are paid a commission from the supplier. We purchase our marine fuel from suppliers worldwide. Our cost of fuel is generally tied to spot pricing, market-based formulas or is governmentally controlled. We are usually extended unsecured trade credit from our suppliers for our fuel purchases. However, certain suppliers require us to provide a letter of credit. We may prepay our fuel purchases to take advantage of financial discounts, when limited by amount of credit extended to us by suppliers or as required to transact business in certain countries. Because we arrange to have fuel delivered by our suppliers directly to our customers, inventory is maintained only for competitive reasons and at minimum operating levels. Currently, inventory is maintained at two seaport locations in the United Kingdom. We have arrangements with our suppliers and other third parties for the storage and delivery of fuel. We utilize subcontractors to provide various services to customers, including fueling of vessels in port and at sea, and transportation of fuel and fuel products. During each of the periods presented in the accompanying consolidated statements of income, none of our marine customers accounted for more than 10% of total consolidated revenue.
Aviation Fuel Services
We market aviation fuel and related services to passenger, cargo and charter airlines, as well as corporate customers and the United States and foreign governments. Our aviation related services include fuel management, price risk management, flight plans, weather reports, ground handling, and flight permits. We have developed an extensive network that enables us to provide aviation fuel and related services throughout most of the world under the following trade names: World Fuel, Baseops, Airdata, PetroServicios de Mexico, and PetroServicios de Costa Rica.
Page 3 of 72
In general, the aviation industry is capital intensive and highly leveraged. Recognizing the financial risks of the airline industry, fuel suppliers generally refrain from extending unsecured lines of credit to airlines and avoid doing business with airlines directly. Consequently, most carriers are required to post a cash collateralized letter of credit or prepay for fuel purchases. This impacts the airlines’ working capital. We recognize that the extension of credit is a risk, but also a significant area of opportunity. Accordingly, we extend unsecured credit to most of our customers. We purchase our aviation fuel from suppliers worldwide. Our cost of fuel is generally tied to market-based formulas or is government controlled. We are usually extended unsecured trade credit from our suppliers for our fuel purchases. However, certain suppliers require us to provide a letter of credit. We may prepay our fuel purchases to take advantage of financial discounts, or as required to transact business in certain countries. Outside of the United States, we do not maintain fuel inventory since we arrange to have the fuel delivered into our customers’ aircraft directly from our suppliers. In the United States, fuel is delivered into our customers’ aircraft or designated storage directly from our suppliers or from our fuel inventory. Inventory is held at multiple airport locations in the United States for competitive reasons and inventory levels are kept at an operating minimum. Inventory is purchased at airport locations or shipped via pipelines. Inventory in pipelines is fully hedged against price risks. We have arrangements with our suppliers and other third parties for the storage and delivery of fuel. We utilize subcontractors to provide various services to customers, including into-plane fueling at airports, and transportation and storage of fuel and fuel products. During each of the periods presented in the accompanying consolidated statements of income, none of our aviation customers accounted for more than 10% of total consolidated revenue. Risk Factors
Risks Related to Our Business We extend unsecured credit to most of our customers and our business will be adversely affected if we are unable to collect accounts receivable.
We extend unsecured credit to most of our marine and aviation fuel customers. Our success in attracting business has been due, in part, to our willingness to extend credit on an unsecured basis to customers that exhibit a high credit risk profile and would otherwise be required to prepay or post letters of credit with their suppliers of fuel and related services. We do not insure our receivables. Diversification of credit risk is limited because we sell primarily within the marine and aviation industries. In our marine fuel services segment, we have extended individual lines of credit of at least $6.0 million to 20 non-governmental customers, and seven of these customers have lines of credit ranging from $15.0 to $28.0 million (currently, our largest credit lines). In our aviation fuel services segment, we have extended lines of credit of at least $4.0 million to five non-governmental customers, and one of these customers has a credit line of $14.0 million.
Credit losses may be influenced by other factors, including deteriorating conditions in the world economy or in the shipping or aviation industries, political instability, terrorist activities and military action in our market areas. Any credit losses, if significant, would have a material adverse effect on our financial position and results of operations.
Business conducted outside of the United States subjects us to legal, monetary and political risks, as well as currency exchange risks, and may cause unpredictability in a significant source of our cash flows.
We conduct business in many foreign countries which subjects us to various political and other risks that are different
from and in addition to those relating to conducting business in the United States, including:
• enactment of laws prohibiting or restricting foreign business; • laws restricting us from repatriating profits earned from activities within the foreign country, including the
payment of distributions; • exchange rate fluctuations; • terrorism, war or civil unrest.
Unfavorable legal, regulatory, economic or political changes such as those described above could adversely affect our
financial condition and results of operations.
Page 4 of 72

Our business and our customers’ businesses are subject to currency exchange risks.
The majority of our business transactions are denominated in U.S. dollars. However, in certain markets, primarily in Mexico, Colombia and the United Kingdom, payments to our fuel suppliers and from some of our customers are denominated in local currency. This subjects us to foreign currency exchange risk. Although we use hedging strategies to manage and minimize the impact of foreign currency exchange risk, at any given time, only a portion of such risk may be hedged. As a result, fluctuations in foreign exchange rates could adversely affect our profitability.
In addition, many of our customers are foreign customers and may be required to purchase U.S. dollars to pay for our
products and services. A rapid depreciation or devaluation in currency affecting our customers could have an adverse effect on our customers’ operations and their ability to convert local currency to U.S. dollars to make the required payments to us. This would in turn result in higher credit losses for us which would adversely affect our business. Third parties who fail to provide services to us and our customers as agreed could harm our business
We use third parties to provide various services to our customers, including into-plane fueling at airports and fueling
of vessels in port and at sea. The failure of these third parties to perform these services in accordance with the terms we have agreed with them and our customers could affect our relationships with our customers and subject us to claims and other liabilities which might have a material adverse effect on our business or our financial results.
We also use third parties to store our fuel inventory and to transport fuel. If these third parties become bankrupt or
otherwise fail to meet their commitments to creditors, our fuel could be seized and applied against amounts owed to such creditors. This could cause both disruptions in our business and financial losses.
Fuel sold to our customers is purchased by us from various suppliers. If the fuel we purchase from our suppliers fails
to meet the specifications we have agreed to supply to our customers, our relationship with our customers could be adversely affected and we could be subject to claims and other liabilities which could have a material adverse effect on our business or our financial results.
We are exposed to various risks in connection with the price risk management services we offer to our customers.
As part of our price risk management services, we offer our customers various pricing structures on future purchases
of fuel, as well as derivatives products designed to assist our customers in hedging their exposure to fluctuations in fuel prices. In connection with offering our customers these services, we are exposed to financial risk associated with fluctuations in fuel prices. We typically hedge this risk by entering into a commodity based derivative instrument with a counterparty on substantially the same terms and conditions as those entered into with our customer. Should we fail to adequately hedge the risks associated with offering these services, or should a customer or counterparty to a derivative instrument fail to honor its obligations under our agreements with them, we could sustain significant losses which could have a material adverse effect on our profitability and financial position. Also, the failure of our employees to comply with our policies and procedures concerning the administration of our price risk management services, for example by failing to hedge a specific financial risk, could subject us to significant financial losses which could have a material adverse effect on our business and financial condition.
Insurance coverage for some of our operations may be insufficient to cover losses.
We lack insurance coverage for various risks, including environmental claims. Although we generally require our
subcontractors to carry liability insurance, not all subcontractors carry adequate insurance. Our marine business does not have liability insurance to cover the acts or omissions of our subcontractors. None of our liability insurance covers acts of war and terrorism. A significant uninsured claim would have a material adverse effect on our financial position and results of operations.
Page 5 of 72

If we are unable to retain our senior management and key employees, our business and results of operations could be harmed.
Our ability to maintain our competitive position is dependent largely on the services of our senior management and
professional team. If we are unable to retain the existing senior management and professional personnel, or to attract other qualified senior management and professional personnel, our businesses will be adversely affected.
The failure to effectively manage our rapid growth could have an adverse effect on our business.
We have rapidly expanded our operations in recent years and we intend to continue to pursue existing and potential
market opportunities. This rapid growth places a significant demand on our management and operational resources. If we are unable to manage our growth effectively, our business, financial condition, and results of operations will be adversely affected.
The integration of an acquired company may have an adverse effect on our operations.
Our business has grown, in part, as a result of our acquisition of other companies. On April 2, 2004, we acquired
Tramp Oil and, since that time, we have been integrating this business with our existing operations. The integration of an acquisition typically involves a number of risks that may adversely affect our operations. These risks include diversion of management’s attention, difficulties in the integration of acquired operations and retention of personnel, entry into unfamiliar markets, unanticipated problems or legal liabilities, and tax and accounting issues. Furthermore, once we have integrated an acquired company, the business may not achieve the same levels of revenue or profitability as our other operations, or otherwise perform as expected.
We are involved from time to time in legal proceedings and commercial or contractual disputes, which could have an adverse impact on our profitability and consolidated financial position.
We are involved in legal proceedings and commercial or contractual disputes that, from time to time, are significant.
These are typically commercial or contractual claims that arise in the normal course of business including, without limitation, disputes with our suppliers and customers. Such proceedings and claims could have a material adverse effect on our profitability and consolidated financial position if decided adversely.
Risks Related to Our Industry Adverse conditions in the shipping and aviation industries may have an adverse effect on our business.
Our business is focused on the marketing of fuel and fuel-related services to the shipping and aviation industries. Therefore, any adverse economic conditions in these industries may have an adverse effect on our business. In addition, any political instability, terrorist activity or military action that disrupts shipping or flight operations will adversely affect our customers and may reduce the demand for our products and services. Our business could also be adversely affected by increased merger activity in the airline and shipping industries, which may reduce the number of customers that purchase our products and services, as well as the prices we are able to charge for such products and services.
Material disruptions in the availability or supply of oil may adversely affect our business.
The success of our business depends on our ability to purchase, sell and deliver fuel and fuel-related services to our
customers. Our business would be adversely affected to the extent that political instability, natural disasters, terrorist activity, military action or other conditions disrupt the availability or supply of oil.
Changes in the market price of petroleum may have a material adverse effect on our business.
Increases in fuel prices can adversely affect our customers’ businesses, and consequently increase our credit losses.
Increases in fuel prices could also affect the credit limits extended to us by our suppliers, potentially affecting our liquidity and profitability. In addition, increases in oil prices will make it more difficult for our clients to operate and could reduce demand for our services. Conversely, a rapid decline in fuel prices could adversely affect our profitability because inventory purchased by us when fuel prices were high may have to be sold at lower prices.
Page 6 of 72

Our business is subject to aggressive competition.
We are subject to aggressive competition in all areas of our business. Our competitors are numerous, ranging from large multinational corporations, which have significantly greater capital resources, to relatively small and specialized firms. In addition to competing with fuel resellers, we also compete with the major oil producers that market fuel directly to the large commercial airlines and shipping companies. Our business could be adversely affected because of increased competition from the larger oil companies who may choose to directly market to smaller airlines and shipping companies, or to provide less advantageous price and credit terms to us.
Our operations are subject to various environmental laws and regulations, the violation of which could result in liability, fines or penalties.
We are subject to various environmental laws and regulations dealing with the handling of fuel and fuel products. We
also maintain fuel inventories at several locations. Our operations involve the risks of fuel spillage or seepage, environmental damage, and hazardous waste disposal, among others. If we are involved in a spill or other accident involving hazardous substances, if there are releases of fuel and fuel products we own, or if we are found to be in violation of environmental laws or regulations, we could be subject to liabilities that could have a materially adverse effect on our business and operating results. We are also subject to possible claims by customers, employees and others who may be injured by a fuel spill, exposure to fuel, or other accidents. If we should fail to comply with applicable environmental regulations, we could be subject to substantial fines or penalties and to civil and criminal liability.
We have exited several businesses that handled hazardous and non-hazardous waste. We treated and/or transported
this waste to various disposal facilities. We may be held liable as a potentially responsible party for the clean-up of such disposal facilities, or be required to clean-up facilities previously operated by us, pursuant to current U.S. federal and state laws and regulations.
Risks Related to our Credit Facility.
Our failure to comply with the restrictions of our credit facility could adversely affect our operations.
We borrow money pursuant to a credit agreement that imposes certain operating and financial restrictions on us,
including restrictions on the payment of dividends in excess of specified amounts. Our failure to comply with obligations under the credit agreement, including meeting certain financial ratios, could result in an event of default. An event of default, if not cured or waived, would permit acceleration of any outstanding indebtedness under the credit agreement, and impair our ability to receive working capital advances and issue letters of credit, which could have a material adverse effect on our ability to operate our business.
Increases in interest rates and/or the failure of our interest rate protection arrangements to reduce our interest rate volatility may increase our interest expense and adversely affect our cash flow and our ability to service our indebtedness.
Almost all of our credit facility debt is subject to variable interest rates. On March 9, 2005, we entered into interest
rate protection arrangements that, in effect, fix the rate of interest on $20.0 million of our debt at a weighted average interest rate of 5.45% per annum. The amount of debt covered by these arrangements may change depending on our working capital needs. An increase in interest rates and/or our failure to maintain adequate interest rate protection arrangements would increase our interest expense and adversely affect our cash flow and our ability to service our indebtedness. At December 31, 2004, we had a total of $50.0 million of debt bearing a weighted average interest rate of approximately 4.27% per annum.
Page 7 of 72
Regulation The principal laws and regulations affecting our businesses are as follows:
Environmental Regulations. Our activities, including discontinued operations, are subject to substantial regulation by federal, state and local government agencies, inside and outside the United States, which enforce laws and regulations governing the transportation, sale, storage and disposal of fuel and the collection, transportation, processing, storage, use and disposal of hazardous substances and wastes, including waste oil and petroleum products. For example, United States Federal and state environmental laws applicable to us include statutes that: (i) allocate the cost of remedying contamination among specifically identified parties, and prevent future contamination; (ii) impose national ambient standards and, in some cases, emission standards, for air pollutants which present a risk to public health or welfare; (iii) govern the management, treatment, storage and disposal of hazardous wastes; and (iv) regulate the discharge of pollutants into waterways. International treaties also prohibit the discharge of petroleum products at sea. The penalties for violations of environmental laws include injunctive relief, recovery of damages for injury to air, water or property, and fines for non-compliance. See “Risk Factors,” above, and “Item 3 – Legal Proceedings.” Taxes on Fuel. Our marine and aviation segments are affected by various taxes imposed on the purchase and sale of marine and aviation fuel products. These taxes include sales, excise, goods and services taxes (“GST”), value added taxes (“VAT”) and other taxes, and are collectively referred to as “transaction taxes.” The transaction taxes imposed on marine and aviation fuel purchasers and sellers are also subject to various full and partial exemptions. Subject to exemptions available at the time of the transaction, in general, we pay the appropriate transaction tax to the supplier or charge the appropriate transaction tax to the customer. We continuously review our compliance with U.S. and foreign laws that impose transaction taxes on our operations. However, in certain cases, we may be responsible for additional transaction taxes if the customer or we do not qualify for an exemption believed to be available at the time of purchase and/or sale. Item 2. Properties The following pages set forth our principal leased properties by segment as of March 24, 2005. We consider our properties and facilities to be suitable and adequate for our present needs.
WORLD FUEL SERVICES CORPORATION and SUBSIDIARIES PROPERTIES
Location Principal Use Lease Expiration
Corporate9800 Northwest 41st Street, Suite 400 Executive and administrative office March 2013Miami, FL 33178, USA
Marine Fuel Services9800 Northwest 41st Street, Suite 400 Executive and administrative office March 2013Miami, FL 33178, USA
Raritan Plaza III Administrative, operations and January 2010101 Fieldcrest Avenue Suite 2B sales officeEdison, NJ 08837, USA
2 Greenwich Office Park Administrative, operations and December 2006Greenwich, CT 06830, USA sales office
1101 Fifth Avenue, Suite 280 Administrative, operations and July 2008San Rafeal, CA 94901, USA sales office
238A Thompson Road #17-08 Administrative, operations and December 2006Novena Square Tower A, Singapore 307684 sales office
9 F/L., Dongwon-Bldg., 128-27 Sales office October 2007Dangju - Dong, Chongno - KuSeoul, 110-759 South Korea
(Continued)
Page 8 of 72

WORLD FUEL SERVICES CORPORATION and SUBSIDIARIES PROPERTIES
(Continued)
Location Principal Use Lease Expiration
Marine Fuel Services4th floor, Tozan Building, 4-4-2 Sales office March 2006Nihonbashi Hon-Cho, Chuo-KuTokyo 103-0023, Japan
Yam Tze Commercial Building, Unit A, 18th Floor Administrative, operations and March 200623 Thompson Road sales officeWanchai, Hong Kong
Poseidonos 60 Av., Third Floor Sales office Month-to-monthGlyfada 166-75 Athens, Greece
The Foundry, 4th Floor, Unit 1, Cardiff Road Sales office August 2007Green Point, South Africa 8001
Al Mossa Tower 2, Suite 904 Sales office March 2006Sheikh Zayed Road, P.O. Box 24676Dubai, United Arab Emirates
Westminster Tower Administrative, operations and March 20103 Albert Embankment sales officeLondon SE1 75P, United Kingdom
Gammelbyved 2 Sales office Month-to-monthKarise, Denmark 4653
Vasteland 6 Administrative, operations and Month-to-month3011 BK Rotterdam, Netherlands sales office
Niels Juels gate 11 B Administrative, operations and February 20060272 Oslo, Norway sales office
Oficentro Ejécutivo La Sabana Sur, Edificio #7, Piso 2 Administrative, operations and May 2009San José, Costa Rica sales office
Avenida Libertad 798, Suite 301 Sales office September 2005Vina del Mar, Chile
Tucuman 373 Pis 3, 1049 CF Sales office August 2005Buenos Aires, Argentina
No. 1 Pudong Avenue, Marine Tower, Room 1206 Sales office Month-to-monthShanghai, China 200120
Yener Sok, Ayaz Apr No. 123, D-3 Sales office Month-to-monthErenkoy, Istanbul Turkey
70 Shenton Way, #17-01A Administrative, operations and November 2006Marina House, Singapore 79118 sales office
34 ap.3, Georgiy Dimitrov Str 236000 Sales office December 2005Kaliningrad, Russia
(Continued)
Page 9 of 72

WORLD FUEL SERVICES CORPORATION and SUBSIDIARIES PROPERTIES
(Continued) Location Principal Use Lease Expiration
Marine Fuel ServicesBremer, 2, D-28816 Stuhr Sales office May 2008Bremen, Germany
7 Priory Tech Park, Saxon Park, Saxon Way, Hessle, Hull Sales office July 2015East Yorkshire HU13 9PB, United Kingdom
15-17 Elmfield Road Administrative, operations and March 2011Bromley, Kent BR1 1LT, United Kingdom sales office
Av. Rio Branco 181/3004 Sales office Month-to-monthRio de Janeiro, Brazil 20040 007
Aviation Fuel Services9800 Northwest 41st Street, Suite 400 Executive, administrative, March 2013Miami, FL 33178, USA operations, and sales office
333 Cypress Run #200 Administrative, operations and January 2006Houston, Texas 77094, USA sales office
4995 East Anderson Avenue Administrative, operations and Month-to-monthFresno, CA 93727, USA sales office
238A Thompson Road #17-08 Administrative, operations and December 2006Novena Square Tower A, Singapore 307684 sales office
Kingfisher House, Northwood Park, Gatwick Road Administrative, operations and December 2007Crawley, West Sussex, RH10 2XN, United Kingdom sales office
Oficentro Ejécutivo La Sabana Sur, Edificio #7, Piso 2 Administrative, operations and May 2009San José, Costa Rica sales office
Av. Rio Branco 181/3004 Sales office Month-to-monthRio de Janeiro, Brazil 20040 007
Avenida Fuerza Aérea Mexicana No. 465 Administrative, operations and Month-to-monthColonia Federal, 15700 México, D.F. sales office
Slavjanskaya Business Center, 8th Floor Administrative, operations and January 2006Europe Square 2, Moscow 121059, Russian Federation sales office
Calle 93B No. 11A-33, oficina 303 Administrative, operations and Month-to-monthBogota, Colombia sales office
Room 906, Building 113 Shaoyaojubeili, Chao Yang District Administrative, operations and Month-to-monthBeijing, China sales office
Page 10 of 72
Item 3. Legal Proceedings In April 2001, Miami-Dade County, Florida (the “County”) filed suit (the “County Suit”) against 17 defendants to seek reimbursement for the cost of remediating environmental contamination at Miami International Airport (the “Airport”). Page Avjet Fuel Corporation, now known as PAFCO LLC (“PAFCO”), is a defendant. We acquired a 50% interest in PAFCO from Signature Flight Support Corporation (“Signature”) in December 2000. Pursuant to the PAFCO acquisition agreement, Signature agreed to indemnify us for all PAFCO liabilities arising prior to the closing date (“Closing”). Because the Airport contamination occurred prior to Closing, we believe that the County Suit is covered by Signature’s indemnification obligation. We have notified Signature of the County Suit, as stipulated in the acquisition agreement. We expect Signature to defend this claim on behalf of PAFCO and at Signature’s expense. Also in April 2001, the County sent a letter to approximately 250 potentially responsible parties (“PRP’s”), including World Fuel Services Corporation and one of our subsidiaries, advising them of their potential liability for the clean-up costs of the contamination that is subject of the County Suit. The County has threatened to add the PRP’s as defendants in the County Suit, unless they agree to share in the cost of the environmental clean-up at the Airport. In May 2001, we advised the County that: (1) neither we nor any of our subsidiaries were responsible for any environmental contamination at the Airport, and (2) to the extent that we or any of our subsidiaries were so responsible, our liability was subject to indemnification by the County pursuant to the indemnity provisions contained in our lease agreement with the County. The claims asserted by the County relating to environmental contamination at the Airport remain pending; however, no significant developments occurred during the year ended December 31, 2004. We intend to vigorously defend these claims, and we believe our liability in these matters (if any) should be adequately covered by the indemnification obligations of Signature as to PAFCO, and the County as to World Fuel Services Corporation and our other subsidiaries. In November 2004, World Fuel was served with process in a lawsuit titled Action Manufacturing Co., Inc. et al. v. Simon Wrecking Company, et al. This action, pending in U.S. Federal District Court for the Eastern District of Pennsylvania, relates to the environmental clean up of the Malvern TCE Superfund site in Chester County, Pennsylvania. The plaintiffs are a group of private corporations that entered into a consent decree with the Environmental Protection Agency in 1999, under the terms of which the plaintiffs agreed to pay for remediation of the site. In the action, the Plaintiffs are seeking contribution from the various Defendants toward the costs of remediating the site. Plaintiffs have alleged that World Fuel is a “successor” to Resource Technology Services, Inc., a Pennsylvania corporation that arranged for disposal of wastes at the site. In 1988, Resource Recovery Atlantic, Inc., a Delaware corporation that was then an indirect subsidiary of World Fuel, purchased selected assets from Resource Technology Services, Inc. The plaintiffs claim that this transaction gives rise to our successor liability pursuant to the Pennsylvania Hazardous Sites Cleanup Act. The plaintiffs have alleged that Resource Technology Services Inc.’s share of the clean-up costs is $1.0 million. World Fuel’s subsidiary, Resource Recovery Atlantic, Inc., acquired only selected assets of Resource Technology Services, Inc., and did not assume any of its liabilities, except for four vehicle leases. We believe that neither World Fuel, nor any of our subsidiaries, is a “successor” to Resource Technology Services, Inc. and that we are not responsible for any liabilities of that company. We intend to vigorously defend all claims asserted against us arising from liabilities of Resource Technology Services, Inc. We may not prevail in the legal proceedings described above and we cannot estimate our ultimate exposure if we do not prevail. A ruling against us in certain of the proceedings described above could have a material adverse effect on our financial condition and results of operations. In addition to the matters described above, we are also involved in litigation and administrative proceedings primarily arising in the normal course of our business. In the opinion of management, except as set forth above, our liability, if any, under any other pending litigation or administrative proceedings, even if determined adversely, would not materially affect our financial condition or results of operations. Item 4. Submission of Matters to a Vote of Security Holders No matter was submitted to a vote of shareholders, through the solicitation of proxies or otherwise, during the quarter ended December 31, 2004.
Page 11 of 72

PART II Item 5. Market for Registrant’s Common Equity, Related Stockholder Matters and Issuer Purchases of Equity
Securities On January 20, 2005, we announced a two-for-one split of our common stock. The additional shares issued pursuant to the stock split were distributed on February 15, 2005 to stockholders of record as of February 1, 2005. All references in this Form 10-K to number of shares and per share amounts reflect the stock split. Our common stock is traded on the New York Stock Exchange (“NYSE”) under the symbol INT. As of March 24, 2005, there were 227 shareholders of record of our common stock, and the closing price of our stock on the NYSE was $26.39. The following table sets forth, for each quarter in 2004 and 2003, the high and low closing sales prices of our common stock as reported by the NYSE.
PriceHigh Low
Year ended December 31, 2004First quarter 18.37$ 16.34$ Second quarter 22.66 19.00 Third quarter 22.60 16.95 Fourth quarter 24.90 16.90
Year ended December 31, 2003First quarter 10.52$ 9.85$ Second quarter 12.39 9.84 Third quarter 14.20 11.72 Fourth quarter 17.00 14.15
The following table sets forth the amount, the declaration date, record date, and payment date for each quarterly dividend declared in 2004 and 2003.
Per ShareAmount Declaration Date Record Date Payment Date
Year ended December 31, 2004First quarter $ 0.0375 March 1, 2004 March 19, 2004 April 5, 2004Second quarter 0.0375 June 1, 2004 June 18, 2004 July 6, 2004Third quarter 0.0375 September 1, 2004 September 17, 2004 October 4, 2004Fourth quarter 0.0375 December 1, 2004 December 17, 2004 January 4, 2005
Year ended December 31, 2003First quarter $ 0.0375 February 28, 2003 March 14, 2003 April 3, 2003Second quarter 0.0375 June 2, 2003 June 20, 2003 July 3, 2003Third quarter 0.0375 September 1, 2003 September 19, 2003 October 2, 2003Fourth quarter 0.0375 December 1, 2003 December 19, 2003 January 2, 2004
Our credit facility agreement restricts the payment of cash dividends to a maximum of 35% of our net income for the four quarters preceding the date of the dividend. The payments of the above dividends were in compliance with the credit facility agreement. For additional information regarding our credit facility agreement, see Note 3 to the accompanying consolidated financial statements, included herein, and “Liquidity and Capital Resources” in “Item 7 – Management’s Discussion and Analysis of Financial Condition and Results of Operations.” On March 1, 2005, our Board of Directors approved a quarterly cash dividend of $0.0375 per share for 2005. For information regarding our issuances of common stock, see Note 5 to the accompanying consolidated financial statements, included herein.
Page 12 of 72

Our Board of Directors, from time to time, has authorized stock repurchase programs under the terms of which we may repurchase our common stock, subject to certain restrictions contained in our credit agreement. As of December 31, 2004, we are authorized to repurchase up to $6.0 million of our common stock. We did not repurchase any shares of our common stock during the year ended December 31, 2004. Item 6. Selected Financial Data
WORLD FUEL SERVICES CORPORATION AND SUBSIDIARIESSELECTED FINANCIAL DATA
(In thousands, except earnings per share data)
For theNine Months
endedFor the Year ended December 31, December 31, For the Year ended March 31,
2004 2003 2002 2002 2002 2001Restated Restated Restated Restated Restated
(Unaudited)Consolidated Income Statement DataRevenue 5,654,373$ 2,671,557$ 1,904,365$ 1,551,707$ 1,369,392$ 1,522,961$ Cost of sales (5,524,417) (2,570,434) (1,820,538) (1,488,587) (1,293,568) (1,450,640)
Gross profit 129,956 101,123 83,827 63,120 75,824 72,321 Operating expenses (92,980) (73,781) (63,800) (49,109) (54,830) (57,672)
Income from operations 36,976 27,342 20,027 14,011 20,994 14,649 Other (expense) income, net (1,448) 628 (1,926) (2,030) 1,937 2,191 Income from continuing operations
before income taxes 35,528 27,970 18,101 11,981 22,931 16,840 Provision for income taxes (6,969) (5,809) (3,948) (1,934) (5,947) (4,662)
Income from continuing operations 28,559 22,161 14,153 10,047 16,984 12,178 Discontinued operations, net of tax - - - - - (1,152)
Net income 28,559$ 22,161$ 14,153$ 10,047$ 16,984$ 11,026$ Basic earnings (loss) per share:
Continuing operations 1.29$ 1.04$ 0.68$ 0.48$ 0.82$ 0.57$ Discontinued operations - - - - - (0.05)
Net income 1.29$ 1.04$ 0.68$ 0.48$ 0.82$ 0.52$ Basic Weighted average shares 22,104 21,234 20,898 20,936 20,762 21,288
Diluted earnings (loss) per share:Continuing operations 1.22$ 0.99$ 0.65$ 0.46$ 0.80$ 0.57$ Discontinued operations - - - - - (0.05)
Net income 1.22$ 0.99$ 0.65$ 0.46$ 0.80$ 0.52$ Diluted weighted average shares 23,454 22,338 21,790 21,800 21,292 21,326
As of December 31,2004 2003 2002 2002 2001
Restated Restated Restated RestatedConsolidated Balance Sheet DataAccounts and notes receivable, net 490,780$ 243,612$ 212,578$ 161,054$ 148,657$ Total current assets 648,068 354,663 295,289 240,459 209,828 Goodwill 42,347 36,860 36,860 36,860 27,502 Identifiable intangible asset 7,486 1,104 1,472 1,748 - Total assets 712,171 400,850 344,996 285,243 243,768 Total current liabilities 466,985 246,595 212,016 160,294 132,914 Total long-term liabilities 56,683 4,537 4,198 7,633 5,866 Total stockholders' equity 188,503 149,718 128,782 117,316 104,988
As of March 31,
Page 13 of 72

NOTES TO SELECTED FINANCIAL DATA We declared cash dividends of $0.15 per share for the years ended December 31, 2004 and 2003, $0.1125 per share for the nine months ended December 31, 2002, $0.20 per share for the year ended March 31, 2002, and $0.10 per share of common stock for the year ended March 31, 2001. Included in the cash dividend for the year ended March 31, 2002 was a special cash dividend of $0.05 per share of common stock declared in May 2001. Pursuant to various treasury stock repurchase programs, we repurchased approximately 252 thousand shares for an aggregate cost of $2.0 million in February 2002, approximately 266 thousand shares at an aggregate cost of $1.3 million from September 2001 to October 2001, and approximately 1.2 million shares for an aggregate cost of $4.4 million from April 2000 to March 2001. We acquired the Norse Bunker A.S. in February 2001, the Marine Energy group of companies in April 2001, the Oil Shipping group of companies in January 2002, and Tramp Oil in April 2004. These acquisitions were accounted for as purchases. Accordingly, the results of operations of these acquisitions were included with our results since their respective dates of acquisition. In December 2000, we entered into a joint venture agreement with Signature Flight Support Corporation through the acquisition of a 50% equity interest in PAFCO, a company engaged in the sale of aviation fuel and related services. From January 1, 2001 to December 31, 2003, we used the equity method of accounting to record our share of the earnings and losses of this joint venture. In addition, the amortized interest expense on the non-interest bearing promissory note was also included in net earnings from aviation joint venture. Effective January 1, 2004, with the implementation of the Financial Accounting Standard Board Interpretation No. 46 (“FIN No. 46”), we consolidated PAFCO’s financial position and results of operations, after elimination of all significant intercompany accounts, transactions and profits. See Note 7 to the accompanying consolidated financial statements, included herein, for additional information. During the year ended March 31, 2001, we recorded an after-tax charge of $656 thousand relating to amounts due to us from the February 2000 sale of our oil recycling segment to EarthCare Company (“EarthCare”) and additional income taxes of $496 thousand associated with the discontinued operations based on the actual income tax returns filed. Included in Other income (expense), net for the nine months and year ended December 31, 2002 was a charge of $1.6 million in connection with the settlement of the remaining balance due on the sale of our oil recycling segment to EarthCare. In connection with the amortization of the Unearned deferred compensation for restricted common stock and stock options granted to employees and non-employee directors over the minimum vesting period of each individual award, we recorded total compensation cost, which was included in Operating expenses, of $1.7 million, $925 thousand and $506 thousand for the years ended December 31, 2004, 2003 and 2002, respectively, $363 thousand for the nine months ended December 31, 2002 and $182 thousand for the year ended March 31, 2001. The remaining Unearned deferred compensation was $4.4 million, $2.8 million and $1.9 million at December 31, 2004, 2003 and 2002, respectively, and $116 thousand at March 31, 2002. Included in Operating expenses were executive severance charges of $4.5 million relating to the termination of employment of our former Chief Executive Officer, Chief Financial Officer, Chief Information Officer, and two other executives during the nine months and year ended December 31, 2002. An insurance settlement recovery of $1.0 million relating to a product theft off the coast of Nigeria was included in Other income (expense), net for the year ended March 31, 2002. We had recorded a product theft charge of $3.1 million for the year ended March 31, 2000. Effective April 2001, we elected to early adopt Statement of Financial Accounting Standards (“SFAS”) No. 142, “Goodwill and Other Intangible Assets,” which among other provisions, states that goodwill shall not be amortized prospectively. Accordingly, no goodwill amortization was recorded subsequent to the adoption of SFAS No. 142. For the year ended March 31, 2001, an executive severance charge of $3.5 million relating to the termination of the employment of our former Chief Executive Officer was included in Operating expenses.
(Continued)
Page 14 of 72

NOTES TO SELECTED FINANCIAL DATA (Continued)
The financial information for the years ended December 31, 2003 and 2002, the nine months ended December 31, 2002, and the year ended March 31, 2002 has been restated to reflect the correction of the cutoff procedures used by the Company for recognizing sales and sales related costs. The following tables set forth the impact of the restatement for the periods presented (in thousands, except earnings per share data):
For the Nine Months endedFor the Year ended December 31, ended December 31,
2003 2003 2002 2002 2002 2002Previously Previously PreviouslyReported Restated Reported Restated Reported Restated
(Unaudited) (Unaudited)Consolidated Statement of IncomeRevenue 2,661,790$ 2,671,557$ 1,898,181$ 1,904,365$ 1,546,897$ 1,551,707$ Cost of sales (2,561,082) (2,570,434) (1,814,114) (1,820,538) (1,483,976) (1,488,587) Gross profit 100,708 101,123 84,067 83,827 62,921 63,120 Operating expenses (73,718) (73,781) (63,898) (63,800) (49,135) (49,109) Income from operations 26,990 27,342 20,169 20,027 13,786 14,011 Income from continuing operations
before income taxes 27,618 27,970 18,243 18,101 11,756 11,981 Provision for income taxes (5,744) (5,809) (3,898) (3,948) (1,884) (1,934) Net income 21,874$ 22,161$ 14,345$ 14,153$ 9,872$ 10,047$ Basic earnings per share from
continuing operations 1.03$ 1.04$ 0.69$ 0.68$ 0.47$ 0.48$ Diluted earnings per share from
continuing operations 0.98$ 0.99$ 0.66$ 0.65$ 0.45$ 0.46$
As of December 31, 2003 2003 2002 2002
Previously PreviouslyReported Restated Reported Restated
Consolidated Balance SheetAccounts and notes receivable, net 192,119$ 243,612$ 177,360$ 212,578$ Total current assets 311,491 354,663 262,580 295,289 Total assets 357,678 400,850 312,287 344,996 Total current liabilities 204,762 246,595 180,359 212,016 Total stockholders' equity 148,379 149,718 127,730 128,782
(Continued)
Page 15 of 72

NOTES TO SELECTED FINANCIAL DATA (Continued)
For the Year ended March 31,
2002 2002 2001 2001Previously PreviouslyReported Restated Reported Restated
Consolidated Statement of IncomeRevenue 1,365,065$ 1,369,392$ 1,529,242$ 1,522,961$ Cost of sales (1,288,891) (1,293,568) (1,457,500) (1,450,640) Gross profit 76,174 75,824 71,742 72,321 Operating expenses (54,885) (54,830) (57,590) (57,672) Income from operations 21,289 20,994 14,152 14,649 Income from continuing operations
before income taxes 23,226 22,931 16,343 16,840 Provision for income taxes (5,991) (5,947) (4,557) (4,662) Net income 17,235$ 16,984$ 10,634$ 11,026$ Basic earnings per share from
continuing operations 0.83$ 0.82$ 0.55$ 0.57$ Diluted earnings per share from
continuing operations 0.81$ 0.80$ 0.55$ 0.57$
As of March 31,2002 2002 2001 2001
Previously PreviouslyReported Restated Reported Restated
Consolidated Balance SheetAccounts and notes receivable, net 132,586$ 161,054$ 125,863$ 148,657$ Total current assets 213,139 240,459 188,225 209,828 Total assets 257,923 285,243 222,165 243,768 Total current liabilities 133,851 160,294 112,439 132,914 Total stockholders' equity 116,439 117,316 103,860 104,988
Page 16 of 72
Item 7. Management’s Discussion and Analysis of Financial Condition and Results of Operations The following discussion should be read in conjunction with “Item 6 - Selected Financial Data,” and with the consolidated financial statements and related notes thereto appearing elsewhere in this Form 10-K. The following discussion may contain forward-looking statements, and our actual results may differ significantly from the results suggested by these forward-looking statements. Some factors that may cause our results to differ materially from the results and events anticipated or implied by such forward-looking statements are described in “Item 1 – Business – Risk Factors.”
Overview
We market fuel and related services to marine and aviation customers throughout the world. In our marine fuel services
business, we offer marine fuel and related services to a broad base of customers, including international container and tanker fleets, and time-charter operators, as well as to the United States and foreign governments. In our aviation fuel services business, we offer aviation fuel and related services to passenger, cargo and charter airlines, as well as to corporate customers and the United States and foreign governments. We provide competitive prices, credit terms, fuel management and price risk management services, and single-supplier convenience. We also offer flight plans and weather reports to our corporate aviation customers.
In our marine fuel services business, we purchase and resell fuel, and act as brokers for others. Profit from our marine fuel
services business is determined primarily by the volume and commission rate of brokering business generated and by the volume and gross profit achieved on fuel resales. Our profitability also depends on our operating expenses, which may be significantly affected to the extent that we are required to provide for potential bad debts. Profit from our aviation fuel services business is directly related to the volume and the gross profit achieved on fuel sales, as well as our operating expenses, which may be significantly affected to the extent that we are required to provide for potential bad debts. We do not act as brokers for our aviation fuel services business.
In January 2002 and April 2004, we acquired the operations of the Oil Shipping group of companies and Tramp Oil, respectively. These acquisitions form part of our worldwide marine fuel services business and were accounted for as purchases. Accordingly, the results of operations of these acquisitions were included with our results since their respective dates of acquisition. In December 2000, we entered into a joint venture agreement with Signature Flight Support Corporation through the acquisition of a 50% equity interest in PAFCO. From January 1, 2001 to December 31, 2003, we used the equity method of accounting to record our share of the earnings and losses of this aviation joint venture. In addition, the amortized interest expense on the non-interest bearing promissory note was also included in net earnings from this aviation joint venture. Effective January 1, 2004, with the implementation of FIN No. 46, we consolidated PAFCO’s financial position and results of operations, after elimination of all significant intercompany accounts, transactions and profits.
Restatement We have restated our previously reported consolidated financial statements for the years ended December 31, 2003 and 2002, the nine months ended December 31, 2002, and the year ended March 31, 2002 to reflect the correction of the cutoff procedures used by the Company for recognizing sales and sales related costs. Under the corrected cutoff procedures, revenues and sales related costs are recognized at the time fuel deliveries are made and related services are performed. Because we contract with third parties for fuel deliveries and the performance of the related services, this causes delays in our receiving the necessary information for invoicing. As a result of these delays, the Company had historically recorded revenue and sales related costs when supporting documentation relating to fuel deliveries and related services had been received from third parties. We have also restated our previously reported consolidated statement of cash flows for the years ended December 31, 2004, 2003 and 2002, and the nine months ended December 31, 2002 to reflect the correction of the presentation of borrowings and repayments under the Company’s revolving credit facility. Under the corrected presentation, borrowings and repayments are shown on a gross rather than net basis. Reportable Segments We have two reportable operating businesses: marine and aviation fuel services. Corporate expenses are allocated to the segments based on usage, where possible, or on other factors according to the nature of the activity. Financial information with respect to our business segments is provided in Note 9 to the accompanying consolidated financial statements included in this Form 10-K.
Page 17 of 72
Critical Accounting Policies and Estimates The discussion and analysis of our financial condition and results of operations are based upon the consolidated financial statements included elsewhere in this Form 10-K, which have been prepared in accordance with accounting principles generally accepted in the United States. The preparation of these financial statements requires us to make estimates and judgments that affect the reported amounts of assets, liabilities, revenues and expenses, and related disclosure of contingent assets and liabilities. On an on-going basis, we evaluate our estimates, including those related to unbilled revenue and related costs of sales, bad debts, deferred tax assets and liabilities, goodwill and identifiable intangible assets, and certain accrued liabilities. We base our estimates on historical experience and on various other assumptions that are believed to be reasonable under the circumstances, the results of which form the basis for making judgments about the carrying values of assets and liabilities that are not readily apparent from other sources. Actual results may differ from these estimates under different assumptions or conditions. We have identified the policies below as critical to our business operations and the understanding of our results of operations. For a detailed discussion on the application of these and other accounting policies, see Note 1 to the accompanying consolidated financial statements included in this Form 10-K.
Revenue Recognition
Revenue is recognized when fuel deliveries are made and title passes to the customer, or as fuel related services are performed.
Accounts and Notes Receivable and Allowance for Bad Debts
Credit extension, monitoring and collection are performed by each of our business segments. Each segment has a credit committee. The credit committees are responsible for approving credit limits above certain amounts, setting and maintaining credit standards, and managing the overall quality of the credit portfolio. We perform ongoing credit evaluations of our customers and adjust credit limits based upon payment history and the customer’s current credit worthiness, as determined by our review of our customer’s credit information. We extend credit on an unsecured basis to many of our customers. Accounts receivable are deemed past due based on contractual terms agreed with our customers. We continuously monitor collections and payments from our customers and maintain a provision for estimated credit losses based upon our historical experience with our customers, current market and industry conditions of our customers, and any specific customer collection issues that we have identified. Accounts and notes receivable are reduced by an allowance for amounts that may become uncollectible in the future. We had accounts and notes receivable of $490.8 million and $243.6 million, net of allowance for bad debts of $11.3 million and $10.5 million, as of December 31, 2004 and 2003, respectively. Accounts and notes receivable are written-off when it becomes apparent based upon age or customer circumstances that such amounts will not be collected. We believe the level of our allowance for bad debts is reasonable based on our experience and our analysis of the net realizable value of our trade receivables at December 31, 2004. We cannot guarantee that we will continue to experience the same credit loss rates that we have experienced in the past, since adverse changes in the marine and aviation industries, or changes in the liquidity or financial position of our customers, could have a material adverse effect on the collectability of our Accounts and notes receivable and our future operating results. If credit losses exceed established allowances, our results of operation and financial condition may be adversely affected. For additional information on the credit risks inherent in our business, see “Risk Factors” in Item 1 of this Form 10-K.
Goodwill and Identifiable Intangible Assets
Goodwill represents our cost in excess of net assets, including identifiable intangible assets, of the acquired companies and the PAFCO aviation joint venture. The identifiable intangible assets for customer relations existing at the date the acquisitions were recorded and are being amortized over their useful lives of five to seven years. We account for goodwill and identifiable intangible assets in accordance with Statement of Financial Accounting Standards (“SFAS”) No. 142, “Goodwill and Other Intangible Assets.” Among other provisions, SFAS No. 142 states that goodwill shall not be amortized prospectively. We recorded amortization of our identifiable intangible assets of $1.2 million for the year ended December 31, 2004, $368 thousand for the years ended December 31, 2003 and 2002, and $276 thousand for the nine months ended December 31, 2002.
Page 18 of 72

The future estimated amortization of our identifiable intangible assets is as follows (in thousands):
For the Year ending December 31,2005 $ 1,448 2006 1,448 2007 1,080 2008 1,080 2009 1,080 Thereafter 1,350
$ 7,486
In accordance with SFAS No. 142, goodwill must be reviewed annually (or more frequently under certain circumstances) for impairment. The initial step of the goodwill impairment test compares the fair value of a reporting unit with its carrying amount, including goodwill. Based on results of these comparisons as of December 31, 2004, goodwill in each of our reporting units is not considered impaired. Accordingly, no impairment charges were recognized.
Income Taxes
Income tax expense is provided for using the asset and liability method, under which deferred tax assets and liabilities are determined based upon the temporary differences between the financial statement and income tax bases of assets and liabilities using currently enacted tax rates. Deferred tax assets are reduced by a valuation allowance if, based on the weight of available evidence, it is more likely than not that all or a portion of the recorded deferred tax assets will not be realized in future periods. As of December 31, 2004, we have not recorded a valuation allowance. Results of Operations Overview Our profitability improved in 2004 due to increases both in metric tons of fuel sold in marine and in gallons of fuel sold in aviation, and a decrease in the provision for bad debts. Earnings were adversely affected by decreases in both the gross profit per metric ton sold in marine and gross profit per gallon sold in aviation, by increases in salaries and wages and in other operating expenses, and by the effect of non-operating expenses recorded in 2004 versus non-operating income recorded in 2003. The increase in marine business volume in 2004 was primarily due to the Tramp Oil acquisition and additional sales to new and existing customers. The decrease in gross profit per metric ton sold in marine in 2004 reflects sustained high marine fuel prices, competitive pressures, and the acquisition of lower margin business from Tramp Oil. The increase in sales volume and the decrease in gross profit per gallon in the aviation business in 2004 were primarily due to growth in our fuel management business, which is a higher credit quality, lower margin business, as well as new commercial business. The decrease in the provision for bad debts in 2004 was primarily due to a shift of business in favor of higher credit quality, high volume commercial business as well as the recording of bad debt expenses in 2003 relating to the write-off of receivables from two international airlines that filed for bankruptcy. The increases in salaries and wages and other operating expenses in 2004 were due to the additional operating costs of Tramp Oil as well as higher overall operating costs associated with increased business activities. Negative changes in non-operating items in 2004 were primarily due to the recognition of exchange losses relating to the conversion into US dollars of foreign currencies acquired in connection with the Tramp Oil acquisition and higher interest expense associated with borrowings under our revolving credit facility. We may experience decreases in future sales volume and margins as a result of deterioration in the world economy, or in the shipping or aviation industries, and continued conflicts and instability in the Middle East, Asia and Latin America, as well as potential future terrorist activities and possible military retaliation. In addition, because fuel costs represent a significant part of a vessel’s and airline's operating expenses, volatile and/or high fuel prices can adversely affect our customers’ businesses, and consequently the demand for our services, and our results of operations. See “Risk Factors” in Item 1 of this Form 10-K.
Page 19 of 72

Year ended December 31, 2004 compared to Year ended December 31, 2003
Revenue. Our revenue for the year ended December 31, 2004 was $5.65 billion, an increase of $2.98 billion, as compared to revenue of $2.67 billion for the year ended December 31, 2003. Our revenue increase was primarily due to increases in business volume in marine and aviation. Our revenue during these periods was attributable to the following segments (in thousands):
For the Year ended December 31,2004 2003
Restated
Marine fuel services 3,031,474$ 1,644,598$ Aviation fuel services 2,622,899 1,026,959 Total 5,654,373$ 2,671,557$
Our marine fuel services segment contributed $3.03 billion in revenue for the year ended December 31, 2004, an increase of $1.39 billion, or 84.3%, over the prior year. Of the total increase in marine revenue, $1.25 billion pertained to increased business volume, primarily due to the acquisition of Tramp Oil, as well as additional sales to new and existing customers. The remaining revenue increase of $134.4 million was due to a 6.8% increase in the average price per metric ton sold. Our aviation fuel services segment contributed $2.62 billion in revenue for the year ended December 31, 2004, an increase of $1.59 billion over the prior year. Increased volume in aviation contributed $970.0 million of the total increase in aviation revenue, with the remaining revenue increase of $626.0 million pertaining to a 30.4% increase in the average price per gallon sold. The increase in aviation sales volume was largely due to the growth in our fuel management business, new commercial business, and the consolidation of PAFCO, our aviation joint venture with Signature. See Note 7 to the accompanying consolidated financial statements included in this Form 10-K for additional information. Gross Profit. Our gross profit of $130.0 million for the year ended December 31, 2004 increased $28.8 million, or 28.5%, as compared to the prior year. Our gross margin decreased from 3.8% for the year ended December 31, 2003, to 2.3% for the year ended December 31, 2004. Our marine fuel services gross margin of 2.1% decreased from 3.0% in the prior year. However, our gross profit in the marine fuel services segment increased $14.4 million, or 29.5%, due to increased business volume, partially offset by a lower gross profit per metric ton sold. Our marine segment gross profit was also reduced due to a write-down in the fourth quarter of 2004 of fuel inventory associated with our exit from the Panamanian market, a market area we acquired as part of the Tramp Oil transaction. The decrease in gross profit per metric ton sold in marine reflects competitive pressures. Our gross profit in the aviation fuel services business increased $14.4 million, or 27.6%, while our aviation fuel services gross margin decreased to 2.5% for the year ended December 31, 2004, as compared to 5.1% for the prior year. The increase in our gross profit in the aviation fuel services segment was primarily due to increased business volume. The decrease in aviation gross margin reflects the business volume growth in our lower margin fuel management business. Operating Expenses. Total operating expenses for the year ended December 31, 2004 were $93.0 million, as compared to $73.8 million for the year ended December 31, 2003. The increase in operating expenses of $19.2 million, or 26.0%, was due to increases in salaries and wages of $13.0 million and in other operating expenses of $8.1 million, partially offset by a decrease in provision for bad debts of $1.9 million. The overall increase in operating expenses for 2004 reflects the additional operating expenses of Tramp Oil and the overall higher operating costs associated with increased business activities. The increase in salaries and wages was primarily due to new hires, the additional employees from Tramp Oil, and higher performance based incentive compensation. The increase in other operating expenses was primarily the result of the additional other operating expenses of Tramp Oil, higher business travel, in part due to the acquisition and integration of Tramp Oil, and higher professional fees, insurance, payroll taxes and credit facility loan and letters of credit fees. The decrease in the provision for bad debts for 2004 was primarily due to a shift of business in favor of higher credit quality, high volume commercial business, and market condition improvement of our marine customers as well as the recording of bad debt expenses in 2003 relating to the write-off of receivables from two international airlines that filed for bankruptcy.
Page 20 of 72

Operating Income. Our income from operations for the year ended December 31, 2004 was $37.0 million, an increase of $9.6 million, or 35.2%, as compared to income from operations for the year ended December 31, 2003. Income from operations during these periods by segment was as follows (in thousands):
For the Year ended December 31,2004 2003
RestatedMarine fuel services 23,150$ 18,476$ Aviation fuel services 29,093 21,970
52,243 40,446 Corporate overhead (15,267) (13,104) Total 36,976$ 27,342$
The marine fuel services segment earned $23.2 million in income from operations for the year ended December 31, 2004, an increase of $4.7 million, or 25.3%, as compared to the prior year. This increase reflects the 29.5% growth in gross profit, partially offset by higher operating expenses. The aviation fuel services segment’s income from operations was $29.1 million for the year ended December 31, 2004, an increase of $7.1 million, or 32.4%, as compared to the prior year. This improvement was due to the 27.6% increase in gross profit, partially offset by increased operating expenses. Corporate overhead costs not charged to the business segments totaled $15.3 million for the year ended December 31, 2004, as compared to $13.1 million during the prior year. For explanations of the increases in operating expenses for the year ended December 31, 2004 as compared to the prior year, see the above discussion on operating expenses. Other Income (Expense). During the year ended December 31, 2004, we reported $1.4 million in other expense, net, as compared to other income, net, of $628 thousand for the prior year. This $2.1 million variance was primarily due to the recognition of exchange losses relating to conversion into U.S. dollars of foreign currencies acquired in connection with the Tramp Oil acquisition, increased interest expense due to borrowings on our revolving credit facility for working capital, and the effect of the consolidation of our PAFCO aviation joint venture. Taxes. For the year ended December 31, 2004, our effective tax rate was 19.6%, for an income tax provision of $7.0 million, as compared to 20.8% and an income tax provision of $5.8 million for the year ended December 31, 2003. The lower tax rate resulted primarily from increased operating income in low tax foreign jurisdictions. Net Income and Diluted Earnings per Share. Net income and diluted earnings per share for the year ended December 31, 2004 were $28.6 million and $1.22, respectively, as compared to $22.2 million and $0.99 during the prior year. Included in the results for the year ended December 31, 2004 was a charge of $824 thousand, or $0.04 per basic and diluted share, relating to the inventory write-down in the fourth quarter of 2004 associated with our exit from the Panamanian market, net of reduced performance based compensation and taxes.
Year ended December 31, 2003 compared to Year ended December 31, 2002 (unaudited)
Revenue. Our revenue for the year ended December 31, 2003 was $2.67 billion, an increase of $767.2 million, or 40.3%, as compared to revenue of $1.90 billion for the year ended December 31, 2002. Our revenue increase was mainly due to increases in both business volume and fuel sale prices, related to higher world oil prices. Our revenue during these periods was attributable to the following segments (in thousands):
For the Year ended December 31,2003 2002
Restated Restated(Unaudited)
Marine fuel services 1,644,598$ 1,287,417$ Aviation fuel services 1,026,959 616,948
Total 2,671,557$ 1,904,365$
Page 21 of 72
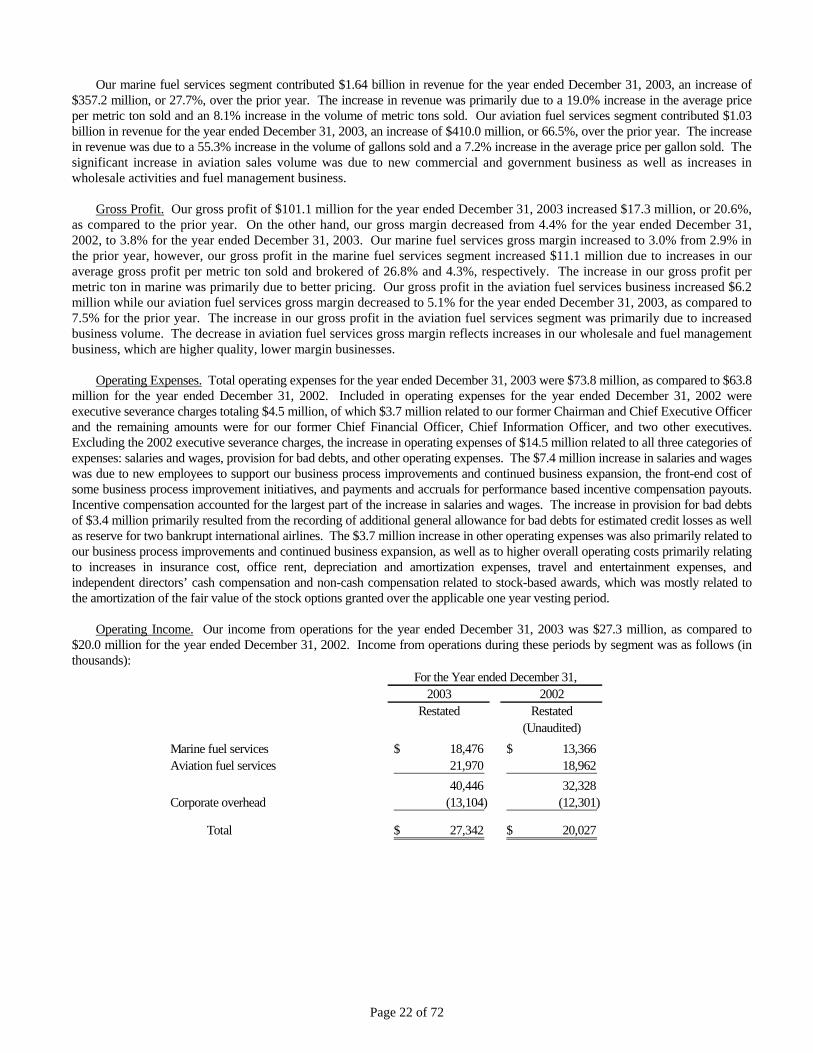
Our marine fuel services segment contributed $1.64 billion in revenue for the year ended December 31, 2003, an increase of $357.2 million, or 27.7%, over the prior year. The increase in revenue was primarily due to a 19.0% increase in the average price per metric ton sold and an 8.1% increase in the volume of metric tons sold. Our aviation fuel services segment contributed $1.03 billion in revenue for the year ended December 31, 2003, an increase of $410.0 million, or 66.5%, over the prior year. The increase in revenue was due to a 55.3% increase in the volume of gallons sold and a 7.2% increase in the average price per gallon sold. The significant increase in aviation sales volume was due to new commercial and government business as well as increases in wholesale activities and fuel management business. Gross Profit. Our gross profit of $101.1 million for the year ended December 31, 2003 increased $17.3 million, or 20.6%, as compared to the prior year. On the other hand, our gross margin decreased from 4.4% for the year ended December 31, 2002, to 3.8% for the year ended December 31, 2003. Our marine fuel services gross margin increased to 3.0% from 2.9% in the prior year, however, our gross profit in the marine fuel services segment increased $11.1 million due to increases in our average gross profit per metric ton sold and brokered of 26.8% and 4.3%, respectively. The increase in our gross profit per metric ton in marine was primarily due to better pricing. Our gross profit in the aviation fuel services business increased $6.2 million while our aviation fuel services gross margin decreased to 5.1% for the year ended December 31, 2003, as compared to 7.5% for the prior year. The increase in our gross profit in the aviation fuel services segment was primarily due to increased business volume. The decrease in aviation fuel services gross margin reflects increases in our wholesale and fuel management business, which are higher quality, lower margin businesses. Operating Expenses. Total operating expenses for the year ended December 31, 2003 were $73.8 million, as compared to $63.8 million for the year ended December 31, 2002. Included in operating expenses for the year ended December 31, 2002 were executive severance charges totaling $4.5 million, of which $3.7 million related to our former Chairman and Chief Executive Officer and the remaining amounts were for our former Chief Financial Officer, Chief Information Officer, and two other executives. Excluding the 2002 executive severance charges, the increase in operating expenses of $14.5 million related to all three categories of expenses: salaries and wages, provision for bad debts, and other operating expenses. The $7.4 million increase in salaries and wages was due to new employees to support our business process improvements and continued business expansion, the front-end cost of some business process improvement initiatives, and payments and accruals for performance based incentive compensation payouts. Incentive compensation accounted for the largest part of the increase in salaries and wages. The increase in provision for bad debts of $3.4 million primarily resulted from the recording of additional general allowance for bad debts for estimated credit losses as well as reserve for two bankrupt international airlines. The $3.7 million increase in other operating expenses was also primarily related to our business process improvements and continued business expansion, as well as to higher overall operating costs primarily relating to increases in insurance cost, office rent, depreciation and amortization expenses, travel and entertainment expenses, and independent directors’ cash compensation and non-cash compensation related to stock-based awards, which was mostly related to the amortization of the fair value of the stock options granted over the applicable one year vesting period. Operating Income. Our income from operations for the year ended December 31, 2003 was $27.3 million, as compared to $20.0 million for the year ended December 31, 2002. Income from operations during these periods by segment was as follows (in thousands):
For the Year ended December 31,2003 2002
Restated Restated(Unaudited)
Marine fuel services 18,476$ 13,366$ Aviation fuel services 21,970 18,962
40,446 32,328 Corporate overhead (13,104) (12,301)
Total 27,342$ 20,027$
Page 22 of 72
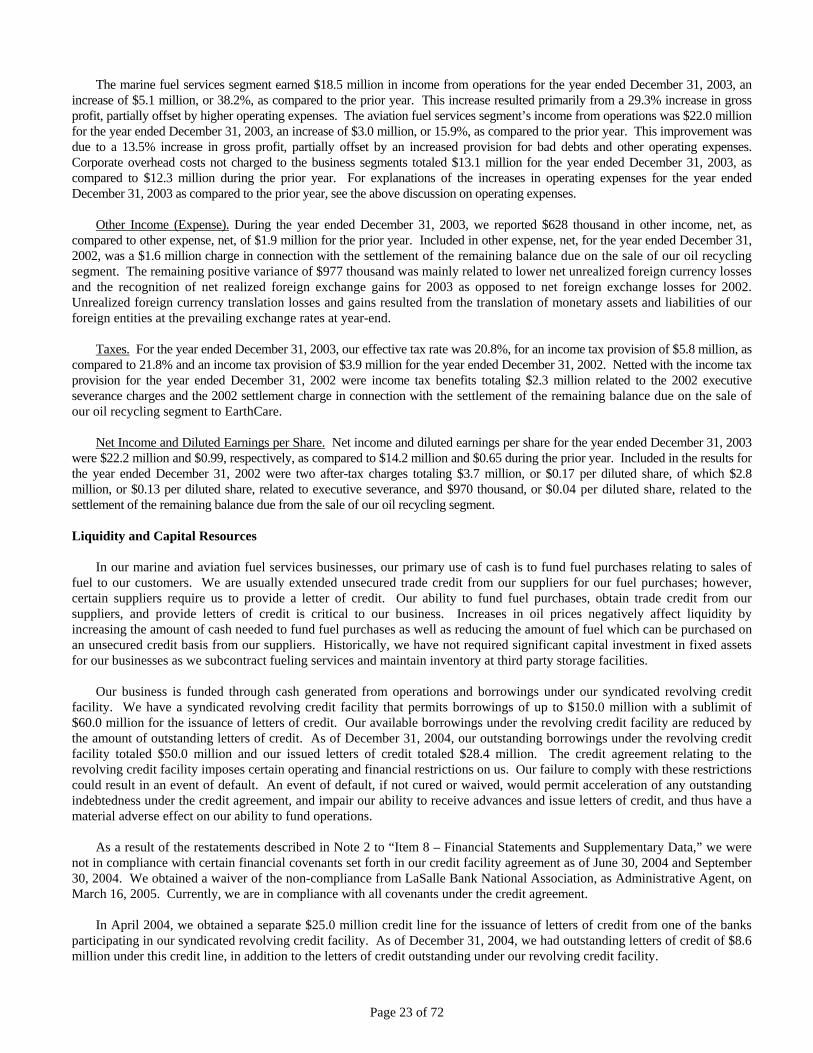
The marine fuel services segment earned $18.5 million in income from operations for the year ended December 31, 2003, an increase of $5.1 million, or 38.2%, as compared to the prior year. This increase resulted primarily from a 29.3% increase in gross profit, partially offset by higher operating expenses. The aviation fuel services segment’s income from operations was $22.0 million for the year ended December 31, 2003, an increase of $3.0 million, or 15.9%, as compared to the prior year. This improvement was due to a 13.5% increase in gross profit, partially offset by an increased provision for bad debts and other operating expenses. Corporate overhead costs not charged to the business segments totaled $13.1 million for the year ended December 31, 2003, as compared to $12.3 million during the prior year. For explanations of the increases in operating expenses for the year ended December 31, 2003 as compared to the prior year, see the above discussion on operating expenses. Other Income (Expense). During the year ended December 31, 2003, we reported $628 thousand in other income, net, as compared to other expense, net, of $1.9 million for the prior year. Included in other expense, net, for the year ended December 31, 2002, was a $1.6 million charge in connection with the settlement of the remaining balance due on the sale of our oil recycling segment. The remaining positive variance of $977 thousand was mainly related to lower net unrealized foreign currency losses and the recognition of net realized foreign exchange gains for 2003 as opposed to net foreign exchange losses for 2002. Unrealized foreign currency translation losses and gains resulted from the translation of monetary assets and liabilities of our foreign entities at the prevailing exchange rates at year-end. Taxes. For the year ended December 31, 2003, our effective tax rate was 20.8%, for an income tax provision of $5.8 million, as compared to 21.8% and an income tax provision of $3.9 million for the year ended December 31, 2002. Netted with the income tax provision for the year ended December 31, 2002 were income tax benefits totaling $2.3 million related to the 2002 executive severance charges and the 2002 settlement charge in connection with the settlement of the remaining balance due on the sale of our oil recycling segment to EarthCare.
Net Income and Diluted Earnings per Share. Net income and diluted earnings per share for the year ended December 31, 2003
were $22.2 million and $0.99, respectively, as compared to $14.2 million and $0.65 during the prior year. Included in the results for the year ended December 31, 2002 were two after-tax charges totaling $3.7 million, or $0.17 per diluted share, of which $2.8 million, or $0.13 per diluted share, related to executive severance, and $970 thousand, or $0.04 per diluted share, related to the settlement of the remaining balance due from the sale of our oil recycling segment. Liquidity and Capital Resources In our marine and aviation fuel services businesses, our primary use of cash is to fund fuel purchases relating to sales of fuel to our customers. We are usually extended unsecured trade credit from our suppliers for our fuel purchases; however, certain suppliers require us to provide a letter of credit. Our ability to fund fuel purchases, obtain trade credit from our suppliers, and provide letters of credit is critical to our business. Increases in oil prices negatively affect liquidity by increasing the amount of cash needed to fund fuel purchases as well as reducing the amount of fuel which can be purchased on an unsecured credit basis from our suppliers. Historically, we have not required significant capital investment in fixed assets for our businesses as we subcontract fueling services and maintain inventory at third party storage facilities. Our business is funded through cash generated from operations and borrowings under our syndicated revolving credit facility. We have a syndicated revolving credit facility that permits borrowings of up to $150.0 million with a sublimit of $60.0 million for the issuance of letters of credit. Our available borrowings under the revolving credit facility are reduced by the amount of outstanding letters of credit. As of December 31, 2004, our outstanding borrowings under the revolving credit facility totaled $50.0 million and our issued letters of credit totaled $28.4 million. The credit agreement relating to the revolving credit facility imposes certain operating and financial restrictions on us. Our failure to comply with these restrictions could result in an event of default. An event of default, if not cured or waived, would permit acceleration of any outstanding indebtedness under the credit agreement, and impair our ability to receive advances and issue letters of credit, and thus have a material adverse effect on our ability to fund operations. As a result of the restatements described in Note 2 to “Item 8 – Financial Statements and Supplementary Data,” we were not in compliance with certain financial covenants set forth in our credit facility agreement as of June 30, 2004 and September 30, 2004. We obtained a waiver of the non-compliance from LaSalle Bank National Association, as Administrative Agent, on March 16, 2005. Currently, we are in compliance with all covenants under the credit agreement. In April 2004, we obtained a separate $25.0 million credit line for the issuance of letters of credit from one of the banks participating in our syndicated revolving credit facility. As of December 31, 2004, we had outstanding letters of credit of $8.6 million under this credit line, in addition to the letters of credit outstanding under our revolving credit facility.
Page 23 of 72

Higher interest rates can have a negative effect on our liquidity due to higher costs of borrowing under our $150.0 million syndicated revolving credit facility. As of December 31, 2004, we had $64.2 million of cash and cash equivalents as compared to $76.3 million of cash and cash equivalents at December 31, 2003. Our cash position can fluctuate significantly depending on the timing of payments to suppliers and receipt of payments from customers. Net cash used in continuing operating activities totaled $28.8 million for the year ended December 31, 2004 versus net cash provided by continuing operating activities of $26.7 million for the year ended December 31, 2003. This $55.5 million variance was primarily due to net changes in operating assets and liabilities as a result of increased business activities and higher fuel prices in both our aviation and marine segments. During the year ended December 31, 2004, net cash provided by investing activities was $1.2 million versus net cash used in investing activities of $3.3 million for the year ended December 31, 2003. This $4.5 million variance resulted from a reduction in capital expenditures of $869 thousand and net cash received as a result of the acquisition of Tramp Oil. See the consolidated statements of cash flows and Note 1 to the accompanying consolidated financial statements, included herein, for additional information. For the year ended December 31, 2004, net cash provided by financing activities was $15.5 million versus net cash used in financing activities of $5.0 million for the year ended December 31, 2003. This $20.5 million variance was primarily due to net borrowings under our revolving credit facility of $50.0 in 2004 and an increase in the proceeds from exercises of stock options of $5.6 million, offset by the repayment of assumed bank loans and bank overdrafts from Tramp Oil of $35.3 million. Working capital at December 31, 2004 was $181.1 million, representing an increase of $73.0 million from working capital at December 31, 2003. Our accounts and notes receivable, at December 31, 2004, excluding the allowance for bad debts, amounted to $502.1 million as compared to $254.2 million at December 31, 2003. This $247.9 million increase in accounts and notes receivable was mainly due to the additional business volume in our aviation and marine segments as well as the acquisition of Tramp Oil. At December 31, 2004, the allowance for bad debts of $11.3 million increased by $739 thousand from the balance at December 31, 2003. During the year ended December 31, 2004, we charged $4.3 million to the provision for bad debts, as compared to $6.3 million for the year ended December 31, 2003. The decrease in the provision for bad debts reflects the shift of our business in favor of higher credit quality, high volume commercial accounts. We had charge-offs in excess of recoveries of $3.6 million for the year ended December 31, 2004, as compared to $6.9 million for the year ended December 31, 2003. The decrease in the charge-offs in excess of recoveries was primarily related to the write-off of receivables from two bankrupt international airlines in 2003. For the year ended December 31, 2004, our Days Sales Outstanding (DSO) was 24 days versus 33 days for the year ended December 31, 2003. Inventories of $40.9 million, at December 31, 2004, increased $26.1 million from December 31, 2003. This increase was primarily due to changes in our fuel supply process and increased business activities in our aviation services segment, as well as the acquisition of Tramp Oil. As of December 31, 2004, prepaid expenses and other current assets increased $32.3 million primarily due to the acquisition of Tramp Oil, increased business activities, and increased mark-to-market of our outstanding derivatives at year-end. Our current liabilities, other than short-term debt, increased $220.9 million primarily due to increased business activities in our marine and aviation segments as well as the acquisition of Tramp Oil. Long-term and short-term debt increased by $48.0 million, primarily due to net borrowings of $50.0 million under our syndicated revolving credit facility, partially offset by the repayment of our acquisition debts. Stockholders’ equity amounted to $188.5 million at December 31, 2004, as compared to $149.7 million at December 31, 2003. The increase in stockholders’ equity was mainly due to $28.6 million in earnings, $11.1 million from the exercise of stock options, and $1.7 million in amortization of unearned deferred compensation, partially offset by the declaration of dividends of $3.4 million during the year ended December 31, 2004.
Page 24 of 72
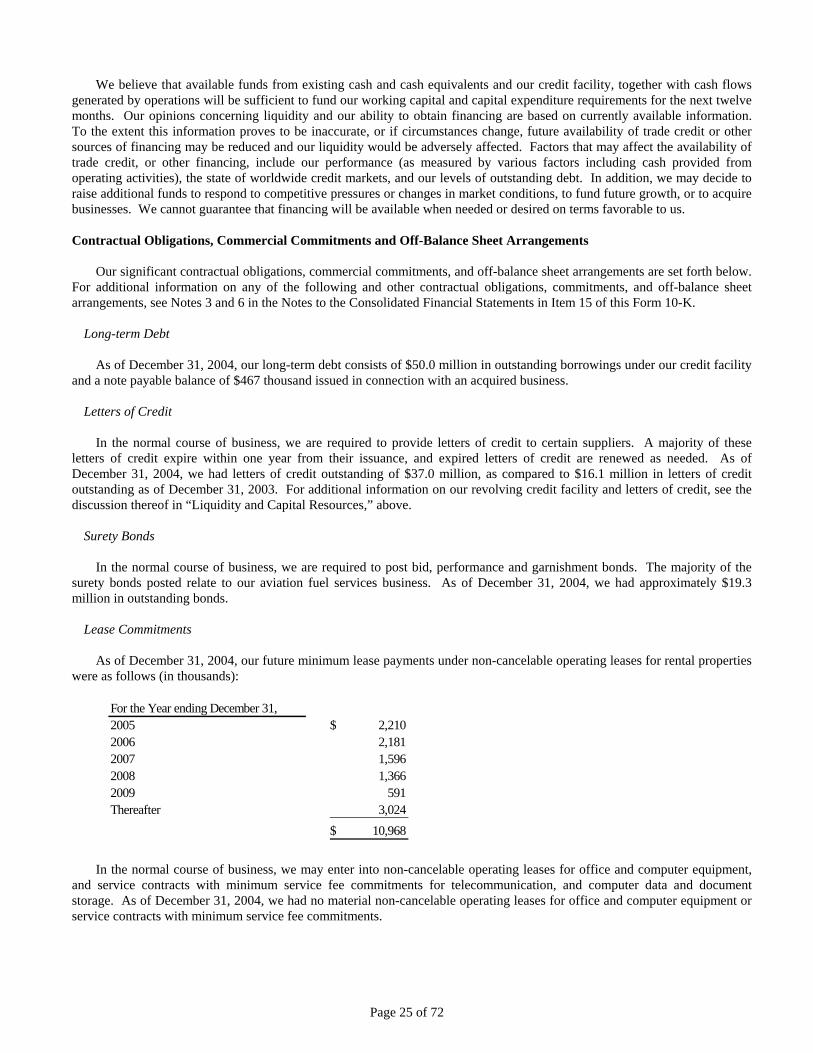
We believe that available funds from existing cash and cash equivalents and our credit facility, together with cash flows generated by operations will be sufficient to fund our working capital and capital expenditure requirements for the next twelve months. Our opinions concerning liquidity and our ability to obtain financing are based on currently available information. To the extent this information proves to be inaccurate, or if circumstances change, future availability of trade credit or other sources of financing may be reduced and our liquidity would be adversely affected. Factors that may affect the availability of trade credit, or other financing, include our performance (as measured by various factors including cash provided from operating activities), the state of worldwide credit markets, and our levels of outstanding debt. In addition, we may decide to raise additional funds to respond to competitive pressures or changes in market conditions, to fund future growth, or to acquire businesses. We cannot guarantee that financing will be available when needed or desired on terms favorable to us. Contractual Obligations, Commercial Commitments and Off-Balance Sheet Arrangements Our significant contractual obligations, commercial commitments, and off-balance sheet arrangements are set forth below. For additional information on any of the following and other contractual obligations, commitments, and off-balance sheet arrangements, see Notes 3 and 6 in the Notes to the Consolidated Financial Statements in Item 15 of this Form 10-K.
Long-term Debt As of December 31, 2004, our long-term debt consists of $50.0 million in outstanding borrowings under our credit facility and a note payable balance of $467 thousand issued in connection with an acquired business.
Letters of Credit
In the normal course of business, we are required to provide letters of credit to certain suppliers. A majority of these letters of credit expire within one year from their issuance, and expired letters of credit are renewed as needed. As of December 31, 2004, we had letters of credit outstanding of $37.0 million, as compared to $16.1 million in letters of credit outstanding as of December 31, 2003. For additional information on our revolving credit facility and letters of credit, see the discussion thereof in “Liquidity and Capital Resources,” above.
Surety Bonds
In the normal course of business, we are required to post bid, performance and garnishment bonds. The majority of the surety bonds posted relate to our aviation fuel services business. As of December 31, 2004, we had approximately $19.3 million in outstanding bonds.
Lease Commitments As of December 31, 2004, our future minimum lease payments under non-cancelable operating leases for rental properties were as follows (in thousands):
For the Year ending December 31,2005 $ 2,210 2006 2,181 2007 1,596 2008 1,366 2009 591 Thereafter 3,024
$ 10,968
In the normal course of business, we may enter into non-cancelable operating leases for office and computer equipment, and service contracts with minimum service fee commitments for telecommunication, and computer data and document storage. As of December 31, 2004, we had no material non-cancelable operating leases for office and computer equipment or service contracts with minimum service fee commitments.
Page 25 of 72

Derivatives See “Item 7A – Quantitative and Qualitative Disclosures About Market Risk,” included in this Form 10-K, for a discussion of our sale commitments and derivatives.
Employment Agreements Our Chairman and Chief Executive Officer (“CEO”) and our President and Chief Operating Officer (“COO”) are employed pursuant to employment agreements which, among other provisions, provide for an individual base salary of $525 thousand, an employment term that expires in July 2007, and termination severance benefits. Pursuant to these employment agreements, our CEO and COO are eligible to receive an annual bonus upon achievement of performance targets, which targets are based on diluted earnings per share growth. The bonus payout may range from 15% of base salary if at least 5% diluted earnings per share growth is achieved, to 200% of base salary if diluted earnings per share growth equals or exceeds 15%. For the years ended December 31, 2004 and 2003, our CEO and COO each earned an annual bonus equal to 200% of base salary. For the nine months ended December 31, 2002, our CEO and COO each earned and received a prorated annual bonus equal to 100% of base salary.
Pursuant to their employment agreements, our CEO and COO each is entitled to receive a cash severance payment if: (a) we terminate the executive for any reason other than death, disability or cause; (b) the executive resigns for good reason (generally a reduction in his responsibilities or compensation, or a breach by us), or resigns for any reason following a change of control; or (c) we elect not to renew the executive's employment agreement upon expiration, for any reason other than cause. The severance payment is equal to two times the executive's average salary and bonus during the three-year period preceding termination; provided, if (i) the termination occurs within three years after a change of control the multiple set forth above will be three instead of two, and (ii) in the case of a non-renewal, as described in item (c) above, the multiple will be one and the severance will be paid in 26 equal installments over a one year period. Upon any such termination, we will continue to provide coverage to the executive under our group insurance plans for up to three years, and all of the executive's stock options and stock grants will immediately vest. We have also entered into employment agreements with certain of our other executive officers and key employees. These agreements provide for minimum salary levels, and, in most cases, bonuses which are payable if specified performance goals are attained. Some executive officers and key employees are also entitled to severance benefits upon termination or non-renewal of their contracts under certain circumstances.
As of December 31, 2004, the approximate future minimum commitments under employment agreements, excluding
discretionary and performance bonuses, are as follows (in thousands):
For the Year ending December 31,2005 11,113$ 2006 9,541 2007 3,993 2008 474 2009 306
$ 25,427
Recent Accounting Pronouncements Variable Interest Entities
The Financial Accounting Standard Board (“FASB”) issued Interpretation FIN No. 46 (revised December 2003),
“Consolidation of Variable Interest Entities,” the provisions of which apply immediately to any variable interest entity created after January 31, 2003, apply no later than the first period ending after December 15, 2003, to special purpose corporations, and apply in the first interim period ending after March 15, 2004, to any variable interest entity created prior to February 1, 2003. This interpretation requires the consolidation of a variable interest entity by its primary beneficiary and may require the consolidation of a portion of a variable interest entity’s assets or liabilities under certain circumstances. We adopted the requirements of FIN No. 46 as of January 1, 2004. The effects of adoption were not significant. For additional information, see Note 7 in the Notes to the Consolidated Financial Statements in Item 15 of this Form 10-K.
Page 26 of 72

Inventory Costs The FASB issued Statement of Financial Accounting Standard (“SFAS”) No. 151, “Inventory Costs — an amendment of Accounting Research Bulletins No. 43, Chapter 4.” This statement clarifies the requirement that abnormal inventory-related costs be recognized as current-period charges. The provisions of this statement are to be applied prospectively to inventory costs incurred during fiscal years beginning after June 15, 2005. We do not expect the effects of adoption to be significant.
Stock-Based Compensation The FASB issued a revised SFAS No. 123, “Share-Based Payment.” This statement requires that all share-based payments to employees be recognized in the financial statements based on their grant-date fair value. Under previous guidance, companies had the option of recognizing the fair value of stock-based compensation in the consolidated financial statements or disclosing the pro forma impact of stock-based compensation on the consolidated statement of income in the notes to the consolidated financial statements. As described in Significant Accounting Policies – Stock-Based Compensation in Note 1 in the Notes to the Consolidated Financial Statements in Item 15 of this Form 10-K, we adopted the fair value recognition provisions of SFAS No. 123, as amended by SFAS No. 148, “Accounting for Stock-Based Compensation – Transition and Disclosure, an amendment of FASB Statement No. 123,” for all employee awards issued after April 2002. The revised statement is effective at the beginning of the first annual or interim period beginning after December 15, 2005, and provides two methods of adoption, the modified-prospective method and the modified-retrospective method. We anticipate adopting the revised statement using the modified-prospective method. We are currently evaluating the provisions of the revised statement but do not expect the impact of adoption to be significant. American Jobs Creation Act of 2004
In December 2004, the FASB issued Staff Position (“FSP”) No. 109-2, “Accounting and Disclosure Guidance for the Foreign Earnings Repatriation Provision within the American Jobs Creation Act of 2004.” The American Jobs Creation Act of 2004 (the “Act”), signed into law on October 22, 2004, provides for a special one-time tax deduction, or dividend received deduction (“DRD”), of 85% of qualifying foreign earnings that are repatriated in either a company’s last tax year that began before the enactment date or the first tax year that begins during the one-year period beginning on the enactment date. FSP No. 109-2 provides entities additional time to assess the effect of repatriating foreign earnings under the Act for purposes of applying SFAS No. 109, “Accounting for Income Taxes,” which typically requires the effect of a new tax law to be recorded in the period of enactment. The Company will elect, if applicable, to apply the DRD to qualifying dividends of foreign earnings in its fiscal year ending December 31, 2005.
The Company is awaiting further clarifying guidance from the U.S. Treasury Department on certain provisions of the Act.
Once this guidance is received, the Company expects to complete its evaluation of the effects of the Act during 2005. Under the limitations on the amount of dividends qualifying for the DRD of the Act, the maximum repatriation of the Company’s foreign earnings that may qualify for the special one-time DRD is approximately $111.1 million. Therefore, the range of possible amounts of qualifying dividends of foreign earnings is between zero and approximately $111.1 million. Because the evaluation is ongoing, it is not yet practical to estimate a range of possible income tax effects of potential repatriations.
Page 27 of 72

Item 7A. Quantitative and Qualitative Disclosures About Market Risk We enter into derivative contracts in the form of swaps and futures in order to mitigate the risk of market price fluctuations in marine and aviation fuel. All derivatives are recognized on the balance sheet and measured at fair value. If the derivative does not qualify as a hedge under SFAS No. 133 or is not designated as a hedge, changes in the fair value of the derivative are recognized currently in earnings. If the derivative qualifies for hedge accounting, changes in the fair value of the derivative are either recognized in income along with the corresponding change in fair value of the item being hedged for fair-value hedges or deferred in other comprehensive income (“OCI”) to the extent the hedge is effective for cash flow hedges. To qualify for hedge accounting, the derivative must qualify as either a fair-value or cash flow hedge. The hedging relationship between the hedging instruments and hedged items must be highly effective in achieving the offset of changes in fair values or cash flows attributable to the hedged risk, both at the inception of the hedge and on an ongoing basis. We measure hedge effectiveness on a quarterly basis. For the periods reported, such ineffectiveness has been immaterial. Hedge accounting is discontinued prospectively if and when a hedging instrument becomes ineffective. We assess hedge effectiveness based on total changes in the fair value of our derivative instruments. Gains and losses deferred in accumulated OCI related to cash flow hedge derivatives that become ineffective remain unchanged until the related fuel is delivered. Adjustment to the carrying amounts of hedged items is discontinued in instances where the related fair value hedging instrument becomes ineffective. The balance in the fair value hedge adjustment account is recognized in income when the hedged item is sold. If we determine that it is probable that a hedged forecasted transaction will not occur, deferred gains or losses on the related hedging instrument are recognized in earnings immediately. Gains and losses on hedging instruments and adjustments of the carrying amounts of hedged items are included in revenues and expenses in the period that the item is sold. Gains and losses on hedging instruments which represent hedge ineffectiveness and gains and losses on derivative instruments which do not qualify for hedge accounting are included in revenue in the period which they occur. The resulting cash flows are reported as cash flows from operating activities. Derivative instruments designated as cash flow hedges are used by us to mitigate the risk of variability in cash flows from marine and aviation fuel sales and purchases due to changes in market prices. Fair value derivatives are used by us to offset the exposure to changes in the fair value of our inventory. Cash Flow Hedges As of December 31, 2004, our cash flow hedges consisted of fixed price sales commitments (an “All-in-One” hedge) and fixed price swaps. The fixed price sales commitments are used to fix the prices of future fuel sales, while the fixed price swap agreements are used to fix the prices of anticipated future fuel purchases. Accordingly, changes in fair value of these derivatives fully offset in OCI and are recorded in prepaid expenses and other current assets and related accrued expenses and other current liabilities. Fair Value Derivatives As of December 31, 2004, our fair value derivatives consisted of positions in futures that are used to offset against changes in the fair value of our inventory. Changes in the fair value of the derivative are recorded in revenue and prepaid expenses and other current assets. Non-designated Derivatives As of December 31, 2004, our non-designated derivatives consisted of swap contracts with our customers and swap and collar contracts with counterparties. As part of our price risk management services, we offer swap contracts to our customers to fix their fuel prices and simultaneously we enter into a swap contract with a counterparty with substantially the same terms and conditions, and for this, we earn a fee. We recognize the fee revenue when both of the swap contracts are settled. Because these contracts are back-to-back transactions, changes in the fair value of these derivatives have no impact on earnings and are recorded in prepaid expenses and other current assets and related accrued expenses and other current liabilities.
Page 28 of 72

As of December 31, 2004 we had the following commodity related derivative instruments outstanding with average underlying prices that represent hedged prices of commodities at various market locations:
Notional Amount
Average Fair ValueSettlement Derivative Marine Aviation Underlying Asset
Period Instrument Hedge Strategy (metric tons) (gallons) Prices (Liability)(In thousands)
2005 Swap Cash flow 75,000 157.13$ 755$ Sales commitments Cash flow 75,000 170.19 (755) Sales commitments Cash flow 114,840 161.91 1,341 Swap Cash flow 114,840 162.49 (1,341) Swap Non-designated 70,040 165.98 1,245 Swap Non-designated 70,040 168.16 (1,245) Swap Non-designated 151,824 182.35 2,738 Swap Non-designated 151,824 181.07 (2,738) Swap Non-designated 37,186,210 141.99 625 Swap Non-designated 37,186,210 142.88 (625) Swap Non-designated 36,114,000 140.39 2,810 Swap Non-designated 36,114,000 138.76 (2,810) Futures Fair value 4,662,000 125.26 125 Futures Fair value 210,000 123.06 (3)
2006 Swap Non-designated 7,200 152.40 80 Swap Non-designated 7,200 152.70 (80) Swap Non-designated 24,000 159.00 468 Swap Non-designated 24,000 158.00 (468)
2007 Swap Non-designated 2,500 147.32 40 Swap Non-designated 2,500 147.75 (40)
122$
Our policy is to not use fuel related derivative financial instruments for speculative purposes. For additional information, see “Derivatives” in Note 1 to the consolidated financial statements and “Risk Factors” in Item 1 included herein. We conduct the vast majority of our business transactions in U.S. dollars. However, in certain markets, such as Mexico, Colombia and the United Kingdom, payments to some of our fuel suppliers and receipts from some of our customers are denominated in local currency. This subjects us to foreign currency exchange risk, which may adversely affect our results of operations and financial condition. We seek to minimize the risks from currency exchange rate fluctuations through our regular operating and financing activities. See “Risk Factors” in Item 1 of this Form 10-K. Item 8. Financial Statements and Supplementary Data The financial statements, together with the report thereon of PricewaterhouseCoopers LLP dated March 31, 2005, and the Selected Quarterly Financial Data (Unaudited), are set forth in Item 15 of this Form 10-K. Item 9. Changes in and Disagreements with Independent Registered Public Accounting Firm on Accounting and
Financial Disclosure There were no disagreements with accountants on any matter of accounting principles, accounting practices, or financial statement disclosure which have been reported on a Form 8-K within the twenty-four months prior to the date of the most recent financial statement.
Page 29 of 72

Item 9A. Controls and Procedures
Evaluation of Disclosure Controls and Procedures
We maintain disclosure controls and procedures that are designed to ensure that information required to be disclosed in the reports that the Company files or submits under the Securities and Exchange Act is recorded, processed, summarized and reported within the time periods specified in the SEC’s rules and forms, and that such information is accumulated and communicated to the Company’s management, including its Chief Executive Officer and Chief Financial Officer, as appropriate, to allow timely decisions regarding required financial disclosure.
As of the end of the period covered by this report, the Company carried out an evaluation, under the supervision and with the participation of the Company’s Disclosure Committee and management, including the Chief Executive Officer and Chief Financial Officer, of the effectiveness of the design and operation of the Company’s disclosure controls and procedures pursuant to Exchange Act Rule 13a-15(e). Based upon, and as of the date of, this evaluation, the Chief Executive Officer and Chief Financial Officer concluded that the Company’s disclosure controls and procedures were not effective, because of the material weaknesses discussed below. In light of the material weaknesses described below, the Company performed additional procedures to ensure that the consolidated financial statements are prepared in accordance with generally accepted accounting principles. Accordingly, management believes that the financial statements included in this report fairly present in all material respects the Company’s financial condition, results of operations and cash flows for the periods presented.
Management’s Report on Internal Control Over Financial Reporting (as restated)
Our management is responsible for establishing and maintaining adequate internal control over financial reporting, as such term is defined in Exchange Act Rule 13a-15(f). The Company’s internal control over financial reporting is a process designed to provide reasonable assurance regarding the reliability of financial reporting and the preparation of financial statements for external purposes in accordance with generally accepted accounting principles. The Company’s internal control over financial reporting includes those policies and procedures that (i) pertain to the maintenance of records that, in reasonable detail, accurately and fairly reflect the transactions and dispositions of the assets of the Company; (ii) provide reasonable assurance that transactions are recorded as necessary to permit preparation of financial statements in accordance with generally accepted accounting principles, and that receipts and expenditures of the Company are being made only in accordance with authorizations of management and directors of the Company; and (iii) provide reasonable assurance regarding prevention or timely detection of unauthorized acquisition, use or disposition of the Company’s assets that could have a material effect on the financial statements.
Because of its inherent limitations, internal control over financial reporting may not prevent or detect misstatements. Also,
projections of any evaluation of effectiveness to future periods are subject to the risk that controls may become inadequate because of changes in conditions, or that the degree of compliance with the policies or procedures may deteriorate.
Management has assessed the effectiveness of the Company’s internal control over financial reporting as of December 31, 2004. In making its assessment of internal control over financial reporting, management used the criteria described in Internal Control - Integrated Framework issued by the Committee of Sponsoring Organizations of the Treadway Commission (COSO).
A material weakness is a control deficiency, or combination of control deficiencies, that results in more than a remote
likelihood that a material misstatement of the annual or interim financial statements will not be prevented or detected. Management’s assessment identified the following three material weaknesses:
1) As of December 31, 2004, the Company did not maintain effective controls over the recognition of revenue and cost of
sales in the appropriate accounting period. Specifically, the Company was recognizing revenue and cost of sales when supporting documentation relating to fuel deliveries and related services had been received from third parties utilized by the Company to provide fuel and related services rather than at the time fuel deliveries were made and related services were performed as required by generally accepted accounting principles. This control deficiency resulted in the restatement of the Company’s financial statements for the year ended December 31, 2003, the nine months ended December 31, 2002, the interim financial statements for the four quarters in the year ended December 31, 2003, the interim financial statements for the first three quarters in the year ended December 31, 2004, and audit adjustments to the fourth quarter 2004 financial statements. Additionally, this control deficiency could result in a misstatement of revenue and cost of sales that would result in a material misstatement to the annual or interim financial statements that would not be prevented or detected. Accordingly, management has determined that this control deficiency constitutes a material weakness.
Page 30 of 72

2) As of December 31, 2004, the Company did not maintain effective controls over the accounting and financial reporting of its inventory derivative program. Specifically, the Company did not maintain effective controls to ensure the accuracy and presentation and disclosure of inventory derivative instruments. This control deficiency resulted in the restatement of the interim financial statements for the four quarters in the year ended December 31, 2003, the interim financial statements for the first three quarters in the year ended December 31, 2004, and an adjustment to the fourth quarter 2004 financial statements due to the incorrect accounting for inventory derivative instruments. Additionally, this control deficiency could result in a misstatement of inventory derivative instruments that would result in a material misstatement to the annual or interim financial statements that would not be prevented or detected. Accordingly, management has determined that this control deficiency constitutes a material weakness.
3) As of December 31, 2004, the Company did not maintain effective controls over the presentation in the statement of
cash flows of borrowings and repayments under the Company’s revolving credit facility. Specifically, the Company did not present such borrowings and payments on a gross basis. This control deficiency resulted in the restatement of the consolidated financial statements for the years ended December 31, 2004 and 2003 and the nine months ended December 31, 2002, including interim financial statements for 2004 and 2003. Additionally, this control deficiency could result in a misstatement of the borrowings and repayments under the Company’s revolving credit facility in the statement of cash flows that would result in a material misstatement to the annual or interim financial statements that would not be prevented or detected. Accordingly, management has determined that this control deficiency constitutes a material weakness.
Because of these material weaknesses, management has concluded that the Company did not maintain effective internal
control over financial reporting as of December 31, 2004, based on criteria in Internal Control – Integrated Framework.
Management had previously concluded that the Company did not maintain effective internal control over financial reporting because of the existence of the material weaknesses described in 1) and 2) above. In connection with the restatement of the Company’s consolidated financial statements described in Note 2b) to the consolidated financial statements, management has determined that the material weakness described in 3) above also existed as of December 31, 2004. Accordingly, management has restated this report.
Management's assessment of the effectiveness of the Company's internal control over financial reporting as of December 31, 2004 has been audited by PricewaterhouseCoopers LLP, an independent registered certified public accounting firm, as stated in their report appearing on pages 35 and 37 of this 2004 Annual Report. Item 9B. Other Information None.
Page 31 of 72

PART III
Item 10. Directors and Executive Officers of the Registrant The information set forth under the captions “Election of Directors,” “Information Concerning Executive Officers,” and “Section 16(a) Beneficial Ownership Reporting Compliance” in our Proxy Statement for the 2005 Annual Meeting of Shareholders is incorporated herein by reference. Item 11. Executive Compensation The information set forth under the captions “Compensation of Executive Officers” and “Board of Directors - Compensation of Directors” in our Proxy Statement for the 2005 Annual Meeting of Shareholders is incorporated herein by reference. Item 12. Security Ownership of Certain Beneficial Owners and Management and Related Stockholder Matter The information set forth under the caption “Principal Shareholders and Security Ownership of Management” in our Proxy Statement for the 2005 Annual Meeting of Shareholders is incorporated herein by reference. Item 13. Certain Relationships and Related Transactions The information set forth under the caption “Compensation of Executive Officers – Compensation Committee Interlocks and Insider Participation” in our Proxy Statement for the 2005 Annual Meeting of Shareholders is incorporated herein by reference. Item 14. Principal Accounting Fees and Services
The information set forth under the caption “Ratification of Independent Auditors” in our Proxy Statement for the 2005 Annual Meeting of Shareholders is incorporated herein by reference.
Page 32 of 72
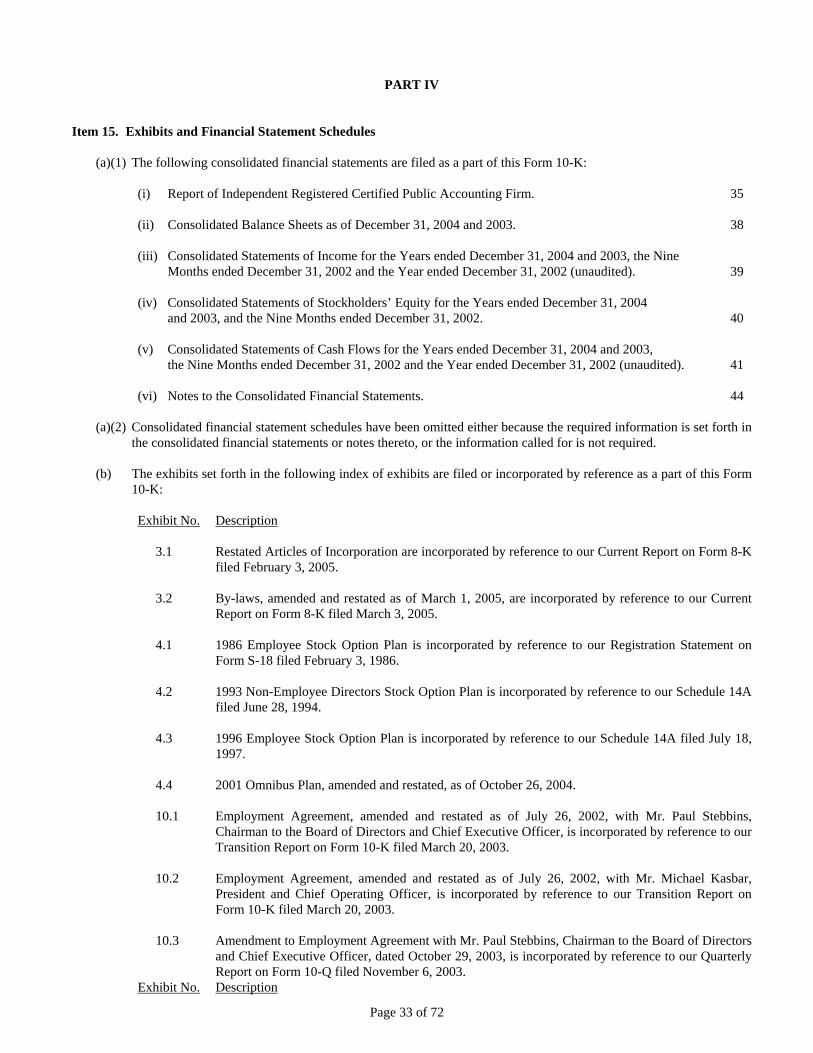
PART IV
Item 15. Exhibits and Financial Statement Schedules (a)(1) The following consolidated financial statements are filed as a part of this Form 10-K:
(i) Report of Independent Registered Certified Public Accounting Firm. 35 (ii) Consolidated Balance Sheets as of December 31, 2004 and 2003. 38 (iii) Consolidated Statements of Income for the Years ended December 31, 2004 and 2003, the Nine
Months ended December 31, 2002 and the Year ended December 31, 2002 (unaudited). 39 (iv) Consolidated Statements of Stockholders’ Equity for the Years ended December 31, 2004 and 2003, and the Nine Months ended December 31, 2002. 40 (v) Consolidated Statements of Cash Flows for the Years ended December 31, 2004 and 2003, the Nine Months ended December 31, 2002 and the Year ended December 31, 2002 (unaudited). 41 (vi) Notes to the Consolidated Financial Statements. 44
(a)(2) Consolidated financial statement schedules have been omitted either because the required information is set forth in the consolidated financial statements or notes thereto, or the information called for is not required.
(b) The exhibits set forth in the following index of exhibits are filed or incorporated by reference as a part of this Form
10-K: Exhibit No. Description
3.1 Restated Articles of Incorporation are incorporated by reference to our Current Report on Form 8-K filed February 3, 2005.
3.2 By-laws, amended and restated as of March 1, 2005, are incorporated by reference to our Current
Report on Form 8-K filed March 3, 2005. 4.1 1986 Employee Stock Option Plan is incorporated by reference to our Registration Statement on
Form S-18 filed February 3, 1986.
4.2 1993 Non-Employee Directors Stock Option Plan is incorporated by reference to our Schedule 14A filed June 28, 1994.
4.3 1996 Employee Stock Option Plan is incorporated by reference to our Schedule 14A filed July 18,
1997. 4.4 2001 Omnibus Plan, amended and restated, as of October 26, 2004.
10.1 Employment Agreement, amended and restated as of July 26, 2002, with Mr. Paul Stebbins,
Chairman to the Board of Directors and Chief Executive Officer, is incorporated by reference to our Transition Report on Form 10-K filed March 20, 2003.
10.2 Employment Agreement, amended and restated as of July 26, 2002, with Mr. Michael Kasbar,
President and Chief Operating Officer, is incorporated by reference to our Transition Report on Form 10-K filed March 20, 2003.
10.3 Amendment to Employment Agreement with Mr. Paul Stebbins, Chairman to the Board of Directors
and Chief Executive Officer, dated October 29, 2003, is incorporated by reference to our Quarterly Report on Form 10-Q filed November 6, 2003.
Exhibit No. Description
Page 33 of 72

10.4 Amendment to Employment Agreement with Mr. Michael Kasbar, President and Chief Operating
Officer, dated October 29, 2003, is incorporated by reference to our Quarterly Report on Form 10-Q filed November 6, 2003.
10.5 Employment Agreement, dated as of January 13, 2005, with Mr. Robert S. Tocci, Executive Vice
President and Chief Financial Officer, is incorporated by reference to our Current Report on Form 8-K filed January 18, 2005.
10.6 Employment Agreement, dated as of September 1, 2002, with Mr. Francis X. Shea, Executive Vice
President and Chief Risk and Administrative Officer.
10.7 Employment Agreement, dated as of July 1, 2002, with Mr. Michael S. Clementi, President and Chief Operating Officer of the Aviation Division.
10.8 2003 Executive Incentive Plan is incorporated by reference to our Schedule 14A filed April 23,
2004.
10.9 Acquisition Agreement dated as of April 2, 2004, between the World Fuel Services European Holding Company I, Limited and Carl Christian Carlsen and Jonathan Robert Cole, is incorporated by reference to our Current Report on Form 8-K filed April 16, 2004.
10.10 Acquisition Agreement dated as of April 2, 2004, between the World Fuel Services European
Holding Company I, Limited and Seefracht A.G., is incorporated by reference to our Current Report on Form 8-K filed April 16, 2004.
10.11 Credit Agreement, excluding schedules and exhibits as listed in the agreement, dated as of
December 19, 2003, between World Fuel Services Corporation, as the Company, the various Financial Institutions Party Hereto, as Lenders, and LaSalle Bank National Association, as Administrative Agent, is incorporated by reference to our Annual Report on Form 10-K filed March 15, 2004.
10.12 First Amendment to Credit Agreement, dated as of March 31, 2004, between World Fuel Services
Corporation, the Lenders and LaSalle Bank National Association, as a Lender and as the Administrative Agent for Lenders, is incorporated by reference to our Quarterly Report on Form 10-Q filed May 6, 2004.
10.13 Second Amendment to Credit Agreement, dated as of September 29, 2004, between World Fuel
Services Corporation, LaSalle Bank National Association and various other financial institutions named therein, excluding the Reaffirmation of Guarantees and Reaffirmation of Pledge Agreements, is incorporated by reference to our Current Report on Form 8-K filed October 5, 2004.
21.1 Subsidiaries of the Registrant. 23.1 Consent of Independent Registered Certified Public Accounting Firm. 31.1 Certification of the Chief Executive Officer pursuant to Rule 13a-14(a) or Rule 15d-14(a). 31.2 Certification of the Chief Operating Officer pursuant to Rule 13a-14(a) or Rule 15d-14(a). 31.3 Certification of the Chief Financial Officer pursuant to Rule 13a-14(a) or Rule 15d-14(a).
31.4 Certification of the Chief Risk and Administrative Officer pursuant to Rule 13a-14(a) or Rule 15d-
14(a).
32.1 Statement of Chief Executive Officer, Chief Operating Officer, Chief Financial Officer, and Chief Risk and Administrative Officer under Section 906 of the Sarbanes-Oxley Act of 2002 (18 U.S.C. Section 1350).
Page 34 of 72

REPORT OF INDEPENDENT REGISTERED CERTIFIED PUBLIC ACCOUNTING FIRM To the Stockholders and Board of Directors of World Fuel Services Corporation: We have completed an integrated audit of World Fuel Services Corporation’s 2004 consolidated financial statements and of its internal control over financial reporting as of December 31, 2004 and audits of its December 31, 2003 and nine months ended December 31, 2002 consolidated financial statements in accordance with the standards of the Public Company Accounting Oversight Board (United States). Our opinions, based on our audits, are presented below. Consolidated financial statements In our opinion, the consolidated financial statements listed in the index appearing under Item 15(a)(1) present fairly, in all material respects, the financial position of World Fuel Services Corporation and its subsidiaries at December 31, 2004 and 2003, and the results of their operations and their cash flows for each of the two years in the period ended December 31, 2004 and the nine months ended December 31, 2002 in conformity with accounting principles generally accepted in the United States of America. These financial statements are the responsibility of the Company’s management. Our responsibility is to express an opinion on these financial statements based on our audits. We conducted our audits of these statements in accordance with the standards of the Public Company Accounting Oversight Board (United States). Those standards require that we plan and perform the audit to obtain reasonable assurance about whether the financial statements are free of material misstatement. An audit of financial statements includes examining, on a test basis, evidence supporting the amounts and disclosures in the financial statements, assessing the accounting principles used and significant estimates made by management, and evaluating the overall financial statement presentation. We believe that our audits provide a reasonable basis for our opinion. As described in Note 2, the Company has restated its consolidated financial statements for the years ended December 31, 2004 and 2003, and for the nine months ended December 31, 2002. Internal control over financial reporting Also, we have audited management's assessment, included in the restated Management’s Report on Internal Control Over Financial Reporting appearing under Item 9A, that World Fuel Services Corporation did not maintain effective internal control over financial reporting as of December 31, 2004, because the Company did not maintain effective controls over (i) revenue and cost of sales recognition, (ii) its inventory derivative program, and (iii) presentation in the statement of cash flows of borrowings and repayments under the Company’s revolving credit facility, based on criteria established in Internal Control - Integrated Framework issued by the Committee of Sponsoring Organizations of the Treadway Commission (COSO). The Company's management is responsible for maintaining effective internal control over financial reporting and for its assessment of the effectiveness of internal control over financial reporting. Our responsibility is to express opinions on management's assessment and on the effectiveness of the Company's internal control over financial reporting based on our audit. We conducted our audit of internal control over financial reporting in accordance with the standards of the Public Company Accounting Oversight Board (United States). Those standards require that we plan and perform the audit to obtain reasonable assurance about whether effective internal control over financial reporting was maintained in all material respects. An audit of internal control over financial reporting includes obtaining an understanding of internal control over financial reporting, evaluating management's assessment, testing and evaluating the design and operating effectiveness of internal control, and performing such other procedures as we consider necessary in the circumstances. We believe that our audit provides a reasonable basis for our opinions.
Page 35 of 72
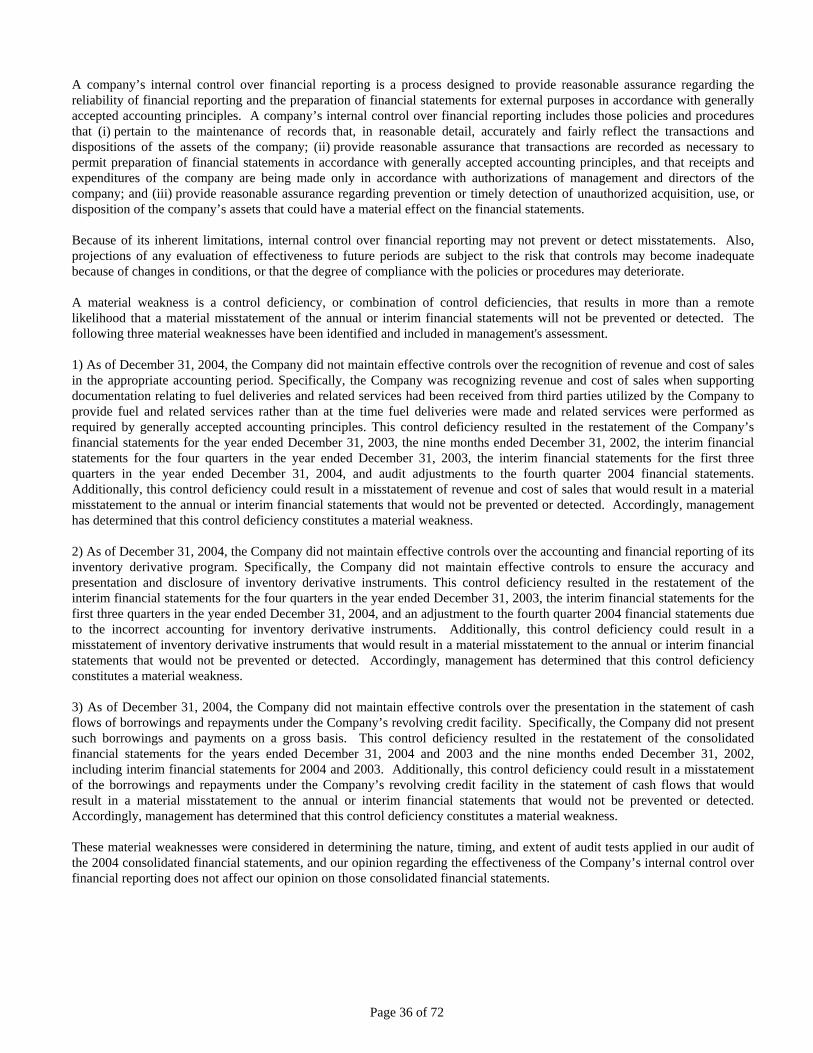
A company’s internal control over financial reporting is a process designed to provide reasonable assurance regarding the reliability of financial reporting and the preparation of financial statements for external purposes in accordance with generally accepted accounting principles. A company’s internal control over financial reporting includes those policies and procedures that (i) pertain to the maintenance of records that, in reasonable detail, accurately and fairly reflect the transactions and dispositions of the assets of the company; (ii) provide reasonable assurance that transactions are recorded as necessary to permit preparation of financial statements in accordance with generally accepted accounting principles, and that receipts and expenditures of the company are being made only in accordance with authorizations of management and directors of the company; and (iii) provide reasonable assurance regarding prevention or timely detection of unauthorized acquisition, use, or disposition of the company’s assets that could have a material effect on the financial statements. Because of its inherent limitations, internal control over financial reporting may not prevent or detect misstatements. Also, projections of any evaluation of effectiveness to future periods are subject to the risk that controls may become inadequate because of changes in conditions, or that the degree of compliance with the policies or procedures may deteriorate. A material weakness is a control deficiency, or combination of control deficiencies, that results in more than a remote likelihood that a material misstatement of the annual or interim financial statements will not be prevented or detected. The following three material weaknesses have been identified and included in management's assessment. 1) As of December 31, 2004, the Company did not maintain effective controls over the recognition of revenue and cost of sales in the appropriate accounting period. Specifically, the Company was recognizing revenue and cost of sales when supporting documentation relating to fuel deliveries and related services had been received from third parties utilized by the Company to provide fuel and related services rather than at the time fuel deliveries were made and related services were performed as required by generally accepted accounting principles. This control deficiency resulted in the restatement of the Company’s financial statements for the year ended December 31, 2003, the nine months ended December 31, 2002, the interim financial statements for the four quarters in the year ended December 31, 2003, the interim financial statements for the first three quarters in the year ended December 31, 2004, and audit adjustments to the fourth quarter 2004 financial statements. Additionally, this control deficiency could result in a misstatement of revenue and cost of sales that would result in a material misstatement to the annual or interim financial statements that would not be prevented or detected. Accordingly, management has determined that this control deficiency constitutes a material weakness.
2) As of December 31, 2004, the Company did not maintain effective controls over the accounting and financial reporting of its inventory derivative program. Specifically, the Company did not maintain effective controls to ensure the accuracy and presentation and disclosure of inventory derivative instruments. This control deficiency resulted in the restatement of the interim financial statements for the four quarters in the year ended December 31, 2003, the interim financial statements for the first three quarters in the year ended December 31, 2004, and an adjustment to the fourth quarter 2004 financial statements due to the incorrect accounting for inventory derivative instruments. Additionally, this control deficiency could result in a misstatement of inventory derivative instruments that would result in a material misstatement to the annual or interim financial statements that would not be prevented or detected. Accordingly, management has determined that this control deficiency constitutes a material weakness.
3) As of December 31, 2004, the Company did not maintain effective controls over the presentation in the statement of cash flows of borrowings and repayments under the Company’s revolving credit facility. Specifically, the Company did not present such borrowings and payments on a gross basis. This control deficiency resulted in the restatement of the consolidated financial statements for the years ended December 31, 2004 and 2003 and the nine months ended December 31, 2002, including interim financial statements for 2004 and 2003. Additionally, this control deficiency could result in a misstatement of the borrowings and repayments under the Company’s revolving credit facility in the statement of cash flows that would result in a material misstatement to the annual or interim financial statements that would not be prevented or detected. Accordingly, management has determined that this control deficiency constitutes a material weakness. These material weaknesses were considered in determining the nature, timing, and extent of audit tests applied in our audit of the 2004 consolidated financial statements, and our opinion regarding the effectiveness of the Company’s internal control over financial reporting does not affect our opinion on those consolidated financial statements.
Page 36 of 72
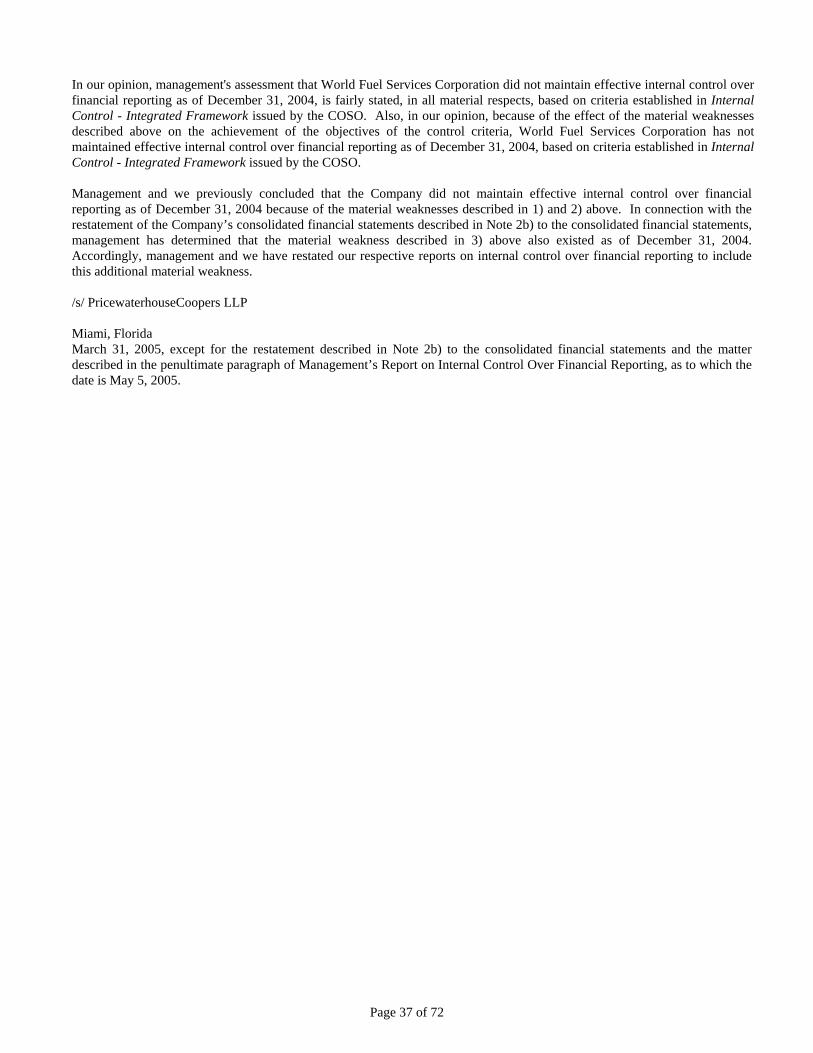
In our opinion, management's assessment that World Fuel Services Corporation did not maintain effective internal control over financial reporting as of December 31, 2004, is fairly stated, in all material respects, based on criteria established in Internal Control - Integrated Framework issued by the COSO. Also, in our opinion, because of the effect of the material weaknesses described above on the achievement of the objectives of the control criteria, World Fuel Services Corporation has not maintained effective internal control over financial reporting as of December 31, 2004, based on criteria established in Internal Control - Integrated Framework issued by the COSO. Management and we previously concluded that the Company did not maintain effective internal control over financial reporting as of December 31, 2004 because of the material weaknesses described in 1) and 2) above. In connection with the restatement of the Company’s consolidated financial statements described in Note 2b) to the consolidated financial statements, management has determined that the material weakness described in 3) above also existed as of December 31, 2004. Accordingly, management and we have restated our respective reports on internal control over financial reporting to include this additional material weakness. /s/ PricewaterhouseCoopers LLP Miami, Florida March 31, 2005, except for the restatement described in Note 2b) to the consolidated financial statements and the matter described in the penultimate paragraph of Management’s Report on Internal Control Over Financial Reporting, as to which the date is May 5, 2005.
Page 37 of 72

WORLD FUEL SERVICES CORPORATION AND SUBSIDIARIESCONSOLIDATED BALANCE SHEETS
(In thousands, except share and per share data)As of December 31,
2004 2003Restated
Current assets:Cash and cash equivalents 64,178$ 76,256$ Accounts and notes receivable, net of allowance for bad debts of $11,277 and $10,538 at
December 31, 2004 and 2003, respectively 490,780 243,612 Inventories 40,901 14,847 Prepaid expenses and other current assets 52,209 19,948
Total current assets 648,068 354,663 Property and equipment:
Leasehold and improvements 2,577 2,022 Office equipment, furniture, computer equipment and software 16,637 14,606
19,214 16,628 Accumulated depreciation and amortization (12,122) (9,665)
7,092 6,963 Other:
Goodwill, net of amortization of $3,565 at December 31, 2004 and 2003 42,347 36,860 Identifiable intangible asset, net of amortization of $1,914 and $736 at December 31, 2004
and 2003, respectively 7,486 1,104 Other assets 7,178 1,260
712,171$ 400,850$
Current liabilities:Short-term debt 1,100$ 1,600$ Accounts payable 385,243 213,945 Customer deposits 36,476 6,320 Accrued salaries and wages 10,652 9,687 Income taxes payable 6,015 4,423 Accrued expenses and other current liabilities 27,499 10,620
Total current liabilities 466,985 246,595 Long-term liabilities:
Long-term debt 50,467 1,936 Deferred compensation and other long-term liabilities 6,216 2,601
523,668 251,132 Commitments and contingencies
Preferred stock, $1.00 par value; 100,000 shares authorized, none issued - - Common stock, $0.01 par value; 50,000,000 shares authorized, 25,530,000 shares issued and
outstanding at December 31, 2004 and 2003 255 255 Capital in excess of par value 44,424 34,545 Retained earnings 159,496 134,315 Unearned deferred compensation (4,369) (2,788) Treasury stock, at cost; 2,684,000 and 3,946,000 shares at December 31, 2004 and 2003, respectively (11,303) (16,609)
188,503 149,718 712,171$ 400,850$
The accompanying notes are an integral part of these consolidated financial statements.
Assets
Stockholders' Equity
Liabilities
Page 38 of 72

WORLD FUEL SERVICES CORPORATION AND SUBSIDIARIESCONSOLIDATED STATEMENTS OF INCOME
(In thousands, except earnings per share data)
For theNine Months
endedFor the Year ended December 31, December 31,
2004 2003 2002 2002Restated Restated Restated
(Unaudited)
Revenue 5,654,373$ 2,671,557$ 1,904,365$ 1,551,707$ Cost of sales (5,524,417) (2,570,434) (1,820,538) (1,488,587)
Gross profit 129,956 101,123 83,827 63,120
Operating expenses:Salaries and wages (51,849) (38,820) (31,456) (23,458) Executive severance charges - - (4,492) (4,492) Provision for bad debts (4,338) (6,281) (2,866) (2,182) Other (36,793) (28,680) (24,986) (18,977)
(92,980) (73,781) (63,800) (49,109)
Income from operations 36,976 27,342 20,027 14,011
Other (expense) income, net:
Interest income 984 823 1,547 1,227 Interest expense (1,635) (310) (602) (389) Earnings from aviation
joint ventures, net - 493 413 310 Settlement charge - - (1,577) (1,577) Other, net (797) (378) (1,707) (1,601)
(1,448) 628 (1,926) (2,030) Income from operations before
income taxes 35,528 27,970 18,101 11,981 Provision for income taxes (6,969) (5,809) (3,948) (1,934) Net income 28,559$ 22,161$ 14,153$ 10,047$
Basic earnings per share 1.29$ 1.04$ 0.68$ 0.48$
Weighted average shares - basic 22,104 21,234 20,898 20,936
Diluted earnings per share: 1.22$ 0.99$ 0.65$ 0.46$
Diluted weighted average shares 23,454 22,338 21,790 21,800
The accompanying notes are an integral part of these consolidated financial statements.
Page 39 of 72
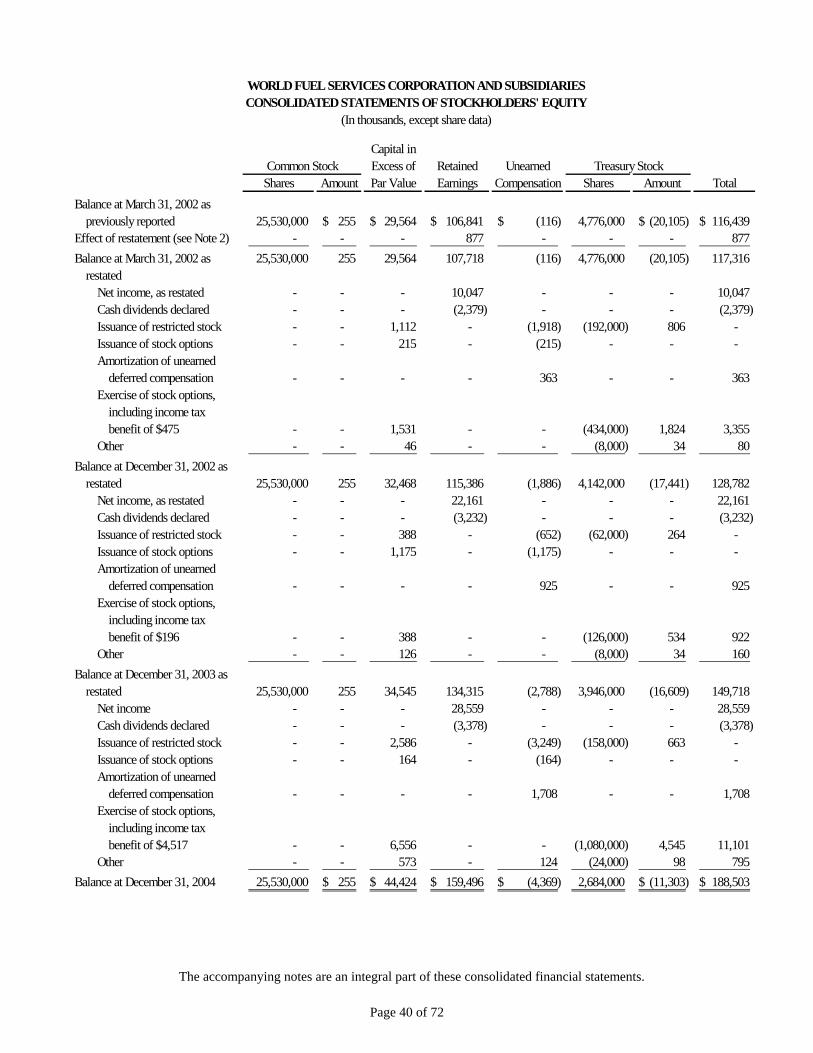
WORLD FUEL SERVICES CORPORATION AND SUBSIDIARIESCONSOLIDATED STATEMENTS OF STOCKHOLDERS' EQUITY
(In thousands, except share data)
Capital inExcess of Retained Unearned
Shares Amount Par Value Earnings Compensation Shares Amount TotalBalance at March 31, 2002 as
previously reported 25,530,000 255$ 29,564$ 106,841$ (116)$ 4,776,000 (20,105)$ 116,439$ Effect of restatement (see Note 2) - - - 877 - - - 877 Balance at March 31, 2002 as 25,530,000 255 29,564 107,718 (116) 4,776,000 (20,105) 117,316
restatedNet income, as restated - - - 10,047 - - - 10,047 Cash dividends declared - - - (2,379) - - - (2,379) Issuance of restricted stock - - 1,112 - (1,918) (192,000) 806 - Issuance of stock options - - 215 - (215) - - - Amortization of unearned
deferred compensation - - - - 363 - - 363 Exercise of stock options,
including income taxbenefit of $475 - - 1,531 - - (434,000) 1,824 3,355
Other - - 46 - - (8,000) 34 80 Balance at December 31, 2002 as
restated 25,530,000 255 32,468 115,386 (1,886) 4,142,000 (17,441) 128,782 Net income, as restated - - - 22,161 - - - 22,161 Cash dividends declared - - - (3,232) - - - (3,232) Issuance of restricted stock - - 388 - (652) (62,000) 264 - Issuance of stock options - - 1,175 - (1,175) - - - Amortization of unearned
deferred compensation - - - - 925 - - 925 Exercise of stock options,
including income taxbenefit of $196 - - 388 - - (126,000) 534 922
Other - - 126 - - (8,000) 34 160 Balance at December 31, 2003 as
restated 25,530,000 255 34,545 134,315 (2,788) 3,946,000 (16,609) 149,718 Net income - - - 28,559 - - - 28,559 Cash dividends declared - - - (3,378) - - - (3,378) Issuance of restricted stock - - 2,586 - (3,249) (158,000) 663 - Issuance of stock options - - 164 - (164) - - - Amortization of unearned
deferred compensation - - - - 1,708 - - 1,708 Exercise of stock options,
including income taxbenefit of $4,517 - - 6,556 - - (1,080,000) 4,545 11,101
Other - - 573 - 124 (24,000) 98 795 Balance at December 31, 2004 25,530,000 255$ 44,424$ 159,496$ (4,369)$ 2,684,000 (11,303)$ 188,503$
Common Stock Treasury Stock
The accompanying notes are an integral part of these consolidated financial statements.
Page 40 of 72

WORLD FUEL SERVICES CORPORATION AND SUBSIDIARIESCONSOLIDATED STATEMENTS OF CASH FLOWS
(In thousands)For the Nine
Months EndedFor the Year ended December 31, December 31,
2004 2003 2002 2002Restated Restated Restated Restated
(Unaudited)Cash flows from operating activities:
Net income 28,559$ 22,161$ 14,153$ 10,047$ Adjustments to reconcile net income to net cash
(used in) provided by operating activities -Provision for bad debts 4,338 6,281 2,866 2,182 Depreciation and amortization 3,596 3,830 2,865 2,222 Inventory write-down associated with the existing
of the Panamanian market 2,134 - - - Deferred income tax provision (benefit) 661 3,240 (2,124) (568) Earnings from aviation joint ventures, net - (493) (413) (310) Settlement charges - - 1,577 1,577 Unearned compensation amortization 1,708 925 506 363 Other non-cash operating charges 362 360 292 228 Changes in assets and liabilities, net of acquisitions
Accounts and notes receivable (156,141) (37,315) (74,477) (53,706) Inventories (18,293) (11,796) (505) (1,614) Prepaid expenses and other current assets (31,413) 2,477 (8,229) (7,509) Other assets (14) 67 (566) 157 Accounts payable 91,651 35,330 66,664 44,272 Customer deposits 29,486 1,056 1,126 1,445 Accrued salaries and wages (36) 3,976 537 (853) Income taxes payable 226 1,257 1,819 (789) Accrued expenses and other current liabilities 10,709 (5,967) 12,421 10,802 Deferred compensation and other long-term liabilities 3,682 1,341 (1,469) (1,712)
Total adjustments (57,344) 4,569 2,890 (3,813) Net cash (used in) provided by operating activities (28,785) 26,730 17,043 6,234
Cash flows from investing activities:Capital expenditures (2,398) (3,267) (3,213) (2,755) Acquisition of business, net 3,587 - (5,461) -
Net cash provided by (used in) investing activities 1,189 (3,267) (8,674) (2,755) Cash flows from financing activities:
Dividends paid on common stock (3,350) (3,182) (3,136) (2,351) Borrowings under revolving credit facility 285,000 32,000 10,000 10,000 Repayments under revolving credit facility (235,000) (32,000) (10,000) (10,000) Repayment of promissory notes (2,100) (2,527) (3,444) (2,904) Repayment of debt assumed from acquired business (35,347) - (1,500) (1,500) Proceeds from exercise of stock options 6,315 726 3,286 2,880 Purchases of treasury stock - - (1,978) -
Net cash provided by (used in) financing activities 15,518 (4,983) (6,772) (3,875) Net (decrease) increase in cash and cash equivalents (12,078) 18,480 1,597 (396) Cash and cash equivalents, at beginning of period 76,256 57,776 56,179 58,172 Cash and cash equivalents, at end of period 64,178$ 76,256$ 57,776$ 57,776$
(Continued)The accompanying notes are an integral part of these consolidated financial statements.
Page 41 of 72

WORLD FUEL SERVICES CORPORATION AND SUBSIDIARIESCONSOLIDATED STATEMENTS OF CASH FLOWS
(In thousands)
(Continued)For the
Nine MonthsEnded
For the Year ended December 31, December 31,2004 2003 2002 2002
(Unaudited)Supplemental Disclosures of Cash Flow Information
Cash paid during the period for:Interest 1,668$ 404$ 893$ 761$
Income taxes 8,786$ 6,155$ 7,629$ 6,749$
We paid cash and issued promissory notes and equity securities in connection with certain acquisitions of businesses
accounted for under the purchase method for the years ended December 31, 2004 and 2002. There were no acquisitions for the year ended December 31, 2003 or for the nine months ended December 31, 2002. The following reconciles the fair values of the assets acquired, liabilities assumed, the promissory notes issued, and the equity securities issued with net cash received (paid):
For theNine Months
EndedFor the Year ended December 31, December 31,2004 2003 2002 2002
(Unaudited)
Accounts receivable (97,603)$ -$ (18,754)$ -$ Inventory (9,895) - - - Prepaid fuel and expenses, VAT and other taxes
receivable and other current liabilities (554) - (232) - Property and equipment (149) - - - Identifiable intangible assets (7,560) - (1,840) - Goodwill (5,487) - (4,292) - Short-term debt 35,347 - 1,500 - Promissory notes, short-term portion - - 952 - Accounts payable 79,647 - 14,666 - Accrued expenses and other current liabilities
and excise, payroll and other taxes payable 6,155 - 462 - Customer deposits 670 - - - Accrued salaries and wages 1,001 - - - Income tax payable 1,262 - 29 - Promissory notes, long-term portion - - 2,048 - Equity securities issued 753 - - -
Cash received (paid) 3,587$ -$ (5,461)$ -$
(Continued)
The accompanying notes are an integral part of these consolidated financial statements.
Page 42 of 72

WORLD FUEL SERVICES CORPORATION AND SUBSIDIARIES CONSOLIDATED STATEMENTS OF CASH FLOWS
(Continued) Supplemental Schedule of Noncash Investing and Financing Activities
Cash dividends declared, but not yet paid, totaled $855 thousand and $828 thousand are included in accrued expenses and other current liabilities as of December 31, 2004 and 2003, respectively. For the construction of our corporate office in 2002 and 2003, we received an office construction allowance totaling $799 thousand from our landlord. We recorded the office construction allowance as Leasehold and improvements with a related deferred rental credit, which was included in Long-term liabilities. As of December 31, 2004, unamortized deferred rental credits relating to the construction allowance plus reimbursement of certain equipment purchases from our landlord, and the recognition of the total lease obligation on a straight-line basis, amounted to $1.1 million. These deferred charges are amortized into rental expense on a straight-line basis over the lease period. In connection with the acquisition of businesses, we issued interest and non-interest bearing promissory notes amounting to $5.0 million, in the aggregate, after discounting the non-interest bearing promissory note at 5%, in January 2002 and April 2001. See Notes 1 and 3 to the consolidated financial statements for additional information. In April 2004 and January 2002, we assumed short-term debt of $35.3 million and $1.5 million, respectively, in connection with the acquisition of businesses. See Notes 1 and 3 to the consolidated financial statements for additional information. In connection with the restricted common stock and options grants, based on the fair value of the awards, we recorded Unearned deferred compensation of $1.7 million, $1.8 million and $2.1 million for the years ended December 31, 2004, December 31, 2003 and 2002, respectively, and $2.1 million for the nine months ended December 31, 2002. Unearned deferred compensation is being amortized over the minimum vesting period of each individual award. See Note 5 to the consolidated financial statements for additional information.
The accompanying notes are an integral part of these consolidated financial statements.
Page 43 of 72

WORLD FUEL SERVICES CORPORATION AND SUBSIDIARIES NOTES TO THE CONSOLIDATED FINANCIAL STATEMENTS
1. Nature of Business, Recent Acquisitions and Significant Accounting Policies Nature of Business World Fuel Services Corporation was incorporated in Florida in July 1984 and we market fuel and related services to marine and aviation customers throughout the world. In our marine fuel services business, we offer marine fuel and related services to a broad base of customers, including international container and tanker fleets, and time-charter operators, as well as to the United States and foreign governments. In our aviation fuel services business, we offer aviation fuel and related services to passenger, cargo and charter airlines, as well as to corporate customers and the United States and foreign governments. We provide competitive prices, credit terms, fuel management and price risk management services, and single-supplier convenience. We also offer flight plans and weather reports to our corporate aviation customers. In August 2002, we changed our fiscal year-end from March 31st to a calendar year-end of December 31st. We initiated this change so we could be more directly comparable to other public companies that use a calendar year for their fiscal year. This change was first effective with respect to the nine months ended December 31, 2002. The results for the calendar year ended December 31, 2002, presented for comparative purposes in this Form 10-K, are unaudited. The 2002 calendar year results combined the audited results for the nine months ended December 31, 2002 and the unaudited results for the three months ended March 31, 2002, and no adjustments were made to the historical results. Recent Acquisitions In April 2001 and January 2002, we acquired the stock of Marine Energy Arabia Establishment Ltd., a British Virgin Islands (“BVI”) corporation, and the Oil Shipping group of companies, respectively. Both of these companies sell and market marine fuel services. The aggregate purchase price of these acquisitions was $13.6 million, including $175 thousand in acquisition costs. The aggregate purchase price consisted of $8.6 million in cash and the remainder in promissory notes. The promissory notes consisted of a $2.0 million note bearing interest at 7%, payable annually through April 2003, and a $3.3 million non-interest bearing note, which was discounted to $3.0 million using an interest rate of approximately 5%, payable annually over three years through January 2005. Both of these acquisitions were accounted for as purchases and the results of the acquired businesses have been included in our operating results since their respective dates of acquisition. Goodwill, representing the cost in excess of net assets acquired, for these acquisitions totaled $9.4 million. At the date of our January 2002 acquisition, we identified an intangible asset of approximately $1.8 million, relating to customer relations. This intangible asset is being amortized over five years using the straight-line method.
The BVI company sells and markets marine fuel services through Marine Energy Arabia Co, LLC, a United Arab Emirates (“Dubai”) corporation. The BVI company owns 49% of the Dubai company. In accordance with local laws, the Dubai entity is 51% owned by a Dubai citizen, referred to as a Sponsor. The Dubai company, pursuant to a management contract, is required to pay for the staff and administrative support provided by the BVI entity. Our BVI subsidiary has entered into various agreements with the Dubai Sponsor to prevent an unauthorized ownership transfer and to effectively grant majority control of the Dubai entity to our BVI subsidiary. Accordingly, the financial position and operations of the Dubai entity have been included in our consolidated financial statements.
Acquisitions in our marine segment continued in April 2004 when we acquired all of the outstanding shares (the “THL
Shares”) of Tramp Holdings Limited (“THL”) and the shares of Tramp Group Limited, a subsidiary of THL, which were not otherwise held by THL (the “TGL Shares”), to expand our worldwide marine fuel services business. The aggregate purchase price for the THL Shares and the TGL Shares was approximately $86.1 million, including acquisition costs of approximately $1.2 million. The aggregate purchase price consisted of $85.4 million in cash and $753 thousand in the form of restricted common stock, representing approximately 38 thousand shares and valued using the market value of our common stock on the acquisition date. The acquisition of Tramp Oil, which primarily offers fuel and fuel services, was accounted for under the purchase method. Accordingly, the operations of Tramp Oil have been included in our operating results since April 2004. At acquisition date, we identified an intangible asset relating to customer relations of $7.6 million, which is being amortized over seven years using the straight-line method. Goodwill, representing the cost in excess of the fair value of assets acquired and liabilities assumed for this acquisition, amounted to $5.5 million. Included in the fair value of assets acquired was approximately $90.0 million in cash, accordingly, the acquisition of Tramp Oil resulted in a net cash inflow of approximately $3.6 million.
Page 44 of 72

The following presents the unaudited pro forma results of operations for the years ended December 31, 2004 and 2003 as if the Tramp Oil acquisition had been completed as of January 1, 2004 and 2003, respectively (in thousands, except per share data):
For the Year ended December 31,2004 2003
(Pro Forma) (Pro Forma)
Revenue 5,912,875$ 3,712,745$
Net income 27,822$ 25,875$
Earnings per share:Basic 1.26$ 1.22$
Diluted 1.19$ 1.16$
The pro forma results of operations for the year ended December 31, 2004 reflect Tramp Oil’s net loss of $737 thousand for the three months ended March 31, 2004, which was primarily related to the recording of charges incurred by Tramp Oil in connection with the sale of the company.
Significant Accounting Policies Basis of Consolidation The accompanying consolidated financial statements and related notes to the consolidated financial statements include our accounts and those of our majority owned or controlled subsidiaries, after elimination of all significant intercompany accounts, transactions, and profits. Investments in non-majority controlled subsidiaries representing ownership of at least 20%, but less than or equal to 50%, are accounted for under the equity method. Prior to January 1, 2004, we used the equity method of accounting to record our share of the earnings and losses of our PAFCO aviation joint venture. In addition, the amortized interest expense on the non-interest bearing promissory note was also included in net earnings from aviation joint venture. Effective January 1, 2004, with the implementation of the Financial Accounting Standard Board (“FASB”) Interpretation No. 46 (“FIN No. 46”), we consolidated PAFCO’s financial position and results of operations, after elimination of all significant intercompany accounts, transactions and profits. Cash and Cash Equivalents Cash and cash equivalents are stated at cost, which approximates fair value. Cash equivalents consist of highly liquid investments with maturities of three months or less from the date of purchase. Our cash equivalents consist principally of bank repurchase agreements, bank money market accounts, bank time deposits, and commercial paper rated A1P1. Accounts and Notes Receivable and Allowance for Bad Debts Credit extension, monitoring and collection are performed by each of our business segments. Each segment has a credit committee. The credit committees are responsible for approving credit limits above certain amounts, setting and maintaining credit standards, and managing the overall quality of the credit portfolio. We perform ongoing credit evaluations of our customers and adjust credit limits based upon payment history and the customer’s current credit worthiness, as determined by our review of our customer’s credit information. We extend credit on an unsecured basis to many of our customers. Accounts receivable are deemed past due based on contractual terms agreed with our customers. We continuously monitor collections and payments from our customers and maintain a provision for estimated credit losses based upon our historical experience with our customers, current market and industry conditions of our customers, and any specific customer collection issues that we have identified. Accounts and notes receivable are reduced by an allowance for amounts that may become uncollectible in the future. We had accounts and notes receivable of $490.8 million and $243.6 million, net of allowance for bad debts of $11.3 million and $10.5 million, as of December 31, 2004 and 2003, respectively. Accounts and notes receivable are written-off when it becomes apparent based upon age or customer circumstances that such amounts will not be collected.
Page 45 of 72

The following table sets forth activities in our allowance for bad debts (in thousands): For the
Nine Monthsended
For the Year ended December 31, December 31,2004 2003 2002 2002
(Unaudited)
Balance at beginning of period 10,538$ 11,112$ 11,001$ 11,012$ Charges to provision for bad debts 4,338 6,281 2,866 2,182 Write-off of uncollectible accounts receivable (3,683) (6,924) (3,153) (2,473) Recoveries of bad debts 84 69 398 391
Balance at end of period 11,277$ 10,538$ 11,112$ 11,112$
For additional information on Accounts and notes receivable and allowance for bad debts in our marine and aviation segments, see “Business Segments” in Note 9.
Inventories Inventories are valued using average cost and are stated at the lower of cost or market. Components of inventory cost include fuel purchase costs, the related transportation costs and storage fees. Derivatives We enter into derivative contracts in the form of swaps and futures in order to mitigate the risk of market price fluctuations in marine and aviation fuel. All derivatives are recognized on the balance sheet and measured at fair value. If the derivative does not qualify as a hedge under SFAS No. 133 or is not designated as a hedge, changes in the fair value of the derivative are either recognized in income along with the corresponding change in fair value of the item being hedged for fair-value hedges or deferred in other comprehensive income (“OCI”) to the extent the hedge is effective for cash-flow hedges. To qualify for hedge accounting, the derivative must qualify as either a fair-value or cash flow hedge. The hedging relationship between the hedging instruments and hedged items must be highly effective in achieving the offset of changes in fair values or cash flows attributable to the hedged risk, both at the inception of the hedge and on an ongoing basis. We measure hedge effectiveness on a quarterly basis. For the periods reported, such ineffectiveness has been immaterial. Hedge accounting is discontinued prospectively if and when a hedging instrument becomes ineffective. We assess hedge effectiveness based on total changes in the fair value of our derivative instruments. Gains and losses deferred in accumulated OCI related to cash flow hedge derivatives that become ineffective remain unchanged until the related fuel is delivered. Adjustment to the carrying amounts of hedged items is discontinued in instances where the related fair value hedging instrument becomes ineffective. The balance in the fair value hedge adjustment account is recognized in income when the hedged item is sold. If we determine that it is probable that a hedged forecasted transaction will not occur, deferred gains or losses on the related hedging instrument are recognized in earnings immediately. Gains and losses on hedging instruments and adjustments of the carrying amounts of hedged items are included in revenues and are included in realized prices in the period that the item is sold. Gains and losses on hedging instruments which represent hedge ineffectiveness and gains and losses on derivative instruments which do not qualify for hedge accounting are included in revenue in the period which they occur. The resulting cash flows are reported as cash flows from operating activities. Derivative instruments designated as cash flow hedges are used by us to mitigate the risk of variability in cash flows from marine and aviation fuel sales and purchases due to changes in market prices. Fair value derivatives are used by us to offset the exposure to changes in the fair value of our inventory.
Page 46 of 72
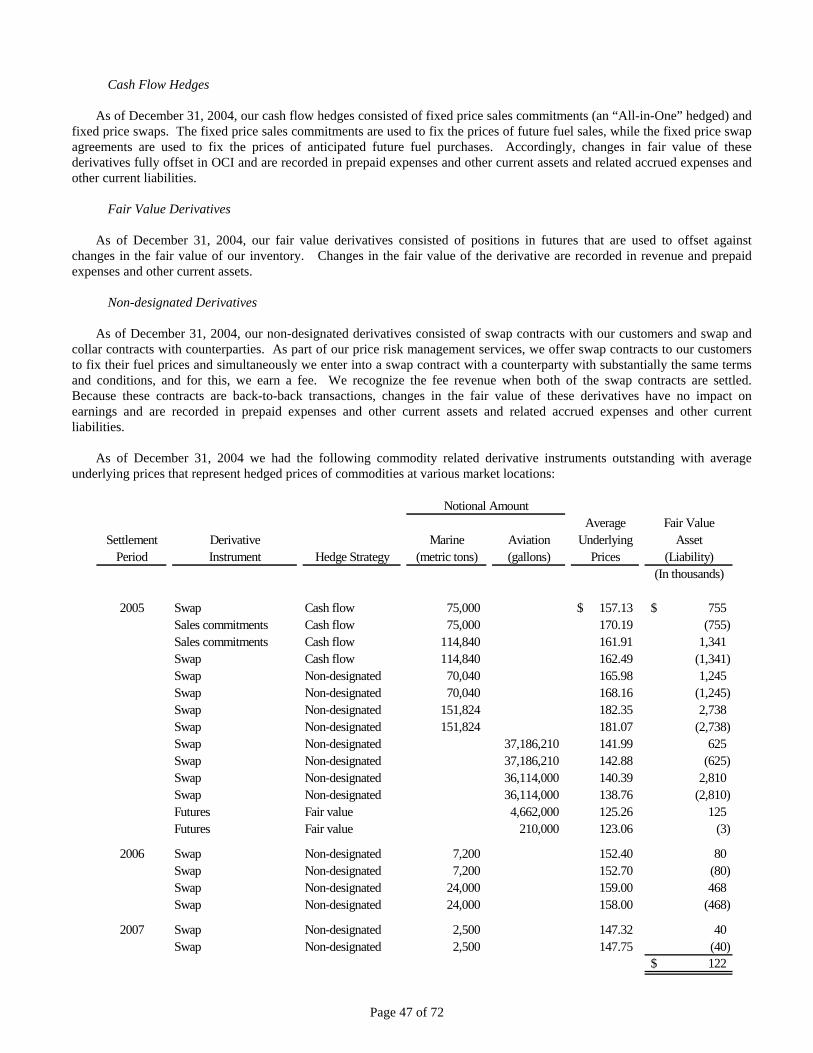
Cash Flow Hedges As of December 31, 2004, our cash flow hedges consisted of fixed price sales commitments (an “All-in-One” hedged) and fixed price swaps. The fixed price sales commitments are used to fix the prices of future fuel sales, while the fixed price swap agreements are used to fix the prices of anticipated future fuel purchases. Accordingly, changes in fair value of these derivatives fully offset in OCI and are recorded in prepaid expenses and other current assets and related accrued expenses and other current liabilities. Fair Value Derivatives As of December 31, 2004, our fair value derivatives consisted of positions in futures that are used to offset against changes in the fair value of our inventory. Changes in the fair value of the derivative are recorded in revenue and prepaid expenses and other current assets. Non-designated Derivatives As of December 31, 2004, our non-designated derivatives consisted of swap contracts with our customers and swap and collar contracts with counterparties. As part of our price risk management services, we offer swap contracts to our customers to fix their fuel prices and simultaneously we enter into a swap contract with a counterparty with substantially the same terms and conditions, and for this, we earn a fee. We recognize the fee revenue when both of the swap contracts are settled. Because these contracts are back-to-back transactions, changes in the fair value of these derivatives have no impact on earnings and are recorded in prepaid expenses and other current assets and related accrued expenses and other current liabilities.
As of December 31, 2004 we had the following commodity related derivative instruments outstanding with average underlying prices that represent hedged prices of commodities at various market locations:
Notional Amount
Average Fair ValueSettlement Derivative Marine Aviation Underlying Asset
Period Instrument Hedge Strategy (metric tons) (gallons) Prices (Liability)(In thousands)
2005 Swap Cash flow 75,000 157.13$ 755$ Sales commitments Cash flow 75,000 170.19 (755) Sales commitments Cash flow 114,840 161.91 1,341 Swap Cash flow 114,840 162.49 (1,341) Swap Non-designated 70,040 165.98 1,245 Swap Non-designated 70,040 168.16 (1,245) Swap Non-designated 151,824 182.35 2,738 Swap Non-designated 151,824 181.07 (2,738) Swap Non-designated 37,186,210 141.99 625 Swap Non-designated 37,186,210 142.88 (625) Swap Non-designated 36,114,000 140.39 2,810 Swap Non-designated 36,114,000 138.76 (2,810) Futures Fair value 4,662,000 125.26 125 Futures Fair value 210,000 123.06 (3)
2006 Swap Non-designated 7,200 152.40 80 Swap Non-designated 7,200 152.70 (80) Swap Non-designated 24,000 159.00 468 Swap Non-designated 24,000 158.00 (468)
2007 Swap Non-designated 2,500 147.32 40 Swap Non-designated 2,500 147.75 (40)
122$
Page 47 of 72

Page 48 of 72

Property and Equipment Property and equipment are carried at cost less accumulated depreciation and amortization. Depreciation and amortization are calculated on a straight-line basis over the estimated useful lives of the assets as follows:
Years
Leasehold and improvements 5 – 10 Office equipment, furniture, computer equipment and software 3 – 7
Costs of major additions and improvements, including appropriate interest, are capitalized and expenditures for maintenance and repairs, which do not extend the life of the asset, are expensed. Upon sale or disposition of property and equipment, the cost and related accumulated depreciation and amortization are eliminated from the accounts and any resulting gain or loss is credited or charged to income. Long-lived assets held and used by us are reviewed based on market factors and operational considerations for impairment whenever events or changes in circumstances indicate that the carrying amount of an asset may not be recoverable. Computer software costs, including website development costs, are accounted for under Statement of Position (“SOP”) 98-1, “Accounting for the Costs of Computer Software Developed or Obtained for Internal Use” and Emerging Issues Task Force (“EITF”) Issue No. 00-2, “Accounting for Web Site Development Costs.” SOP 98-1 established criteria for determining which costs of developing or obtaining internal-use computer software should be charged to expense and which should be capitalized. EITF Issue No. 00-2 states that the accounting for specific web site development costs should be based on a model consistent with SOP 98-1. As of December 31, 2004 and 2003, capitalized computer software costs, including web site development costs, amounted to $1.5 million and $928 thousand, net of accumulated amortization of $5.8 million and $4.8 million, respectively. Goodwill and Identifiable Intangible Assets
Goodwill represents our cost in excess of net assets, including identifiable intangible assets, of the acquired companies and the PAFCO aviation joint venture. The identifiable intangible assets for customer relations existing at the date the acquisitions were recorded and are being amortized over their useful lives of five to seven years. We account for goodwill and identifiable intangible assets in accordance with Statement of Financial Accounting Standards (“SFAS”) No. 142, “Goodwill and Other Intangible Assets.” Among other provisions, SFAS No. 142 states that goodwill shall not be amortized prospectively. Accordingly, no goodwill amortization was recorded subsequent to the adoption of SFAS No. 142 in April 2001. We recorded amortization of our identifiable intangible asset of $1.2 million for the year ended December 31, 2004, $368 thousand for the years ended December 31, 2003 and 2002, and $276 thousand for the nine months ended December 31, 2002. The future estimated amortization of our identifiable intangible assets is as follows (in thousands):
For the Year ending December 31,2005 $ 1,448 2006 1,448 2007 1,080 2008 1,080 2009 1,080 Thereafter 1,350
$ 7,486
In accordance with SFAS No. 142, goodwill must be reviewed annually (or more frequently under certain circumstances) for impairment. The initial step of the goodwill impairment test compares the fair value of a reporting unit with its carrying amount, including goodwill. Based on results of these comparisons as of December 31, 2004, goodwill in each of our reporting units is not considered impaired. Accordingly, no impairment charges were recognized.
Revenue Recognition
Revenue is recognized when fuel deliveries are made and title passes to the customer, or as fuel related services are performed. Income Taxes
Page 49 of 72

Income tax expense is provided for using the asset and liability method, under which deferred tax assets and liabilities are determined based upon the temporary differences between the financial statement and income tax bases of assets and liabilities using currently enacted tax rates. Deferred tax assets are reduced by a valuation allowance if, based on the weight of available evidence, it is more likely than not that all or a portion of the recorded deferred tax assets will not be realized in future periods. As of December 31, 2004, we have not recorded a valuation allowance. Foreign Currency Our primary functional currency is the U.S. dollar, which also serves as our reporting currency. Our foreign entities translate their monetary assets and liabilities, denominated in foreign currencies, at fiscal year-end exchange rates while non-monetary assets and liabilities, denominated in foreign currencies, are translated at historical rates. Income and expense accounts, denominated in foreign currencies, are translated at the average rates in effect during the year, except for depreciation which was translated at historical rates. Unrealized foreign currency gains and losses relating to the translation of foreign entities’ assets, liabilities, income, and expense are included in other, net in the accompanying consolidated statements of income, in the period incurred. Some of our aviation fuel purchases are denominated in local currency. Realized foreign currency exchange gains and losses on transactions are included in other, net in the accompanying consolidated statements of income, in the period incurred. The following table identifies the unrealized and realized foreign currency gains and losses included in other, net in the accompanying consolidated statements of income (in thousands):
For theNine Months
endedFor the Year ended December 31, December 31,2004 2003 2002 2002
(Unaudited)
Unrealized foreign currency losses, net (542)$ (592)$ (1,177)$ (1,234)$
Realized foreign currency (losses) gains, net (84)$ 70$ (519)$ (364)$
Stock Split On January 20, 2005, we announced a two-for-one split of our common stock. The additional shares issued pursuant to the stock split were distributed on February 15, 2005 to stockholders of record as of February 1, 2005. In connection with the stock split, on January 31, 2005, our Board of Directors approved an increase in World Fuel’s authorized common stock from 25 million shares to 50 million shares. Stockholders’ equity has been restated to give retroactive recognition to the stock split for all periods presented by reclassifying the par value of the additional shares arising from the split from capital in excess of par value to common stock. All references in the financial statements and notes to number of shares and per share amounts reflect the increase in the number of common stock authorized for issuance and the stock split. Comprehensive Income The only significant item effecting other comprehensive income (“OCI”) relates to derivatives, which had no material impact on OCI, and, thus, net income was equal to comprehensive income for all periods presented. Use of Estimates The preparation of financial statements in conformity with accounting principles generally accepted in the United States requires management to make certain estimates and assumptions that affect the reported amounts of assets, liabilities, and disclosure of contingent assets and liabilities at the date of the financial statements and the reported amounts of revenue and expenses during the reporting period. Such estimates primarily relate to the realizability of accounts and notes receivable, and unsettled transactions and events as of the date of the financial statements. Accordingly, actual results could differ from estimated amounts.
Page 50 of 72

Fair Value of Financial Instruments The estimated fair values of financial instruments, which are presented herein, have been determined by our management using available market information and appropriate valuation methodologies. However, considerable judgment was required in interpreting market data to develop estimates of fair value. Accordingly, the estimates presented herein are not necessarily indicative of amounts we could realize in a current market sale. Accounts and notes receivable, net, and accounts payable are reflected in the accompanying consolidated balance sheets at amounts considered by management to reasonably approximate fair value due to their short-term nature.
We estimate the fair value of our long-term debt using discounted cash flow analysis based on our current borrowing rates for similar types of debt. As of December 31, 2004, the carrying value of the long-term debt approximated the fair value of such instruments.
Stock-Based Compensation
Effective April 2002, we adopted the accounting provision of Statement of Financial Accounting Standards (“SFAS”) No. 123, “Accounting for Stock-Based Compensation,” as amended by SFAS No. 148, “Accounting for Stock-Based Compensation – Transition and Disclosure, an amendment of FASB Statement No. 123,” to account for stock options granted to our employees and non-employee directors using the prospective method. Under the fair value recognition provision, as of the grant date, we recorded the fair value of the stock options granted as Unearned deferred compensation, which is amortized over the minimum vesting period of each individual award as compensation cost. For stock options granted prior to April 2002, we continued to use the intrinsic value method of Accounting Principles Board Opinion No. 25, “Accounting for Stock Issued to Employee,” and related interpretations. Accordingly, no compensation expense has been recognized for such stock options when the exercise price was at or above market price of our common stock on the date of grant.
The fair value of each stock option granted was estimated using the Black-Scholes option pricing model. The following
table summarizes the weighted average fair value of the stock options granted for each of the following periods and the related weighted average assumptions:
For theNine Months
endedFor the Year ended December 31, December 31,2004 2003 2002 2002
Fair-value of stock option (per share) 3.91$ 2.25$ 2.66$ 2.66$ Expected life (in years) 1.64 3.00 2.86 2.86 Dividend yields 1.64% 1.41% 1.39% 1.39%Risk-free interest rates 1.96% 1.95% 2.47% 2.47%Volatility 20.00% 20.00% 18.80% 18.80%
The fair value of restricted common stock granted to employees, based on the market value of our common stock on the date of grant, is recorded as Unearned deferred compensation and is being amortized over the minimum vesting period of each individual stock grant. The weighted average fair value of the restricted stock granted and issued to employees was $20.63 per share, $10.38 per share and $10.02 per share for the years ended December 31, 2004, 2003 and 2002, respectively, and $10.02 per share for the nine months ended December 31, 2002.
Page 51 of 72

The following table reflects pro forma net income and earnings per share if the fair value based method had been applied to all outstanding and unvested stock-based awards in each period (in thousands, except earnings per share):
For theNine Months
endedFor the Year ended December 31, December 31,
2004 2003 2002 2002Restated Restated Restated
(Unaudited)Net income:
Net income 28,559$ 22,161$ 14,153$ 10,047$ Add: Employee and non-employee compensation expense
net of taxes, included in reported net income forrestricted stock and stock options granted 1,050 569 311 223
Deduct: Employee and non-employee compensationexpense, net of taxes, determined under the fair valuemethod for restricted stock and stock options granted (1,079) (636) (458) (325)
Pro forma net income 28,530$ 22,094$ 14,006$ 9,945$
Basic earnings per share:As reported 1.29$ 1.04$ 0.68$ 0.48$ Pro forma 1.29$ 1.04$ 0.67$ 0.48$
Diluted earnings per share:As reported 1.22$ 0.99$ 0.65$ 0.46$ Pro forma 1.22$ 0.99$ 0.64$ 0.46$
Earnings Per Share Basic earnings per share is computed based on the weighted average number of common shares outstanding. Diluted earnings per share is based on the sum of the weighted average number of common shares outstanding, non-vested restricted common stock and common stock equivalents arising out of employee stock options and non-employee stock options and warrants. Our net income is the same for basic and diluted earnings per share calculations. Shares used to calculate earnings per share are as follows (in thousands):
For theNine Months
endedFor the Year ended December 31, December 31,
2004 2003 2002 2002(Unaudited)
Basic weighted average shares 22,104 21,234 20,898 20,936 Restricted stock and stock units weighted average shares 392 276 122 144 Common stock equivalents 958 828 770 720 Diluted weighted average shares used in the
calculation of diluted earnings per share 23,454 22,338 21,790 21,800 Weighted average shares of stock options
and warrants included in the determinationof common stock equivalents for thecalculation of diluted earnings per share 2,574 2,866 2,848 2,336
Weighted average shares of stock optionswhich are not included in the calculationof diluted earnings per share becausetheir impact is antidilutive 42 314 704 336
Page 52 of 72

Reclassifications Certain amounts in prior periods have been reclassified to conform to current year’s presentation. Recent Accounting Pronouncements Variable Interest Entities
The FASB issued Interpretation FIN No. 46 (revised December 2003), “Consolidation of Variable Interest Entities,” the
provisions of which apply immediately to any variable interest entity created after January 31, 2003, apply no later than the first period ending after December 15, 2003, to special purpose corporations, and apply in the first interim period ending after March 15, 2004, to any variable interest entity created prior to February 1, 2003. This interpretation requires the consolidation of a variable interest entity by its primary beneficiary and may require the consolidation of a portion of a variable interest entity’s assets or liabilities under certain circumstances. We adopted the requirements of FIN No. 46 as of January 1, 2004. The effects of adoption were not significant. See Note 7, Aviation Joint Venture, for additional information.
Inventory Costs The FASB issued SFAS No. 151, “Inventory Costs — an amendment of Accounting Research Bulletins No. 43, Chapter 4.” This statement clarifies the requirement that abnormal inventory-related costs be recognized as current-period charges. The provisions of this statement are to be applied prospectively to inventory costs incurred during fiscal years beginning after June 15, 2005. We do not expect the effects of adoption to be significant.
Stock-Based Compensation The FASB issued a revised SFAS No. 123, “Share-Based Payment.” This statement requires that all share-based payments to employees be recognized in the financial statements based on their grant-date fair value. Under previous guidance, companies had the option of recognizing the fair value of stock-based compensation in the consolidated financial statements or disclosing the pro forma impact of stock-based compensation on the consolidated statement of income in the notes to the consolidated financial statements. As described above, we adopted the fair value recognition provisions of SFAS No. 123, as amended by SFAS No. 148, “Accounting for Stock-Based Compensation – Transition and Disclosure, an amendment of FASB Statement No. 123,” for all employee awards issued after April 2002. The revised statement is effective at the beginning of the first annual or interim period beginning after December 15, 2005, and provides two methods of adoption, the modified-prospective method and the modified-retrospective method. We anticipate adopting the revised statement using the modified-prospective method. We are currently evaluating the provisions of the revised statement but do not expect the impact of adoption to be significant. American Jobs Creation Act of 2004
In December 2004, the FASB issued Staff Position (“FSP”) No. 109-2, “Accounting and Disclosure Guidance for the Foreign Earnings Repatriation Provision within the American Jobs Creation Act of 2004.” The American Jobs Creation Act of 2004 (the “Act”), signed into law on October 22, 2004, provides for a special one-time tax deduction, or dividend received deduction (“DRD”), of 85% of qualifying foreign earnings that are repatriated in either a company’s last tax year that began before the enactment date or the first tax year that begins during the one-year period beginning on the enactment date. FSP No. 109-2 provides entities additional time to assess the effect of repatriating foreign earnings under the Act for purposes of applying SFAS No. 109, “Accounting for Income Taxes,” which typically requires the effect of a new tax law to be recorded in the period of enactment. The Company will elect, if applicable, to apply the DRD to qualifying dividends of foreign earnings in its fiscal year ending December 31, 2005.
The Company is awaiting further clarifying guidance from the U.S. Treasury Department on certain provisions of the Act. Once this guidance is received, the Company expects to complete its evaluation of the effects of the Act during 2005. Under the limitations on the amount of dividends qualifying for the DRD of the Act, the maximum repatriation of the Company’s foreign earnings that may qualify for the special one-time DRD is approximately $111.1 million. Therefore, the range of possible amounts of qualifying dividends of foreign earnings is between zero and approximately $111.1 million. Because the evaluation is ongoing, it is not yet practical to estimate a range of possible income tax effects of potential repatriations.
Page 53 of 72

2. Restatement of Financial Statements a) Restatement related to cutoff procedures used to recognize revenue and cost of sales We have restated our previously reported consolidated financial statements for the years ended December 31, 2003 and 2002, the nine months ended December 31, 2002, and the year ended March 31, 2002. The restatement reflects the correction of the cutoff procedures used to recognize sales and sales related costs. Under the corrected cutoff procedures, revenues and sales related costs are recognized at the time fuel deliveries are made and related services are performed. Because we contract with third parties for fuel deliveries and the performance of the related services, this causes delays in our receiving the necessary information for invoicing. As a result of these delays, the Company had historically recorded revenue and sales related costs when supporting documentation relating to fuel deliveries and related services had been received from third parties. The primary impact of the restatement to correct the cutoff procedures used to recognize sales and sales related costs on the balance sheets at December 31, 2003 and 2002, and March 31, 2002 was to increase accounts receivable and accounts payable. In the statements of income, the principal impact of the restatement was to increase revenue and cost of sales for the years ended December 31, 2003 and 2002, the nine months ended December 31, 2002, and the year ended March 31, 2002. For the statements of cash flows, there was no impact to net cash from operating activities, investing activities, and financing activities since the changes were to net income and other operating cash flow items.
We also determined that certain of our historical accounts were misclassified including inventories, prepaid and other current assets, accounts payable, and accrued expenses and other current liabilities. Accordingly, the consolidated balance sheets as of December 31, 2003 and 2002, and March 31, 2002 have been adjusted to reflect the correct classifications.
The following table sets forth the impact of the restatement to correct the cutoff procedures used to recognize sales and sales related costs and the correction of the misclassification on amounts previously reported in the consolidated balance sheets (in thousands):
Previously Previously PreviouslyReported Restated Reported Restated Reported Restated
Balance SheetAccounts and notes
receivable, net 192,119$ 243,612$ 177,360$ 212,578$ 132,586$ 161,054$ Inventories 22,940 14,847 5,144 3,051 2,219 1,437 Prepaid expenses and other
current assets 20,176 19,948 22,300 21,884 20,162 19,796 Total current assets 311,491 354,663 262,580 295,289 213,139 240,459 Total assets 357,678 400,850 312,287 344,996 257,923 285,243 Accounts payable 172,885 213,945 146,784 178,615 108,267 134,343 Accrued salaries and wages 9,547 9,687 5,634 5,711 6,461 6,564 Accrued expenses and other
current liabilities 9,987 10,620 16,788 16,537 5,443 5,707 Total current liabilities 204,762 246,595 180,359 212,016 133,851 160,294 Total liabilities 209,299 251,132 184,557 216,214 141,484 167,927 Retained earnings 132,976 134,315 114,334 115,386 106,841 107,718 Total stockholders' equity 148,379 149,718 127,730 128,782 116,439 117,316 Total liabilities and
stockholders' equity 357,678 400,850 312,287 344,996 257,923 285,243
As of December 31, 2003 As of December 31, 2002 As of March 31, 2002
Page 54 of 72

The following table sets forth the impact of the restatement to correct the cutoff procedures used to recognize sales and sales related costs on amounts previously reported in the consolidated statements of income (in thousands, except earnings per share data):
For the Nine Months For the YearFor the Year ended December 31, ended December 31, ended March 31,
2003 2003 2002 2002 2002 2002 2002 2002Previously Previously Previously PreviouslyReported Restated Reported Restated Reported Restated Reported Restated
(Unaudited) (Unaudited)Statement of IncomeRevenue 2,661,790$ 2,671,557$ 1,898,181$ 1,904,365$ 1,546,897$ 1,551,707$ 1,365,065$ 1,369,392$ Cost of sales (2,561,082) (2,570,434) (1,814,114) (1,820,538) (1,483,976) (1,488,587) (1,288,891) (1,293,568) Gross profit 100,708 101,123 84,067 83,827 62,921 63,120 76,174 75,824 Salaries and wages (38,757) (38,820) (31,554) (31,456) (23,484) (23,458) (30,515) (30,460) Operating expenses (73,718) (73,781) (63,898) (63,800) (49,135) (49,109) (54,885) (54,830) Income from operations 26,990 27,342 20,169 20,027 13,786 14,011 21,289 20,994 Income from operations before
income taxes 27,618 27,970 18,243 18,101 11,756 11,981 23,226 22,931 Provision for income taxes (5,744) (5,809) (3,898) (3,948) (1,884) (1,934) (5,991) (5,947) Net income 21,874$ 22,161$ 14,345$ 14,153$ 9,872$ 10,047$ 17,235$ 16,984$ Basic earnings per share 1.03$ 1.04$ 0.69$ 0.68$ 0.47$ 0.48$ 0.83$ 0.82$ Diluted earnings per share 0.98$ 0.99$ 0.66$ 0.65$ 0.45$ 0.46$ 0.81$ 0.80$ b) Restatement related to cash flows presentation of revolving credit facility We have restated our previously reported consolidated statement of cash flows for the years ended December 31, 2004, 2003 and 2002, and the nine months ended December 31, 2002 to reflect the correction of the presentation of borrowings and repayments under our revolving credit facility. Under the corrected presentation, borrowings and repayments are reported on a gross rather than net basis. The restatement had no impact on the net cash flows from operating activities or investing activities or financing activities for any of the interim periods of 2004 or 2003. The following table sets forth the impact of the restatement on amounts previously reported within cash flows from financing activities in the consolidated statements of cash flows (in thousands):
For the Nine Months Ended
For the Year ended December 31, December 31, 2004 2003 2002 2002
(Unaudited)Borrowings under revolving credit facility, as restated 285,000$ 32,000$ 10,000$ 10,000$ Repayments under revolving credit facility, as restated (235,000) (32,000) (10,000) (10,000) Net borrowings under revolving credit facility, previously reported 50,000$ -$ -$ -$
3. Debt
In September 2004, the credit agreement relating to our syndicated revolving credit facility (the “Credit Agreement”) was amended to increase available borrowings under the revolving credit facility to $145.0 million and to provide us with the option to increase available borrowings to $150.0 million. Pursuant to the amendment, our sublimit for the issuance of letters of credit was increased to $60.0 million. In October 2004, we exercised our option to increase our available borrowings under the revolving credit facility to $150.0 million. Our available borrowings under the revolving credit facility are reduced by the amount of outstanding letters of credit. Borrowings under the revolving credit facility bear interest at market rates plus applicable margins ranging from zero percent to 0.75% for U.S. Prime Rate loans and 1.25% to 2.00% for LIBOR Rate loans, as defined. As of December 31, 2004, our weighted average interest rate on borrowings under the credit facility was 4.27%. Letters of credit issued under the revolving credit facility are subject to fees (“L/C Fees”) ranging from 1.25% to 2.00%. Interest and L/C Fees are payable quarterly and at maturity in arrears. The Credit Agreement expires on December 19, 2006.
Page 55 of 72

As of December 31, 2004, our outstanding borrowings under the revolving credit facility totaled $50.0 million and our issued letters of credit totaled $28.4 million. Our weighted average daily outstanding borrowings during the years ended December 31, 2004 and 2003 were $26.7 million and $5.8 million, respectively.
The Credit Agreement imposes certain operating and financial restrictions on us. Our failure to comply with these
restrictions, including meeting certain financial ratios, could result in an event of default. An event of default, if not cured or waived, would permit acceleration of any outstanding indebtedness under the Credit Agreement, and impair our ability to receive advances and issue letters of credit, and thus have a material adverse effect on our ability to fund operations.
As a result of the restatements described in Note 2, we were not in compliance with certain financial covenants set forth in
our credit facility agreement as of June 30, 2004 and September 30, 2004. We obtained a waiver of the non-compliance from LaSalle Bank National Association, as Administrative Agent, on March 16, 2005. Currently, we are in compliance with all covenants under the Credit Agreement.
In April 2004, we obtained a separate $25.0 million credit line for the issuance of letters of credit from one of the banks
participating in our revolving credit facility. Letters of credit issued under this credit line are subject to fees at market rates payable semiannually and at maturity in arrears. This credit line is renewable on an annual basis. As of December 31, 2004, we had outstanding letters of credit of $8.6 million under this credit line, in addition to the letters of credit outstanding under our revolving credit facility.
Substantially all of the letters of credit issued under the $150.0 million syndicated revolving credit facility and the $25.0
million credit line were provided to suppliers in the normal course of business, and expire within one year from their issuance. Expired letters of credit are renewed as needed.
Our debt consisted of the following (in thousands):
As of December 31,2004 2003
Borrowings under syndicated revolving credit facility 50,000$ -$ Promissory notes issued in connection with acquired business:
Non-interest bearing promissory note of $2.5 million, payable annually through January 2006, net of unamortized imputed discount (at 9%) of $33 and $112 at December 31, 2004 and 2003, respectively 467 1,388 Non-interest bearing promissory note of $3.3 million, payable
annually through January 2005, net of unamortized imputed discount (at 5%) of $152 at December 31, 2003 1,100 2,148 Total debt 51,567$ 3,536$ Short-term debt 1,100$ 1,600$ Long-term debt 50,467$ 1,936$
As of December 31, 2004, the aggregate annual maturities of debt, net of unamortized imputed discount, are as follows (in thousands):
For the Year ending December 31,2005 $ 1,100 2006 50,467
$ 51,567
Page 56 of 72

4. Income Taxes
U.S. and foreign income (loss) from continuing operations before income taxes consist of the following (in thousands):
For theNine Months
endedFor the Year ended December 31, December 31,
2004 2003 2002 2002Restated Restated Restated
(Unaudited)
United States (1,635)$ (6,487)$ (5,400)$ (5,752)$ Foreign 37,163 34,457 23,501 17,733
35,528$ 27,970$ 18,101$ 11,981$ The income tax provision (benefit) related to continuing operations consist of the following components (in thousands):
For theNine Months
endedFor the Year ended December 31, December 31,2004 2003 2002 2002
Restated Restated Restated(Unaudited)
Current:U.S. federal 465$ (1,752)$ 340$ (805)$ State 668 356 552 140 Foreign 5,175 3,965 5,180 3,167
6,308 2,569 6,072 2,502
Deferred:U.S. federal 83 1,916 (501) (237) State (388) (365) (878) (288) Foreign 966 1,689 (745) (43)
661 3,240 (2,124) (568)
Total 6,969$ 5,809$ 3,948$ 1,934$
As of December 31, 2004, the Company had approximately $116.9 million of earnings attributable to foreign subsidiaries for which no provisions have been recorded for income tax that could occur upon repatriation. Except to the extent such earnings can be repatriated tax efficiently, they are permanently invested abroad. It is not practicable to determine the amount of income taxes payable in the event all such foreign earnings are repatriated.
In December 2004, the FASB issued Staff Position (“FSP”) No. 109-2, “Accounting and Disclosure Guidance for the
Foreign Earnings Repatriation Provision within the American Jobs Creation Act of 2004.” The American Jobs Creation Act of 2004 (the “Act”), signed into law on October 22, 2004, provides for a special one-time tax deduction, or dividend received deduction (“DRD”), of 85% of qualifying foreign earnings that are repatriated in either a company’s last tax year that began before the enactment date or the first tax year that begins during the one-year period beginning on the enactment date. FSP No. 109-2 provides entities additional time to assess the effect of repatriating foreign earnings under the Act for purposes of applying SFAS No. 109, “Accounting for Income Taxes,” which typically requires the effect of a new tax law to be recorded in the period of enactment. The Company will elect, if applicable, to apply the DRD to qualifying dividends of foreign earnings in its fiscal year ending December 31, 2005.
Page 57 of 72

The Company is awaiting further clarifying guidance from the U.S. Treasury Department on certain provisions of the Act. Once this guidance is received, the Company expects to complete its evaluation of the effects of the Act during 2005. Under the limitations on the amount of dividends qualifying for the DRD of the Act, the maximum repatriation of the Company’s foreign earnings that may qualify for the special one-time DRD is approximately $111.1 million. Therefore, the range of possible amounts of qualifying dividends of foreign earnings is between zero and approximately $111.1 million. Because the evaluation is ongoing, it is not yet practical to estimate a range of possible income tax effects of potential repatriations.
A reconciliation of the Federal statutory tax rate with the effective tax rate is as follows (in thousands):
For theNine Months
endedFor the Year ended December 31, December 31,
2004 2003 2002 2002Restated Restated Restated
U.S. federal statutory rate 34.0 % 34.0 % 34.0 % 34.0 %Foreign earnings, net of foreign taxes (14.8) (12.8) (15.7) (21.6) State income taxes, net of U.S. federal
income tax benefit 0.2 0.6 0.5 1.1 Net operating loss - (0.4) 1.8 - Income tax credits - (0.9) 0.8 - Non-deductible goodwill amortization - - - - Other permanent differences 0.2 0.3 0.4 2.6
Effective income tax rate 19.6 % 20.8 % 21.8 % 16.1 %
(Unaudited)
The temporary differences which comprise our net deferred income tax assets are as follows (in thousands):
As of December 31,2004 2003
RestatedExcess of provision for bad debts over charge-offs 3,040$ 2,974$ Net operating loss 5,036 1,730 Income tax credits 1,346 248 Excess of tax over financial reporting for depreciation of fixed assets 95 (150) Excess of tax over financial reporting amortization of identifiable
intangibles and goodwill (2,799) (2,414) Accrued compensation expenses recognized for financial reporting
purposes, not currently deductible for tax purposes 2,711 2,453 Accrued expenses recognized for financial reporting purposes, not
currently deductible for tax purposes 2,784 3,250 Accrued revenue (644) (481)
Total deferred income tax assets, net 11,569$ 7,610$ Deferred income tax assets, current 4,740$ 6,684$ Deferred income tax assets, non-current 6,829$ 926$
In the accompanying balance sheets, the current deferred income tax assets are included in prepaid expenses and other current assets, and the non-current income tax assets are included in other assets. The income tax credits of $1.3 million and $248 thousand at December 31, 2004 and 2003, respectively, are comprised of the following: foreign tax credit (“FTC”) carryforward of $978 thousand at December 31, 2004 and an alternative minimum tax (“AMT”) credit carryforward of $368 thousand and $248 at December 31, 2004 and 2003, respectively. The FTC carryforward will expire in 2014, if unused, and the AMT credit carries forward indefinitely.
Page 58 of 72

As of December 31, 2004, we have U.S. federal and state net operating losses of approximately $11.6 million and $8.6 million, respectively. These losses, if unused, will start to expire, in varying amounts, after 2024 and 2015. As of December 31, 2003, we have foreign and state net operating losses of approximately $4.4 million and $3.0 million, respectively. The Company recorded income tax benefits of $4.5 million, $196 thousand, and $475 thousand related to employee stock compensation transactions during the years ended December 31, 2004 and 2003, and the nine months ended December 31, 2002, respectively. Such benefits were credited to Capital in excess of par value. 5. Stockholders’ Equity Dividends We declared cash dividends of $0.15 per share for the years ended December 31, 2004, 2003 and 2002, and $0.1125 per share for the nine months ended December 31, 2002. Common Stock Grants
Pursuant to a stock grant program for our non-employee directors, each non-employee director receives an annual stock grant of two thousand shares of our common stock. Prior to 2003, each non-employee director was granted one thousand shares of our common stock per year. In 2003, we adopted a Stock Deferral Plan for non-employee directors to provide for the deferral of the stock grants. Each non-employee director may elect to have his or her annual stock grants paid in stock units, in lieu of stock, with each stock unit being equivalent to one share of our common stock and deferred as provided in the Stock Deferral Plan. As of each cash dividend payment date with respect to common stock, each participant in the Stock Deferral Plan has credited to his or her account, as maintained by the company, a number of stock units equal to the quotient obtained by dividing: (a) the product of (i) the cash dividend payable with respect to each share of common stock on such date; and (ii) the total number of stock units credited to his or her account as of the close of business on the record date applicable to such dividend payment date, by (b) the fair market value of one share of common stock on such dividend payment date. Upon the participant’s termination of service as a director of the company for any reason, or upon a change of control of the company, the participant receives a number of shares of common stock equal to the number of stock units credited to his account.
Stock units issued to non-employee directors are recorded as stockholders’ equity with a related non-employee director
compensation expense based on the equivalent common stock fair market value at the date of issuance. Stock issued to non-employee directors are reissued from our treasury stock and the related non-employee director compensation costs are recorded based on the market value of our common stock on the date of grant.
During 2004 and 2003, an aggregate of eight thousand shares of our common stock and six thousand stock units were
granted to our non-employee directors. For the nine months ended December 31, 2002, we issued seven thousand shares of our common stock to our non-employee directors. In addition, two non-employee directors each received an additional six hundred shares of our common stock in September 2002, and one non-employee director received an additional two thousand shares of our common stock, for additional services performed by such individuals for their respective Board of Directors committees.
As of December 31, 2004 and 2003, we had issued approximately twelve thousand and six thousand stock units, respectively, with an aggregate value of approximately $203 thousand and $69 thousand, respectively, which is included in Capital in excess of par value in the accompanying consolidated balance sheets. We recorded non-employee director compensation cost relating to grants of common stock grants or stock units totaling $309 thousand, $159 thousand, and $81 thousand for the years ended December 31, 2004, 2003 and 2002, respectively, and $35 thousand for the nine months ended December 31, 2002.
Page 59 of 72

Treasury Stock Our Board of Directors, from time to time, has authorized stock repurchase programs under the terms of which we may repurchase our common stock, subject to certain restrictions contained in our credit agreement. The following summarizes the status of our treasury stock repurchase programs at December 31, 2004 (in thousands, except average price per share data):
RemainingAuthorized Authorized
Stock Aggregate Average StockRepurchase Programs Repurchases Shares Cost Price RepurchasesAugust 1998 6,000$ 1,232 6,000$ 4.87$ -$ January 2000 10,000 2,782 10,000 3.59 - September 2000 10,000 736 3,987 5.42 6,013
4,750 19,987$
Repurchases
Prior to August 1998, with the approval from our Board of Directors, we acquired approximately 44 thousand shares of our common stock with an aggregate cost of $194 thousand. Since March 14, 2002, we have not repurchased any shares of our common stock. Our Board of Directors also resolved that the repurchased shares may be reissued for any proper corporate purpose, including without limitation, future acquisitions. In March 2002, we began reissuing our repurchased shares in connection with restricted stock grants to employees, non-restricted stock grants to non-employee directors, and exercises of stock options by employee and non-employee directors. The difference between the aggregate cost of the repurchased shares and the fair value of our common stock at the date of grant of restricted and non-restricted stock or the proceeds from the employee and non-employee stock option exercises is recorded in Capital in excess of par value in the accompanying consolidated balance sheets. As of December 31, 2004, we have reissued 2.1 million shares of treasury stock with an aggregate cost of $8.9 million.
Stock-Based Compensation Plans
In 1986, our shareholders approved the 1986 Employee Stock Option Plan (the “1986 Plan”), as amended. The 1986 Plan expired in 1996. Options granted under the 1986 Plan, but not yet exercised, survive the 1986 Plan until the options expire. Outstanding options at December 31, 2004 under the 1986 Plan expire in March 2005. In 1997, our shareholders approved the 1996 Employee Stock Option Plan (the “1996 Plan”), as amended. The 1996 Plan was replaced by the 2001 Omnibus Plan (the “2001 Plan”). Options granted under the 1996 Plan, but not yet exercised, survive the 1996 Plan until the options expire. Outstanding options at December 31, 2004 under the 1996 Plan expire between August 2006 and October 2011. The 2001 Plan was approved by our shareholders in August 2001. The 2001 Plan is administered by the Compensation Committee of the Board of Directors (the “Compensation Committee”) and its purpose is to recruit, reward, and motivate all executives and key employees of the Company to work as a team to achieve our corporate goal of maximizing shareholder return, and to permit the Compensation Committee to use a broader range of stock incentives, such as stock appreciation rights, performance share awards and restricted stock, as well as non-stock performance awards, to motivate executives and key employees of the Company. A total of one million shares of Common Stock were originally reserved for issuance under the 2001 Plan. Additional shares of Common Stock that may be granted under the 2001 Plan include any shares that are available for future grant under any of our prior stock option plans, and any stock or options granted under the 2001 Plan or any prior plans that are forfeited, expired or canceled. Furthermore, pursuant to the 2001 Plan and upon our Board of Directors’ authorization in January 2002, any shares of Common Stock that are reacquired by the Company in the open market or in private transactions after the effective date of the 2001 Plan, were added to the limitation on the total shares which may be issued under the 2001 Plan. Subsequently, in April 2004, our Board of Directors amended the Plan to provide that shares repurchased by the Company would not be added to the maximum amount of shares that may be issued under the plan. The total number of shares of Common Stock that was reacquired by the Company and added to the limitation on the shares which may be issued under the 2001 Plan was approximately 518 thousand shares. Also, in April 2004, our Board of Directors adopted amendments to reserve an additional 1.2 million shares of Common Stock for issuance under the plan and to extend the expiration date of the 2001 Plan for five years, or until May 2009. These amendments were approved by the shareholders in May 2004. As of
Page 60 of 72
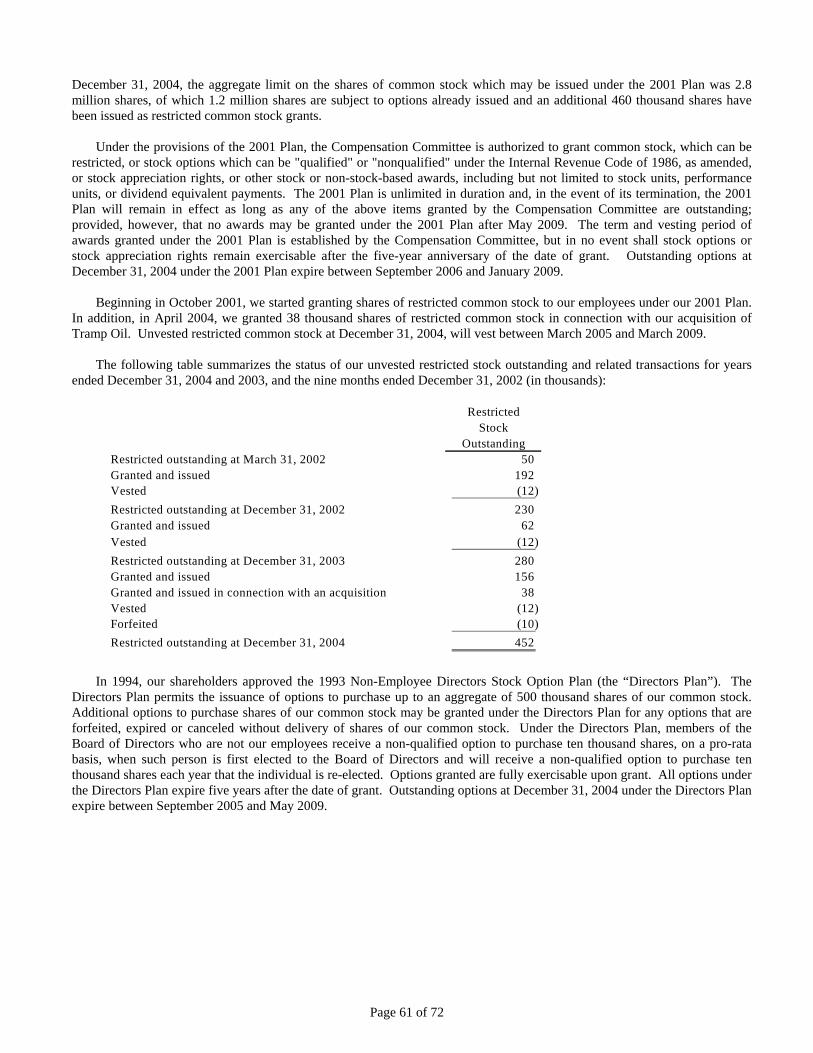
December 31, 2004, the aggregate limit on the shares of common stock which may be issued under the 2001 Plan was 2.8 million shares, of which 1.2 million shares are subject to options already issued and an additional 460 thousand shares have been issued as restricted common stock grants. Under the provisions of the 2001 Plan, the Compensation Committee is authorized to grant common stock, which can be restricted, or stock options which can be "qualified" or "nonqualified" under the Internal Revenue Code of 1986, as amended, or stock appreciation rights, or other stock or non-stock-based awards, including but not limited to stock units, performance units, or dividend equivalent payments. The 2001 Plan is unlimited in duration and, in the event of its termination, the 2001 Plan will remain in effect as long as any of the above items granted by the Compensation Committee are outstanding; provided, however, that no awards may be granted under the 2001 Plan after May 2009. The term and vesting period of awards granted under the 2001 Plan is established by the Compensation Committee, but in no event shall stock options or stock appreciation rights remain exercisable after the five-year anniversary of the date of grant. Outstanding options at December 31, 2004 under the 2001 Plan expire between September 2006 and January 2009. Beginning in October 2001, we started granting shares of restricted common stock to our employees under our 2001 Plan. In addition, in April 2004, we granted 38 thousand shares of restricted common stock in connection with our acquisition of Tramp Oil. Unvested restricted common stock at December 31, 2004, will vest between March 2005 and March 2009.
The following table summarizes the status of our unvested restricted stock outstanding and related transactions for years ended December 31, 2004 and 2003, and the nine months ended December 31, 2002 (in thousands):
RestrictedStock
OutstandingRestricted outstanding at March 31, 2002 50 Granted and issued 192 Vested (12) Restricted outstanding at December 31, 2002 230 Granted and issued 62 Vested (12) Restricted outstanding at December 31, 2003 280 Granted and issued 156 Granted and issued in connection with an acquisition 38 Vested (12) Forfeited (10) Restricted outstanding at December 31, 2004 452
In 1994, our shareholders approved the 1993 Non-Employee Directors Stock Option Plan (the “Directors Plan”). The Directors Plan permits the issuance of options to purchase up to an aggregate of 500 thousand shares of our common stock. Additional options to purchase shares of our common stock may be granted under the Directors Plan for any options that are forfeited, expired or canceled without delivery of shares of our common stock. Under the Directors Plan, members of the Board of Directors who are not our employees receive a non-qualified option to purchase ten thousand shares, on a pro-rata basis, when such person is first elected to the Board of Directors and will receive a non-qualified option to purchase ten thousand shares each year that the individual is re-elected. Options granted are fully exercisable upon grant. All options under the Directors Plan expire five years after the date of grant. Outstanding options at December 31, 2004 under the Directors Plan expire between September 2005 and May 2009.
Page 61 of 72

As of December 31, 2004, the following table summarizes the outstanding stock options issued pursuant to the plans described above (in thousands, except weighted-average exercise price):
(c)(a) (b) Number of securities remaining
Number of securities Weighted-average available for future issuance underto be issued upon exercise exercise price of equity compensation plans (excluding
Plan name or description of outstanding options outstanding options securities reflected in column (a))2001 Plan 1,184 12.34$ 1,134 1996 Plan 868 6.82$ - 1986 Plan 11 3.45$ - Directors Plan 236 13.25$ 96
2,299 10.31$ 1,230
The following table summarizes the status of our stock options outstanding and exercisable, and related transactions for
years ended December 31, 2004 and 2003, and the nine months ended December 31, 2002 (in thousands, except weighted-average exercise price):
Weighted-Average Weighted-AverageOptions Exercise Price Options Exercise Price
Options outstanding at March 31, 2002 2,742 6.45$ 2,260 6.57$ Granted 162 9.26$ Exercised (442) 6.73$ Forfeited/expired (56) 8.70$ Options outstanding at December 31, 2002 2,406 6.57$ 1,898 6.45$ Granted 1,046 12.97$ Exercised (144) 6.41$ Options outstanding at December 31, 2003 3,308 8.60$ 2,130 6.49$ Granted 103 20.48$ Exercised (1,080) 6.02$ Forfeited/expired (32) 11.50$ Options outstanding at December 31, 2004 2,299 10.31$ 1,540 8.44$
Options Outstanding Options Exercisable
The following table summarizes the exercise prices of our stock options outstanding and exercisable at December 31,
2004 (in thousands, except exercise price data and contractual life):
Weighted-Average Weighted- Weighted-
Remaining Average AverageContractual Exercise Exercise
Range of Exercise Price Options Life (in Years) Price Options Price
$3.44 to $4.63 322 5.6 3.99$ 321 3.99$ $5.38 to $6.64 365 3.9 5.82$ 365 5.82$ $8.37 to $10.35 420 3.0 9.79$ 287 9.60$ $10.50 to $12.50 520 3.2 11.35$ 376 10.91$ $13.62 to $16.97 602 3.6 14.48$ 190 14.34$ $22.13 70 4.4 22.13$ - -$
Total 2,299 10.31$ 1,539 8.44$
Options Outstanding Options Exercisable
Page 62 of 72

6. Commitments and Contingencies Surety Bonds In the normal course of business, we are required to post bid, performance and garnishment bonds. The majority of the surety bonds posted relate to our aviation fuel services business. As of December 31, 2004, we had $19.3 million in outstanding bonds. Lease Commitments As of December 31, 2004, our future minimum lease payments under non-cancelable operating leases for rental properties were as follows (in thousands):
For the Year ending December 31,2005 $ 2,210 2006 2,181 2007 1,596 2008 1,366 2009 591 Thereafter 3,024
$ 10,968
We incurred rental expense for all properties of $2.6 million, $2.3 million and $1.9 million for the years ended December 31, 2004, 2003 and 2002, respectively, and $1.5 million for the nine months ended December 31, 2002. In the normal course of business, we may enter into non-cancelable operating leases for office and computer equipment, and service contracts with minimum service fee commitments for telecommunication, and computer data and document storage. As of December 31, 2004, we had no material non-cancelable operating leases for office and computer equipment or service contracts with minimum service fee commitments. Concentration of Credit Risk
Our marine and aviation businesses extend unsecured credit to most of their customers. Part of our success in attracting business has been due, in part, to our willingness to extend credit on an unsecured basis to customers which exhibit a high credit risk profile and would otherwise be required to prepay or post letters of credit with their suppliers of fuel and related services. We recognize that extending credit and setting the appropriate reserves for receivables is largely a subjective decision based on knowledge of the customer and the industry. Active management of our credit risk is essential to our success. We do not insure our receivables. Diversification of credit risk is difficult since we sell primarily within the marine and aviation industries. Our sales executives and their respective staff meet regularly to evaluate credit exposure, in the aggregate and by individual credit. Credit exposure also includes the amount of estimated unbilled sales. We also have a credit committee for each of our segments. The credit committees are responsible for approving credit limits above certain amounts, setting and maintaining credit standards, and managing the overall quality of the credit portfolio. The level of credit granted to a customer is influenced by a customer’s credit history with us, including claims experience and payment patterns. In our marine fuel services segment, we have extended lines of credit of at least $6.0 million to 20 non-governmental customers, and seven of these customers have lines of credit ranging from $15.0 to $28.0 million (currently, our largest credit lines). In our aviation fuel services segment, we have extended lines of credit of at least $4.0 million to five non-governmental customers, and one of these customers has a credit line of $14.0 million. World oil prices have been very volatile over the last several years, and since fuel costs represent a significant part of a vessel’s and airline's operating expenses, the volatility in fuel prices can adversely affect our customers’ business, and consequently our credit losses. Although most of our transactions are denominated in U.S. dollars, many of our customers are foreign customers and may be required to purchase U.S. dollars to pay for our products and services. A rapid devaluation in currency affecting our customers could have an adverse effect on our customers’ operations and their ability to convert local currency to U.S. dollars to make the required payments to us. This would in turn result in higher credit losses for us.
Page 63 of 72

We may also incur credit losses due to other causes, including deteriorating conditions in the world economy, or in the shipping or aviation industries, and continued conflicts and instability in the Middle East, Asia and Latin America, as well as potential future terrorist activities and possible military retaliation. Any credit losses, if significant, will have a material adverse effect on our financial position and results of operations. Environmental and Other Liabilities; Uninsured Risks In the marine and aviation fuel services business, we utilize subcontractors to provide various services to customers, including into-plane fueling at airports, fueling of vessels in-port and at-sea, and transportation and storage of fuel and fuel products. We are subject to possible claims by customers, regulators and others who may be injured by a fuel spill or other accident. In addition, we may be held liable for damages to the environment arising out of such events. Although we generally require our subcontractors to carry liability insurance, not all subcontractors carry adequate insurance. Our marine business does not have liability insurance to cover the acts or omissions of our subcontractors. None of our liability insurance covers acts of war and terrorism. If we are held responsible for any acts of war or terrorism, accident or other event, and the liability is not adequately covered by insurance and is of sufficient magnitude, our financial position and results of operations will be adversely affected. We have exited several businesses which handled hazardous and non-hazardous waste. We treated and/or transported this waste to various disposal facilities. We may be held liable as a potentially responsible party for the clean-up of such disposal facilities, or required to clean up facilities previously operated by us, pursuant to current U.S. federal and state laws and regulations. We continuously review the adequacy of our insurance coverage. However, we lack coverage for various risks, including environmental claims. An uninsured claim arising out of our activities, if successful and of sufficient magnitude, will have a material adverse effect on our financial position and results of operations. Legal Matters In April 2001, Miami-Dade County, Florida (the “County”) filed suit (the “County Suit”) against 17 defendants to seek reimbursement for the cost of remediating environmental contamination at Miami International Airport (the “Airport”). Page Avjet Fuel Corporation, now known as PAFCO LLC (“PAFCO”), is a defendant. We acquired a 50% interest in PAFCO from Signature Flight Support Corporation (“Signature”) in December 2000. Pursuant to the PAFCO acquisition agreement, Signature agreed to indemnify us for all PAFCO liabilities arising prior to the closing date (“Closing”). Because the Airport contamination occurred prior to Closing, we believe that the County Suit is covered by Signature’s indemnification obligation. We have notified Signature of the County Suit, as stipulated in the acquisition agreement. We expect Signature to defend this claim on behalf of PAFCO and at Signature’s expense. Also in April 2001, the County sent a letter to approximately 250 potentially responsible parties (“PRP’s”), including World Fuel Services Corporation and one of our subsidiaries, advising them of their potential liability for the clean-up costs of the contamination that is the subject of the County Suit. The County has threatened to add the PRP’s as defendants in the County Suit, unless they agree to share in the cost of the environmental clean-up at the Airport. In May 2001, we advised the County that: (1) neither we nor any of our subsidiaries were responsible for any environmental contamination at the Airport, and (2) to the extent that we or any of our subsidiaries were so responsible, our liability was subject to indemnification by the County pursuant to the indemnity provisions contained in our lease agreement with the County. The claims asserted by the County relating to environmental contamination at the Airport remain pending; however, no significant developments occurred during the year ended December 31, 2004. We intend to vigorously defend these claims, and we believe our liability in these matters (if any) should be adequately covered by the indemnification obligations of Signature as to PAFCO, and the County as to World Fuel Services Corporation and our other subsidiaries. In November 2004, World Fuel was served with process in a lawsuit titled Action Manufacturing Co., Inc. et al. v. Simon Wrecking Company, et al. This action, pending in U.S. Federal District Court for the Eastern District of Pennsylvania, relates to the environmental clean up of the Malvern TCE Superfund site in Chester County, Pennsylvania. The plaintiffs are a group of private corporations that entered into a consent decree with the Environmental Protection Agency in 1999, under the terms of which the plaintiffs agreed to pay for remediation of the site. In the action, the Plaintiffs are seeking contribution from the various Defendants toward the costs of remediating the site. Plaintiffs have alleged that World Fuel is a “successor” to Resource Technology Services, Inc., a Pennsylvania corporation that arranged for disposal of wastes at the site. In 1988, Resource Recovery Atlantic, Inc., a Delaware corporation that was then an indirect subsidiary of World Fuel, purchased selected assets from Resource Technology Services, Inc. The plaintiffs claim that this transaction gives rise to our successor
Page 64 of 72

liability pursuant to the Pennsylvania Hazardous Sites Cleanup Act. The plaintiffs have alleged that Resource Technology Services Inc.’s share of the clean-up costs is $1.0 million. World Fuel’s subsidiary, Resource Recovery Atlantic, Inc., acquired only selected assets of Resource Technology Services, Inc., and did not assume any of its liabilities, except for four vehicle leases. We believe that neither World Fuel, nor any of our subsidiaries, is a “successor” to Resource Technology Services, Inc. and that we are not responsible for any liabilities of that company. We intend to vigorously defend all claims asserted against us arising from liabilities of Resource Technology Services, Inc. We may not prevail in the legal proceedings described above and we cannot estimate our ultimate exposure if we do not prevail. A ruling against us in certain of the proceedings described above could have a material adverse effect on our financial condition and results of operations. In addition to the matters described above, we are also involved in litigation and administrative proceedings primarily arising in the normal course of our business. In the opinion of management, except as set forth above, our liability, if any, under any other pending litigation or administrative proceedings, even if determined adversely, would not materially affect our financial condition or results of operations. Sales and Purchase Commitments We offer to our marine and aviation customers fixed fuel prices on future sales. As of December 31, 2004, sales and purchase commitments amounted to approximately $31.4 million and $30.5 million, respectively. Employment Agreements In July 2002, our Board of Directors elected a new Chairman and Chief Executive Officer (“CEO”), and agreed to employ our former Chairman and CEO as an advisor to the new Chairman for a term of two years. During this two-year period, the advisor will receive a salary of $100 thousand per year, and he will not be an officer or director of the company. Pursuant to the terms of our former Chairman and CEO’s employment contract, the changes in his compensation and responsibilities entitles him to receive a severance equal to three times his average salary and bonus during the five-year period preceding termination, plus all deferred compensation, including accrued interest. In addition, from July to September 2002, we terminated the employment of our former Chief Financial Officer, Chief Information Officer, and two other executives. Accordingly, we recorded severance expense totaling $4.5 million, of which $3.7 million related to our former Chairman and CEO during the nine months and year ended December 31, 2002. In August 2002, we paid our former Chairman and CEO his executive severance plus deferred compensation, including accrued interest. The other executive severance amounts are paid on a monthly basis over a period of six months to twenty-one months from the date of termination. In connection with the promotion of our new Chairman and CEO and new President and Chief Operating Officer (“COO”) to their respective positions, in July 2002, they received new employment agreements, which among provisions, provide for an individual base salary of $525 thousand, an employment period that expires in July 2007, and termination severance benefits. Pursuant to these employment agreements, our CEO and COO are eligible to receive an annual bonus upon achievement of performance targets, which targets are based on diluted earnings per share growth. The bonus payout may range from 15% of base salary if at least 5% diluted earnings per share growth is achieved, to 200% of base salary if diluted earnings per share growth equals or exceeds 15%. For the years ended December 31, 2004 and 2003, our CEO and COO each earned an annual bonus equal to 200% of base salary. For the nine months ended December 31, 2002, our CEO and COO each earned and received a prorated annual bonus equal to 100% of base salary. As of December 31, 2004 and 2003, $2.1 million was included in Accrued salaries and wages in the accompanying consolidated balance sheets.
In addition, prior to May 2004, the payment of any portion of the bonus causing the compensation of any of the above two executives to exceed $1.0 million during any fiscal year was deferred and accrues interest at the U.S. Prime rate, until a fiscal year during the employment term in which the executive earns less than $1.0 million; provided, however, that in the event of the executive’s death, the termination of the executive for any reason, or the expiration of the employment agreement, the deferred portion of any bonus, including any interest earned thereon, shall be paid to the executive within ten days of such death, termination or expiration. As of December 31, 2004 and 2003, $121 thousand was deferred under the employment agreements of our Chairman and President. Such deferred compensation was included in Deferred compensation and other long-term liabilities in the accompanying consolidated balance sheets. Following shareholder approval of our 2003 Executive Incentive Plan in May 2004, the deferral of compensation as described above is no longer required. Pursuant to their employment agreements, our CEO and COO each is entitled to receive a cash severance payment if: (a) we terminate the executive for any reason other than death, disability or cause; (b) the executive resigns for good reason
Page 65 of 72

(generally a reduction in his responsibilities or compensation, or a breach by us), or resigns for any reason following a change of control; or (c) we elect not to renew the executive's employment agreement upon expiration, for any reason other than cause. The severance payment is equal to two times the executive's average salary and bonus during the three-year period preceding termination; provided, if (i) the termination occurs within three years after a change of control the multiple set forth above will be three instead of two, and (ii) in the case of a non-renewal, as described in item (c) above, the multiple will be one and the severance will be paid in 26 equal installments over a one year period. Upon any such termination, we will continue to provide coverage to the executive under our group insurance plans for up to three years, and all of the executive's stock options and stock grants will immediately vest.
We have also entered into employment agreements with certain of our other executive officers and key employees. These agreements provide for minimum salary levels, and, in most cases, bonuses which are payable if specified performance goals are attained. Some executive officers and key employees are also entitled to severance benefits upon termination or non-renewal of their contracts under certain circumstances.
As of December 31, 2004, the approximate future minimum commitments under employment agreements, excluding
discretionary and performance bonuses, are as follows (in thousands):
For the Year ending December 31,2005 11,113$ 2006 9,541 2007 3,993 2008 474 2009 306
$ 25,427
We recorded expenses under the terms of the above described agreements, including discretionary and performance bonuses, and executive severance charges of approximately $17.9 million, $13.0 million and $11.4 million for the years ended December 31, 2004, 2003 and 2002, respectively, and approximately $14.9 million for the nine months ended December 31, 2002. Deferred Compensation Plans In September 2003, the Compensation Committee amended our Executive Incentive Plan to provide for long-term incentive awards (“LTIP awards”) in addition to the annual bonuses already provided in the plan. Under the terms of the plan, as amended, our five senior executives are eligible to receive long term incentive awards ("LTIP awards") upon achievement of long-term performance goals. The performance goals are based on achieving certain Compound Average Annual Growth Rates ("CAGR") in net income over a three-year performance period. In September 2004, the Compensation Committee of the Board of Directors elected to reconsider the use of net income as the performance measure for LTIP awards due to an increase in the disparity between the growth rates of net income and diluted earnings per share. In connection with this decision, the Compensation Committee agreed to suspend future LTIP awards until a more appropriate performance measure could be established and to cancel the LTIP award for the three-year performance period commencing January 2004. The LTIP award for the three-year performance period commencing January 2003 was left in effect. Target awards for the three-year performance period commencing January 2003 are $750 thousand for each of our Chief Executive Officer and Chief Operating Officer, and $200 thousand for each of the other three senior executives. The executives would earn 50% of the target award if we achieve a 15% CAGR in net income over the three-year performance period, and 100% of the target award if an 18% CAGR in net income is achieved over the three-year performance period. The maximum award is 200% of the target award, and would be earned if at least a 21% CAGR in net income is achieved over the three-year performance period. If and when an award is earned, such award may be deferred at the executive's option, on such terms and conditions as may be approved by the Compensation Committee. The deferred amounts will earn interest at the U.S. Prime Rate, with a maximum rate of 10% per year.
Page 66 of 72

The accrual for LTIP awards is made equally over each award's three-year performance period based on management's estimate of the ultimate award to be earned by the senior executives at the end of each three-year performance period. As of December 31, 2004 and 2003, we had accrued $2.8 million and $700 thousand, respectively, for the LTIP award for the three-year performance period commencing January 2003. The accrual for the LTIP award for the three-year performance period commencing January 2003 is included in Deferred compensation and other long-term liabilities in the accompanying consolidated balance sheets. In addition to LTIP awards, senior executives, including our CEO and COO, are eligible to receive annual bonuses under the Executive Incentive Plan upon achievement of annual performance targets, which targets are based on diluted earnings per share growth and other yearly objectives determined by the Compensation Committee. The bonus payout may range from 15% of base salary if at least 5% diluted earnings per share growth is achieved, to 200% of base salary if diluted earnings per share growth equals or exceeds 15%. As previously stated above in “Employment Agreements,” our CEO and COO earned an aggregate annual bonus of $2.1 million, or 200% of base salary, for the years ended December 31, 2004 and 2003, and $788 thousand, or prorated 100% of base salary, for the nine-months ended December 31, 2002. Under the Executive Incentive Plan, our other senior executives earned an aggregate annual bonus of $1.2 million and $1.1 million, respectively, for the years ended December 31, 2004 and 2003, and $365 thousand for the nine months ended December 31, 2002. As of December 31, 2004 and 2003, annual bonuses for senior executives amounted to $3.3 million and $3.2 million, respectively, and was included in Accrued salaries and wages in the accompanying consolidated balance sheets. We maintain long-term service award programs under which certain key employees receive cash awards for long-term service with the company and our subsidiaries. Our liabilities under these programs were $2.1 million and $563 thousand at December 31, 2004 and 2003, respectively. We maintain a 401(k) defined contribution plan which covers all U.S. employees who meet minimum requirements and elect to participate. Participants may contribute up to 15% of their compensation, subject to certain limitations. During each of the periods presented on the consolidated statements of income, we made matching contributions of 25% of each 1% of the participants’ contributions up to the first 4% contributed. Annual contributions by us are made at our sole discretion, as approved by the Compensation Committee. We recorded expenses for our contribution of approximately $130 thousand, $100 thousand and $97 thousand for the years ended December 31, 2004, 2003 and 2002, respectively, and $71 thousand for the nine months ended December 31, 2002. Certain of our foreign subsidiaries have defined contribution benefit plans, which allow for voluntary contributions by the employees. The foreign subsidiaries paid all general and administrative expenses of the plans and in some cases made employer contributions on behalf of the employees. We recorded expenses for our contribution of approximately $290 thousand, $193 thousand and $134 thousand for the years ended December 31, 2004, 2003 and 2002, respectively, and $104 thousand for the nine months ended December 31, 2002. Severance Benefits Payable In accordance with local laws which apply to certain foreign subsidiaries, we have accrued employee severance benefits payable of approximately $211 thousand and $123 thousand at December 31, 2004 and 2003, respectively. 7. Aviation Joint Venture In December 2000, we entered into a joint venture with Signature Flight Support Corporation through the acquisition of a 50% equity interest in PAFCO LLC (“PAFCO”) from Signature. We paid Signature $1.0 million in cash and $2.5 million in the form of a non-interest bearing note, payable over five years through January 2006. PAFCO markets aviation fuel and related services. The non-interest bearing promissory note was discounted at 9% and the discount of $558 thousand is being amortized as interest expense over a five-year term using the interest method. We recorded interest expense of $79 thousand, $114 thousand and $146 thousand for the years ended December 31, 2004, 2003 and 2002, respectively, and $110 thousand for the nine months ended December 31, 2002.
Page 67 of 72

In accordance with PAFCO’s operating agreement, we are entitled to 80% of the income from PAFCO’s operations. The higher allocation percentage versus the ownership percentage is in consideration of the risks assumed by us with respect to credit losses on PAFCO’s accounts receivable. PAFCO distributes its income to its partners on a quarterly basis. We are required to purchase, without recourse, PAFCO’s accounts receivable that are 120 days past due, subject to certain requirements. Net losses (including infrequent or unusual losses), interest expense incurred by PAFCO, and any gain resulting from the liquidation of the joint venture will be shared equally between Signature and us. We purchased PAFCO accounts receivable totaling $38 thousand for the nine months and year ended December 31, 2002. Subsequent to these purchases, we wrote off these accounts receivable. For the year ended December 31, 2003, we did not purchase any of PAFCO’s accounts receivable. We recorded earnings from the PAFCO aviation joint venture of $607 thousand and $559 thousand for the years ended December 31, 2003 and 2002, respectively, and $420 thousand for the nine months ended December 31, 2002. These net earnings from aviation joint venture were included in Other (expense) income, net in the accompanying consolidated statements of income. As of December 31, 2003, amounts due from PAFCO of $280 thousand was included in prepaid expenses and other current assets in the accompanying consolidated balance sheets. Prior to January 1, 2004, we used the equity method of accounting to record our share of the earnings and losses of our aviation joint venture. In addition, the amortized interest expense on the non-interest bearing promissory note was also included in net earnings from aviation joint venture. Effective January 1, 2004, with the implementation of the FIN No. 46, we consolidated PAFCO’s financial position and results of operations, after elimination of all significant intercompany accounts, transactions and profits. As a result of the consolidation of PAFCO, we recorded minority interest of $306 thousand, which was included in Other (expense) income, net, in the accompanying consolidated statements of income. The following table summarizes the effect of PAFCO on our consolidated results of operations, after elimination of all significant intercompany transactions and profits (in thousands):
For theNine Months
endedFor the Year ended December 31, December 31,
2004 2003 2002 2002Restated Restated Restated
Revenue 194,173$ -$ -$ -$
Gross profit 2,742$ -$ -$ -$
Income from operations 1,499$ -$ -$ -$
Other (expense) income, net (354)$ 493$ 413$ 310$
Provision for income taxes (441)$ (190)$ (159)$ (119)$
Net income 704$ 303$ 254$ 191$
The following table summarizes the effect of PAFCO on our consolidated financial position, after elimination of all significant intercompany accounts (in thousands):
2004 2003Restated
Cash and cash equivalents 3,039$ -$
Accounts and notes receivable 4,311$ -$
Inventory 2,740$ -$
Total assets 10,782$ -$
Total liabilities 10,782$ -$
As of December 31,
Page 68 of 72
Included in Accounts and notes receivable, as of December 31, 2004, were net receivables due from Signature, a related party, of $768 thousand, net of certain accounts payable and minority interest payable. For the year ended December 31, 2004, sales to Signature from PAFCO amounted to $131.1 million for the year ended December 31, 2004. In addition to PAFCO’s sales to Signature, in the normal course of business, we utilize Signature and Aircraft Service International Group (“ASIG”), a sister company of Signature, as subcontractors to provide various services to customers, including into-plane fueling at airports, and transportation and storage of fuel and fuel products. These activities with Signature and ASIG were not considered to be significant. 8. Settlement Charge Related to the Sale of Business In February 2000, we sold the stock of our oil-recycling subsidiaries, the International Petroleum Corporation group ("IPC"), to EarthCare Company (“EarthCare”), for $33.0 million, of which we received $28.0 million in cash and $5.0 million in EarthCare common stock, subject to lock-up and price protection agreements. In addition, after the sale, EarthCare was to pay us the value of certain assets employed in the oil-recycling business through the collection of our accounts receivable by EarthCare and the sale of inventory, prepaid expenses and other assets to EarthCare. EarthCare failed to pay us the amounts due after closing of the sale, and we commenced legal proceedings to collect these amounts. In March 2001, we entered into a settlement agreement with EarthCare (the “Settlement Agreement”). Pursuant to this settlement, in April 2001, we received $1.75 million from EarthCare in settlement of amounts due to us. The Settlement Agreement also released us from all indemnifications previously provided to EarthCare, including environmental indemnifications, as stated in the original purchase agreement for the IPC companies. The settlement resulted in a reduction in the amount of assets we ultimately realized in connection with the discontinuance of our used oil-recycling business, which amounted to an after-tax charge of $656 thousand. In addition, we also recorded additional income taxes of $496 thousand associated with the discontinued operations based on the actual income tax returns filed. The after-tax settlement charge and the additional income taxes was recorded in 2001. As part of the Settlement Agreement, Donald F. Moorehead, Jr., Chairman of EarthCare on the closing of the sale, agreed to purchase the EarthCare stock owned by us for approximately $5.0 million. In May 2001, Mr. Moorehead defaulted on his agreement to purchase those shares. We sought enforcement of the purchase obligation and received principal and interest payments totaling $1.1 million from Mr. Moorehead from August 2001 to August 2002. Then, in October 2002, we received $3.0 million as a final payment to settle the remaining balance due us. Accordingly, in connection with the settlement, we recorded a charge of approximately $1.6 million for the nine months and year ended December 31, 2002. 9. Business Segments, Geographic Information, and Major Customers Business Segments We market fuel and related services, and have two reportable operating segments: marine and aviation fuel services. Performance measurement and resource allocation for the reportable operating segments are based on many factors. Corporate expenses are allocated to the segments based on usage, where possible, or on other factors according to the nature of the activity. The accounting policies of the reportable operating segments are the same as those described in the Summary of Significant Accounting Policies (see Note 1).
Page 69 of 72

Information concerning our operations by business segment is as follows (in thousands): For the
Nine Monthsended
For the Year ended December 31, December 31,2004 2003 2002 2002
Restated Restated Restated( )Revenue:
Marine fuel services 3,031,474$ 1,644,598$ 1,287,417$ 1,033,664$ Aviation fuel services 2,622,899 1,026,959 616,948 518,043
5,654,373$ 2,671,557$ 1,904,365$ 1,551,707$ ( )Income from operations:
Marine fuel services 23,150$ 18,476$ 13,366$ 10,179$ Aviation fuel services 29,093 21,970 18,962 14,081
52,243 40,446 32,328 24,260 Corporate overhead (15,267) (13,104) (12,301) (10,249)
36,976$ 27,342$ 20,027$ 14,011$ ( )Depreciation and amortization:
Marine fuel services 2,036$ 1,487$ 1,195$ 911$ Aviation fuel services 509 234 227 169 Corporate 1,051 2,109 1,443 1,142
3,596$ 3,830$ 2,865$ 2,222$ ( )Capital expenditures:
Marine fuel services 574$ 490$ 1,194$ 540$ Aviation fuel services 637 919 214 180 Corporate 1,187 1,858 1,805 2,035
2,398$ 3,267$ 3,213$ 2,755$
As of December 31,2004 2003
RestatedAccounts and notes receivable, net:
Marine fuel services, net of allowance for bad debts of $5,741 and $5,704 atDecember 31, 2004 and 2003, respectively 330,966$ 162,105$
Aviation fuel services, net of allowance for bad debts of $5,536 and $4,834 atDecember 31, 2004 and 2003, respectively 159,814 81,507
490,780$ 243,612$ Goodwill and identifiable intangible asset
Marine fuel services, net of accumulated amortization of $4,345 and $3,167 atDecember 31, 2004 and 2003, respectively 41,624$ 29,755$
Aviation fuel services, net of accumulated amortization of $1,134 atDecember 31, 2004 and 2003 8,209 8,209
49,833$ 37,964$ Total assets:
Marine fuel services 428,651$ 228,904$ Aviation fuel services 262,223 143,192 Corporate 21,297 28,754
712,171$ 400,850$
Page 70 of 72

Geographic Information Information concerning our operations, as segregated between U.S. and foreign, is presented as follows, based on the country of incorporation of the relevant subsidiary (in thousands):
For the NineMonthsended
For the Year ended December 31, December 31,2004 2003 2002 2002
Restated Restated Restated(Unaudited)
Revenue:United States 2,441,973$ 1,178,418$ 1,040,143$ 840,869$ Singapore 1,726,072 789,101 280,612 238,163 United Kingdom 893,118 278,676 244,844 199,012 Other foreign countries 593,210 425,362 338,766 273,663
Total 5,654,373$ 2,671,557$ 1,904,365$ 1,551,707$ Income (loss) from operations:
United States (461)$ (6,708)$ (5,598)$ (5,715)$ Singapore 19,312 16,089 8,725 6,741 United Kingdom 4,205 5,708 5,398 3,963 Other foreign countries 13,920 12,253 11,502 9,022
Total 36,976$ 27,342$ 20,027$ 14,011$
Our total assets segregated between U.S. and foreign, is presented as follows, based on the country of incorporation of the
relevant subsidiary (in thousands):
2004 2003Restated
Total assets:United States 270,659$ 177,815$ Singapore 179,116 105,093 United Kingdom 178,609 45,636 Other foreign countries 83,787 72,306
712,171$ 400,850$
As of December 31,
Major Customers During each of the periods presented on the consolidated statements of income, none of our customers accounted for more than 10% of total consolidated revenue. 10. Summary Quarterly Information (Unaudited) The unaudited quarterly results for the year ended December 31, 2003 and the unaudited results for the three months ended March 31, 2004, June 30, 2004, and September 30, 2004 have been restated to reflect the correction of the cutoff procedures used by the Company for recognizing sales and sales related costs, as described in Note 2a). Under the corrected cutoff procedures, revenues and sales related costs are recognized at the time fuel deliveries are made and related services are performed. Because we contract with third parties for fuel deliveries and related services performance, this causes delays in our receiving the necessary information for invoicing. As a result of these delays, the Company had historically recorded revenue and sales related costs when supporting documentation relating to fuel deliveries and related services had been received from third parties. In addition, the restated quarterly amounts reflect the correction of inventory derivative accounting. The impact of the restatement for inventory derivative accounting related to timing between the four quarters of 2003 and 2004. There was no impact on the full year 2003 and minor impact on the full year 2004.
Page 71 of 72

We have also restated the consolidated statement of cash flows to present borrowings and repayments under our revolving credit facility on a gross rather than a net basis. The restatement had no impact on the net cash flows from operating activities or investing activities or financing activities for any of the interim periods of 2004 or 2003. Further, certain of the historical balance sheet accounts were misclassified including inventories, prepaid and other current assets, accounts payable, and accrued expenses and other current liabilities. Accordingly, the unaudited condensed consolidated balance sheets for the interim periods of 2004 and 2003 have been adjusted to reflect the correct classifications.
As a result of the restatements, we were not in compliance with certain financial covenants set forth in our credit facility agreement as of June 30, 2004 and September 30, 2004. Although we obtained a waiver of this non-compliance from LaSalle Bank National Association, as Administrative Agent, on March 16, 2005, we have included our outstanding borrowings at June 30, 2004 and September 30, 2004 under the credit facility agreement in short-term debt.
In order to correct the above described items, interim consolidated financial statements for 2004 and 2003 are being
restated in amendments on Form 10-Q/A to the Company’s Quarterly Reports on Form 10-Q for the quarterly periods ended March 31, 2004, June 30, 2004 and September 30, 2004. The following is a summary of the previously reported and restated unaudited results for the three months ended March 31, 2004, June 30, 2004, and September 30, 2004 and the unaudited results for the three months ended December 31, 2004 (in thousands):
For the Three Months endedMarch 31, 2004 June 30, 2004 September 30, 2004 December 31, 2004
Previously Previously PreviouslyReported Restated Reported Restated Reported Restated
Revenue 911,797$ 914,596$ 1,377,378$ 1,379,956$ 1,579,371$ 1,568,974$ 1,790,847$
Gross profit 26,931$ 26,278$ 31,454$ 30,756$ 32,032$ 29,674$ 43,248$ (1)
Net income 5,954$ 5,520$ 6,866$ 6,379$ 6,967$ 5,439$ 11,221$ (2)
Basic earnings per share 0.28$ 0.26$ 0.31$ 0.29$ 0.31$ 0.24$ 0.50$ (2)
Diluted earnings per share (3) 0.26$ 0.24$ 0.29$ 0.27$ 0.29$ 0.23$ 0.47$ (2)
(1)
(2)
(3)
Reflects a charge of $824 thousand, or $0.04 per basic and diluted share, relating to an inventory write-down associated with the exiting of thePanamanian market, net of taxes and reduced performance based compensation.
Includes the write-down of inventory associated with the exiting of the Panamanian market of approximately $2.1 million.
Diluted earnings per share is computed independently for each quarter and the full year based upon respective weighted average shares outstanding.Therefore, the sum of the quarterly diluted earnings per share amounts may not equal the annual diluted earnings per share amount reported.
The following is a summary of the previously reported and restated unaudited quarterly results for the year ended
December 31, 2003 (in thousands):
For the Three Months endedMarch 31, 2003 June 30, 2003 September 30, 2003 December 31, 2003
Previously Previously Previously PreviouslyReported Restated Reported Restated Reported Restated Reported Restated
Revenue 658,000$ 710,898$ 645,918$ 618,937$ 652,301$ 629,428$ 705,571$ 712,294$
Gross profit 27,311$ 29,781$ 25,482$ 23,566$ 24,535$ 24,293$ 23,380$ 23,483$
Net income 5,268$ 6,943$ 5,443$ 4,124$ 5,534$ 5,465$ 5,629$ 5,629$
Basic earnings per share 0.25$ 0.33$ 0.26$ 0.19$ 0.26$ 0.26$ 0.26$ 0.26$
Diluted earnings per share 0.24$ 0.31$ 0.24$ 0.19$ 0.25$ 0.24$ 0.25$ 0.25$
Page 72 of 72

SIGNATURES
Pursuant to the requirements of Section 13 or 15(d) of the Securities Exchange Act of 1934, the registrant has duly caused this Amendment No. 1 to Form 10-K to be signed on its behalf by the undersigned, thereunto duly authorized, on the 6th day of May 2005.
WORLD FUEL SERVICES CORPORATION /s/ Michael J. Kasbar Michael J. Kasbar Director, President, and Chief Operating Officer
Pursuant to the requirements of the Securities Exchange Act of 1934, this Amendment No. 1 to Form 10-K has been signed below by the following persons on behalf of the registrant and in the capacities on the 6th day of May 2005. Signature Title /s/ Paul H. Stebbins Chairman of the Board and Chief Executive Officer Paul H. Stebbins (Principal Executive Officer)
/s/ Michael J. Kasbar Director, President, and Chief Operating Officer Michael J. Kasbar
/s/ Robert S. Tocci Executive Vice President and Chief Financial Officer Robert S. Tocci (Principal Financial and Accounting Officer)
/s/ Francis X. Shea Executive Vice President and Chief Risk and Francis X. Shea Administrative Officer /s/ Ken Bakshi Director Ken Bakshi
/s/ John R. Benbow Director John R. Benbow
/s/ Richard A. Kassar Director Richard A. Kassar
/s/ Myles Klein Director Myles Klein
/s/ J. Thoms Presby Director J. Thomas Presby
/s/ Jerome Sidel Director Jerome Sidel
Page 73 of 72

Exhibit 21.1 SUBSIDIARIES OF THE REGISTRANT
World Fuel Services Corporation, a Florida corporation - World Fuel Services Americas, Inc., a Delaware corporation - World Fuel Services, Inc., a Texas corporation - PAFCO LLC, a Delaware limited liability company (4) - Advance Petroleum, Inc., a Florida corporation - PetroServicios de Mexico S.A. de C.V., a Mexico corporation (1) - Servicios Auxiliares de Mexico S.A. de C.V., a Mexico corporation (1) - Baseops Mexico S.A. de C.V., a Mexico corporation (5)(3) - World Fuel Services Company, Inc., a Florida corporation - Atlantic Fuel Services, S.A., a Costa Rica corporation (3) - Baseops International, Inc., a Texas corporation - Casa Petro S.A., a Costa Rica corporation - PetroServicios de Costa Rica S.A., a Costa Rica corporation (2) - Resource Recovery of America, Inc., a Florida corporation (3) - IRC Oil Technics, Inc., a Delaware corporation (3) - World Fuel Cayman Holding Company II, a Cayman Islands corporation (3) - World Fuel Cayman Holding Company I, a Cayman Islands corporation - Marine Energy Arabia Establishment Ltd., a British Virgin Islands corporation - Marine Energy Arabia Co. LLC, a United Arab Emirate corporation, a majority controlled subsidiary - Trans-Tec International S.R.L., a Costa Rica corporation - World Fuel ApS, a Denmark corporation (3) - World Fuel International S.R.L., a Costa Rica corporation - World Fuel Singapore Holding Company I Pte. Ltd., a Singapore corporation - World Fuel Singapore Holding Company II Pte. Ltd., a Singapore corporation - World Fuel Services (Singapore) Pte. Ltd., a Singapore corporation - Trans-Tec Services (Japan) Co., K.K., a Japan corporation - Oil Shipping B.V., a Netherlands corporation - Oil Shipping (Bunkering) B.V., a Netherlands corporation - Oil Shipping (Hong Kong) Ltd., a Hong Kong corporation (3) - Norse Bunkers AS, a Norway corporation - World Fuel Services (Thailand) Ltd., a Thailand corporation (3) (9) - World Fuel Cayman Holding III, a Cayman Islands corporation - World Fuel Services Finance Company S.a.r.L., a Luxembourg corporation - Baseops Europe Ltd., a United Kingdom corporation (3) - AirData Limited, a United Kingdom corporation (3) - Trans-Tec Services (UK) Ltd., a United Kingdom corporation (3) - Trans-Tec Services (Singapore) Pte. Ltd., a Singapore corporation (3) - World Fuel Services Limited, a United Kingdom corporation (3) - Bunkerfuels UK Limited, a United Kingdom corporation (3) - World Fuel Services European Holding Company I, Ltd., a United Kingdom corporation - World Fuel Services Europe, Ltd., a United Kingdom corporation

SUBSIDIARIES OF THE REGISTRANT (continued)
- Tramp Holdings Limited, a United Kingdom corporation - Tramp Group Limited, a United Kingdom corporation - Tramp Oil & Marine Limited, a United Kingdom corporation - Tramp Oil Aviation Limited, a United Kingdom corporation (3) - Tramp Chartering Limited, a United Kingdom corporation (3) - TOM Oil Limited, a United Kingdom corporation (3) - Tramp Oil & Marine (Med) Limited, a United Kingdom corporation (3) - TOM Oil (Broking) Limited, a United Kingdom corporation (3) - Tramp Oil Fuel Supplies Ltd., a United Kingdom corporation (3) - Tramp Oil Products Limited, a United Kingdom corporation (3) - Debt Enforcement Services Limited, a United Kingdom corporation (3) - Tramp Oil & Marine (Far East) Pte. Ltd., a Singapore corporation - Tramp Oil & Marine (Romania) SRL, a Romania corporation (3) - Tramp Oil Germany GmbH & Co KG, a German partnership - Tramp Oil Schiffahrts-Undhandelsges mbH & Co., a German corporation - Tramp Oil (Brasil) Limitada, a Brazil corporation (6) - Tobras Distribuidora de Combustivrs Ltda., a Brazil corporation - Tramp Oil & Marine (South Cone) S.A., a Chile corporation (7) - Tramp Oil & Marine (Argentina) SA, a Argentina corporation - SCG Agencia de Naves SA, a Chile corporation - Inversione SCG SA, a Argentina corporation (10) - Naveria Cono Svr SA, a Chile corporation (8) (1) These corporations are owned 50% by Advance Petroleum, Inc. and 50% by World Fuel Services Corporation. (2) This corporation is owned 55% by Casa Petro S.A. and 45% by World Fuel Services Corporation. (3) These corporations are inactive. (4) This limited liability company is a joint venture company which is equally owned by World Fuel Services, Inc. and Signature Flight Support Corporation, a Delaware corporation unrelated to the Registrant. (5) This corporation is owned 50% by Advance Petroleum, Inc. and 50% by Baseops International, Inc. (6) This corporation is 67% owned by Tramp Group Limited (7) This corporation is 65% owned by Tramp Group Limited (8) This corporation is owned 97% by Inversione SCG SA and 3% by SCG Agencia de Naves SA (9) This corporation is owned 94% by World Fuel Singapore Holding Company I Pte. Ltd. and 1% by each of World Fuel Services Thailand I through VI LLCs (10) This corporation is owned 35% by Tramp Oil & Marine (South Cone) S.A.

Exhibit 23.1
CONSENT OF INDEPENDENT REGISTERED CERTIFIED PUBLIC ACCOUNTING FIRM We hereby consent to the incorporation by reference in the Registration Statement on Form S-8 (No. 333-68276) and Form S-3 (No. 333-02403) of World Fuel Services Corporation of our report dated March 31, 2005, except for the restatement described in Note 2b) to the consolidated financial statements and the matter described in the penultimate paragraph of Management’s Report on Internal Control Over Financial Reporting, as to which the date is May 5, 2005, relating to the financial statements, management’s assessment of the effectiveness of internal control over financial reporting and the effectiveness of internal control over financial reporting, which appears in this Amendment No. 1 to Form 10-K. /s/ PricewaterhouseCoopers LLP Miami, Florida May 5, 2005

Exhibit 31.1 CERTIFICATION OF THE CHIEF EXECUTIVE OFFICER
pursuant to Rule 13a-14(a) or Rule 15d-14(a)
I, Paul H. Stebbins, certify that:
1. I have reviewed this Amendment No. 1 to Form 10-K of World Fuel Services Corporation; 2. Based on my knowledge, this report does not contain any untrue statement of a material fact or omit to state a material
fact necessary to make the statements made, in light of the circumstances under which such statements were made, not misleading with respect to the period covered by this report;
3. Based on my knowledge, the financial statements, and other financial information included in this report, fairly
present in all material respects the financial condition, results of operations and cash flows of the registrant as of, and for, the periods presented in this report;
4. The registrant's other certifying officers and I are responsible for establishing and maintaining disclosure controls and
procedures (as defined in Exchange Act Rules 13a-15(e) and 15d-15(e)) and internal control over financial reporting (as defined in Exchange Act Rules 131-15(f) and 15d-15(f)) for the registrant and have:
a. Designed such disclosure controls and procedures, or caused such disclosure controls and procedures to be
designed under our supervision, to ensure that material information relating to the registrant, including its consolidated subsidiaries, is made known to us by others within those entities, particularly during the period in which this report is being prepared;
b. Designed such internal control over financial reporting, or caused such internal control over financial
reporting to be designed under our supervision, to provide reasonable assurance regarding the reliability of financial reporting and the preparation of financial statements for external purposes in accordance with generally accepted accounting principles;
c. Evaluated the effectiveness of the registrant's disclosure controls and procedures and presented in this report
our conclusions about the effectiveness of the disclosure controls and procedures, as of the end of the period covered by this report based on such evaluation; and
d. Disclosed in this report any change in the registrant’s internal control over financial reporting that occurred
during the registrant’s most recent fiscal quarter (the registrant’s fourth fiscal quarter in the case of an annual report) that has materially affected, or is reasonably likely to materially affect, the registrant’s internal control over financial reporting; and
5. The registrant's other certifying officers and I have disclosed, based on our most recent evaluation of internal control
over financial reporting, to the registrant's auditors and the audit committee of registrant's board of directors (or persons performing the equivalent function):
a. All significant deficiencies and material weaknesses in the design or operation of internal control over
financial reporting which are reasonably likely to adversely affect the registrant's ability to record, process, summarize and report financial information; and
b. Any fraud, whether or not material, that involves management or other employees who have a significant
role in the registrant's internal control over financial reporting. Date: May 6, 2005
/s/ Paul H. Stebbins Paul H. Stebbins Chairman and Chief Executive Officer

Exhibit 31.2 CERTIFICATION OF THE CHIEF OPERATING OFFICER
pursuant to Rule 13a-14(a) or Rule 15d-14(a)
I, Michael J. Kasbar, certify that:
1. I have reviewed this Amendment No. 1 to Form 10-K of World Fuel Services Corporation; 2. Based on my knowledge, this report does not contain any untrue statement of a material fact or omit to state a material
fact necessary to make the statements made, in light of the circumstances under which such statements were made, not misleading with respect to the period covered by this report;
3. Based on my knowledge, the financial statements, and other financial information included in this report, fairly
present in all material respects the financial condition, results of operations and cash flows of the registrant as of, and for, the periods presented in this report;
4. The registrant's other certifying officers and I are responsible for establishing and maintaining disclosure controls and
procedures (as defined in Exchange Act Rules 13a-15(e) and 15d-15(e)) for the registrant and internal control over financial reporting (as defined in Exchange Act Rules 131-15(f) and 15d-15(f)) for the registrant and have:
a. Designed such disclosure controls and procedures, or caused such disclosure controls and procedures to be
designed under our supervision, to ensure that material information relating to the registrant, including its consolidated subsidiaries, is made known to us by others within those entities, particularly during the period in which this report is being prepared;
b. Designed such internal control over financial reporting, or caused such internal control over financial
reporting to be designed under our supervision, to provide reasonable assurance regarding the reliability of financial reporting and the preparation of financial statements for external purposes in accordance with generally accepted accounting principles;
c. Evaluated the effectiveness of the registrant's disclosure controls and procedures and presented in this report
our conclusions about the effectiveness of the disclosure controls and procedures, as of the end of the period covered by this report based on such evaluation; and
d. Disclosed in this report any change in the registrant’s internal control over financial reporting that occurred
during the registrant’s most recent fiscal quarter (the registrant’s fourth fiscal quarter in the case of an annual report) that has materially affected, or is reasonably likely to materially affect, the registrant’s internal control over financial reporting; and
5. The registrant's other certifying officers and I have disclosed, based on our most recent evaluation of internal control
over financial reporting, to the registrant's auditors and the audit committee of registrant's board of directors (or persons performing the equivalent function):
a. All significant deficiencies and material weaknesses in the design or operation of internal control over
financial reporting which are reasonably likely to adversely affect the registrant's ability to record, process, summarize and report financial information; and
b. Any fraud, whether or not material, that involves management or other employees who have a significant
role in the registrant's internal control over financial reporting.
Date: May 6, 2005
/s/ Michael J. Kasbar Michael J. Kasbar President and Chief Operating Officer

Exhibit 31.3 CERTIFICATION OF THE CHIEF FINANCIAL OFFICER
pursuant to Rule 13a-14(a) or Rule 15d-14(a)
I, Robert S. Tocci, certify that:
1. I have reviewed this Amendment No. 1 to Form 10-K of World Fuel Services Corporation; 2. Based on my knowledge, this report does not contain any untrue statement of a material fact or omit to state a material
fact necessary to make the statements made, in light of the circumstances under which such statements were made, not misleading with respect to the period covered by this report;
3. Based on my knowledge, the financial statements, and other financial information included in this report, fairly
present in all material respects the financial condition, results of operations and cash flows of the registrant as of, and for, the periods presented in this report;
4. The registrant's other certifying officers and I are responsible for establishing and maintaining disclosure controls and
procedures (as defined in Exchange Act Rules 13a-15(e) and 15d-15(e)) for the registrant and internal control over financial reporting (as defined in Exchange Act Rules 131-15(f) and 15d-15(f)) for the registrant and have:
a. Designed such disclosure controls and procedures, or caused such disclosure controls and procedures to be
designed under our supervision, to ensure that material information relating to the registrant, including its consolidated subsidiaries, is made known to us by others within those entities, particularly during the period in which this report is being prepared;
b. Designed such internal control over financial reporting, or caused such internal control over financial
reporting to be designed under our supervision, to provide reasonable assurance regarding the reliability of financial reporting and the preparation of financial statements for external purposes in accordance with generally accepted accounting principles;
c. Evaluated the effectiveness of the registrant's disclosure controls and procedures and presented in this report
our conclusions about the effectiveness of the disclosure controls and procedures, as of the end of the period covered by this report based on such evaluation; and
d. Disclosed in this report any change in the registrant’s internal control over financial reporting that occurred
during the registrant’s most recent fiscal quarter (the registrant’s fourth fiscal quarter in the case of an annual report) that has materially affected, or is reasonably likely to materially affect, the registrant’s internal control over financial reporting; and
5. The registrant's other certifying officers and I have disclosed, based on our most recent evaluation of internal control
over financial reporting, to the registrant's auditors and the audit committee of registrant's board of directors (or persons performing the equivalent function):
a. All significant deficiencies and material weaknesses in the design or operation of internal control over
financial reporting which are reasonably likely to adversely affect the registrant's ability to record, process, summarize and report financial information; and
b. Any fraud, whether or not material, that involves management or other employees who have a significant
role in the registrant's internal control over financial reporting.
Date: May 6, 2005 /s/ Robert S. Tocci Robert S. Tocci Executive Vice-President and Chief Financial Officer

Exhibit 31.4 CERTIFICATION OF THE CHIEF RISK AND ADMINISTRATIVE OFFICER
pursuant to Rule 13a-14(a) or Rule 15d-14(a)
I, Francis X. Shea, certify that:
1. I have reviewed this Amendment No. 1 to Form 10-K of World Fuel Services Corporation; 2. Based on my knowledge, this report does not contain any untrue statement of a material fact or omit to state a material
fact necessary to make the statements made, in light of the circumstances under which such statements were made, not misleading with respect to the period covered by this report;
3. Based on my knowledge, the financial statements, and other financial information included in this report, fairly
present in all material respects the financial condition, results of operations and cash flows of the registrant as of, and for, the periods presented in this report;
4. The registrant's other certifying officers and I are responsible for establishing and maintaining disclosure controls and
procedures (as defined in Exchange Act Rules 13a-15(e) and 15d-15(e)) for the registrant and internal control over financial reporting (as defined in Exchange Act Rules 131-15(f) and 15d-15(f)) for the registrant and have:
a. Designed such disclosure controls and procedures, or caused such disclosure controls and procedures to be
designed under our supervision, to ensure that material information relating to the registrant, including its consolidated subsidiaries, is made known to us by others within those entities, particularly during the period in which this report is being prepared;
b. Designed such internal control over financial reporting, or caused such internal control over financial
reporting to be designed under our supervision, to provide reasonable assurance regarding the reliability of financial reporting and the preparation of financial statements for external purposes in accordance with generally accepted accounting principles;
c. Evaluated the effectiveness of the registrant's disclosure controls and procedures and presented in this report
our conclusions about the effectiveness of the disclosure controls and procedures, as of the end of the period covered by this report based on such evaluation; and
d. Disclosed in this report any change in the registrant’s internal control over financial reporting that occurred
during the registrant’s most recent fiscal quarter (the registrant’s fourth fiscal quarter in the case of an annual report) that has materially affected, or is reasonably likely to materially affect, the registrant’s internal control over financial reporting; and
5. The registrant's other certifying officers and I have disclosed, based on our most recent evaluation of internal control
over financial reporting, to the registrant's auditors and the audit committee of registrant's board of directors (or persons performing the equivalent function):
a. All significant deficiencies and material weaknesses in the design or operation of internal control over
financial reporting which are reasonably likely to adversely affect the registrant's ability to record, process, summarize and report financial information; and
b. Any fraud, whether or not material, that involves management or other employees who have a significant
role in the registrant's internal control over financial reporting.
Date: May 6, 2005 /s/ Francis X. Shea Francis X. Shea Executive Vice-President and Chief Risk and Administrative Officer

9800 N.W. 41st Street • Suite 400 • Miami, Florida 33178(305) 428-8000 • (305) 392-5621 Fax • www.worldfuel.com • (NYSE: INT)

Exhibit 32.1
STATEMENT OF CHIEF EXECUTIVE OFFICER, CHIEF OPERATING OFFICER, CHIEF FINANCIAL OFFICER AND CHIEF RISK AND ADMINISTRATIVE OFFICER
under Section 906 of the Sarbanes-Oxley Act of 2002 (18 U.S.C. Section 1350)
We, Paul H. Stebbins, the Chairman and Chief Executive Officer of World Fuel Services Corporation (the
“Company”), Michael J. Kasbar, the President and Chief Operating Officer of the Company, Robert S. Tocci, Executive Vice-President and Chief Financial Officer of the Company and Francis X. Shea, Executive Vice-President and Chief Risk and Administrative Officer of the Company, certify for the purposes of Section 1350 of Chapter 63 of Title 18 of the United States Code that, to the best of our knowledge,
(i) the Annual Report of the Company on Amendment No. 1 to Form 10-K, for the fiscal year ended December 31, 2004 (the “Report”), fully complies with the requirements of section 13(a) of the Securities Exchange Act of 1934, and
(ii) the information contained in the Report fairly presents, in all material respects, the financial condition and results
of operations of the Company. Date: May 6, 2005
/s/ Paul H. Stebbins Paul H. Stebbins Chairman and Chief Executive Officer /s/ Michael J. Kasbar Michael J. Kasbar President and Chief Operating Officer /s/ Robert S. Tocci Robert S. Tocci Executive Vice-President and Chief Financial Officer /s/ Francis X. Shea Francis X. Shea Executive Vice-President and Chief Risk and Administrative Officer
A SIGNED ORIGINAL OF THIS WRITTEN STATEMENT REQUIRED BY SECTION 906
HAS BEEN PROVIDED TO THE COMPANY AND WILL BE RETAINED BY THE COMPANY AND FURNISHED TO THE SECURITIES AND EXCHANGE COMMISSION OR ITS STAFF UPON REQUEST.