Embed Size (px)
Citation preview

EEI Financial ConferenceEEI Financial Conference
November 9 November 9 -- 12, 200812, 2008Scottsdale, Arizona Scottsdale, Arizona
Xcel Energy Inc.414 Nicollet MallMinneapolis, Minnesota 55401www.xcelenergy.com

This material includes forwardThis material includes forward--looking statements that are subject to looking statements that are subject to certain risks, uncertainties and assumptions. Such forwardcertain risks, uncertainties and assumptions. Such forward--looking looking statements include projected earnings, cash flows, capital statements include projected earnings, cash flows, capital expenditures and other statements and are identified in this docexpenditures and other statements and are identified in this document ument by the words by the words ““anticipate,anticipate,”” ““estimate,estimate,”” ““expect,expect,”” ““projected,projected,””““objective,objective,”” ““outlook,outlook,”” ““possible,possible,”” ““potentialpotential”” and similar and similar expressions. Actual results may vary materially. Factors that expressions. Actual results may vary materially. Factors that could could cause actual results to differ materially include, but are not lcause actual results to differ materially include, but are not limited to: imited to: general economic conditions, including the availability of credigeneral economic conditions, including the availability of credit, t, actions of rating agencies and their impact on capital expendituactions of rating agencies and their impact on capital expenditures; res; business conditions in the energy industry; competitive factors;business conditions in the energy industry; competitive factors;unusual weather; effects of geopolitical events, including war aunusual weather; effects of geopolitical events, including war and acts nd acts of terrorism; changes in federal or state legislation; regulatioof terrorism; changes in federal or state legislation; regulation; actions n; actions of accounting regulatory bodies; and other risk factors listed fof accounting regulatory bodies; and other risk factors listed from rom time to time by Xcel Energy in reports filed with the SEC, inclutime to time by Xcel Energy in reports filed with the SEC, including ding Exhibit 99.01 to Xcel EnergyExhibit 99.01 to Xcel Energy’’s report on Form 10s report on Form 10--K for year 2007.K for year 2007.
Safe HarborSafe Harbor

Dick KellyDick KellyChairman, President and CEOChairman, President and CEO

Fundamental Elements of Xcel EnergyFundamental Elements of Xcel Energy
Credit qualityCredit quality
Balance sheet strengthBalance sheet strength
Strong liquidityStrong liquidity
FlexibilityFlexibility
Safe dividendSafe dividend
Solid growth prospectsSolid growth prospects
We are positioned to execute our strategy We are positioned to execute our strategy ––despite economic headwindsdespite economic headwinds

Solid Credit RatingsSolid Credit Ratings
Holding Co. – – – BBB+ Baa1 BBB
NSPM A+ A2 A A A3 BBB+
NSPW A+ A2 A A A3 A-
PSCo A A3 A A– Baa1 BBB+
SPS – – – BBB+ Baa1 BBB+
Holding Co.Holding Co. –– –– –– BBB+BBB+ Baa1Baa1 BBBBBB
NSPMNSPM A+A+ A2A2 A A AA A3A3 BBB+BBB+
NSPWNSPW A+A+ A2 A2 A A AA A3A3 AA--
PSCoPSCo AA A3A3 A A AA–– Baa1Baa1 BBB+BBB+
SPSSPS –– –– –– BBB+BBB+ Baa1Baa1 BBB+BBB+
Fitch Moody’s S&P Fitch Moody’s S&P*Fitch Moody’s S&P Fitch Moody’s S&P*SecuredSecured UnsecuredUnsecured
* S&P upgraded the unsecured ratings for NSPM, NSPW and PSCo on November 5, 2008

Proactive Equity IssuanceProactive Equity Issuance
Issued 17.25 million shares in September 2008Issued 17.25 million shares in September 2008
Proceeds of approximately $345 millionProceeds of approximately $345 million
Rationale for equity issuance:Rationale for equity issuance:Fund capital expenditure growth planFund capital expenditure growth planKeeps balance sheet strongKeeps balance sheet strongPrudently took advantage of a stable periodPrudently took advantage of a stable periodin a disruptive capital market in a disruptive capital market Consistent with our financial plans and Consistent with our financial plans and message to investorsmessage to investors

Strong Balance SheetStrong Balance Sheet
MillionsMillions PercentPercentEquityEquity $ 6,848$ 6,848 42.5%42.5%Preferred EquityPreferred Equity 104104 0.6%0.6%Hybrid SecurityHybrid Security 400400 2.5%2.5%Current Portion LT DebtCurrent Portion LT Debt 994994 6.2%6.2%ShortShort--term Debtterm Debt 264264 1.6%1.6%LongLong--term Debtterm Debt 7,4867,486 46.5%46.5%Total CapitalizationTotal Capitalization $16,096 100%$16,096 100%
As of September 30, 2008As of September 30, 2008

Strong Liquidity Strong Liquidity Strong Liquidity
HoldCo $ 772 $ 406 $ 13 $ 419NSPM 482 476 1 477PSCo 675 668 49 717SPS 248 108 34 142Other * 0 0 61 61Total $2,177 $1,658 $ 159 $1,816
HoldCoHoldCo $ 772$ 772 $ 406$ 406 $ 13$ 13 $ 419$ 419NSPMNSPM 482482 476476 11 477477PSCoPSCo 675675 668668 4949 717717SPSSPS 248248 108108 3434 142142Other *Other * 00 00 6161 6161TotalTotal $2,177$2,177 $1,658 $1,658 $ 159 $ 159 $1,816$1,816
Credit TotalLines Available Cash LiquidityCreditCredit TotalTotalLinesLines AvailableAvailable CashCash LiquidityLiquidity
Dollars in millions as of October 31, 2008Dollars in millions as of October 31, 2008Dollars in millions as of October 31, 2008
* Excludes $18.5 million held in The Reserve Fund* Excludes $18.5 million held in The Reserve Fund

Modest Debt MaturitiesModest Debt MaturitiesModest Debt Maturities
$0
$200
$400
$600
$800
$1,000
$1,200
2009 2010 2011 2012 2013 2014
SPS
PSCo
NSPM
Xcel Energy
Dollars in millionsDollars in millionsDollars in millions

Strong Access to Credit Markets in 2008Strong Access to Credit Markets in 2008
Hold Co Hold Co -- issued $400 million of retail hybrid securities issued $400 million of retail hybrid securities with a 7.6% coupon in Januarywith a 7.6% coupon in JanuaryNSPNSP--Minnesota Minnesota -- issued $500 million of first mortgage issued $500 million of first mortgage bonds with 10bonds with 10--year maturity and 5.25% coupon in Marchyear maturity and 5.25% coupon in MarchPSCo PSCo -- issued $600 million of first mortgage bonds in issued $600 million of first mortgage bonds in August: August:
1010--year tranche with a 5.8% couponyear tranche with a 5.8% coupon3030--year tranche with a 6.5% coupon year tranche with a 6.5% coupon
NSPNSP--Wisconsin Wisconsin –– issued $200 million of first mortgage issued $200 million of first mortgage bonds with 30bonds with 30--year maturity and 6.375% coupon in year maturity and 6.375% coupon in SeptemberSeptemberPotential debt issuances Potential debt issuances -- late 2008 or early 2009late 2008 or early 2009
SPS SPS -- up to $250 million of unsecured debtup to $250 million of unsecured debt

Financial ExecutionFinancial ExecutionDelivering 2 Delivering 2 –– 4% Dividend Growth*4% Dividend Growth*
$0.95$0.92$0.89$0.86$0.83
2004 2005 2006 2007 2008
2004 2004 –– 2008 CAGR = 3.4%2008 CAGR = 3.4%
Annualized dividend per shareAnnualized dividend per share
* Xcel Energy increased the dividend by 3* Xcel Energy increased the dividend by 3¢¢ on May 21, 2008on May 21, 2008

Financial ExecutionFinancial ExecutionDelivering on 5 Delivering on 5 –– 7% EPS Growth7% EPS Growth
$1.15$1.15$1.30$1.30
$1.43$1.43
2005 2005 Ongoing*Ongoing*
2006 2006 Ongoing*Ongoing*
2007 2007 Ongoing*Ongoing*
Guidance RangeGuidance Range
$1.45$1.45––$1.50$1.50
2008 2008 GuidanceGuidance
* Ongoing EPS excludes the impacts of COLI and disc ops.* Ongoing EPS excludes the impacts of COLI and disc ops.A reconciliation to GAAP earnings is included in the appendixA reconciliation to GAAP earnings is included in the appendix..
** ** Estimated CAGR is based on middle of 2009 guidance rangeEstimated CAGR is based on middle of 2009 guidance range
2005 2005 –– 2009 CAGR = 6.9%**2009 CAGR = 6.9%** $1.45$1.45––$1.55$1.55
2009 2009 GuidanceGuidance

Built to LastBuilt to Last
Fully regulated utilityFully regulated utilityConstructive regulatory recoveryConstructive regulatory recoveryEarn a reasonable authorized returnEarn a reasonable authorized return
Strong balance sheetStrong balance sheetAccess to credit marketAccess to credit marketOpportunistic equity issuanceOpportunistic equity issuance
Flexibility of our strategy Flexibility of our strategy Meet renewable standardsMeet renewable standardsPush out timePush out time--line for new baseload plantline for new baseload plant

Ben FowkeBen FowkeVice President and Chief Financial OfficerVice President and Chief Financial Officer

Tactical Plans for 2009Tactical Plans for 2009
Continue to execute strategic planContinue to execute strategic plan
Align capital investment with sales growth Align capital investment with sales growth forecastforecast
Stay on track to meet RPS goalsStay on track to meet RPS goals
Efficiently finance growth strategyEfficiently finance growth strategy
Achieve successful rate case outcomesAchieve successful rate case outcomes

Capital Forecast Update Capital Forecast Update
2009 2010 2011 2012Other Nuclear Fuel Gas
Electric Distribution Electric Transmission Generation
Wind
Dollars in millionsDollars in millions
$1,800$1,800
$2,300$2,300 $2,350$2,350 $2,350$2,350

NSP Wind ProjectNSP Wind Project
Project adds 351 megawatts of wind generation Project adds 351 megawatts of wind generation at two different sitesat two different sites
Phased constructionPhased construction2009 2009 –– 20112011
Total cost approximatelyTotal cost approximately$900 million$900 million
Rider recoveryRider recovery

Financing PlansFinancing Plans
Strong access to capital marketsStrong access to capital markets
Modest financing needs for 2009Modest financing needs for 2009NSPNSP--M $400 million of first mortgage bondsM $400 million of first mortgage bondsPSCo $400 million of first mortgage bondsPSCo $400 million of first mortgage bonds

Minnesota Electric Rate CaseMinnesota Electric Rate Case
2009 Forward test year2009 Forward test yearFiled November 3, 2008Filed November 3, 2008Seeking rate relief of $156 millionSeeking rate relief of $156 million
Electric rate base of $4.1 billionElectric rate base of $4.1 billionRequested ROE of 11.0%Requested ROE of 11.0%Equity ratio of 52.5%Equity ratio of 52.5%
Interim rates of $155 million effective January 2009Interim rates of $155 million effective January 2009Decision expected fall/winter 2009Decision expected fall/winter 2009

Colorado Electric Rate Case Colorado Electric Rate Case
Expected filing in November 2008Expected filing in November 2008Seeking 2009 forward test yearSeeking 2009 forward test yearElectric rate base of $4.1 billionElectric rate base of $4.1 billion
Decision expected 3Decision expected 3rdrd quarter 2009quarter 2009Partial year revenue increasePartial year revenue increaseLooking at options regarding 2010 test yearLooking at options regarding 2010 test yearRate increase request will be partially offset by Rate increase request will be partially offset by fuel and capacity cost savings from Comanche 3fuel and capacity cost savings from Comanche 3

2009 Earnings Guidance2009 Earnings Guidance
200920092009
Key AssumptionsKey AssumptionsRelatively flat sales growthRelatively flat sales growthReasonable treatment in rate casesReasonable treatment in rate casesIncreasing revenue from ridersIncreasing revenue from ridersRising O&M expenseRising O&M expenseIncreasing depreciation expenseIncreasing depreciation expenseIncreasing interest expenseIncreasing interest expenseHigher share countHigher share count
Earnings Per ShareEarnings Per Share $1.45 $1.45 -- $1.55$1.55

Key TakeKey Take--AwaysAways
Our strategy remains unchanged and on trackOur strategy remains unchanged and on track
We have the liquidity and balance sheetWe have the liquidity and balance sheetto finance our rate base growth strategyto finance our rate base growth strategy
Guidance reflects economic realitiesGuidance reflects economic realities
We are wellWe are well--positioned to execute ourpositioned to execute ourbusiness planbusiness plan
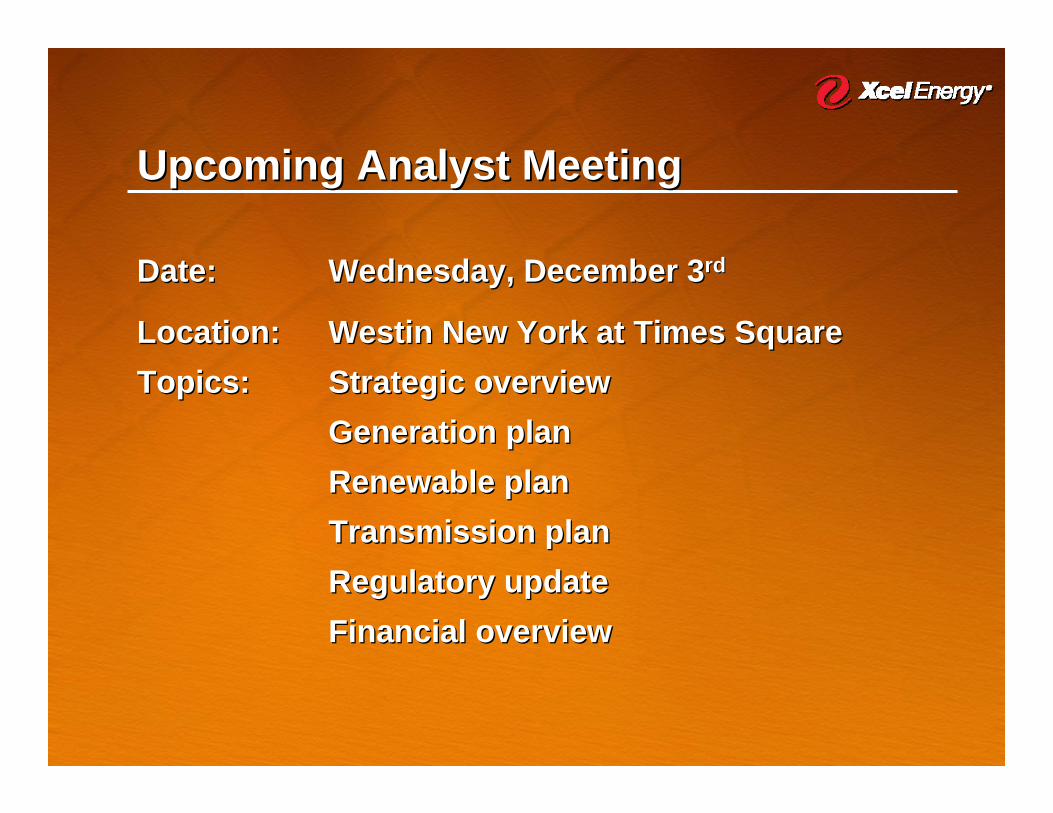
Upcoming Analyst Meeting Upcoming Analyst Meeting
Date: Date: Wednesday, December 3Wednesday, December 3rdrd
Location: Location: Westin New York at Times SquareWestin New York at Times SquareTopics:Topics: Strategic overviewStrategic overview
Generation planGeneration planRenewable planRenewable planTransmission planTransmission planRegulatory updateRegulatory updateFinancial overviewFinancial overview


AppendixAppendix

Traditional RegulationTraditional Regulation
Operate in 8 StatesOperate in 8 States
Combination UtilityCombination UtilityElectric 85% of net incomeElectric 85% of net incomeGas 15% of net incomeGas 15% of net income
CustomersCustomers3.3 million electric3.3 million electric1.8 million gas1.8 million gas
2007 Financial Statistics2007 Financial StatisticsNI Ongoing: $612 million NI Ongoing: $612 million NI GAAP: $577 millionNI GAAP: $577 millionAssets: $23 billionAssets: $23 billionEquity ratio: 43%Equity ratio: 43%
Company ProfileCompany Profile
NSPNSP--WisconsinWisconsin6% of earnings *6% of earnings *NSPNSP--MinnesotaMinnesota
40% of earnings *40% of earnings *
SPSSPS5% of earnings *5% of earnings *
PSCoPSCo49% of earnings *49% of earnings *
2007 EPS Ongoing: $1.43; GAAP: $1.352007 EPS Ongoing: $1.43; GAAP: $1.352008 Dividend $0.95 per share annualized2008 Dividend $0.95 per share annualized
* Percentages based on 2007 Ongoing Earnings* Percentages based on 2007 Ongoing Earnings

Ongoing Earnings $1.15 $1.30 $1.43PSRI/COLI 0.05 0.05 (0.08)Continuing Operations $1.20 $1.35 $1.35Disc Ops 0.03 0.01 –GAAP Earnings $1.23 $1.36 $1.35
Ongoing Earnings Ongoing Earnings $1.15 $1.15 $1.30$1.30 $1.43$1.43PSRI/COLIPSRI/COLI 0.050.05 0.050.05 (0.08)(0.08)Continuing OperationsContinuing Operations $1.20$1.20 $1.35$1.35 $1.35$1.35Disc Ops Disc Ops 0.030.03 0.01 0.01 ––GAAP Earnings $1.23 GAAP Earnings $1.23 $1.36$1.36 $1.35$1.35
Reconciliation Reconciliation ––Ongoing EPS to GAAPOngoing EPS to GAAP
200720072007Dollars per shareDollars per share
200620062006200520052005
As a result of the termination of the COLI program, Xcel Energy’s management believes that ongoing earnings provide a more meaningful comparison of earnings results between different periods in which the COLI program was in place and is more representative of Xcel Energy’s fundamental core earnings power. Xcel Energy’s management uses ongoing earnings internally for financial planning and analysis, for reporting of results to the Board of Directors, in determining whether performance targets are met for performance-based compensation,and when communicating its earnings outlook to analysts and investors.
As a result of the termination of the COLI program, Xcel EnergyAs a result of the termination of the COLI program, Xcel Energy’’s management s management believes that ongoing earnings provide a more meaningful comparibelieves that ongoing earnings provide a more meaningful comparison of earnings son of earnings results between different periods in which the COLI program was results between different periods in which the COLI program was in place and is in place and is more representative of Xcel Energymore representative of Xcel Energy’’s fundamental core earnings power. s fundamental core earnings power. Xcel EnergyXcel Energy’’s management uses ongoing earnings internally for financial plans management uses ongoing earnings internally for financial planning ning and analysis, for reporting of results to the Board of Directorsand analysis, for reporting of results to the Board of Directors, in determining , in determining whether performance targets are met for performancewhether performance targets are met for performance--based compensation,based compensation,and when communicating its earnings outlook to analysts and inveand when communicating its earnings outlook to analysts and investors.stors.
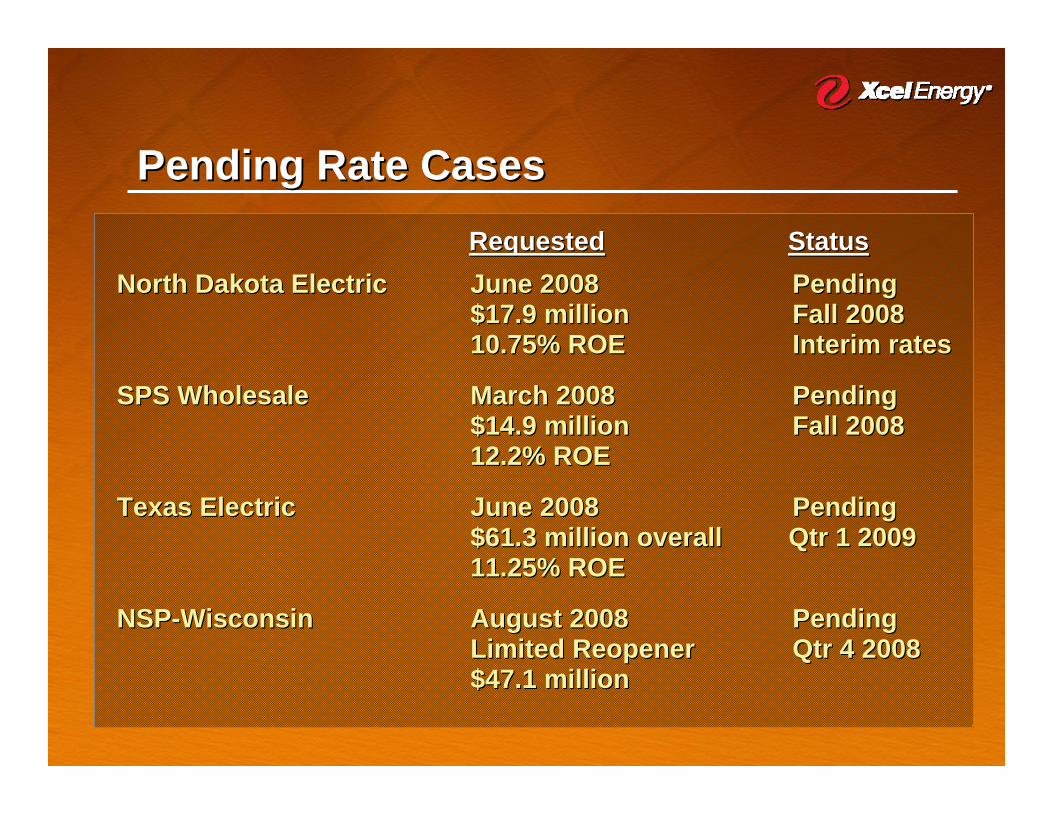
Pending Rate CasesPending Rate Cases
North Dakota ElectricNorth Dakota Electric June 2008June 2008 PendingPending$17.9 million$17.9 million Fall 2008Fall 200810.75% ROE10.75% ROE Interim ratesInterim rates
SPS WholesaleSPS Wholesale March 2008March 2008 PendingPending$14.9 million$14.9 million Fall 2008Fall 200812.2% ROE12.2% ROE
Texas ElectricTexas Electric June 2008June 2008 Pending Pending $61.3 million overall Qtr 1 2009 $61.3 million overall Qtr 1 2009 11.25% ROE11.25% ROE
NSPNSP--Wisconsin Wisconsin August 2008August 2008 PendingPendingLimited ReopenerLimited Reopener Qtr 4 2008Qtr 4 2008$47.1 million$47.1 million
RequestedRequested StatusStatus

2008 Regulatory Outcomes2008 Regulatory Outcomes
New Mexico ElectricNew Mexico Electric December 2007December 2007 August 2008 August 2008 $17.3 million$17.3 million $10.7 million $10.7 million 11.0% ROE 11.0% ROE 10.18% ROE10.18% ROE
PSCo WholesalePSCo Wholesale February 2008February 2008 SettlementSettlementBase rates $8.8 millionBase rates $8.8 million $6.5 million$6.5 millionCWIP $3.7 million Blackbox CWIP $3.7 million Blackbox 11.5% ROE11.5% ROE
RequestedRequested ApprovedApproved

2007 Rate Base and ROE2007 Rate Base and ROE
Minnesota ElectricMinnesota Electric $4,054$4,054 11.02%11.02%Minnesota GasMinnesota Gas 456456 7.747.74North Dakota ElectricNorth Dakota Electric 202202 2.962.96North Dakota GasNorth Dakota Gas 4444 7.667.66South Dakota ElectricSouth Dakota Electric 251251 9.289.28Colorado ElectricColorado Electric 3,5693,569 10.0910.09Colorado GasColorado Gas 1,0961,096 10.4510.45Wisconsin ElectricWisconsin Electric 554554 8.338.33Wisconsin GasWisconsin Gas 7777 8.598.59Texas ElectricTexas Electric 940940 4.61*4.61*New Mexico Electric**New Mexico Electric** 276276 2.24*2.24*WholesaleWholesale 982 Not Reported982 Not ReportedTotal Rate Base $12,501Total Rate Base $12,501
Weather NormalizedRate Base Earned ROE
Weather NormalizedWeather NormalizedRate BaseRate Base Earned ROEEarned ROE
Dollars in millionsDollars in millions
* Texas and New Mexico ROE* Texas and New Mexico ROE’’s are actual earned, not weather normalizeds are actual earned, not weather normalized** Results impacted by fuel disallowance** Results impacted by fuel disallowance