Embed Size (px)
Citation preview

1
E f b ildiEnergy systems for green buildings
WANG R.Z.Shanghai Jiao Tong Universityg g y
July 18, 2016

2
1. What is a Green Building (GB)?什么是绿色建筑?什么是绿色建筑?

3
Possible forms of GBPossible forms of GB

4
Energy saving, renewable uses

5
Green Building Energy Systems
The concept of green building has stirred extensive interest among the building and energy researches.
Solar energy
R blRenewableenergy Wind energy
Geothermal energyEnergy systems
in green buildings
Geothermal energy
Heat pump
Efficienttechnology CCHP
Other technologies

6
2. Solar Energy in Green Building太阳能在绿色建筑中的应用

7
Solar collectors
Flat plate collector Evacuated tube collector

8
Present state
Annual average growth of 30%.
Total area 310,000,000 m2 (2013).
Annual yield 60,000,000 m2 (2013).
Spreading from rural to urban areas.
9
Integration approach

10
Integration approach
Integration with balconies
Solar fraction 70%. Auxiliary electric heater.
Integration with awning Auxiliary air source heat
pump water heater.

11
Integration approach
Solar hot water system in high-rise residential building. g g
Integration with balconiesIntegration with balconiesExample in Shanghai:2800 apartments
0 95 hi h U t t d t b l0.95m-high U-type evacuated tubular solar collectors with CPC. 3m2 each

12
Hot water supply system Air outlet valveAir outlet valve
Central hot water supply systemHeat storage water tank
Roof of building
Set pressure tank
Roof of building
Set pressure tank
Central-individual hot water supply systemHot water pump
Set pressure tank
Solar collecting pump Heat storage water tank
Water tank space / attic
Individual hot water supply systemSolar collecting pump Water tank space / attic
To u
sers
Main-water
To u
sers
Hot water
Central Central-
T
Heat storage water tank
Hot water
M i t
Set pressure tankindividual
Main-water
Solar collecting pump
individual
Solar collectors Balcony

13
Solar cooling
Adsorption Refrigeration for solar cooling.
60-90oC hot water driven adsorption chiller. 80oC 15 kW/15 oC COP=0.55. 65oC 8 kW/15 oC COP=0.4.

14
Newly developed adsorption chiller
Cooling power: 50kWSize: 2.7m×2.1m×2mDesign COP: 0 4~0 6
A newly developed 50kW module designed system in 2014.There are 300 - 500 adsorption chillers sold per year
Design COP: 0.4~0.6
recently in the world, which shows the good prospects of solar cooling.

15
Tests with High Performance
No. 1 2 3 4 5 6Heating temp(oC) 85.9 85.4 82.2 61.8 85.8 86.0
Cooling temp(oC) 29.8 30.3 32.1 29.4 30.0 30.1
Chilled ater inlet temp(oC) 15 0 11 8 19 5 14 7 15 3 15 0Chilled water inlet temp(oC) 15.0 11.8 19.5 14.7 15.3 15.0
Chilled water outlet temp(oC) 11.2 9.1 14.7 13.2 11.5 11.3
Cooling power(kW) 41.1 29.6 50.1 17.1 40.9 40.1
COP 0.515 0.344 0.627 0.358 0.431 0.439
SCP (W kg-1) 120.1 86.4 146.4 50.1 119.5 117.2
Cooling time(s) 800 600 600 600 600 600
i ( )Mass recovery time(s) 40 40 40 40 80 40
Heat recovery time(s) 40 24 24 24 40 40

16
Solar cooling with absorption chillersWh 1 ff ?Why 1.n effect?
Double effect(>140 oC)Medium temp Double effect(>140 oC)Medium temp
No match of heat gradeStable temp?
Single effect(80oC -95oC)Low temp

17
1.n effect: novel design
High P condensorHigh P vaporHeat
High P generator
High P absorber Low P generator 1
Low P generator 2
RefrigerantHeat
High P generator Low P generator 2

18
1.n effect absorption chillerith t d 50kWwith rated power 50kW
Experimental data
T Tch1 ( C)
Tch2 ( C) T 1 (oC) T 2 (oC) Cooling
(k ) COP
Experimental data
Tgen (oC) (oC) Tc1 ( C) Tc2 ( C) power(kW) COP
95.0 12.5 9.4 31.2 34.9 35.9 0.69100.2 10.2 7.5 32.5 35.9 33.4 0.70104.4 16.4 13.2 29.8 34.2 45.5 0.78110.9 15.0 10.7 32.4 37.2 43.5 0.85115.8 14.7 10.5 30.9 35.1 49.0 1.00118.8 11.0 7.2 28.2 32.0 43.7 1.02120.0 13.5 9.0 27.6 31.9 51.9 1.08

19
Solar desiccant coolingSolar collector
Regeneration air
Evaporative coolerProcess air
Ambient airSupply air
FanHeat exchanger
Air flow chart of a two stage desiccant cooling A 5kW desiccant cooling system
g
A two-stage rotary desiccant cooling system with 20 kW cooling power and a th l COP f b t 0 8 1 0thermal COP of about 0.8~1.0.

20
3. Heat Pumps and their applications in Green Building热泵等在绿色建筑中的应用热泵等在绿色建筑中的应用

21
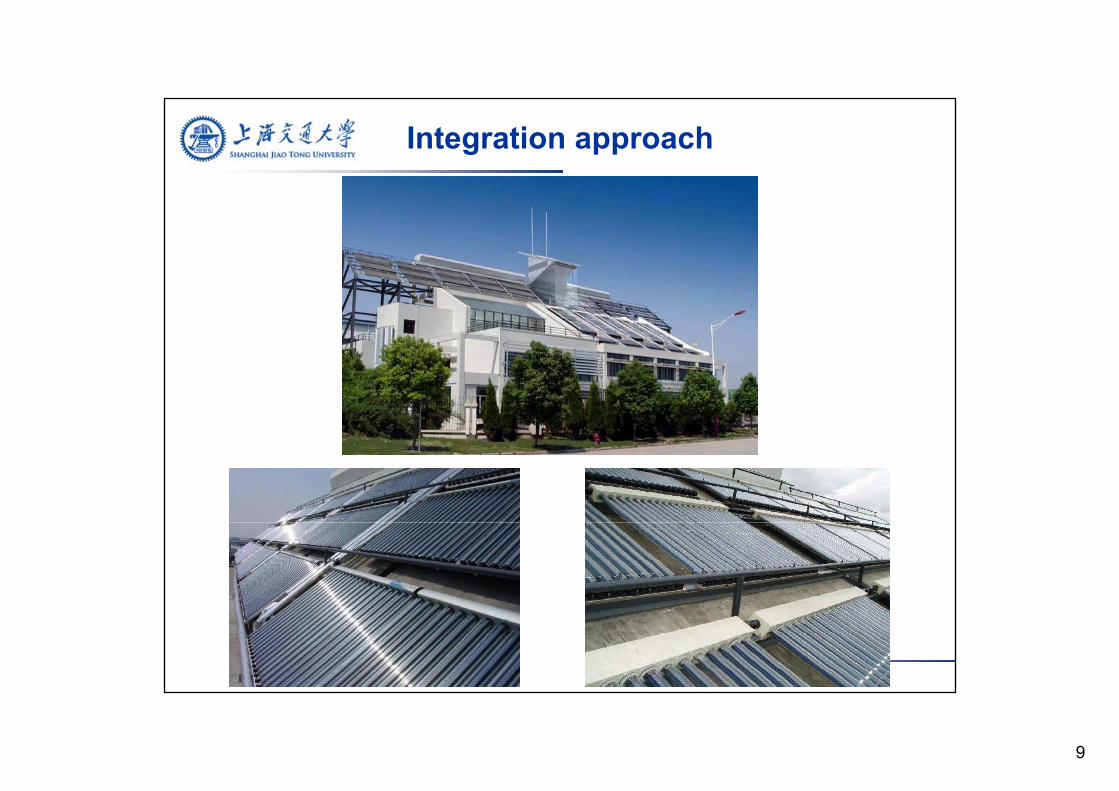
Air source heat pump water heater
Electricity inputy p
Heat of air inputCompressor
Evaporator
Conde
Hot water outlet
enser
Cold water inlet
Reservoir Filter Expansion valve
22
Air source heat pump water heater
Demonstration projects

23
Ground source heat pump
In summer, the heat from the room is delivered into the
earth
In winter, the heat from the earth is delivered into the
roomearth. room.

24
Experience in an archives building
A GSHP system with condensation heat recovery for a building of 8000 m2.
The COP attains 5.2 in the heating mode. The COP attains 5.1 in the cooling mode. The heat rejected to the soil was reduced by 33.7% owing
to heat recovery.
25
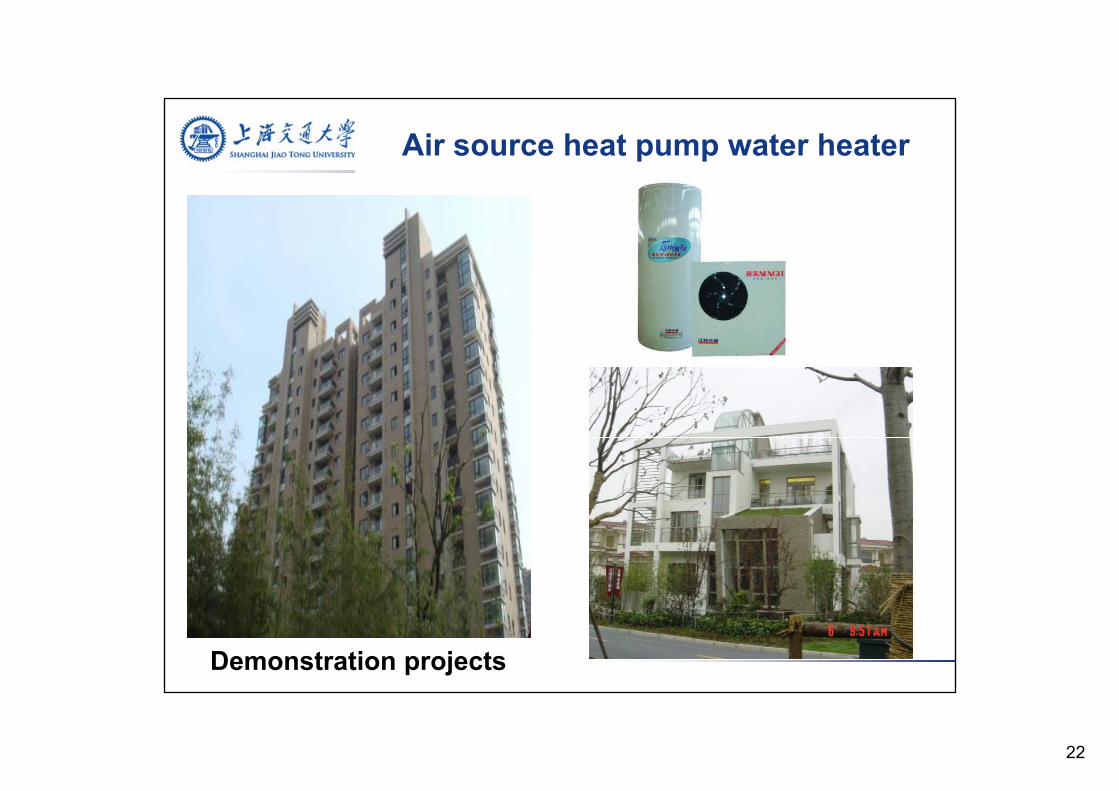
Solar panel heat pump
Solar PV
Vapor compression system by solar-powered prime mover.
Inverter AC
Controller
I t
Controller
InverterThe solar panel heat pump
produced by Midea Air Conditioning Company
Battery
Conditioning Company

26
Experimental results
The system consists of PV panels, a controller, an inverter, a lead-acid battery bank and a commercial variable
System performance Index
frequency split type room air conditioner.
System performance Index
Cooling capacity 0.1~7 kW
H ti it 0 12 9 kWHeating capacity 0.12~9 kW
Solar-electric efficiency 12.5%
Inverter efficiency 80.2%
Electric COP of air conditioner 3~4.1
Solar COP 0.3~0.41

27
4. CCHPs and smart grid in Green Building冷热电联供及智能电网与绿色建筑冷热电联供及智能电网与绿色建筑

28
Combined cooling, heating and power system
Transformer
Grid
Building
Energy-cascaded-utilization system
Electric cabinet
Electricity
Electric cabinet
Exhaust gas or jacket water or exhaust steam
Hot water or steam
Heating Cooling
H d i hFuel
Heat recovery system
Heat-driven heat-pumpFuel
High-efficiency
Power generation Unit
Decrease in pollutant emission and losses in the transportIncrease in reliability and quality of the supply

29
EquipmentsPrime movers
Steam turbine50-500,000kW
IC engine10-5000kW
Micro-turbine1-1000kW
Fuel cell1-1200kW
With differentelectric-thermal performance.
Stirling engineUp to 100kW
Different prime movers are suitable for different situations.

30
Moveable micro-CCHP system
Heating output 17.7kW Electric output 16kW
Cooling output 6.5kW Electric efficiency 23.8% Thermal efficiency 56.9%
Physical mapThermal efficiency 56.9% Total efficiency 80.7%
System principle diagram

31
5. Green Building Energy Systems D i SJTU G B ildiDemo in SJTU Green Building绿色建筑能源系统的示范与实践

32
Green Energy Laboratory
1500 m2,14+ key energy system technologies;
Italian Ministry for Environment, Land and Sea
152 million euro (€), Solar energy utilization, technology integration, LEED certification
Shanghai Jiao TongUniversity
Sea
integration, LEED certification application;

33
Experience in the GEL of SJTU
The 1st
floorExhibition atrium, labs for energy research
floorThe 2nd
floorLabs, meeting rooms, staff rooms, student rooms
The 3rd
floorTwo independent apartments with the area of 65 and 92 m2

34
System and research in GEL
Category of the g y
technologies:• Renewable energy e e ab e e e gy
technologies.
• Highly efficient
energy systems.
• Heat recovery
technology.
• Energy storage.

35
Automatic monitoring system
Main interface of the automaticMain interface of the automatic monitoring system

36
CCHP and smart micro grid system
LPG
PV Power GRID
Wind Power
Power (7 kW)
25 kW
(5 kW)(5 kW)
TEMA 30/50 Sino-Italian Green Energy Laboratory
50
60 Jacket water exhaust gas total heating output electric efficiency primary energy efficiency 0.8
1.0
25
30
0.8
1.0
Design parameters1 Continuous el. Power kW 22
2 Nominal el. Efficiency % 28
10
20
30
40
heat
(kW
)
0 2
0.4
0.6 efficiency
5
10
15
20
cooling outputCOPco
olin
g ou
tput
(kW
)
0.2
0.4
0.6 efficiency
3 Cooling capacity (AC) kW 23
4 Heating capacity kW 60
5 Max. Water Temp. ℃ 95
6 Exhaust gas max. Temp. ℃ 550
0 4 8 12 16 200
10
electric output (kW)
0.0
0.2
4 8 12 16 200
5 COP primary energy efficiency
electric output (kW)
c
0.0 7 Electric heat pump kW 24 (C)28 (H)
8 Battery pack Ah 620

37
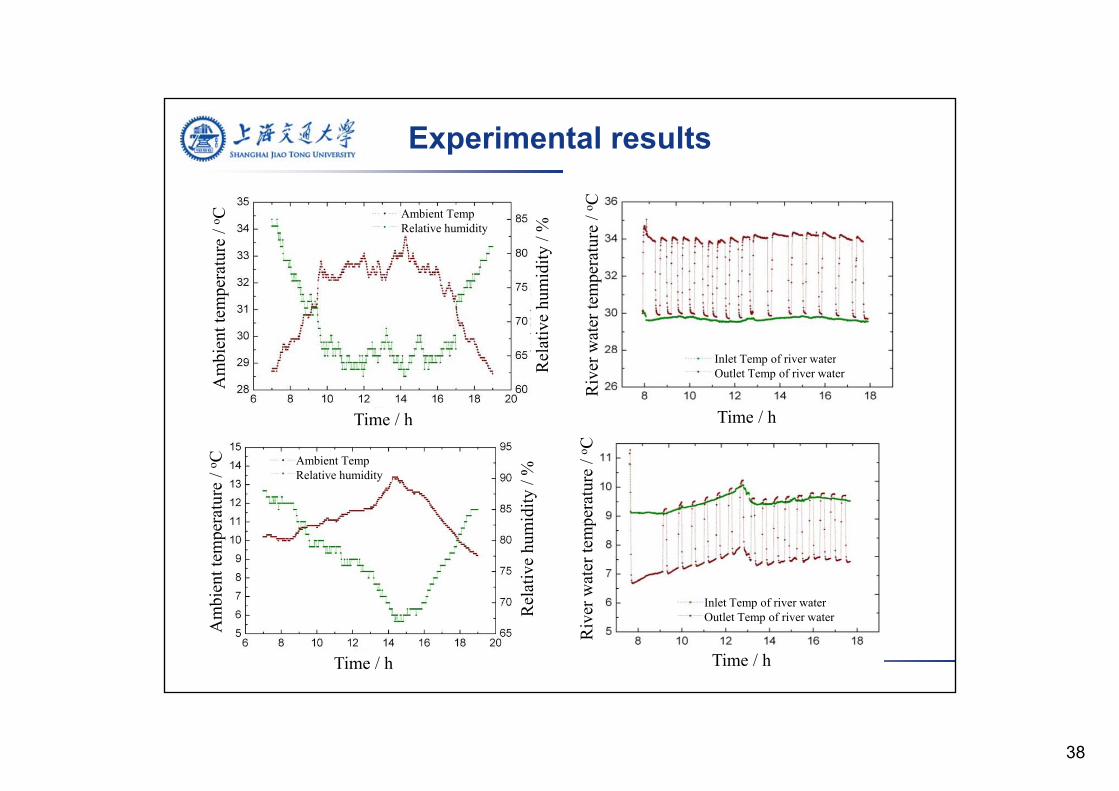
River water source heat pump
As for the cooling mode, the COP is 5.3; the temperature of supply and back water is 7/12 oC.pp yAs for the heating mode, the COP is 4.1; the temperature of supply and back water is 45/40 oC.
38
Experimental results
atur
e / o C
dity
/ %
erat
ure
/ o CAmbient TempRelative humidity
ient
tem
pera
lativ
e hu
mid
wat
er te
mpe
Am
bi Re
Time / h Time / h
Riv
er Inlet Temp of river water
Outlet Temp of river water
C
ratu
re /
o C
mid
ity /
%
pera
ture
/ o C
Ambient TempRelative humidity
mbi
ent t
empe
r
Rel
ativ
e hu
m
er w
ater
tem
pInlet Temp of river water
Am
Time / h
R
Riv
e
Time / h
pOutlet Temp of river water

39
Solar cooling and heating

40
Ground source heat pump
To fan coilsGreen energy lab
Heat pump Ground heat exchanger
Green energy lab
The building area covered by the GSHP system is 180 m2.The rated cooling capacity is 22.3 kW.The rated heating capacity is 29 5 kWThe rated heating capacity is 29.5 kW.

41
Experimental results in heating mode
Heat transfer IHeat transfer III
Heat transfer IIHeating capacity
For the ground heat
exchanger:
W/m
y / k
W
Group I: 38.5 W/m;
Group II: 15.5 W/m;
trans
fer /
W
ng c
apac
ity Group III: 18.1 W/m;
For the heating system:
Hea
t t
Hea
tin Average heating
capacity: 20.9 kW;
COP 3
Time / hh:mm
COP: 3
Variations in heat transfer of ground heat exchanger and heating capacity

42
Experimental results in cooling mode
For the ground heat
W/m
y / k
W
exchanger:
Group I: 43.4 W/m;
Group II: 49 7 W/m;
rans
fer /
W
ng c
apac
ity Group II: 49.7 W/m;
Group III: 51.9 W/m;
For the cooling system:Heat transfer IHeat transfer IIHeat transfer IIICooling capacity
Hea
t tr
Coo
lin
For the cooling system:
Average cooling
capacity: 17 kW;
Time / hh:mm
p y ;
COP: 3.2
Variations in heat transfer of ground heat exchanger and cooling capacity

43
Tests of ASHP for cooling,Tests of ASHP for cooling, heating with different terminals
70 2 t t70 m2 test room
44
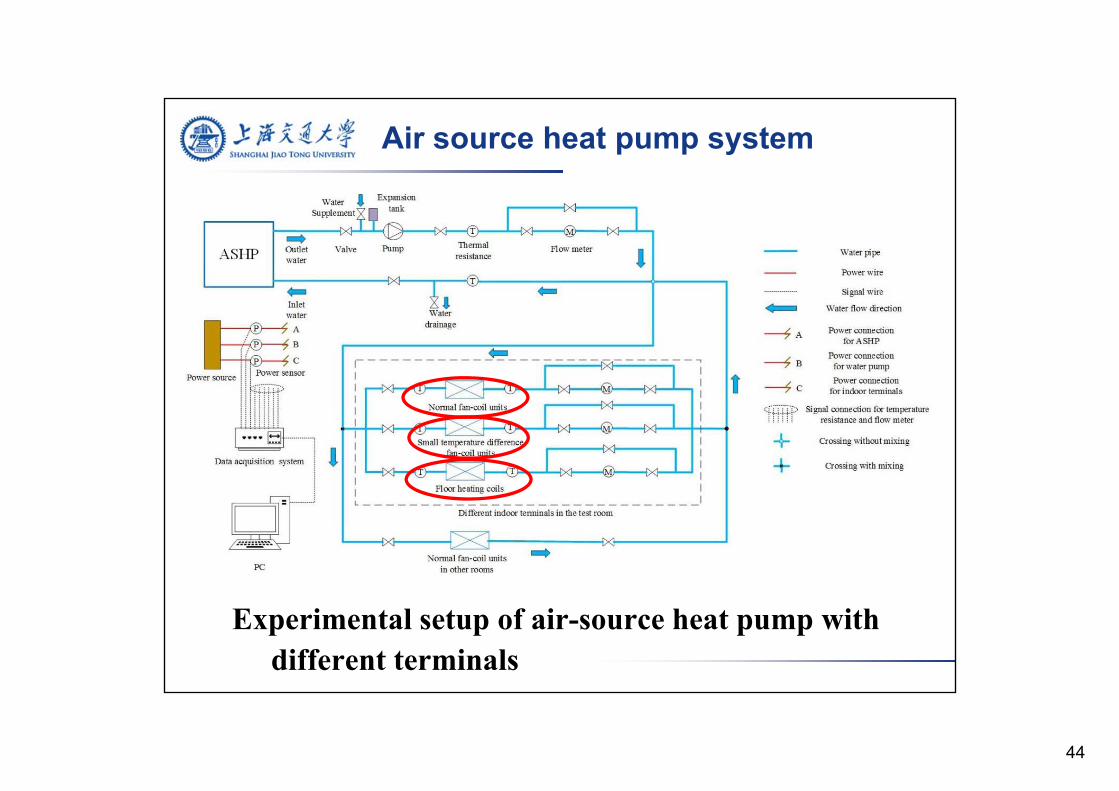
Air source heat pump system
Experimental setup of air-source heat pump with different terminals

45
Layout of different indoor terminals

46
Summer cooling testsSu e coo g tests
Comparison Group
Test Results: Outdoor Air Temperature in summer cooling mode

47
Experimental results (summer cooling)
Daily energy consumption of ASHP with STDFCUS and NFCUs under different weather conditions
ASHP+STDFCU consumes 15%-22% less energy than ASHP+NFCU under cooling mode

48
Experimental results
Daily average COP of ASHP with STDFCUS and NFCUs d diff t th ditiunder different weather conditions
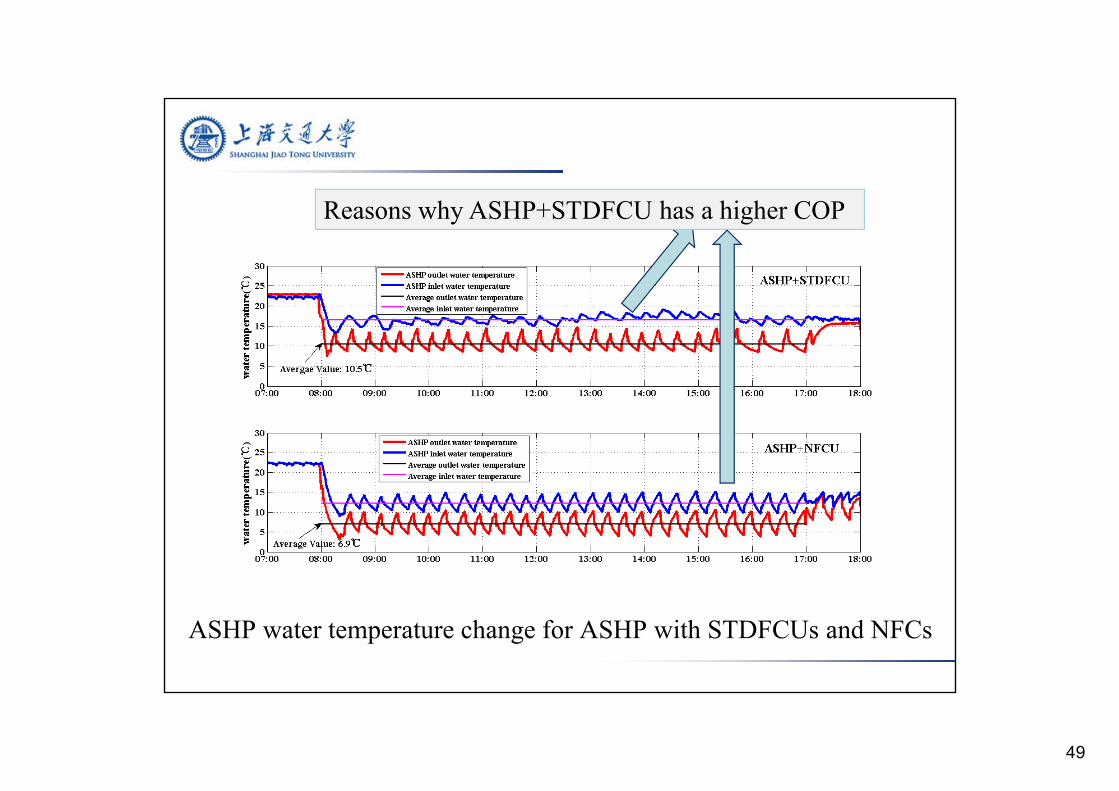
ASHP+STDFCU has a 13%-24% higher COP than ASHP+NFCU under cooling mode
49
Reasons why ASHP+STDFCU has a higher COP
ASHP water temperature change for ASHP with STDFCUs and NFCs

50
Winter heating testste eat g tests
Comparison Groupp p
Test Results: Outdoor Air Temperature in winter heating mode

51
STDFCU:Small Temperature
Difference Fan-coil Units
NFCU:Normal Fan-coil Units
FHC:Floor Heating coils
Test Results: Indoor air temperature of a typical day

52
STDFCU:Small Temperature
Diff F il U it
NFCU:Normal Fan-coil Units
FHC:Floor Heating coils
Test Results: Power consumption of ASHP with different terminals
Difference Fan-coil Units

53
STDFCU:Small Temperature
Diff F il U itNFCU:
Normal Fan-coil UnitsFHC:
Floor Heating coils
Test Results: Power consumption of ASHP with different terminals
Difference Fan-coil UnitsNormal Fan coil Units Floor Heating coils

54
Reasons why ASHP+STDFCU/FHC has a higher COP
42oC42 C
37oC
ASHP water temperature change for ASHP with different terminals

55
FCU: Fan-coil Units FHC: Floor Heating coils
Test Results: Temperature difference between T&RH logger andblack ball temperature measurement

56
Small compact air source heat pump
Small compact air source heat pump system (3hp compressor) with the rated cooling capacity of 7.4 kW.
Capable of heating cooling and hot water Capable of heating, cooling and hot water supply.
4 small temperature difference fan coil units.

57
25
30
温度(℃) 相对湿度(%)
25
30
温度(℃) 相对湿度(%)
10
15
20
10
15
20
0
5
0 200 400 600 800 1000 1200 1400 1600
时间(min)
0
5
0 200 400 600 800 1000 1200 1400 1600
时间(min)
35
温度(℃) 相对湿度(%)
35
温度(℃) 相对湿度(%)
North bed room South bed room
15
20
25
30
15
20
25
30
0
5
10
15
0
5
10
0 200 400 600 800 1000 1200 1400 16000 200 400 600 800 1000 1200 1400 1600
时间(min)
0 200 400 600 800 1000 1200 1400 1600
时间(min)
Kitchen room Living room

58
30℃ R t t M t (3 d )30℃ Return water Measurements (3 days)Experimental Date:2015-1-08-21:25-2015-1-11-21:25
Date Tav(℃)
RHav(%)
Ave Dew point(℃)
Tmin(℃)
Tmax(℃)
(℃)
Out
1-08-1-09 5.9 52.7 -3.3 0 11.9
1-09- 7 9 54 7 1 1 2 4 14 8door 1-10 7.9 54.7 -1.1 2.4 14.8
1-10-1-11 8.7 58.2 0.3 2.2 15.5
92 m2 two bed rooms & 1 living room+kichen roomsElectricity consumptions: 29 35/27 3/25 87 kWhElectricity consumptions: 29.35/27.3/25.87 kWh

59
ASHP electric po erASHP electric power, consumption, heating output
4 hours
1 hour
24 hours

60
35℃ R t t M t (2 d )35℃ Return water Measurements (2 days)Experimental Date: 2015-1-06-13:20-2015-1-08-13:20
Date Tav(℃)
RHav(%)
Ave Dew Point(℃)
Tmin(℃)
Tmax(℃)
1 06Outdoor
1-06-1-07 4.8 67.8 -0.7 3.4 8.5
1-07- 4 4 56 7 3 8 0 91-08 4.4 56.7 -3.8 0 9
92 m2 two bed rooms & 1 living room+kichen rooms92 m2 two bed rooms & 1 living room+kichen roomsElectricity consumptions: 39.8/32.5 kWh

61
40℃ R t t M t (3 d )40℃ Return water Measurements (3 days)Experimental Date: 2015-1-11-21:28-2015-1-14-21:28
Date Tav(℃)
RHav(%)
Ave dew point(℃)
Tmin(℃)
Tmax(℃)
(℃)
Out
1-11-1-12 6.8 70.1 1.6 4.2 10.2
1 12 1Outdoor
1-12-1-13 7.4 77.5 3.6 5.7 10.3
1-13-1- 7 8 91 3 6 5 7 1 8 5
92 m2 two bed rooms & 1 living room+kichen rooms14 7.8 91.3 6.5 7.1 8.5
Electricity consumptions: 55.02/52.3/48.46 kWh

62
Experimental results(35 oC return water)
Room Average Minimum Maximum
The ambient temperature: from 0 oC to 9 oC.
Room Average temperature/ oC
Minimum temperature/ oC
Maximum temperature/ oC
Living room 20 2 17 4 22 5Living room 20.2 17.4 22.5
Dining room 20.1 17.5 22.5
Kitchen 19 8 17 3 20 8Kitchen 19.8 17.3 20.8
South bedroom 21.9 18.6 24.0
North bedroom 20 8 18 0 22 0North bedroom 20.8 18.0 22.0
The indoor thermal environment is comfortable, especially in winter, the indoor temperature is always p y p yuniform and kept at 20-22 oC or so.
The winter daily electric consumption is about 38 kWh.

63
Conclusions
Resources and climatei Sh h i
Mean annual temperature of 17.6 oC 2000 h of sunshine Hot summer and cold winterin Shanghai Hot summer and cold winter Lower reaches of the Yangtze River Sufficient gas supply
A li bl t h l i Solar energy system Ground source heat pumpApplicable technologies
in green buildings Ground source heat pump River water source heat pump Air source heat pump Combined cooling, heating and power
Integration of R ti f bl b 75%Integration of renewable technologies
Ratio of renewable can be over 75% Energy saving rate can be over 50%

64
Thanks!Thanks!