Embed Size (px)
Citation preview
ByDr. Kanagaraj Easwaran
Associate Professor
Department of Social WorkSchool of Social Sciences
Mizoram UniversityAizawl -796 004.
What is analysis Explaining the one with the other Association Relationship: Linear vs Non linear Comparison: Two or More Groups Hypothesis Testing
Parametric vs Non Parametric Tests◦ Parameter – Population measure
Mean, Standard Deviation, Proportion◦ Statistic – Sample measure
Mean, Standard Deviation, Proportion
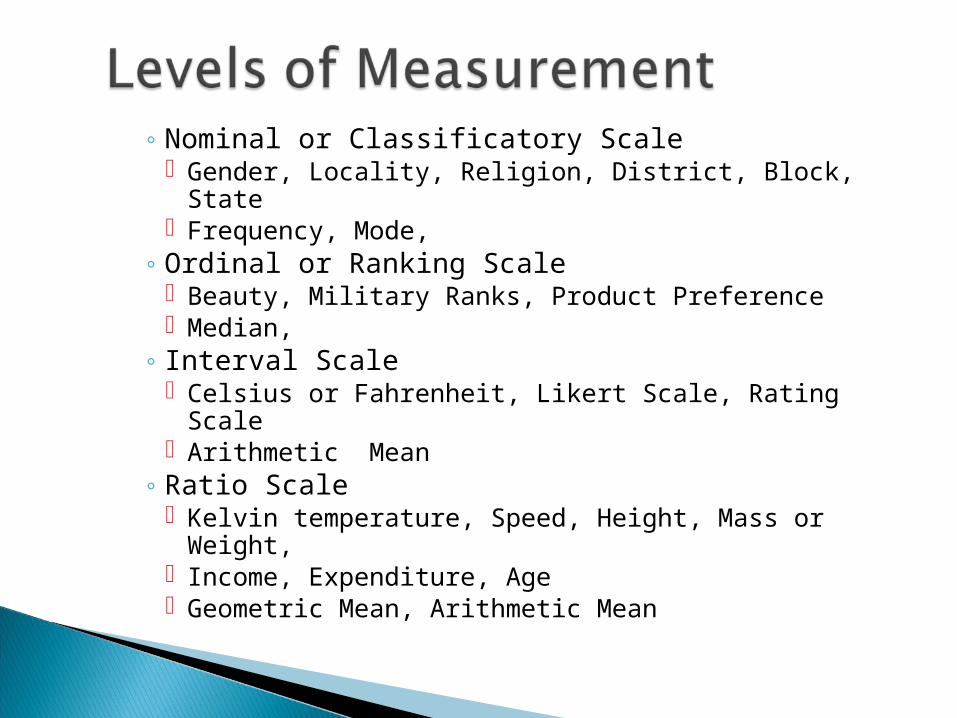
◦ Nominal or Classificatory Scale Gender, Locality, Religion, District, Block, State Frequency, Mode,
◦ Ordinal or Ranking Scale Beauty, Military Ranks, Product Preference Median,
◦ Interval Scale Celsius or Fahrenheit, Likert Scale, Rating Scale Arithmetic Mean
◦ Ratio Scale Kelvin temperature, Speed, Height, Mass or
Weight, Income, Expenditure, Age Geometric Mean, Arithmetic Mean
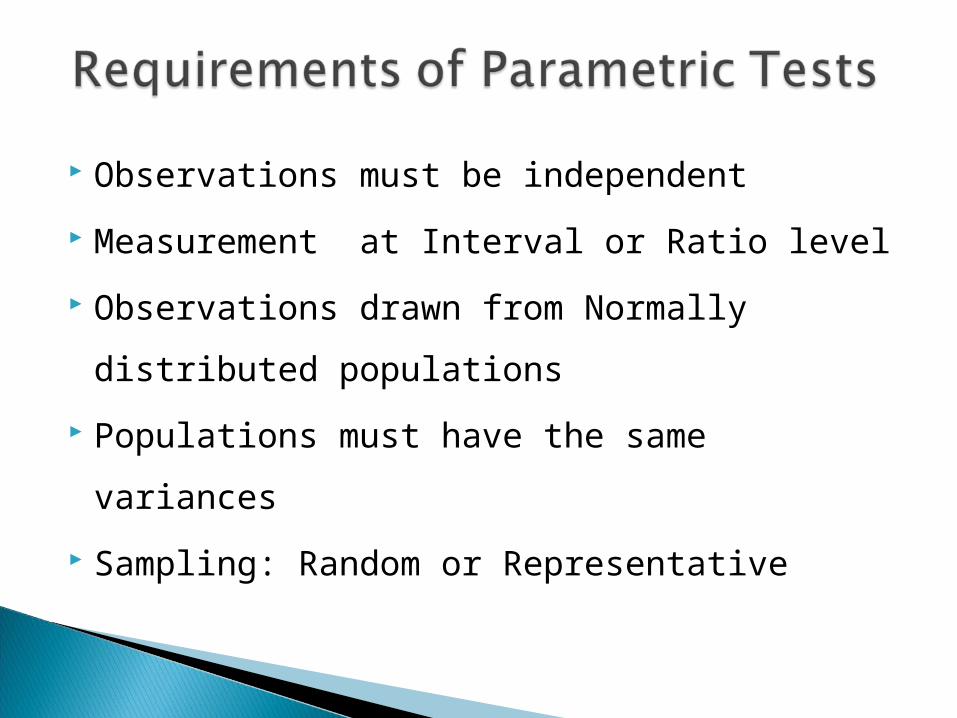
Observations must be independent Measurement at Interval or Ratio level Observations drawn from Normally
distributed populations Populations must have the same variances Sampling: Random or Representative
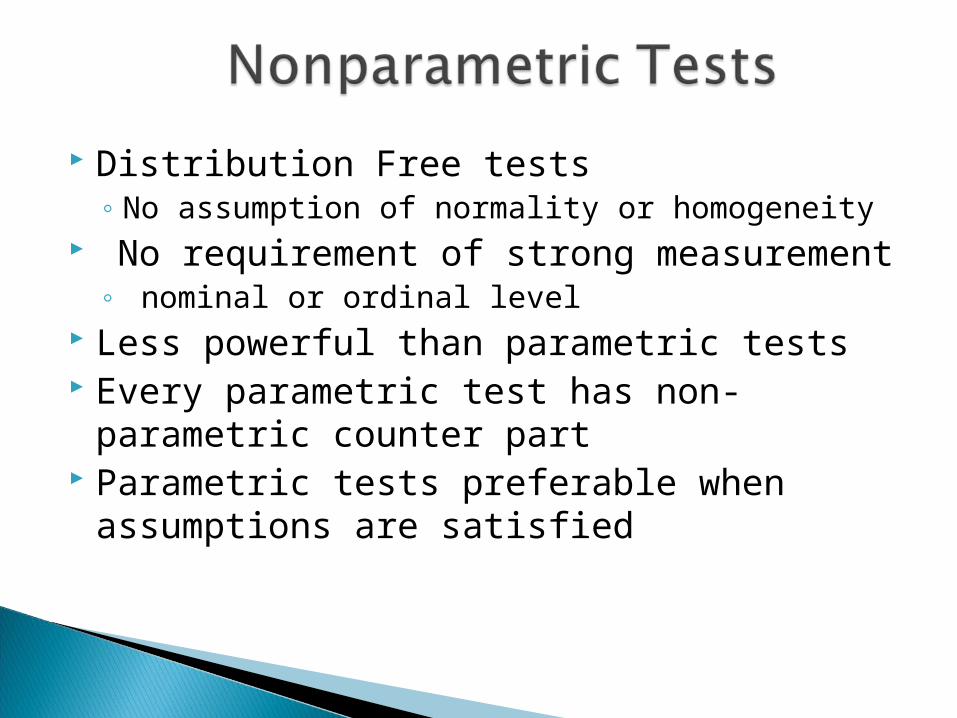
Distribution Free tests◦ No assumption of normality or homogeneity
No requirement of strong measurement◦ nominal or ordinal level
Less powerful than parametric tests Every parametric test has non-parametric
counter part Parametric tests preferable when
assumptions are satisfied
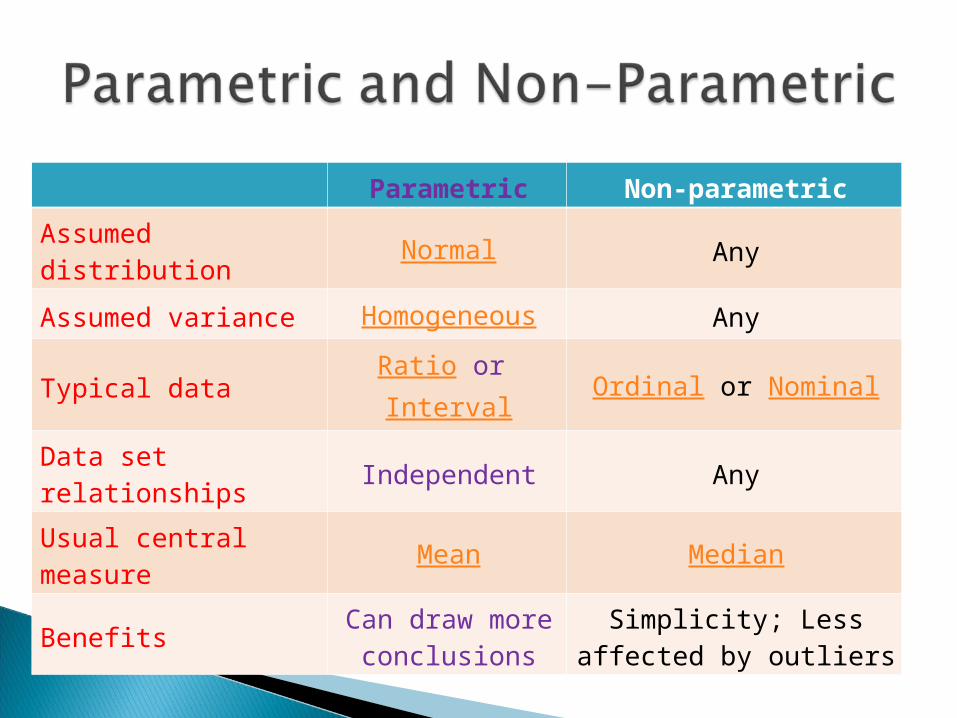
Parametric Non-parametricAssumed distribution Normal AnyAssumed variance Homogeneous AnyTypical data Ratio or Interval Ordinal or NominalData set relationships Independent Any
Usual central measure Mean Median
Benefits Can draw more conclusions
Simplicity; Less affected by outliers
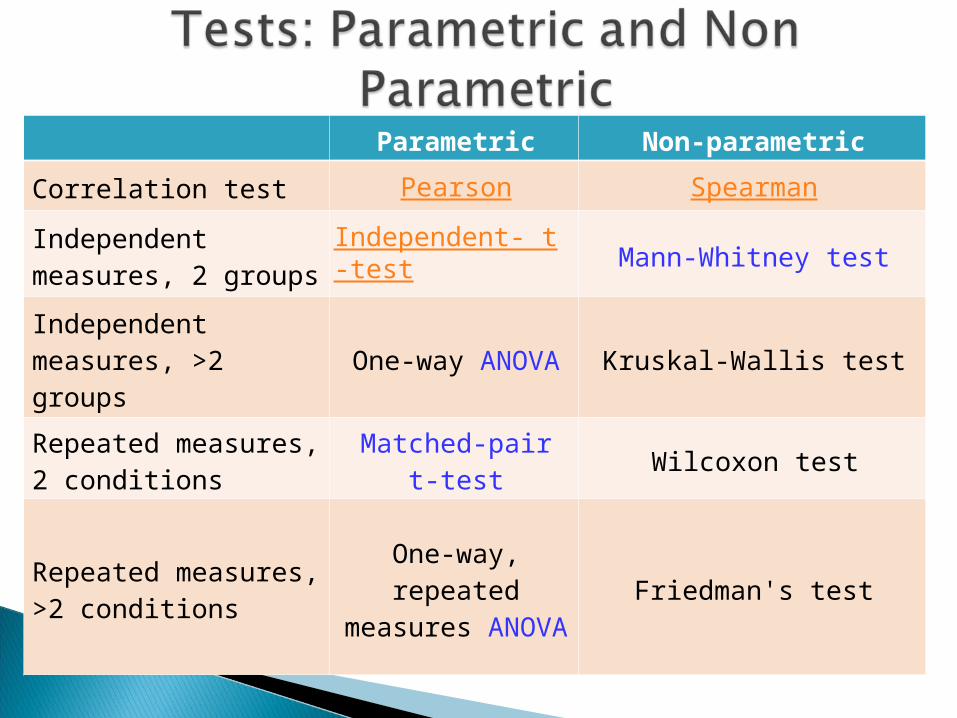
Parametric Non-parametricCorrelation test Pearson SpearmanIndependent measures, 2 groups
Independent- t-test
Mann-Whitney test
Independent measures, >2 groups One-way ANOVA Kruskal-Wallis test
Repeated measures, 2 conditions
Matched-pair t-test Wilcoxon test
Repeated measures, >2 conditions
One-way, repeated
measures ANOVAFriedman's test
Univariate: Descriptive Statistics
Bivariate
Multivariate