Embed Size (px)
Citation preview
1 Ultrasound diagnosis of Fetal Anomalies
CLINICAL IMAGAGINGAN ATLAS OF DIFFERENTIAL DAIGNOSIS
EISENBERG
DR. Muhammad Bin Zulfiqar PGR-FCPS III SIMS/SHL
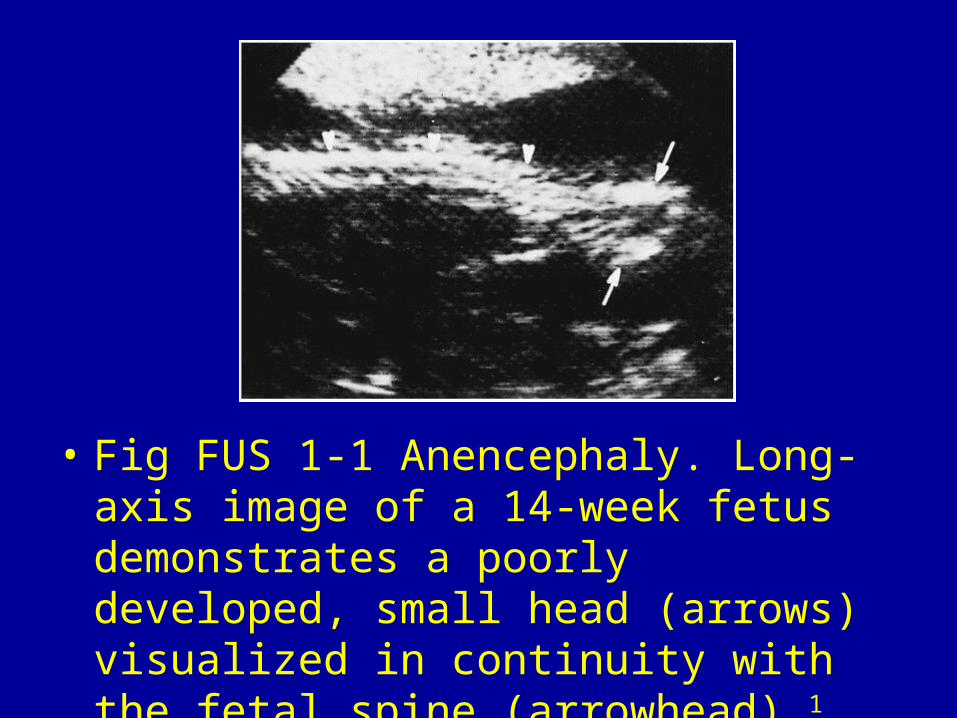
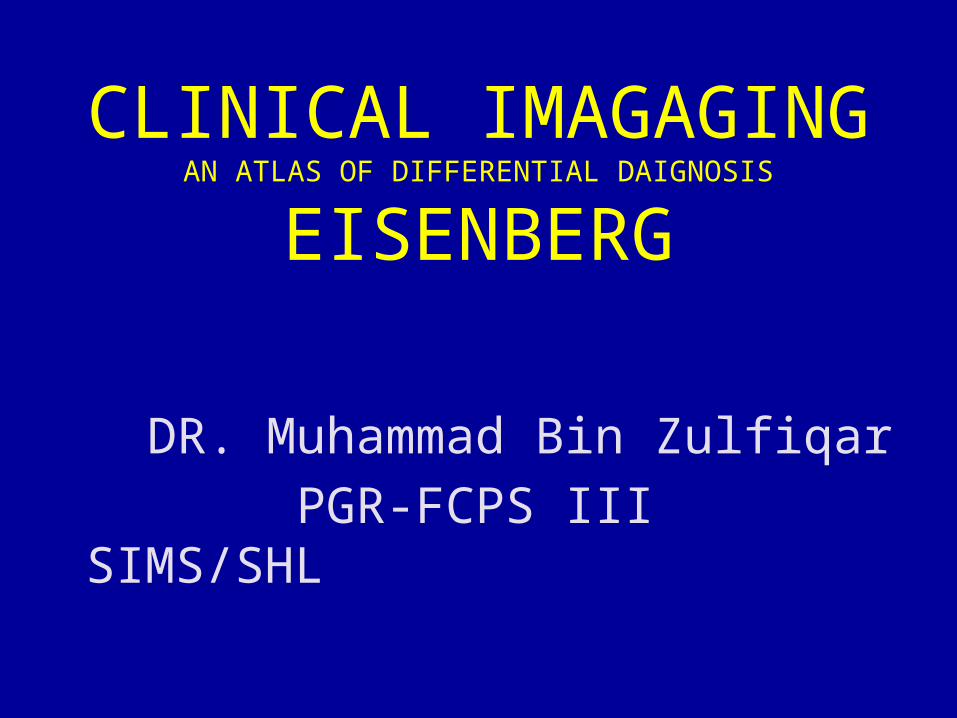
• Fig FUS 1-1 Anencephaly. Long-axis image of a 14-week fetus demonstrates a poorly developed, small head (arrows) visualized in continuity with the fetal spine (arrowhead).1
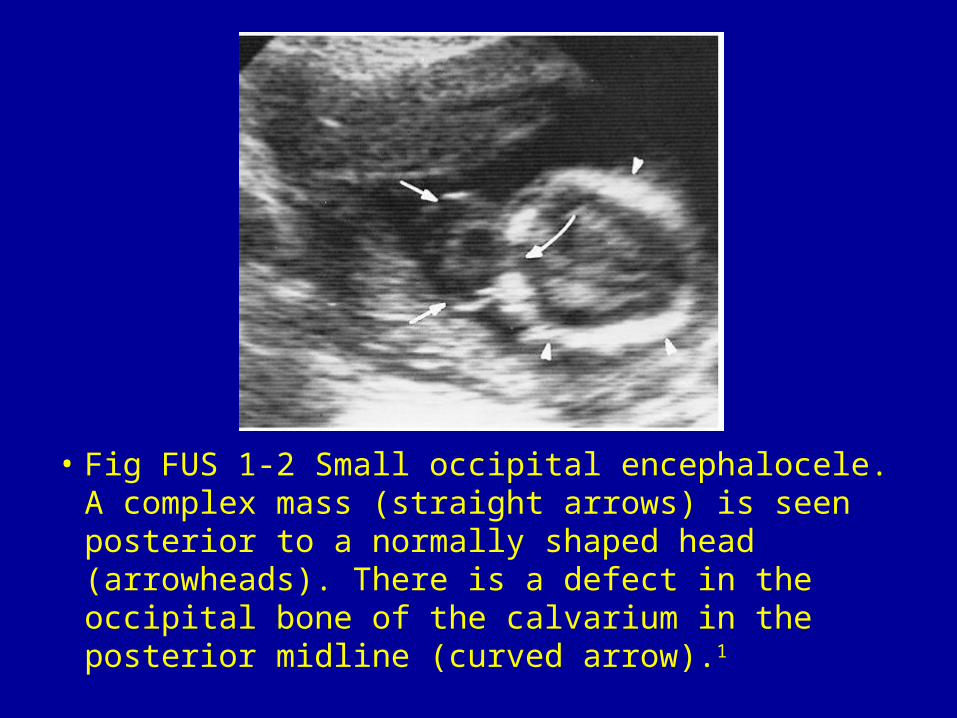
• Fig FUS 1-2 Small occipital encephalocele. A complex mass (straight arrows) is seen posterior to a normally shaped head (arrowheads). There is a defect in the occipital bone of the calvarium in the posterior midline (curved arrow).1
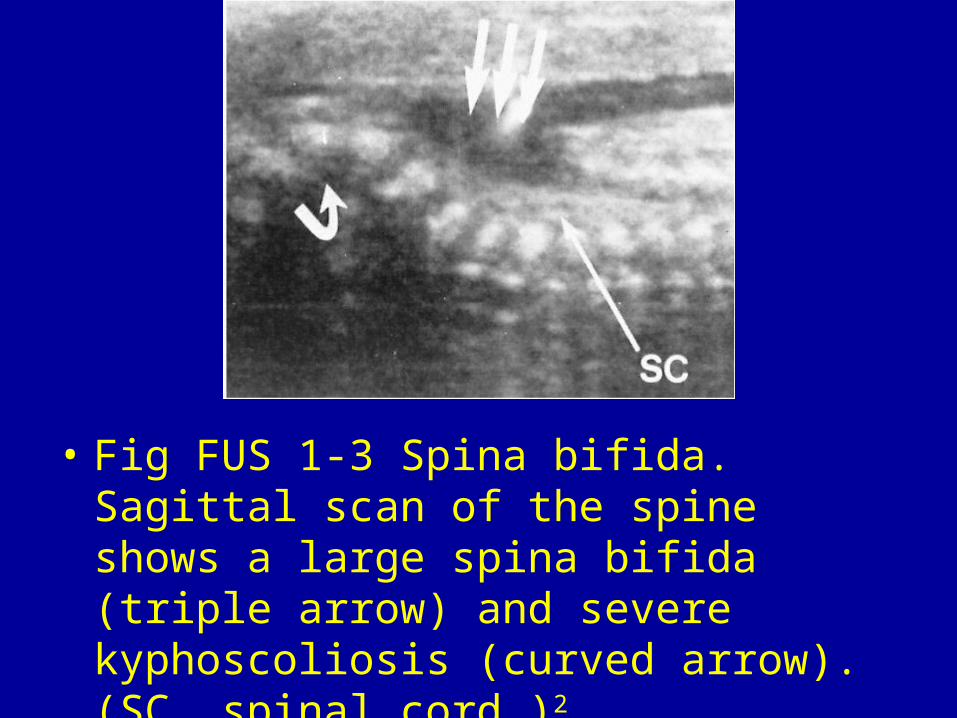
• Fig FUS 1-3 Spina bifida. Sagittal scan of the spine shows a large spina bifida (triple arrow) and severe kyphoscoliosis (curved arrow). (SC, spinal cord.)2
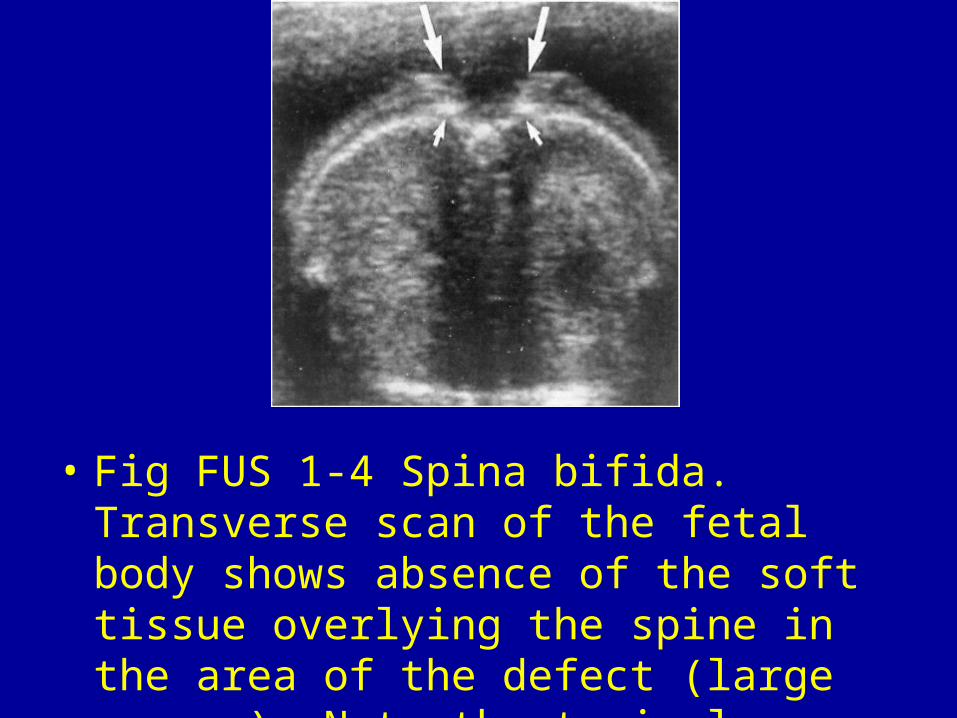
• Fig FUS 1-4 Spina bifida. Transverse scan of the fetal body shows absence of the soft tissue overlying the spine in the area of the defect (large arrows). Note the typical separation of the articular elements (small arrows).2
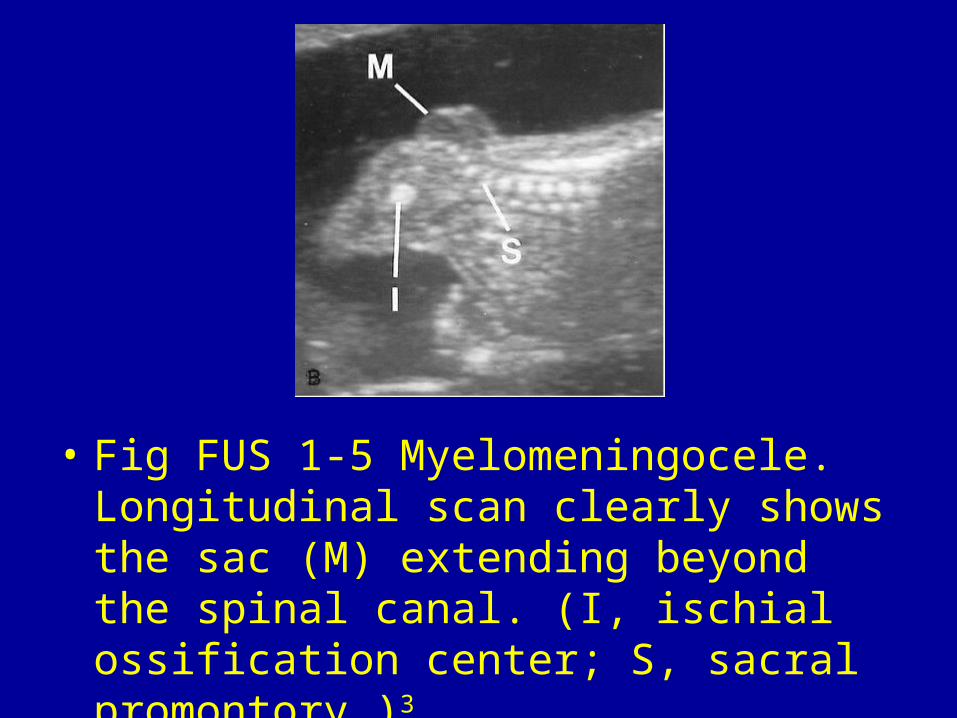
• Fig FUS 1-5 Myelomeningocele. Longitudinal scan clearly shows the sac (M) extending beyond the spinal canal. (I, ischial ossification center; S, sacral promontory.)3

• Fig FUS 1-6 Dandy-Walker malformation. Posterior fossa cyst (PC) with wide separation of the cerebellar hemispheres (arrows). (C, cavum septi pellucidi; FH, frontal horn.)3
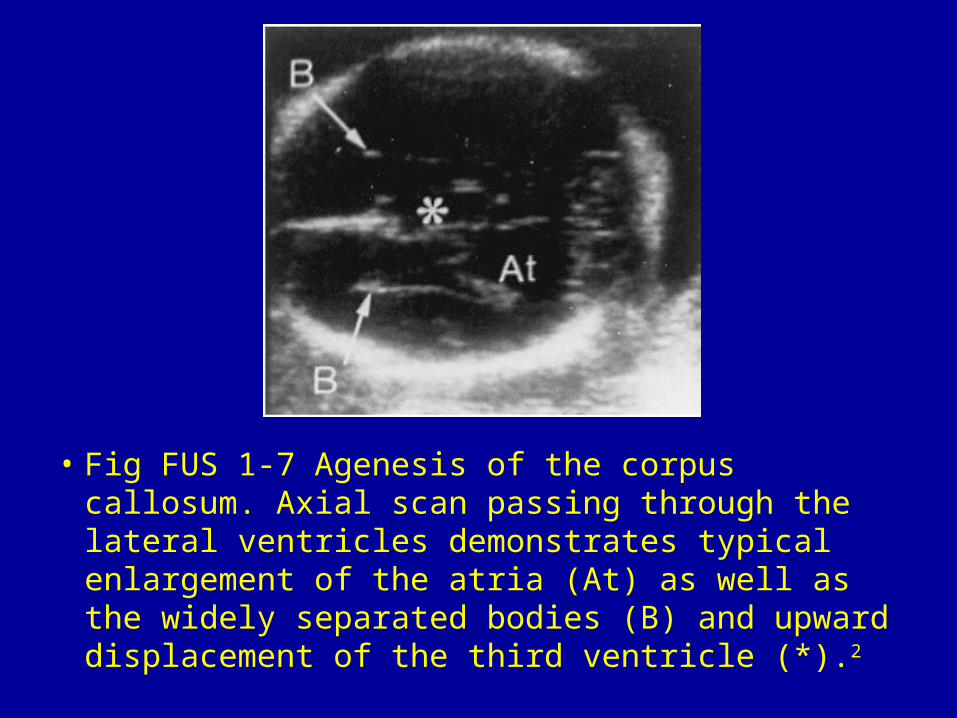
• Fig FUS 1-7 Agenesis of the corpus callosum. Axial scan passing through the lateral ventricles demonstrates typical enlargement of the atria (At) as well as the widely separated bodies (B) and upward displacement of the third ventricle (*).2
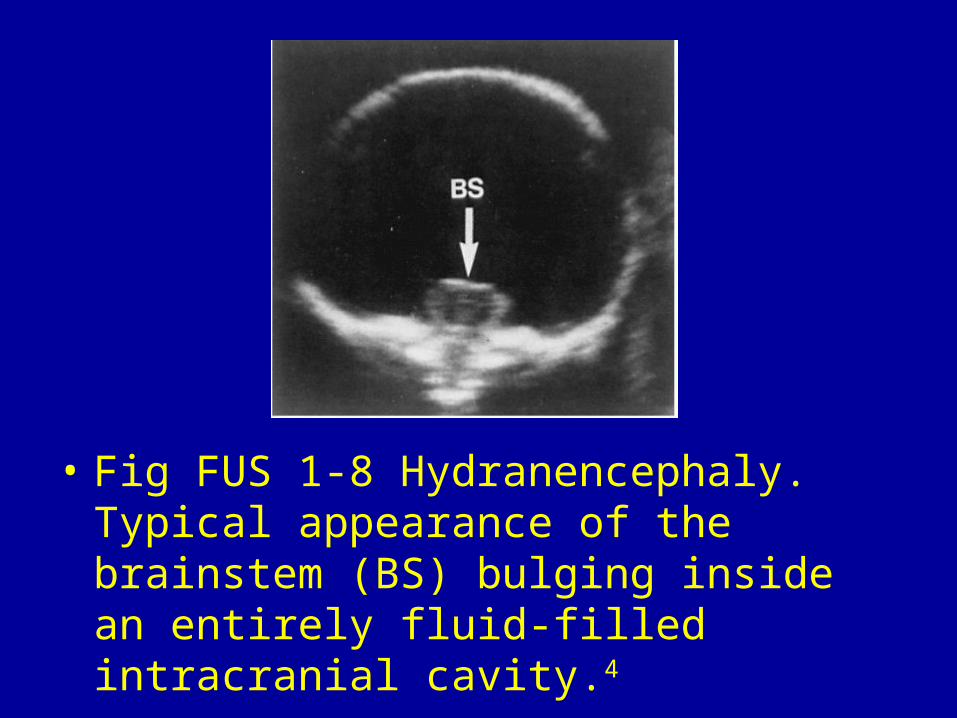
• Fig FUS 1-8 Hydranencephaly. Typical appearance of the brainstem (BS) bulging inside an entirely fluid-filled intracranial cavity.4
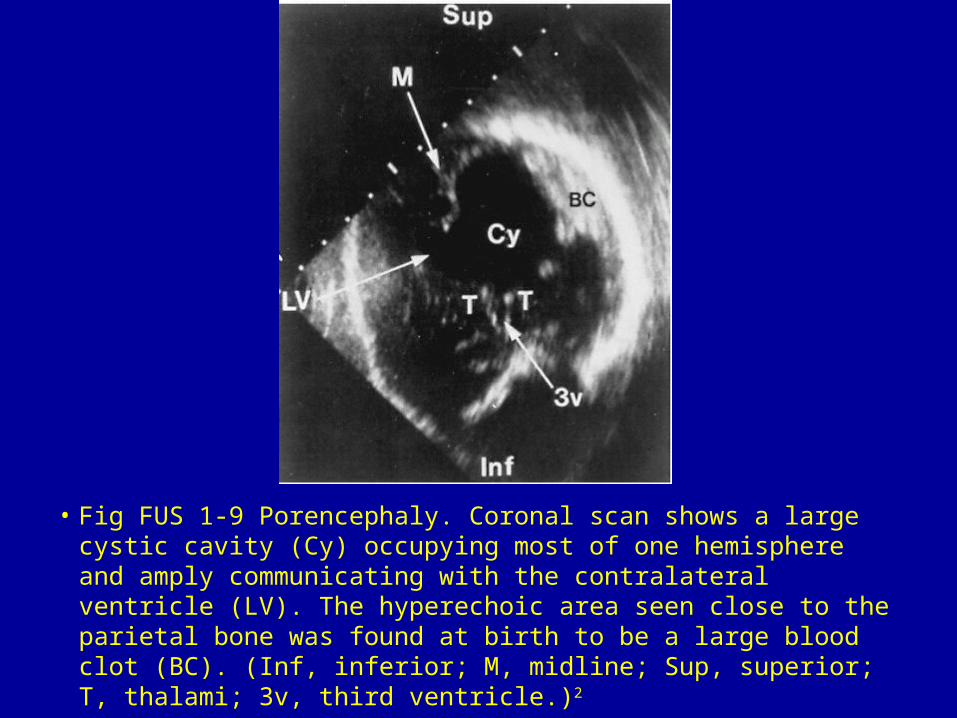
• Fig FUS 1-9 Porencephaly. Coronal scan shows a large cystic cavity (Cy) occupying most of one hemisphere and amply communicating with the contralateral ventricle (LV). The hyperechoic area seen close to the parietal bone was found at birth to be a large blood clot (BC). (Inf, inferior; M, midline; Sup, superior; T, thalami; 3v, third ventricle.)2
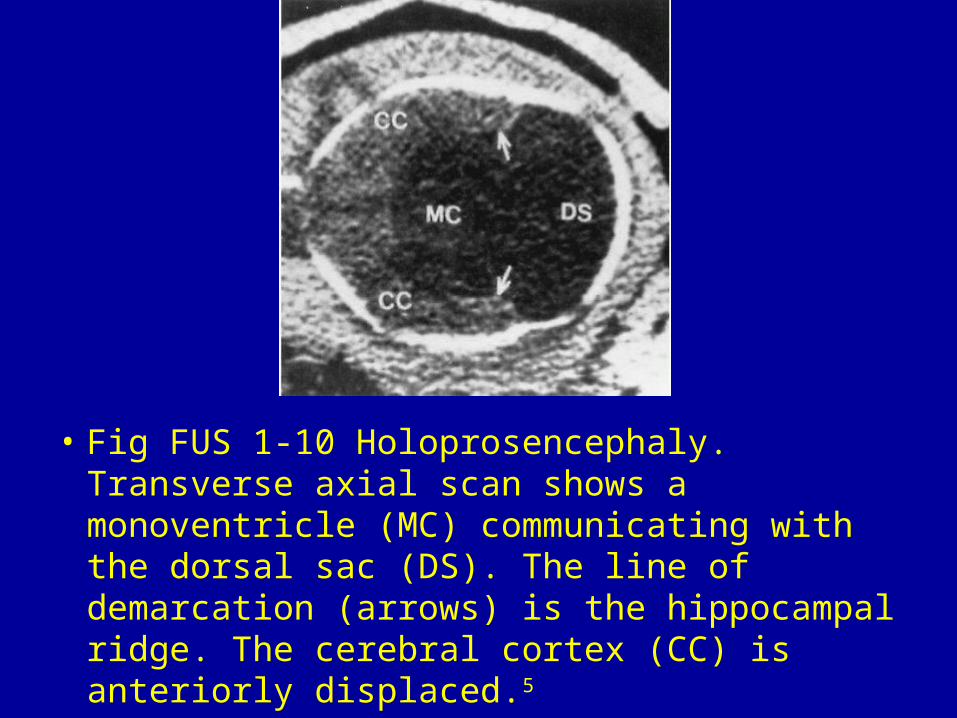
• Fig FUS 1-10 Holoprosencephaly. Transverse axial scan shows a monoventricle (MC) communicating with the dorsal sac (DS). The line of demarcation (arrows) is the hippocampal ridge. The cerebral cortex (CC) is anteriorly displaced.5
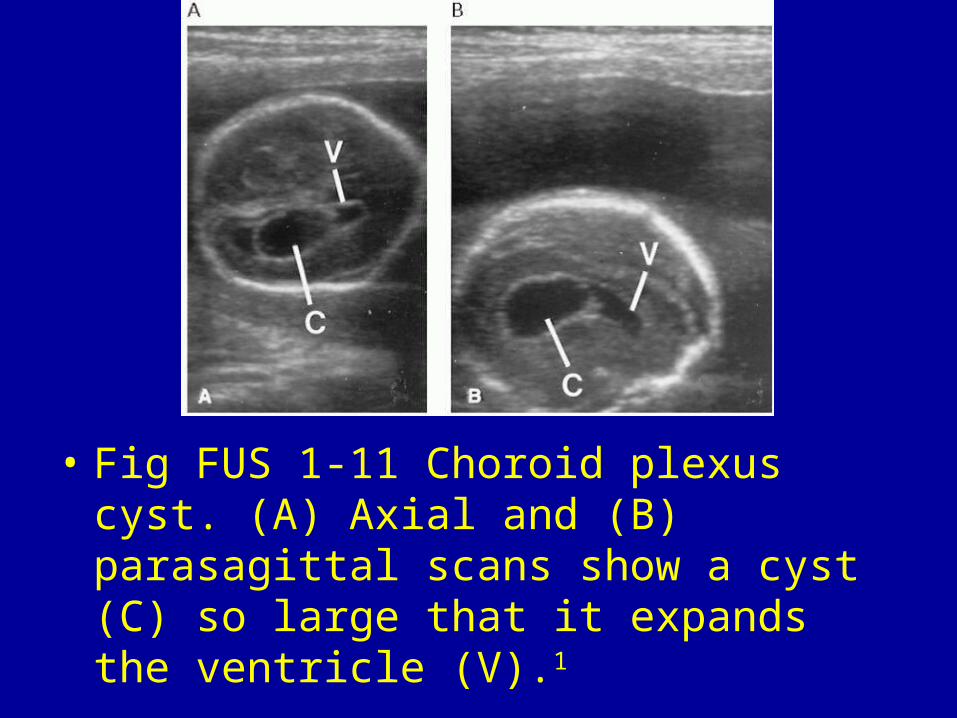
• Fig FUS 1-11 Choroid plexus cyst. (A) Axial and (B) parasagittal scans show a cyst (C) so large that it expands the ventricle (V).1
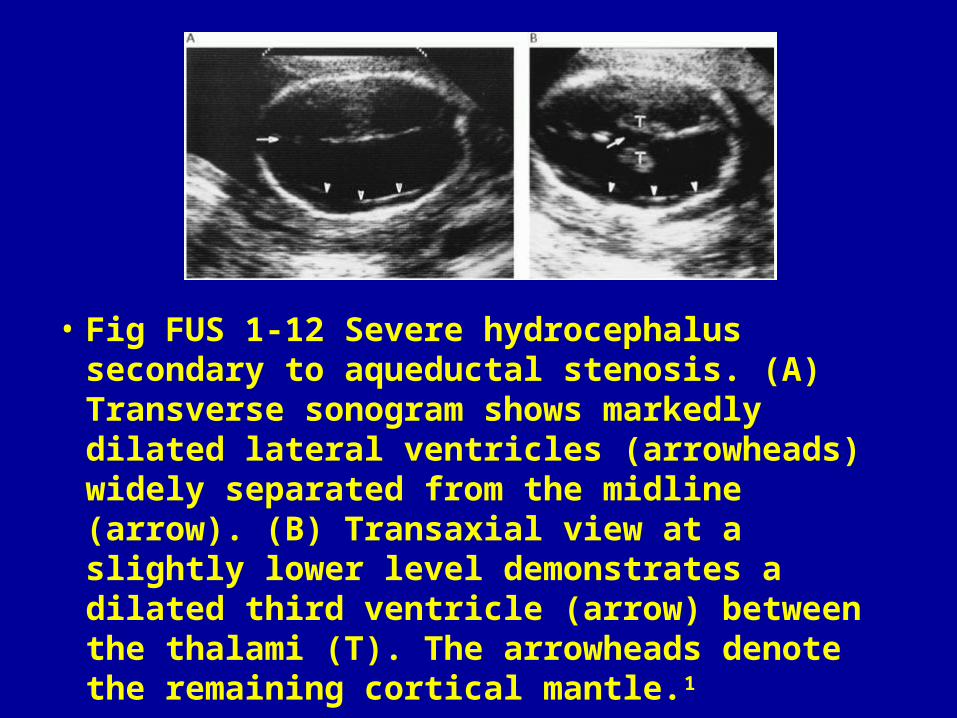
• Fig FUS 1-12 Severe hydrocephalus secondary to aqueductal stenosis. (A) Transverse sonogram shows markedly dilated lateral ventricles (arrowheads) widely separated from the midline (arrow). (B) Transaxial view at a slightly lower level demonstrates a dilated third ventricle (arrow) between the thalami (T). The arrowheads denote the remaining cortical mantle.1
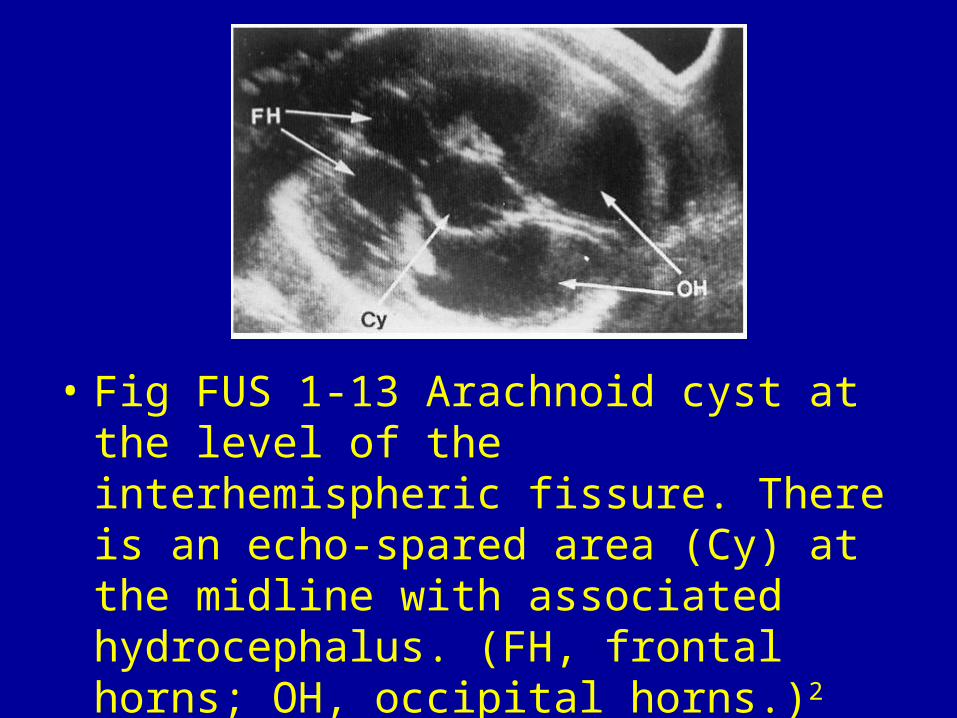
• Fig FUS 1-13 Arachnoid cyst at the level of the interhemispheric fissure. There is an echo-spared area (Cy) at the midline with associated hydrocephalus. (FH, frontal horns; OH, occipital horns.)2
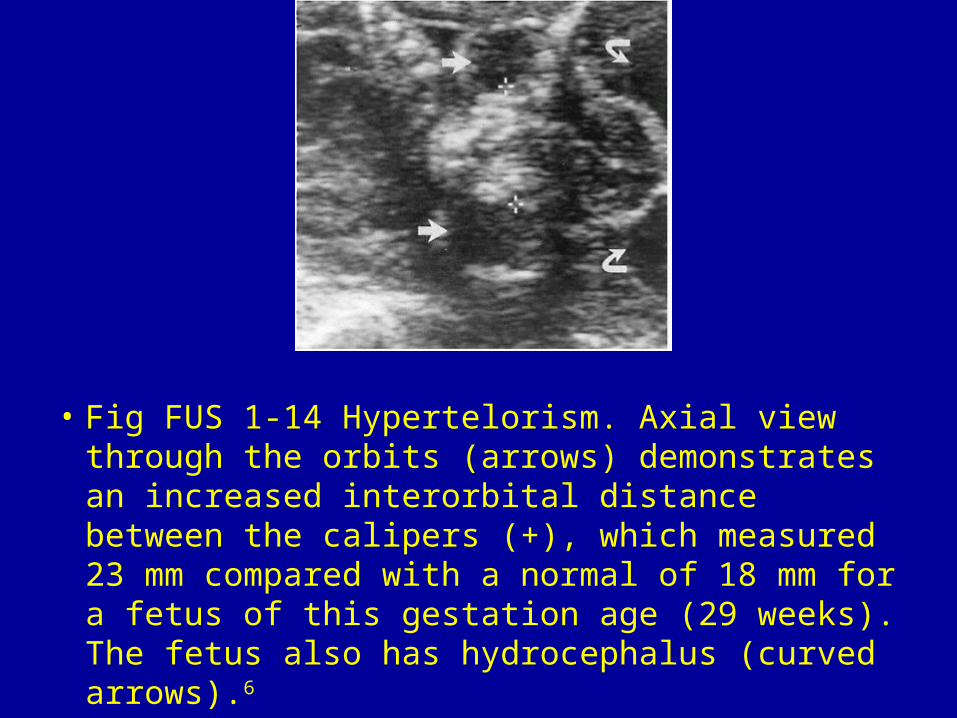
• Fig FUS 1-14 Hypertelorism. Axial view through the orbits (arrows) demonstrates an increased interorbital distance between the calipers (+), which measured 23 mm compared with a normal of 18 mm for a fetus of this gestation age (29 weeks). The fetus also has hydrocephalus (curved arrows).6
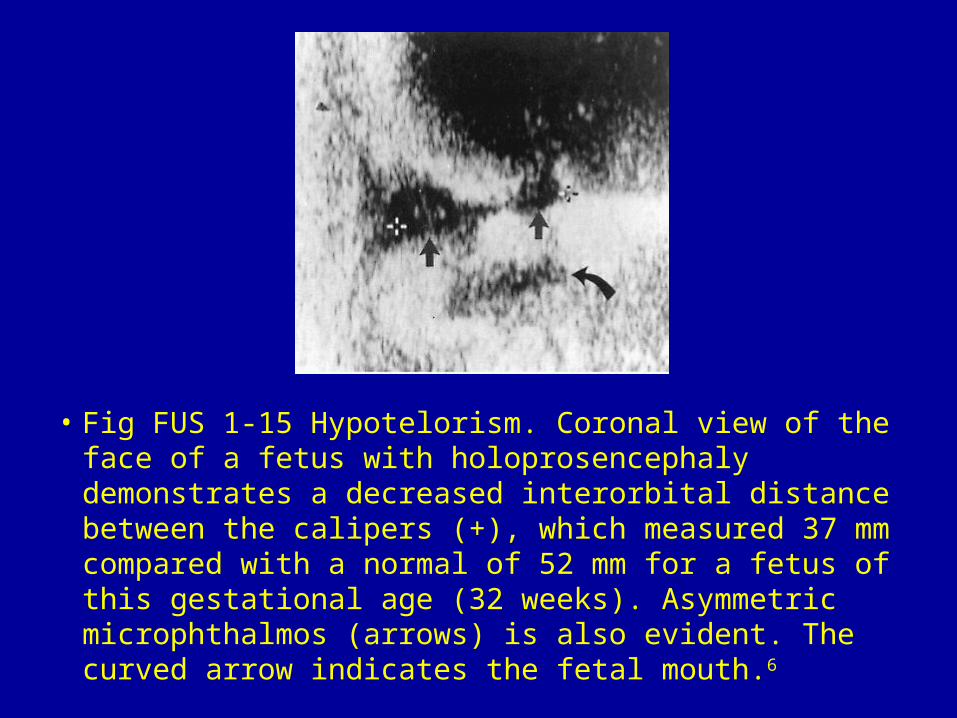
• Fig FUS 1-15 Hypotelorism. Coronal view of the face of a fetus with holoprosencephaly demonstrates a decreased interorbital distance between the calipers (+), which measured 37 mm compared with a normal of 52 mm for a fetus of this gestational age (32 weeks). Asymmetric microphthalmos (arrows) is also evident. The curved arrow indicates the fetal mouth.6
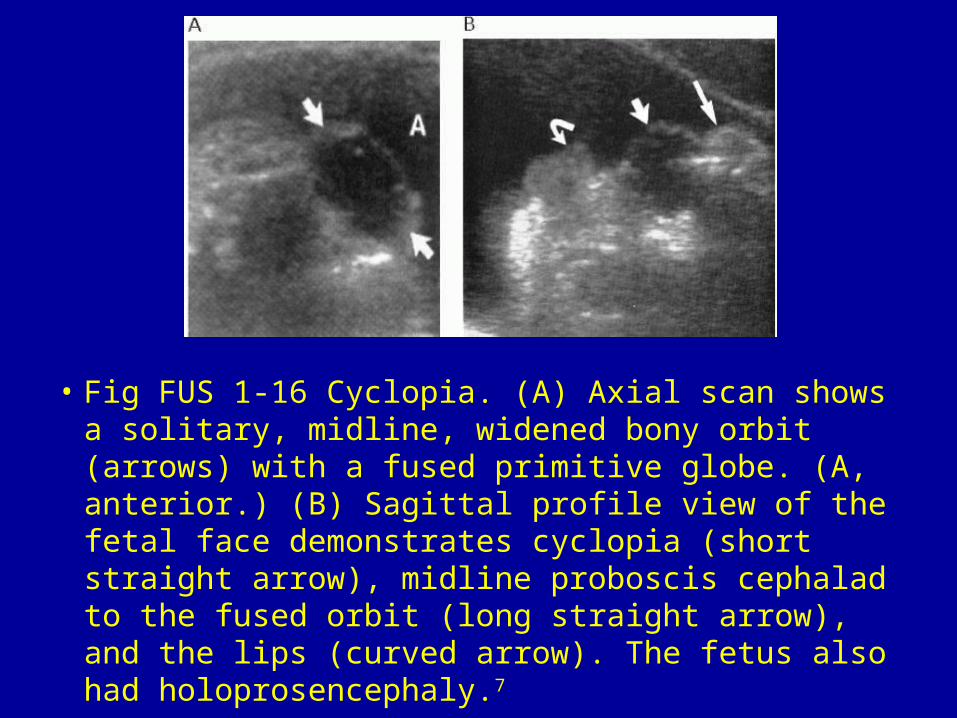
• Fig FUS 1-16 Cyclopia. (A) Axial scan shows a solitary, midline, widened bony orbit (arrows) with a fused primitive globe. (A, anterior.) (B) Sagittal profile view of the fetal face demonstrates cyclopia (short straight arrow), midline proboscis cephalad to the fused orbit (long straight arrow), and the lips (curved arrow). The fetus also had holoprosencephaly.7
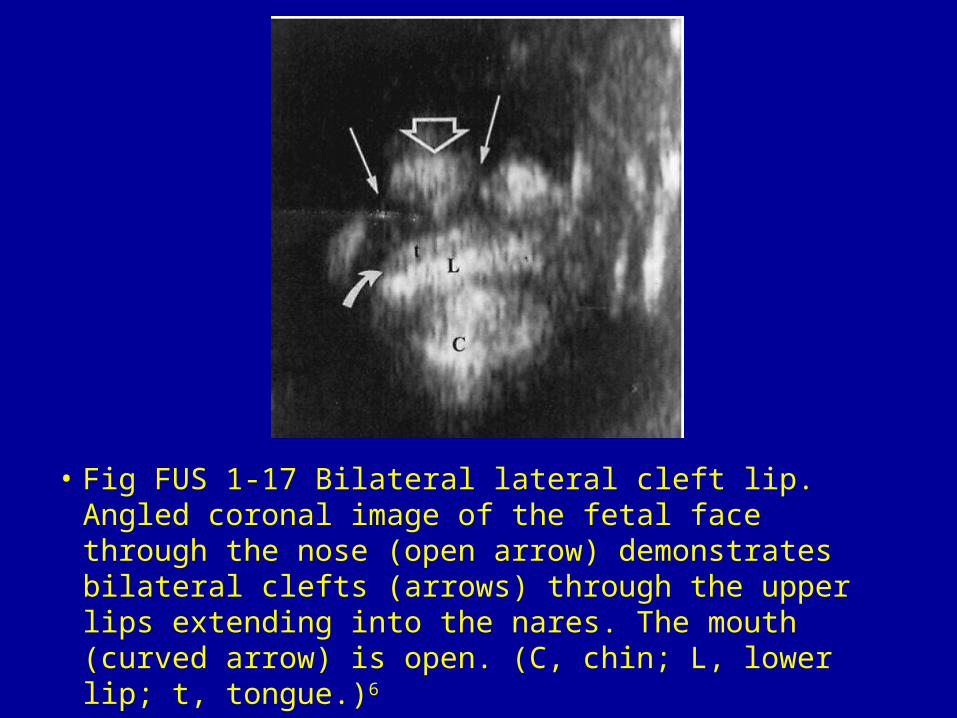
• Fig FUS 1-17 Bilateral lateral cleft lip. Angled coronal image of the fetal face through the nose (open arrow) demonstrates bilateral clefts (arrows) through the upper lips extending into the nares. The mouth (curved arrow) is open. (C, chin; L, lower lip; t, tongue.)6
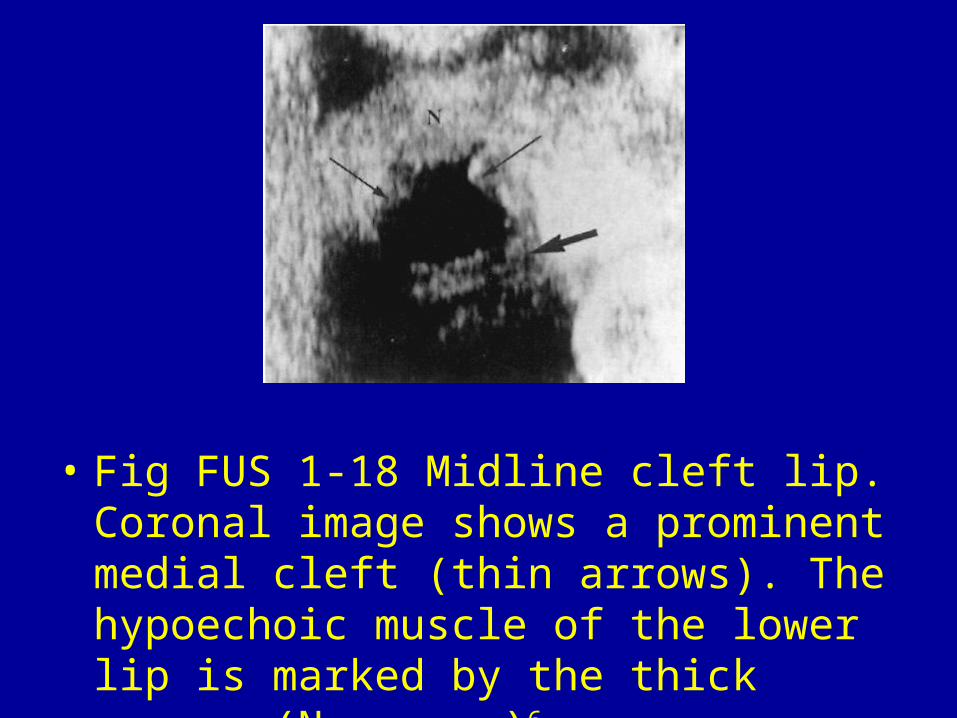
• Fig FUS 1-18 Midline cleft lip. Coronal image shows a prominent medial cleft (thin arrows). The hypoechoic muscle of the lower lip is marked by the thick arrow. (N, nose.)6
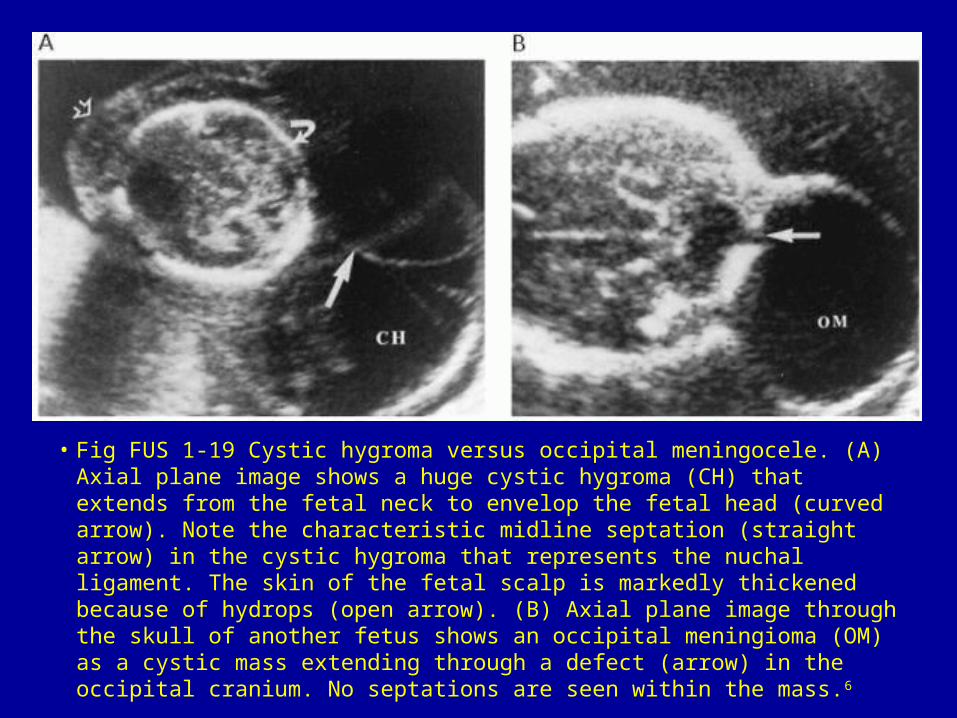
• Fig FUS 1-19 Cystic hygroma versus occipital meningocele. (A) Axial plane image shows a huge cystic hygroma (CH) that extends from the fetal neck to envelop the fetal head (curved arrow). Note the characteristic midline septation (straight arrow) in the cystic hygroma that represents the nuchal ligament. The skin of the fetal scalp is markedly thickened because of hydrops (open arrow). (B) Axial plane image through the skull of another fetus shows an occipital meningioma (OM) as a cystic mass extending through a defect (arrow) in the occipital cranium. No septations are seen within the mass.6
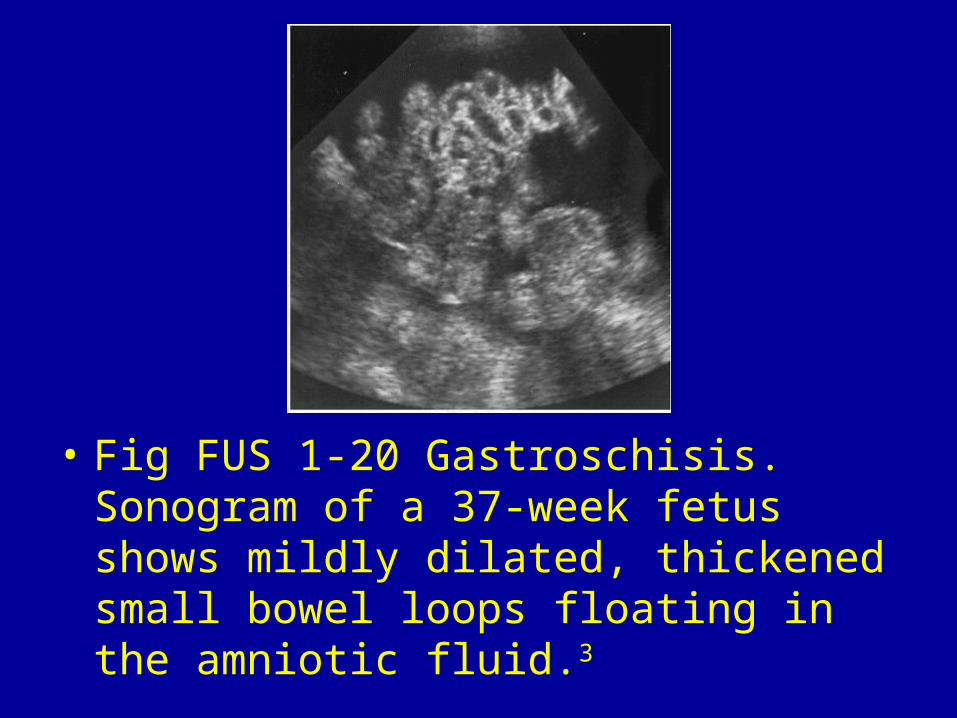
• Fig FUS 1-20 Gastroschisis. Sonogram of a 37-week fetus shows mildly dilated, thickened small bowel loops floating in the amniotic fluid.3
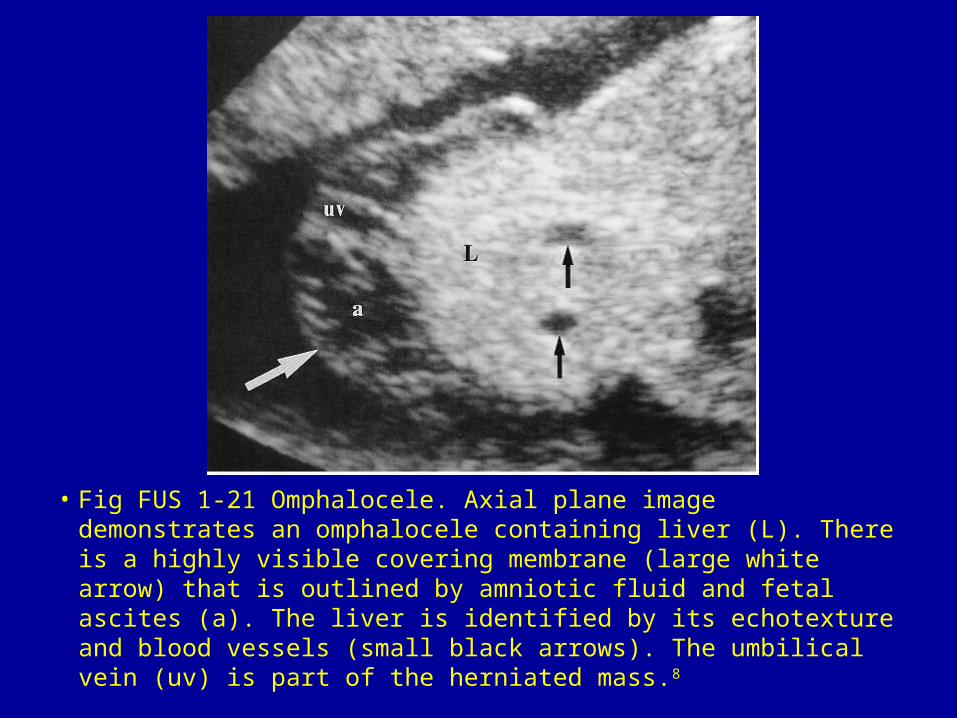
• Fig FUS 1-21 Omphalocele. Axial plane image demonstrates an omphalocele containing liver (L). There is a highly visible covering membrane (large white arrow) that is outlined by amniotic fluid and fetal ascites (a). The liver is identified by its echotexture and blood vessels (small black arrows). The umbilical vein (uv) is part of the herniated mass.8
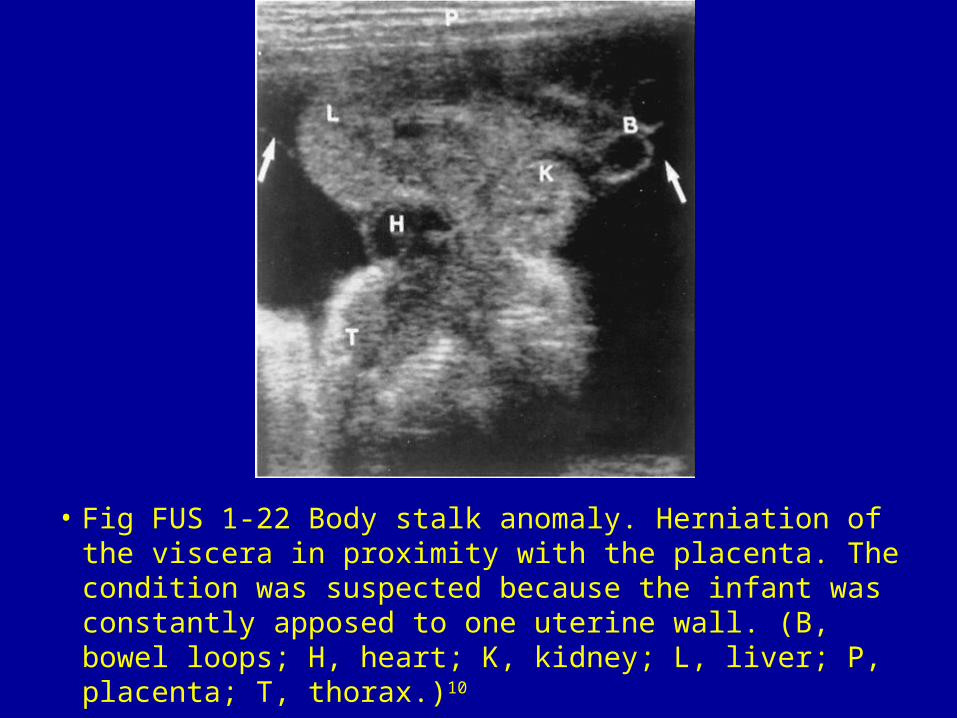
• Fig FUS 1-22 Body stalk anomaly. Herniation of the viscera in proximity with the placenta. The condition was suspected because the infant was constantly apposed to one uterine wall. (B, bowel loops; H, heart; K, kidney; L, liver; P, placenta; T, thorax.)10
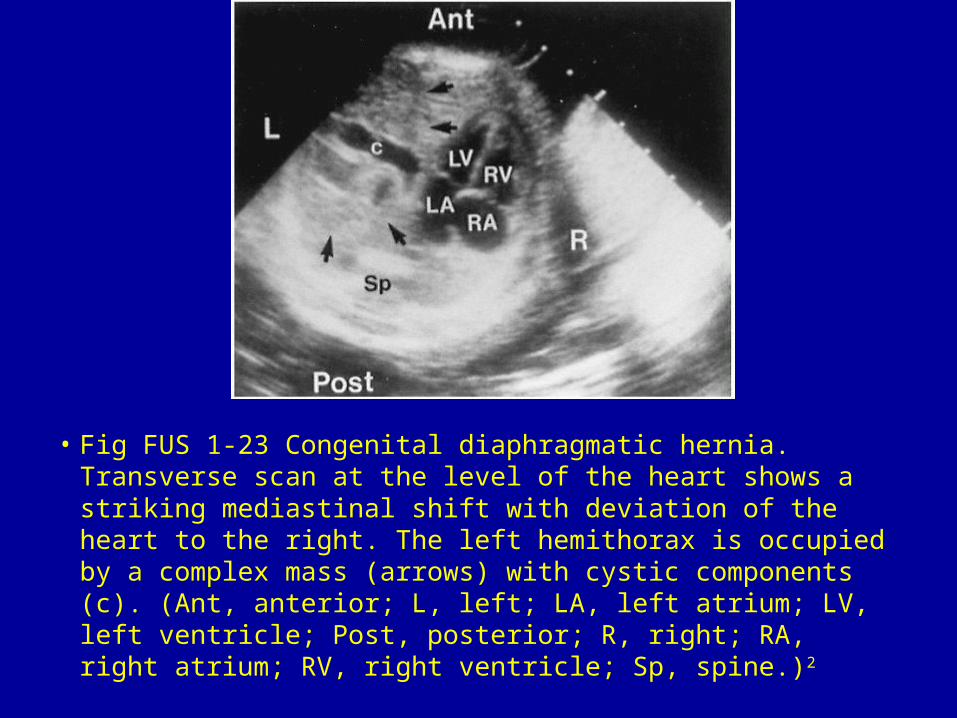
• Fig FUS 1-23 Congenital diaphragmatic hernia. Transverse scan at the level of the heart shows a striking mediastinal shift with deviation of the heart to the right. The left hemithorax is occupied by a complex mass (arrows) with cystic components (c). (Ant, anterior; L, left; LA, left atrium; LV, left ventricle; Post, posterior; R, right; RA, right atrium; RV, right ventricle; Sp, spine.)2
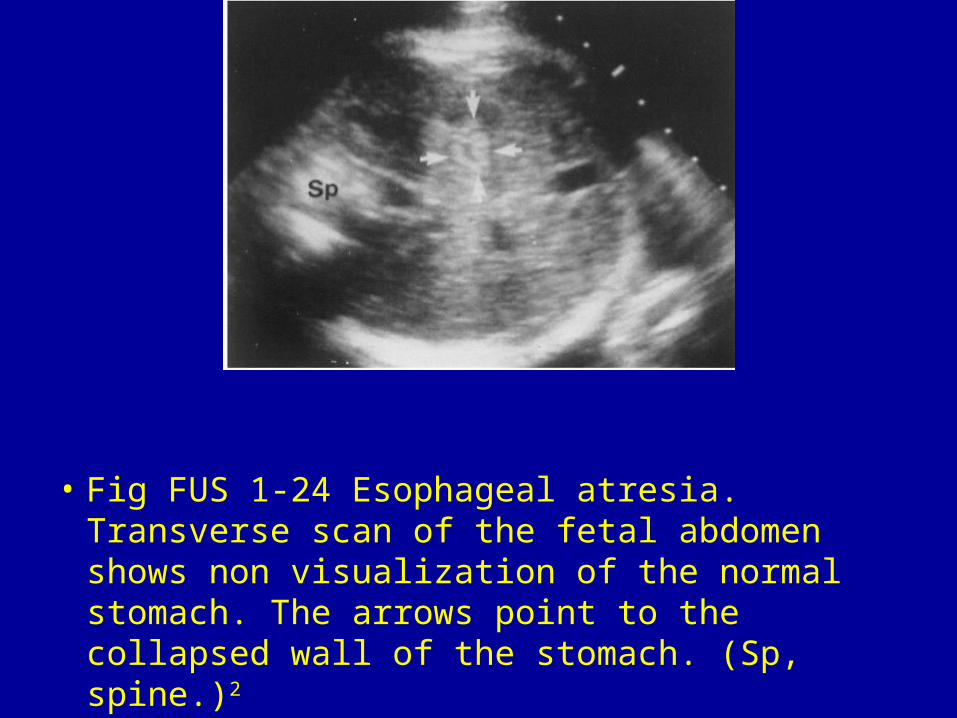
• Fig FUS 1-24 Esophageal atresia. Transverse scan of the fetal abdomen shows non visualization of the normal stomach. The arrows point to the collapsed wall of the stomach. (Sp, spine.)2
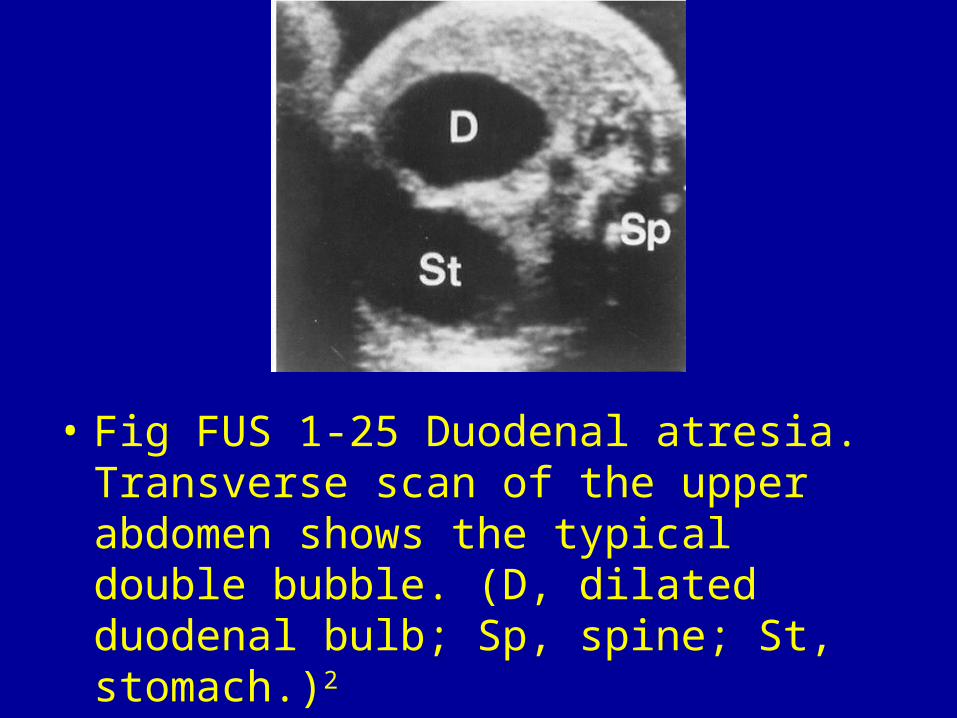
• Fig FUS 1-25 Duodenal atresia. Transverse scan of the upper abdomen shows the typical double bubble. (D, dilated duodenal bulb; Sp, spine; St, stomach.)2
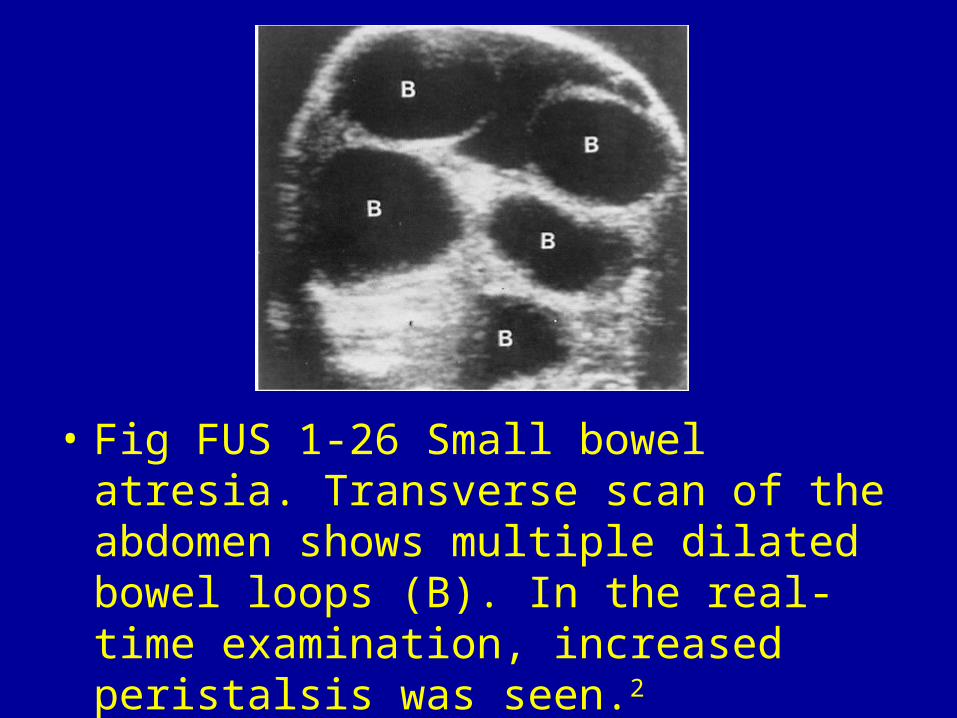
• Fig FUS 1-26 Small bowel atresia. Transverse scan of the abdomen shows multiple dilated bowel loops (B). In the real-time examination, increased peristalsis was seen.2

• Fig FUS 1-27 Meconium peritonitis. Transverse scan shows multiple intra-abdominal calcifications (curved arrows). The largest calcification casts an acoustic shadow (small arrows). (Sp, spine.)2
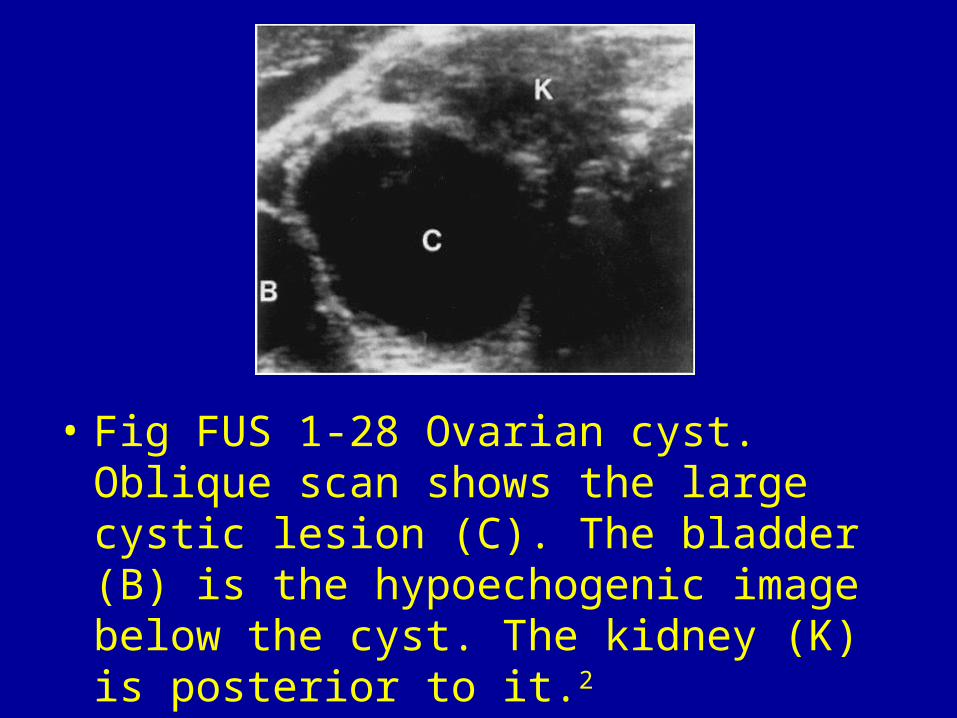
• Fig FUS 1-28 Ovarian cyst. Oblique scan shows the large cystic lesion (C). The bladder (B) is the hypoechogenic image below the cyst. The kidney (K) is posterior to it.2
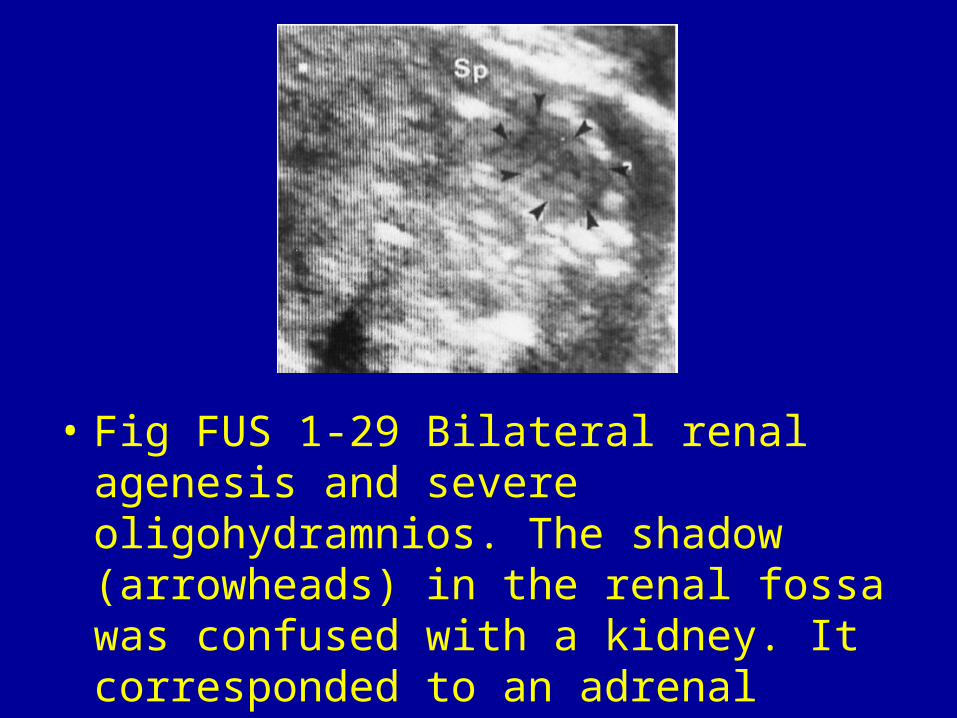
• Fig FUS 1-29 Bilateral renal agenesis and severe oligohydramnios. The shadow (arrowheads) in the renal fossa was confused with a kidney. It corresponded to an adrenal gland. (Sp, spine.)2
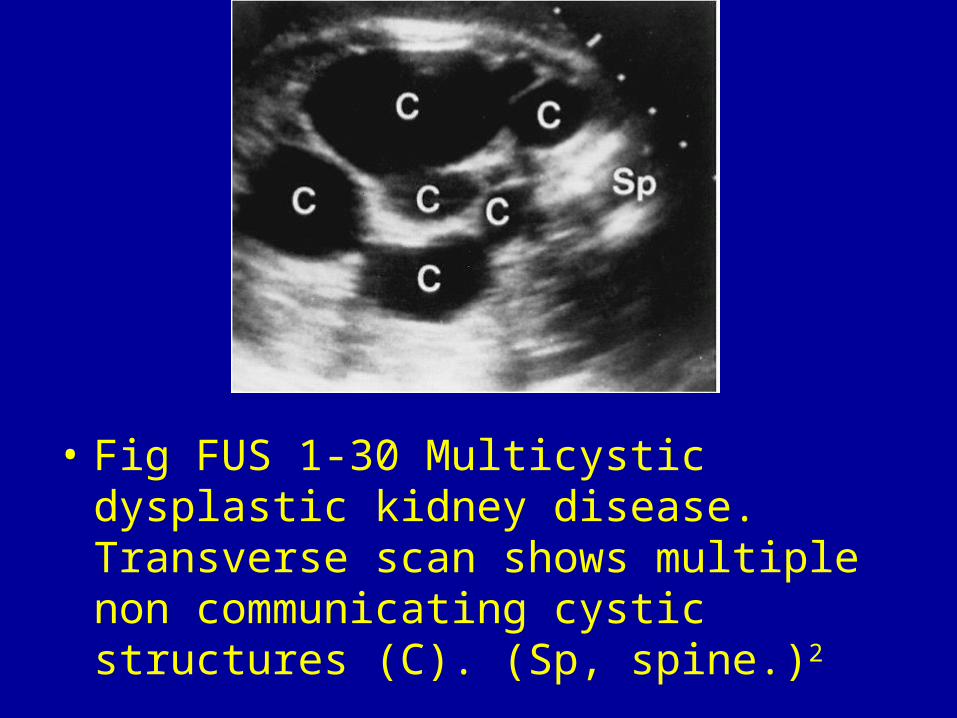
• Fig FUS 1-30 Multicystic dysplastic kidney disease. Transverse scan shows multiple non communicating cystic structures (C). (Sp, spine.)2
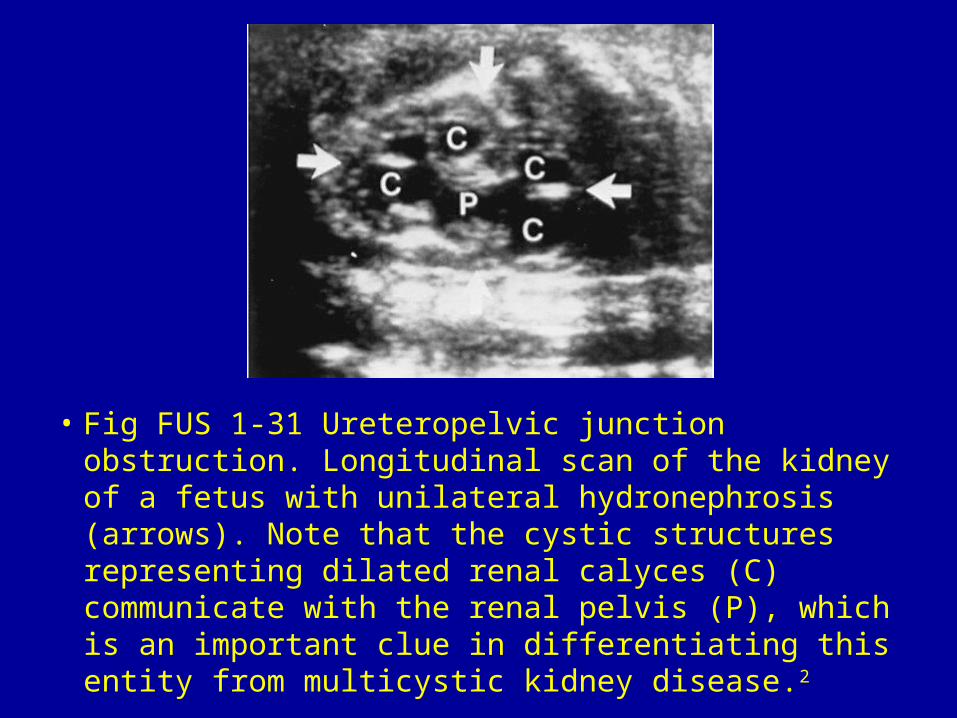
• Fig FUS 1-31 Ureteropelvic junction obstruction. Longitudinal scan of the kidney of a fetus with unilateral hydronephrosis (arrows). Note that the cystic structures representing dilated renal calyces (C) communicate with the renal pelvis (P), which is an important clue in differentiating this entity from multicystic kidney disease.2

• Fig FUS 1-32 Megaureter. Coronal scan shows the hydroureter (HU) associated with dilatation of the renal pelvis (P) and calyces (C).2
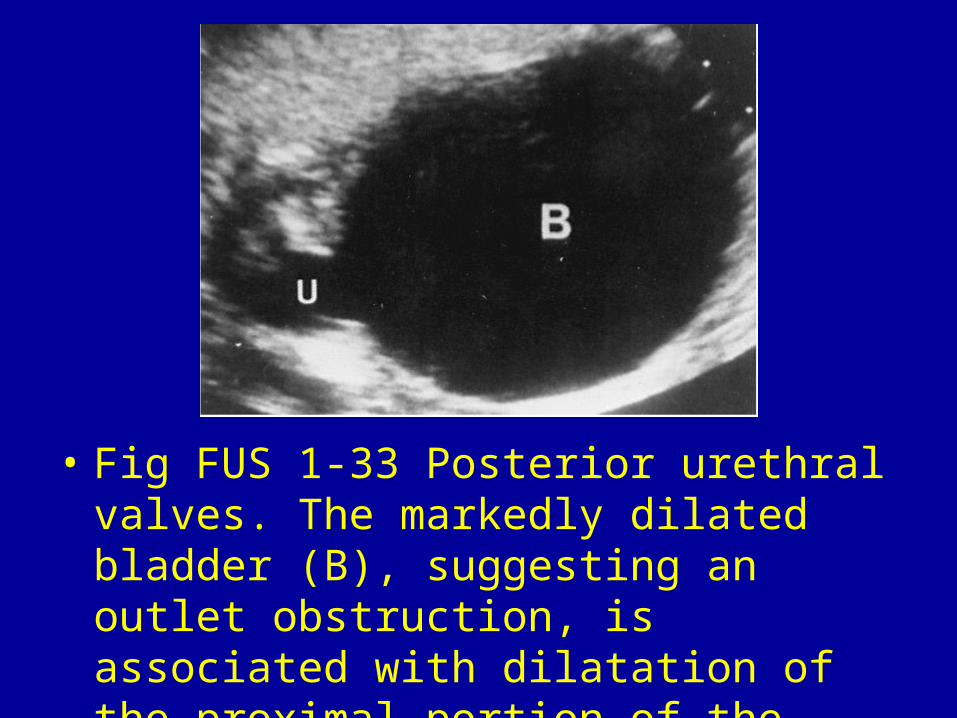
• Fig FUS 1-33 Posterior urethral valves. The markedly dilated bladder (B), suggesting an outlet obstruction, is associated with dilatation of the proximal portion of the urethra (U).2
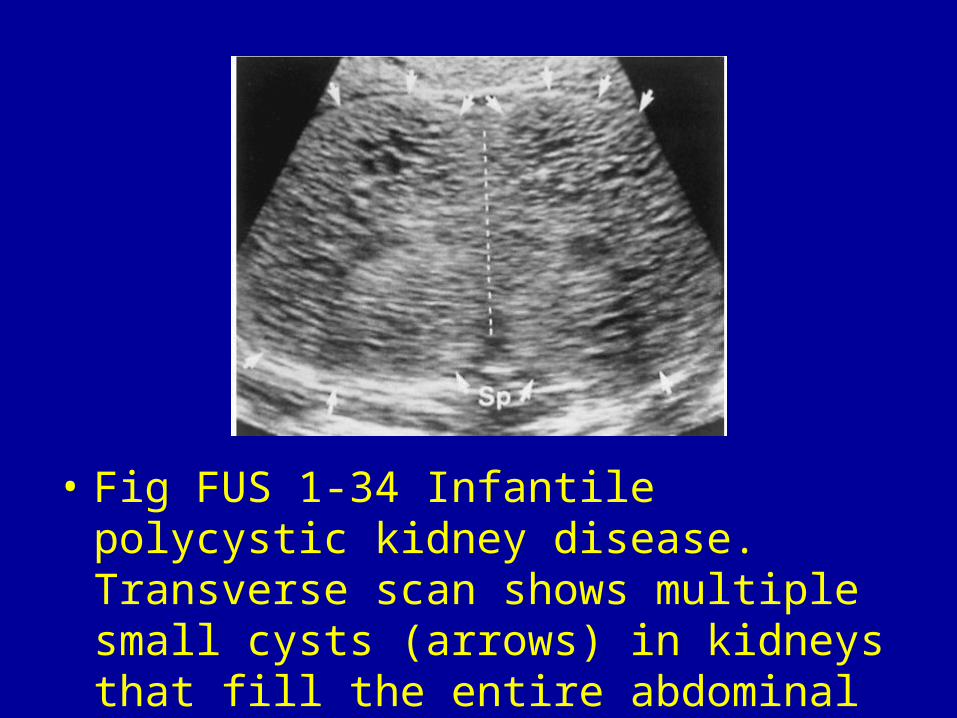
• Fig FUS 1-34 Infantile polycystic kidney disease. Transverse scan shows multiple small cysts (arrows) in kidneys that fill the entire abdominal cavity. (Sp, spine.)2
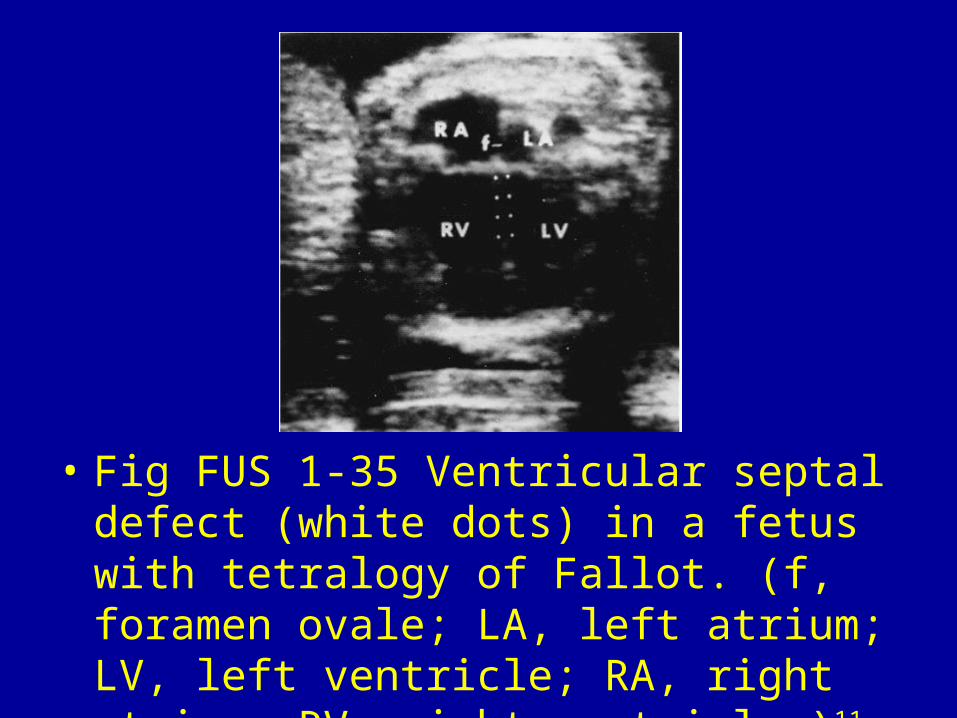
• Fig FUS 1-35 Ventricular septal defect (white dots) in a fetus with tetralogy of Fallot. (f, foramen ovale; LA, left atrium; LV, left ventricle; RA, right atrium; RV, right ventricle.)11