Embed Size (px)
Citation preview

Copyright © 2008, 1997, 1984, 1973, 1963, 1950, 1941, 1934 by The McGraw-Hill Companies, Inc. All rights reserved. Manufactured in the UnitedStates of America. Except as permitted under the United States Copyright Act of 1976, no part of this publication may be reproduced or distributedin any form or by any means, or stored in a database or retrieval system, without the prior written permission of the publisher.
0-07-154224-8
The material in this eBook also appears in the print version of this title: 0-07-151140-7.
All trademarks are trademarks of their respective owners. Rather than put a trademark symbol after every occurrence of a trademarked name, we usenames in an editorial fashion only, and to the benefit of the trademark owner, with no intention of infringement of the trademark. Where such designations appear in this book, they have been printed with initial caps.
McGraw-Hill eBooks are available at special quantity discounts to use as premiums and sales promotions, or for use in corporate training programs.For more information, please contact George Hoare, Special Sales, at [email protected] or (212) 904-4069.
TERMS OF USE
This is a copyrighted work and The McGraw-Hill Companies, Inc. (“McGraw-Hill”) and its licensors reserve all rights in and to the work. Use of thiswork is subject to these terms. Except as permitted under the Copyright Act of 1976 and the right to store and retrieve one copy of the work, you maynot decompile, disassemble, reverse engineer, reproduce, modify, create derivative works based upon, transmit, distribute, disseminate, sell, publishor sublicense the work or any part of it without McGraw-Hill’s prior consent. You may use the work for your own noncommercial and personal use;any other use of the work is strictly prohibited. Your right to use the work may be terminated if you fail to comply with these terms.
THE WORK IS PROVIDED “AS IS.” McGRAW-HILL AND ITS LICENSORS MAKE NO GUARANTEES OR WARRANTIES AS TO THEACCURACY, ADEQUACY OR COMPLETENESS OF OR RESULTS TO BE OBTAINED FROM USING THE WORK, INCLUDING ANYINFORMATION THAT CAN BE ACCESSED THROUGH THE WORK VIA HYPERLINK OR OTHERWISE, AND EXPRESSLY DISCLAIMANY WARRANTY, EXPRESS OR IMPLIED, INCLUDING BUT NOT LIMITED TO IMPLIED WARRANTIES OF MERCHANTABILITY ORFITNESS FOR A PARTICULAR PURPOSE. McGraw-Hill and its licensors do not warrant or guarantee that the functions contained in the work willmeet your requirements or that its operation will be uninterrupted or error free. Neither McGraw-Hill nor its licensors shall be liable to you or anyone else for any inaccuracy, error or omission, regardless of cause, in the work or for any damages resulting therefrom. McGraw-Hill has noresponsibility for the content of any information accessed through the work. Under no circumstances shall McGraw-Hill and/or its licensors be liablefor any indirect, incidental, special, punitive, consequential or similar damages that result from the use of or inability to use the work, even if any ofthem has been advised of the possibility of such damages. This limitation of liability shall apply to any claim or cause whatsoever whether such claimor cause arises in contract, tort or otherwise.
DOI: 10.1036/0071511407

This page intentionally left blank
FLUIDIZED-BED SYSTEMSGas-Solid Systems. . . . . . . . . . . . . . . . . . . . . . . . . . . . . . . . . . . . . . . . . . . 17-2
Types of Solids . . . . . . . . . . . . . . . . . . . . . . . . . . . . . . . . . . . . . . . . . . . 17-2Two-Phase Theory of Fluidization . . . . . . . . . . . . . . . . . . . . . . . . . . . . 17-2Phase Diagram (Zenz and Othmer). . . . . . . . . . . . . . . . . . . . . . . . . . . 17-3Phase Diagram (Grace) . . . . . . . . . . . . . . . . . . . . . . . . . . . . . . . . . . . . 17-3Regime Diagram (Grace) . . . . . . . . . . . . . . . . . . . . . . . . . . . . . . . . . . . 17-3Solids Concentration versus Height. . . . . . . . . . . . . . . . . . . . . . . . . . . 17-5Equipment Types . . . . . . . . . . . . . . . . . . . . . . . . . . . . . . . . . . . . . . . . . 17-5Minimum Fluidizing Velocity. . . . . . . . . . . . . . . . . . . . . . . . . . . . . . . . 17-5Particulate Fluidization . . . . . . . . . . . . . . . . . . . . . . . . . . . . . . . . . . . . 17-6Vibrofluidization . . . . . . . . . . . . . . . . . . . . . . . . . . . . . . . . . . . . . . . . . . 17-6
Design of Fluidized-Bed Systems . . . . . . . . . . . . . . . . . . . . . . . . . . . . . . 17-6Fluidization Vessel . . . . . . . . . . . . . . . . . . . . . . . . . . . . . . . . . . . . . . . . 17-6Scale-up. . . . . . . . . . . . . . . . . . . . . . . . . . . . . . . . . . . . . . . . . . . . . . . . . 17-9Heat Transfer . . . . . . . . . . . . . . . . . . . . . . . . . . . . . . . . . . . . . . . . . . . . 17-11Temperature Control . . . . . . . . . . . . . . . . . . . . . . . . . . . . . . . . . . . . . . 17-12Solids Mixing. . . . . . . . . . . . . . . . . . . . . . . . . . . . . . . . . . . . . . . . . . . . . 17-12Gas Mixing . . . . . . . . . . . . . . . . . . . . . . . . . . . . . . . . . . . . . . . . . . . . . . 17-12Size Enlargement . . . . . . . . . . . . . . . . . . . . . . . . . . . . . . . . . . . . . . . . . 17-12Size Reduction . . . . . . . . . . . . . . . . . . . . . . . . . . . . . . . . . . . . . . . . . . . 17-12Standpipes, Solids Feeders, and Solids Flow Control. . . . . . . . . . . . . 17-12Solids Discharge . . . . . . . . . . . . . . . . . . . . . . . . . . . . . . . . . . . . . . . . . . 17-13Dust Separation . . . . . . . . . . . . . . . . . . . . . . . . . . . . . . . . . . . . . . . . . . 17-14Example 1: Length of Seal Leg . . . . . . . . . . . . . . . . . . . . . . . . . . . . . . 17-15Instrumentation . . . . . . . . . . . . . . . . . . . . . . . . . . . . . . . . . . . . . . . . . . 17-15
Uses of Fluidized Beds. . . . . . . . . . . . . . . . . . . . . . . . . . . . . . . . . . . . . . . 17-16Chemical Reactions . . . . . . . . . . . . . . . . . . . . . . . . . . . . . . . . . . . . . . . 17-16Physical Contacting. . . . . . . . . . . . . . . . . . . . . . . . . . . . . . . . . . . . . . . . 17-20
GAS-SOLIDS SEPARATIONSNomenclature . . . . . . . . . . . . . . . . . . . . . . . . . . . . . . . . . . . . . . . . . . . . . . 17-21Purpose of Dust Collection . . . . . . . . . . . . . . . . . . . . . . . . . . . . . . . . . . . 17-24Properties of Particle Dispersoids . . . . . . . . . . . . . . . . . . . . . . . . . . . . . . 17-24Particle Measurements . . . . . . . . . . . . . . . . . . . . . . . . . . . . . . . . . . . . . . . 17-24
Atmospheric-Pollution Measurements . . . . . . . . . . . . . . . . . . . . . . . . 17-24Process-Gas Sampling . . . . . . . . . . . . . . . . . . . . . . . . . . . . . . . . . . . . . 17-24Particle-Size Analysis . . . . . . . . . . . . . . . . . . . . . . . . . . . . . . . . . . . . . . 17-24
Mechanisms of Dust Collection. . . . . . . . . . . . . . . . . . . . . . . . . . . . . . . . 17-26Performance of Dust Collectors . . . . . . . . . . . . . . . . . . . . . . . . . . . . . . . 17-27Dust-Collector Design . . . . . . . . . . . . . . . . . . . . . . . . . . . . . . . . . . . . . . . 17-27Dust-Collection Equipment. . . . . . . . . . . . . . . . . . . . . . . . . . . . . . . . . . . 17-28
Gravity Settling Chambers . . . . . . . . . . . . . . . . . . . . . . . . . . . . . . . . . . 17-28Impingement Separators . . . . . . . . . . . . . . . . . . . . . . . . . . . . . . . . . . . 17-28Cyclone Separators . . . . . . . . . . . . . . . . . . . . . . . . . . . . . . . . . . . . . . . . 17-28Mechanical Centrifugal Separators . . . . . . . . . . . . . . . . . . . . . . . . . . . 17-36Particulate Scrubbers . . . . . . . . . . . . . . . . . . . . . . . . . . . . . . . . . . . . . . 17-36Dry Scrubbing. . . . . . . . . . . . . . . . . . . . . . . . . . . . . . . . . . . . . . . . . . . . 17-43Fabric Filters . . . . . . . . . . . . . . . . . . . . . . . . . . . . . . . . . . . . . . . . . . . . 17-46Granular-Bed Filters. . . . . . . . . . . . . . . . . . . . . . . . . . . . . . . . . . . . . . . 17-51Air Filters . . . . . . . . . . . . . . . . . . . . . . . . . . . . . . . . . . . . . . . . . . . . . . . 17-52Electrical Precipitators . . . . . . . . . . . . . . . . . . . . . . . . . . . . . . . . . . . . . 17-55
17-1
Section 17
Gas-Solid Operations and Equipment
Mel Pell, Ph.D. President, ESD Consulting Services; Fellow, American Institute of ChemicalEngineers; Registered Professional Engineer (Delaware) (Section Editor, Fluidized-Bed Systems)
James B. Dunson, M.S. Principal Division Consultant (retired), E. I. duPont de Nemours& Co.; Member, American Institute of Chemical Engineers; Registered Professional Engineer(Delaware) (Gas-Solids Separations)
Ted M. Knowlton, Ph.D. Technical Director, Particulate Solid Research, Inc.; Member,American Institute of Chemical Engineers (Fluidized-Bed Systems)
Copyright © 2008, 1997, 1984, 1973, 1963, 1950, 1941, 1934 by The McGraw-Hill Companies, Inc. Click here for terms of use.
FLUIDIZED-BED SYSTEMS
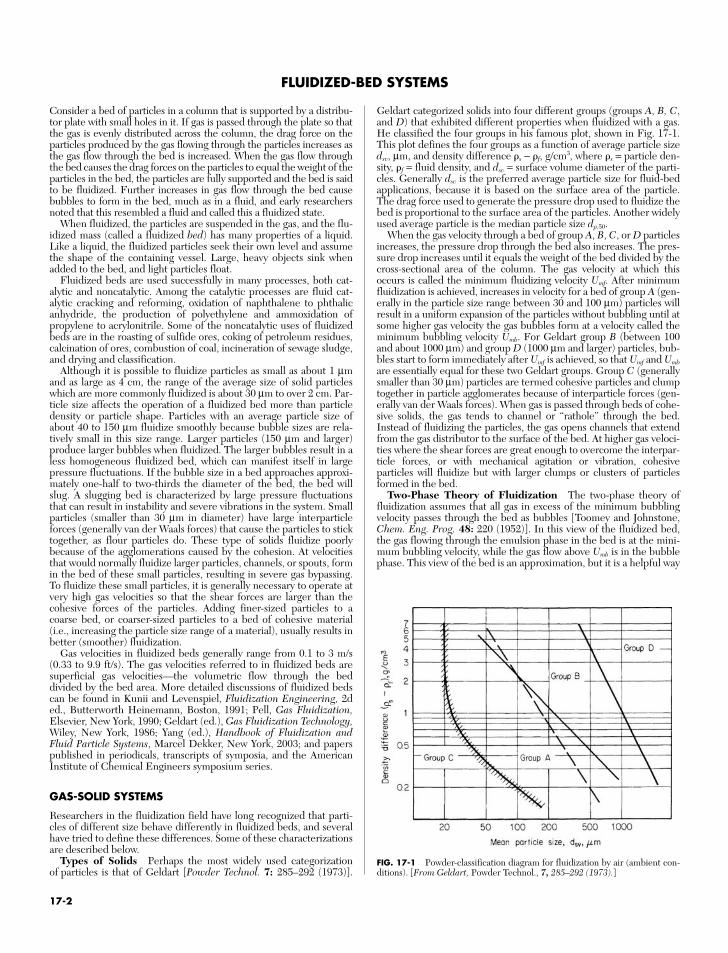
Geldart categorized solids into four different groups (groups A, B, C,and D) that exhibited different properties when fluidized with a gas.He classified the four groups in his famous plot, shown in Fig. 17-1.This plot defines the four groups as a function of average particle sizedsv, µm, and density difference s − f, g/cm3, where s = particle den-sity, f = fluid density, and dsv = surface volume diameter of the parti-cles. Generally dsv is the preferred average particle size for fluid-bedapplications, because it is based on the surface area of the particle.The drag force used to generate the pressure drop used to fluidize thebed is proportional to the surface area of the particles. Another widelyused average particle is the median particle size dp,50.
When the gas velocity through a bed of group A, B, C, or D particlesincreases, the pressure drop through the bed also increases. The pres-sure drop increases until it equals the weight of the bed divided by thecross-sectional area of the column. The gas velocity at which thisoccurs is called the minimum fluidizing velocity Umf. After minimumfluidization is achieved, increases in velocity for a bed of group A (gen-erally in the particle size range between 30 and 100 µm) particles willresult in a uniform expansion of the particles without bubbling until atsome higher gas velocity the gas bubbles form at a velocity called theminimum bubbling velocity Umb. For Geldart group B (between 100and about 1000 µm) and group D (1000 µm and larger) particles, bub-bles start to form immediately after Umf is achieved, so that Umf and Umb
are essentially equal for these two Geldart groups. Group C (generallysmaller than 30 µm) particles are termed cohesive particles and clumptogether in particle agglomerates because of interparticle forces (gen-erally van der Waals forces). When gas is passed through beds of cohe-sive solids, the gas tends to channel or “rathole” through the bed.Instead of fluidizing the particles, the gas opens channels that extendfrom the gas distributor to the surface of the bed. At higher gas veloci-ties where the shear forces are great enough to overcome the interpar-ticle forces, or with mechanical agitation or vibration, cohesiveparticles will fluidize but with larger clumps or clusters of particlesformed in the bed.
Two-Phase Theory of Fluidization The two-phase theory offluidization assumes that all gas in excess of the minimum bubblingvelocity passes through the bed as bubbles [Toomey and Johnstone,Chem. Eng. Prog. 48: 220 (1952)]. In this view of the fluidized bed,the gas flowing through the emulsion phase in the bed is at the mini-mum bubbling velocity, while the gas flow above Umb is in the bubblephase. This view of the bed is an approximation, but it is a helpful way
Consider a bed of particles in a column that is supported by a distribu-tor plate with small holes in it. If gas is passed through the plate so thatthe gas is evenly distributed across the column, the drag force on theparticles produced by the gas flowing through the particles increases asthe gas flow through the bed is increased. When the gas flow throughthe bed causes the drag forces on the particles to equal the weight of theparticles in the bed, the particles are fully supported and the bed is saidto be fluidized. Further increases in gas flow through the bed causebubbles to form in the bed, much as in a fluid, and early researchersnoted that this resembled a fluid and called this a fluidized state.
When fluidized, the particles are suspended in the gas, and the flu-idized mass (called a fluidized bed) has many properties of a liquid.Like a liquid, the fluidized particles seek their own level and assumethe shape of the containing vessel. Large, heavy objects sink whenadded to the bed, and light particles float.
Fluidized beds are used successfully in many processes, both cat-alytic and noncatalytic. Among the catalytic processes are fluid cat-alytic cracking and reforming, oxidation of naphthalene to phthalicanhydride, the production of polyethylene and ammoxidation ofpropylene to acrylonitrile. Some of the noncatalytic uses of fluidizedbeds are in the roasting of sulfide ores, coking of petroleum residues,calcination of ores, combustion of coal, incineration of sewage sludge,and drying and classification.
Although it is possible to fluidize particles as small as about 1 µmand as large as 4 cm, the range of the average size of solid particleswhich are more commonly fluidized is about 30 µm to over 2 cm. Par-ticle size affects the operation of a fluidized bed more than particledensity or particle shape. Particles with an average particle size ofabout 40 to 150 µm fluidize smoothly because bubble sizes are rela-tively small in this size range. Larger particles (150 µm and larger)produce larger bubbles when fluidized. The larger bubbles result in aless homogeneous fluidized bed, which can manifest itself in largepressure fluctuations. If the bubble size in a bed approaches approxi-mately one-half to two-thirds the diameter of the bed, the bed willslug. A slugging bed is characterized by large pressure fluctuationsthat can result in instability and severe vibrations in the system. Smallparticles (smaller than 30 µm in diameter) have large interparticleforces (generally van der Waals forces) that cause the particles to sticktogether, as flour particles do. These type of solids fluidize poorlybecause of the agglomerations caused by the cohesion. At velocitiesthat would normally fluidize larger particles, channels, or spouts, formin the bed of these small particles, resulting in severe gas bypassing.To fluidize these small particles, it is generally necessary to operate atvery high gas velocities so that the shear forces are larger than thecohesive forces of the particles. Adding finer-sized particles to acoarse bed, or coarser-sized particles to a bed of cohesive material(i.e., increasing the particle size range of a material), usually results inbetter (smoother) fluidization.
Gas velocities in fluidized beds generally range from 0.1 to 3 m/s(0.33 to 9.9 ft/s). The gas velocities referred to in fluidized beds aresuperficial gas velocities—the volumetric flow through the beddivided by the bed area. More detailed discussions of fluidized bedscan be found in Kunii and Levenspiel, Fluidization Engineering, 2ded., Butterworth Heinemann, Boston, 1991; Pell, Gas Fluidization,Elsevier, New York, 1990; Geldart (ed.), Gas Fluidization Technology,Wiley, New York, 1986; Yang (ed.), Handbook of Fluidization andFluid Particle Systems, Marcel Dekker, New York, 2003; and paperspublished in periodicals, transcripts of symposia, and the AmericanInstitute of Chemical Engineers symposium series.
GAS-SOLID SYSTEMS
Researchers in the fluidization field have long recognized that parti-cles of different size behave differently in fluidized beds, and severalhave tried to define these differences. Some of these characterizationsare described below.
Types of Solids Perhaps the most widely used categorizationof particles is that of Geldart [Powder Technol. 7: 285–292 (1973)].
FIG. 17-1 Powder-classification diagram for fluidization by air (ambient con-ditions). [From Geldart, Powder Technol., 7, 285–292 (1973).]
17-2
of understanding what happens as the gas velocity is increasedthrough a fluidized bed. As the gas velocity is increased above Umb,more and larger bubbles are formed in the bed. As more bubbles areproduced in the bed, the bed expands and the bed density decreases.
For all Geldart groups (A, B, C, and D), as the gas velocity isincreased, the fluidized-bed density is decreased and the turbulenceof the bed is increased. In smaller-diameter beds, especially withgroup B and D powders, slugging will occur as the bubbles increasein size to greater than one-half to two-thirds of the bed diameter.Bubbles grow by vertical and lateral merging and increase in size asthe gas velocity is increased [Whitehead, in Davidson and Harrison(eds.), Fluidization, Academic, London and New York, 1971]. As thegas velocity is increased further, the stable bubbles break down intounstable voids. When unstable voids characterize the gas phase in flu-idized beds, the bed is not in the bubbling regime anymore, but is saidto be in the turbulent regime. The turbulent regime is characterizedby higher heat- and mass-transfer rates than bubbling fluidized beds,and the pressure fluctuations in the bed are reduced relative to bub-bling beds. As the gas velocity is increased above the turbulent flu-idized regime, the turbulent bed gradually changes into the pneumaticconveying regime.
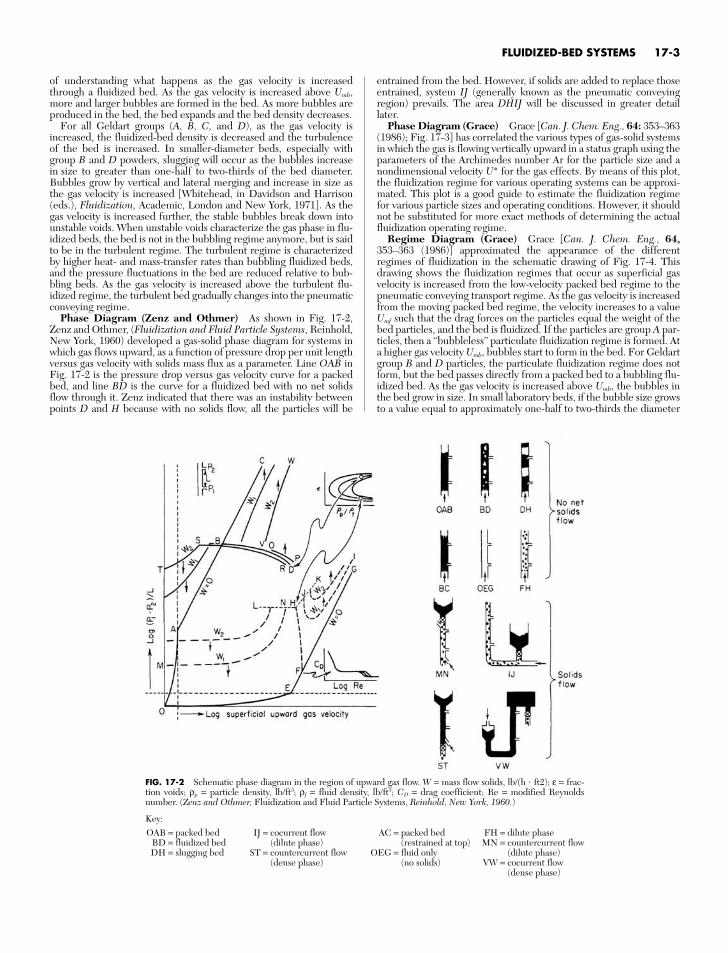
Phase Diagram (Zenz and Othmer) As shown in Fig. 17-2,Zenz and Othmer, (Fluidization and Fluid Particle Systems, Reinhold,New York, 1960) developed a gas-solid phase diagram for systems inwhich gas flows upward, as a function of pressure drop per unit lengthversus gas velocity with solids mass flux as a parameter. Line OAB inFig. 17-2 is the pressure drop versus gas velocity curve for a packedbed, and line BD is the curve for a fluidized bed with no net solidsflow through it. Zenz indicated that there was an instability betweenpoints D and H because with no solids flow, all the particles will be
entrained from the bed. However, if solids are added to replace thoseentrained, system IJ (generally known as the pneumatic conveyingregion) prevails. The area DHIJ will be discussed in greater detaillater.
Phase Diagram (Grace) Grace [Can. J. Chem. Eng., 64: 353–363(1986); Fig. 17-3] has correlated the various types of gas-solid systemsin which the gas is flowing vertically upward in a status graph using theparameters of the Archimedes number Ar for the particle size and anondimensional velocity U* for the gas effects. By means of this plot,the fluidization regime for various operating systems can be approxi-mated. This plot is a good guide to estimate the fluidization regimefor various particle sizes and operating conditions. However, it shouldnot be substituted for more exact methods of determining the actualfluidization operating regime.
Regime Diagram (Grace) Grace [Can. J. Chem. Eng., 64,353–363 (1986)] approximated the appearance of the differentregimes of fluidization in the schematic drawing of Fig. 17-4. Thisdrawing shows the fluidization regimes that occur as superficial gasvelocity is increased from the low-velocity packed bed regime to thepneumatic conveying transport regime. As the gas velocity is increasedfrom the moving packed bed regime, the velocity increases to a valueUmf such that the drag forces on the particles equal the weight of thebed particles, and the bed is fluidized. If the particles are group A par-ticles, then a “bubbleless” particulate fluidization regime is formed. Ata higher gas velocity Umb, bubbles start to form in the bed. For Geldartgroup B and D particles, the particulate fluidization regime does notform, but the bed passes directly from a packed bed to a bubbling flu-idized bed. As the gas velocity is increased above Umb, the bubbles inthe bed grow in size. In small laboratory beds, if the bubble size growsto a value equal to approximately one-half to two-thirds the diameter
FLUIDIZED-BED SYSTEMS 17-3
FIG. 17-2 Schematic phase diagram in the region of upward gas flow. W = mass flow solids, lb/(h ft2); ε = frac-tion voids; ρp = particle density, lb/ft3; ρf = fluid density, lb/ft3; CD = drag coefficient; Re = modified Reynoldsnumber. (Zenz and Othmer, Fluidization and Fluid Particle Systems, Reinhold, New York, 1960.)
Key:OAB = packed bed IJ = cocurrent flow AC = packed bed FH = dilute phase
BD = fluidized bed = (dilute phase) = (restrained at top) MN = countercurrent flowDH = slugging bed ST = countercurrent flow OEG = fluid only = (dilute phase)
= (dense phase) = (no solids) VW = cocurrent flow= (dense phase)
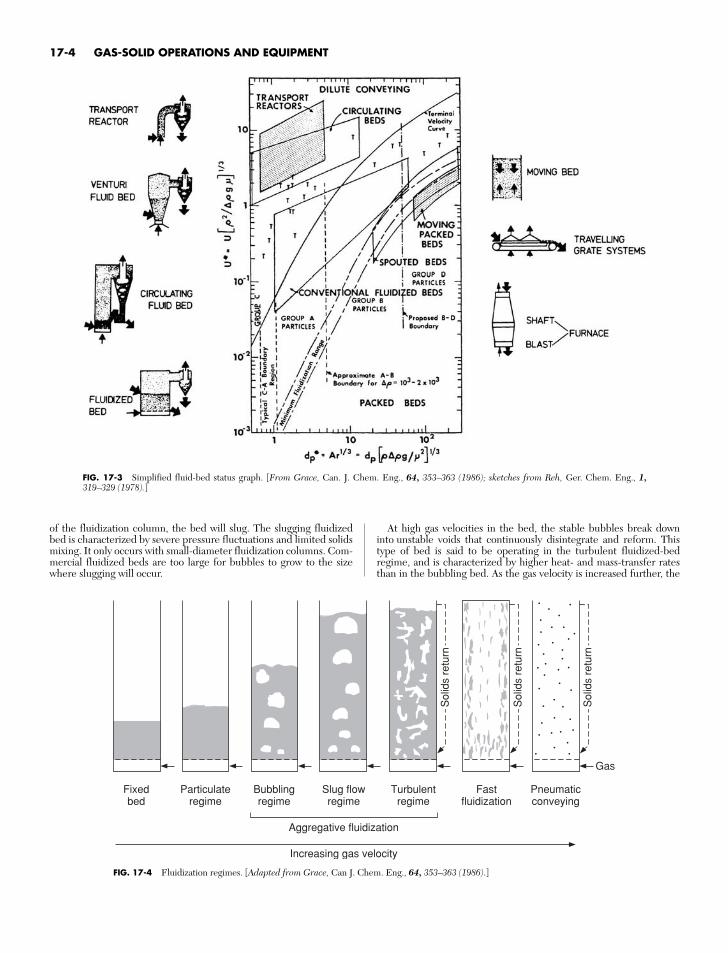
of the fluidization column, the bed will slug. The slugging fluidizedbed is characterized by severe pressure fluctuations and limited solidsmixing. It only occurs with small-diameter fluidization columns. Com-mercial fluidized beds are too large for bubbles to grow to the sizewhere slugging will occur.
At high gas velocities in the bed, the stable bubbles break downinto unstable voids that continuously disintegrate and reform. Thistype of bed is said to be operating in the turbulent fluidized-bedregime, and is characterized by higher heat- and mass-transfer ratesthan in the bubbling bed. As the gas velocity is increased further, the
17-4 GAS-SOLID OPERATIONS AND EQUIPMENT
FIG. 17-3 Simplified fluid-bed status graph. [From Grace, Can. J. Chem. Eng., 64, 353–363 (1986); sketches from Reh, Ger. Chem. Eng., 1,319–329 (1978).]
FIG. 17-4 Fluidization regimes. [Adapted from Grace, Can J. Chem. Eng., 64, 353–363 (1986).]
Sol
ids
retu
rn
Sol
ids
retu
rn
Sol
ids
retu
rn
Gas
Fixedbed
Particulateregime
Bubblingregime
Slug flowregime
Aggregative fluidization
Increasing gas velocity
Turbulentregime
Fastfluidization
Pneumaticconveying
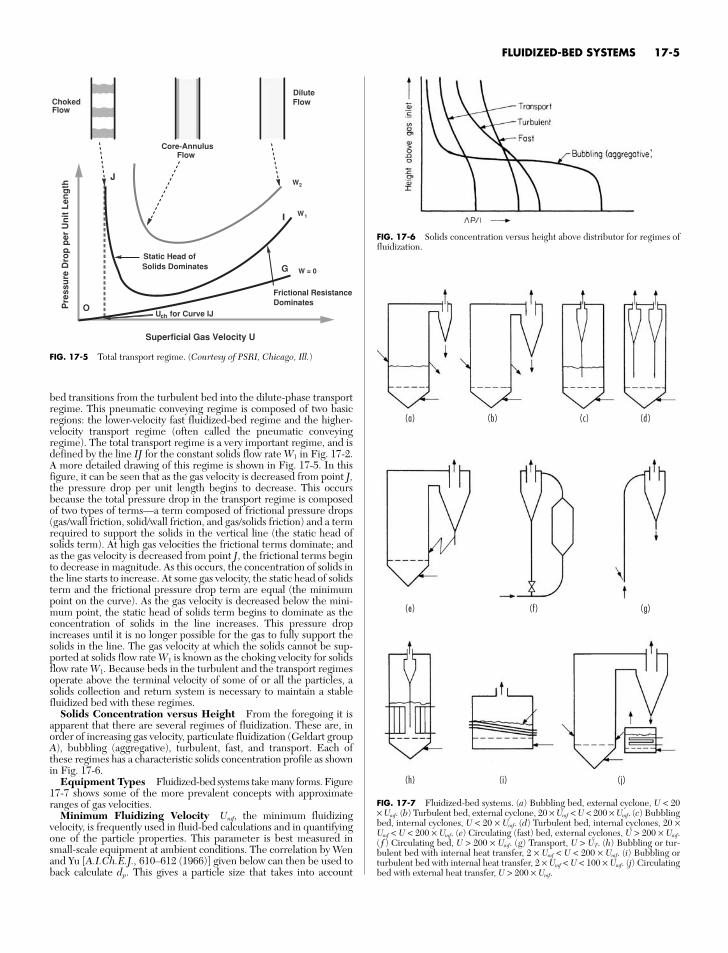
bed transitions from the turbulent bed into the dilute-phase transportregime. This pneumatic conveying regime is composed of two basicregions: the lower-velocity fast fluidized-bed regime and the higher-velocity transport regime (often called the pneumatic conveyingregime). The total transport regime is a very important regime, and isdefined by the line IJ for the constant solids flow rate W1 in Fig. 17-2.A more detailed drawing of this regime is shown in Fig. 17-5. In thisfigure, it can be seen that as the gas velocity is decreased from point J,the pressure drop per unit length begins to decrease. This occursbecause the total pressure drop in the transport regime is composedof two types of terms—a term composed of frictional pressure drops(gas/wall friction, solid/wall friction, and gas/solids friction) and a termrequired to support the solids in the vertical line (the static head ofsolids term). At high gas velocities the frictional terms dominate; andas the gas velocity is decreased from point J, the frictional terms beginto decrease in magnitude. As this occurs, the concentration of solids inthe line starts to increase. At some gas velocity, the static head of solidsterm and the frictional pressure drop term are equal (the minimumpoint on the curve). As the gas velocity is decreased below the mini-mum point, the static head of solids term begins to dominate as theconcentration of solids in the line increases. This pressure dropincreases until it is no longer possible for the gas to fully support thesolids in the line. The gas velocity at which the solids cannot be sup-ported at solids flow rate W1 is known as the choking velocity for solidsflow rate W1. Because beds in the turbulent and the transport regimesoperate above the terminal velocity of some of or all the particles, asolids collection and return system is necessary to maintain a stablefluidized bed with these regimes.
Solids Concentration versus Height From the foregoing it isapparent that there are several regimes of fluidization. These are, inorder of increasing gas velocity, particulate fluidization (Geldart groupA), bubbling (aggregative), turbulent, fast, and transport. Each ofthese regimes has a characteristic solids concentration profile as shownin Fig. 17-6.
Equipment Types Fluidized-bed systems take many forms. Figure17-7 shows some of the more prevalent concepts with approximateranges of gas velocities.
Minimum Fluidizing Velocity Umf, the minimum fluidizingvelocity, is frequently used in fluid-bed calculations and in quantifyingone of the particle properties. This parameter is best measured insmall-scale equipment at ambient conditions. The correlation by Wenand Yu [A.I.Ch.E.J., 610–612 (1966)] given below can then be used toback calculate dp. This gives a particle size that takes into account
FLUIDIZED-BED SYSTEMS 17-5
Superficial Gas Velocity U
Pre
ssu
re D
rop
per
Un
it L
eng
th
O
G W = 0
W
I
U for Curve IJch
Static Head ofSolids Dominates
Frictional ResistanceDominates
ChokedFlow
Core-AnnulusFlow
DiluteFlow
2
W1
J
FIG. 17-5 Total transport regime. (Courtesy of PSRI, Chicago, Ill.)
FIG. 17-6 Solids concentration versus height above distributor for regimes offluidization.
FIG. 17-7 Fluidized-bed systems. (a) Bubbling bed, external cyclone, U < 20× Umf. (b) Turbulent bed, external cyclone, 20 × Umf < U < 200 × Umf. (c) Bubblingbed, internal cyclones, U < 20 × Umf. (d) Turbulent bed, internal cyclones, 20 ×Umf < U < 200 × Umf. (e) Circulating (fast) bed, external cyclones, U > 200 × Umf.( f ) Circulating bed, U > 200 × Umf. (g) Transport, U > UT. (h) Bubbling or tur-bulent bed with internal heat transfer, 2 × Umf < U < 200 × Umf. (i) Bubbling orturbulent bed with internal heat transfer, 2 × Umf < U < 100 × Umf. (j) Circulatingbed with external heat transfer, U > 200 × Umf.
(a) (b) (c) (d )
(e) (f) (g)
(h) (i) (j)
effects of size distribution and particle shape, or sphericity. The corre-lation can then be used to estimate Umf at process conditions. If Umf
cannot be determined experimentally, use the expression belowdirectly.
Remf = (1135.7 + 0.0408Ar)0.5 − 33.7
where Remf = dsvρfUmf /µAr = dsvρf(ρs − ρf)g/µ2
dsv = 1/ (xi /dpi)
The flow required to maintain a complete homogeneous bed of solidsin which coarse or heavy particles will not segregate from the fluidizedportion is very different from the minimum fluidizing velocity. SeeNienow and Chiba, Fluidization, 2d ed., Wiley, 1985, pp. 357–382, fora discussion of segregation or mixing mechanism as well as the meansof predicting this flow; also see Baeyens and Geldart, Gas FluidizationTechnology, Wiley, 1986, 97–122.
Particulate Fluidization Fluid beds of Geldart group A pow-ders that are operated at gas velocities above the minimum fluidizingvelocity (Umf) but below the minimum bubbling velocity (Umb) are saidto be particulately fluidized. As the gas velocity is increased above Umf,the bed further expands. Decreasing (ρs − ρf), dp and/or increasing µf
increases the spread between Umf and Umb. Richardson and Zaki[Trans. Inst. Chem. Eng., 32, 35 (1954)] showed that U/Ui = εn, wheren is a function of system properties, ε = void fraction, U = superficialfluid velocity, and Ui = theoretical superficial velocity from theRichardson and Zaki plot when ε = 1.
Vibrofluidization It is possible to fluidize a bed mechanically byimposing vibration to throw the particles upward cyclically. Thisenables the bed to operate with either no gas upward velocity orreduced gas flow. Entrainment can also be greatly reduced comparedto unaided fluidization. The technique is used commercially in dry-ing and other applications [Mujumdar and Erdesz, Drying Tech., 6,255–274 (1988)], and chemical reaction applications are possible. SeeSec. 12 for more on drying applications of vibrofluidization.
DESIGN OF FLUIDIZED-BED SYSTEMS
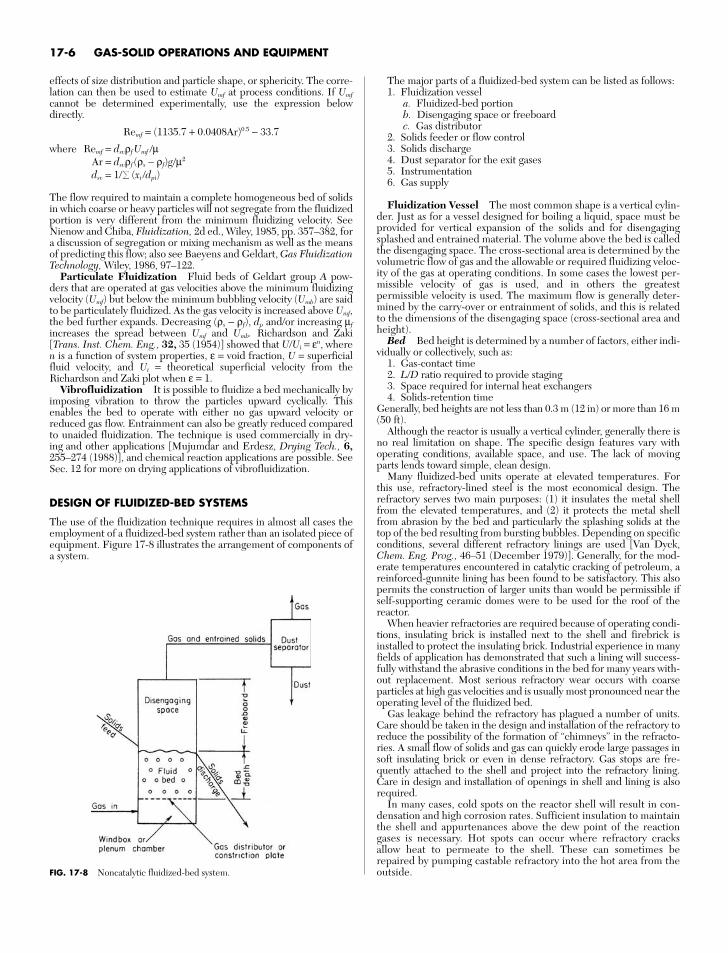
The use of the fluidization technique requires in almost all cases theemployment of a fluidized-bed system rather than an isolated piece ofequipment. Figure 17-8 illustrates the arrangement of components ofa system.
The major parts of a fluidized-bed system can be listed as follows:1. Fluidization vessel
a. Fluidized-bed portionb. Disengaging space or freeboardc. Gas distributor
2. Solids feeder or flow control3. Solids discharge4. Dust separator for the exit gases5. Instrumentation6. Gas supply
Fluidization Vessel The most common shape is a vertical cylin-der. Just as for a vessel designed for boiling a liquid, space must beprovided for vertical expansion of the solids and for disengagingsplashed and entrained material. The volume above the bed is calledthe disengaging space. The cross-sectional area is determined by thevolumetric flow of gas and the allowable or required fluidizing veloc-ity of the gas at operating conditions. In some cases the lowest per-missible velocity of gas is used, and in others the greatestpermissible velocity is used. The maximum flow is generally deter-mined by the carry-over or entrainment of solids, and this is relatedto the dimensions of the disengaging space (cross-sectional area andheight).
Bed Bed height is determined by a number of factors, either indi-vidually or collectively, such as:
1. Gas-contact time2. L/D ratio required to provide staging3. Space required for internal heat exchangers4. Solids-retention time
Generally, bed heights are not less than 0.3 m (12 in) or more than 16 m(50 ft).
Although the reactor is usually a vertical cylinder, generally there isno real limitation on shape. The specific design features vary withoperating conditions, available space, and use. The lack of movingparts lends toward simple, clean design.
Many fluidized-bed units operate at elevated temperatures. Forthis use, refractory-lined steel is the most economical design. Therefractory serves two main purposes: (1) it insulates the metal shellfrom the elevated temperatures, and (2) it protects the metal shellfrom abrasion by the bed and particularly the splashing solids at thetop of the bed resulting from bursting bubbles. Depending on specificconditions, several different refractory linings are used [Van Dyck,Chem. Eng. Prog., 46–51 (December 1979)]. Generally, for the mod-erate temperatures encountered in catalytic cracking of petroleum, areinforced-gunnite lining has been found to be satisfactory. This alsopermits the construction of larger units than would be permissible ifself-supporting ceramic domes were to be used for the roof of thereactor.
When heavier refractories are required because of operating condi-tions, insulating brick is installed next to the shell and firebrick isinstalled to protect the insulating brick. Industrial experience in manyfields of application has demonstrated that such a lining will success-fully withstand the abrasive conditions in the bed for many years with-out replacement. Most serious refractory wear occurs with coarseparticles at high gas velocities and is usually most pronounced near theoperating level of the fluidized bed.
Gas leakage behind the refractory has plagued a number of units.Care should be taken in the design and installation of the refractory toreduce the possibility of the formation of “chimneys” in the refracto-ries. A small flow of solids and gas can quickly erode large passages insoft insulating brick or even in dense refractory. Gas stops are fre-quently attached to the shell and project into the refractory lining.Care in design and installation of openings in shell and lining is alsorequired.
In many cases, cold spots on the reactor shell will result in con-densation and high corrosion rates. Sufficient insulation to maintainthe shell and appurtenances above the dew point of the reactiongases is necessary. Hot spots can occur where refractory cracksallow heat to permeate to the shell. These can sometimes berepaired by pumping castable refractory into the hot area from theoutside.
17-6 GAS-SOLID OPERATIONS AND EQUIPMENT
FIG. 17-8 Noncatalytic fluidized-bed system.
The violent motion of a fluidized bed requires an ample foundationand a sturdy supporting structure for the reactor. Even a relativelysmall differential movement of the reactor shell with the lining willmaterially shorten refractory life. The lining and shell must bedesigned as a unit. Structural steel should not be supported from avessel that is subject to severe vibration.
Freeboard and Entrainment The freeboard or disengagingheight is the distance between the top of the fluid bed and the gas-exitnozzle in bubbling- or turbulent-bed units. The distinction betweenbed and freeboard is difficult to determine in fast and transport units(see Fig. 17-6).
At least two actions can take place in the freeboard: classification ofsolids and reaction of solids and gases.
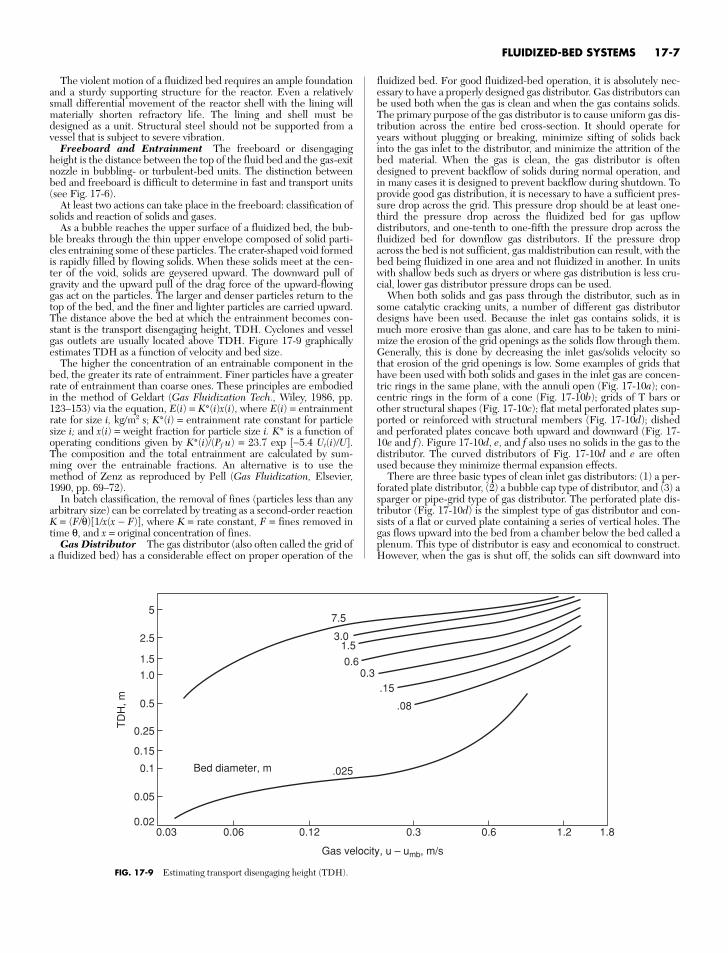
As a bubble reaches the upper surface of a fluidized bed, the bub-ble breaks through the thin upper envelope composed of solid parti-cles entraining some of these particles. The crater-shaped void formedis rapidly filled by flowing solids. When these solids meet at the cen-ter of the void, solids are geysered upward. The downward pull ofgravity and the upward pull of the drag force of the upward-flowinggas act on the particles. The larger and denser particles return to thetop of the bed, and the finer and lighter particles are carried upward.The distance above the bed at which the entrainment becomes con-stant is the transport disengaging height, TDH. Cyclones and vesselgas outlets are usually located above TDH. Figure 17-9 graphicallyestimates TDH as a function of velocity and bed size.
The higher the concentration of an entrainable component in thebed, the greater its rate of entrainment. Finer particles have a greaterrate of entrainment than coarse ones. These principles are embodiedin the method of Geldart (Gas Fluidization Tech., Wiley, 1986, pp.123–153) via the equation, E(i) = K*(i)x(i), where E(i) = entrainmentrate for size i, kg/m2 s; K*(i) = entrainment rate constant for particlesize i; and x(i) = weight fraction for particle size i. K* is a function ofoperating conditions given by K*(i)/(Pf u) = 23.7 exp [−5.4 Ut(i)/U].The composition and the total entrainment are calculated by sum-ming over the entrainable fractions. An alternative is to use themethod of Zenz as reproduced by Pell (Gas Fluidization, Elsevier,1990, pp. 69–72).
In batch classification, the removal of fines (particles less than anyarbitrary size) can be correlated by treating as a second-order reactionK = (F/θ)[1/x(x − F)], where K = rate constant, F = fines removed intime θ, and x = original concentration of fines.
Gas Distributor The gas distributor (also often called the grid ofa fluidized bed) has a considerable effect on proper operation of the
fluidized bed. For good fluidized-bed operation, it is absolutely nec-essary to have a properly designed gas distributor. Gas distributors canbe used both when the gas is clean and when the gas contains solids.The primary purpose of the gas distributor is to cause uniform gas dis-tribution across the entire bed cross-section. It should operate foryears without plugging or breaking, minimize sifting of solids backinto the gas inlet to the distributor, and minimize the attrition of thebed material. When the gas is clean, the gas distributor is oftendesigned to prevent backflow of solids during normal operation, andin many cases it is designed to prevent backflow during shutdown. Toprovide good gas distribution, it is necessary to have a sufficient pres-sure drop across the grid. This pressure drop should be at least one-third the pressure drop across the fluidized bed for gas upflowdistributors, and one-tenth to one-fifth the pressure drop across thefluidized bed for downflow gas distributors. If the pressure dropacross the bed is not sufficient, gas maldistribution can result, with thebed being fluidized in one area and not fluidized in another. In unitswith shallow beds such as dryers or where gas distribution is less cru-cial, lower gas distributor pressure drops can be used.
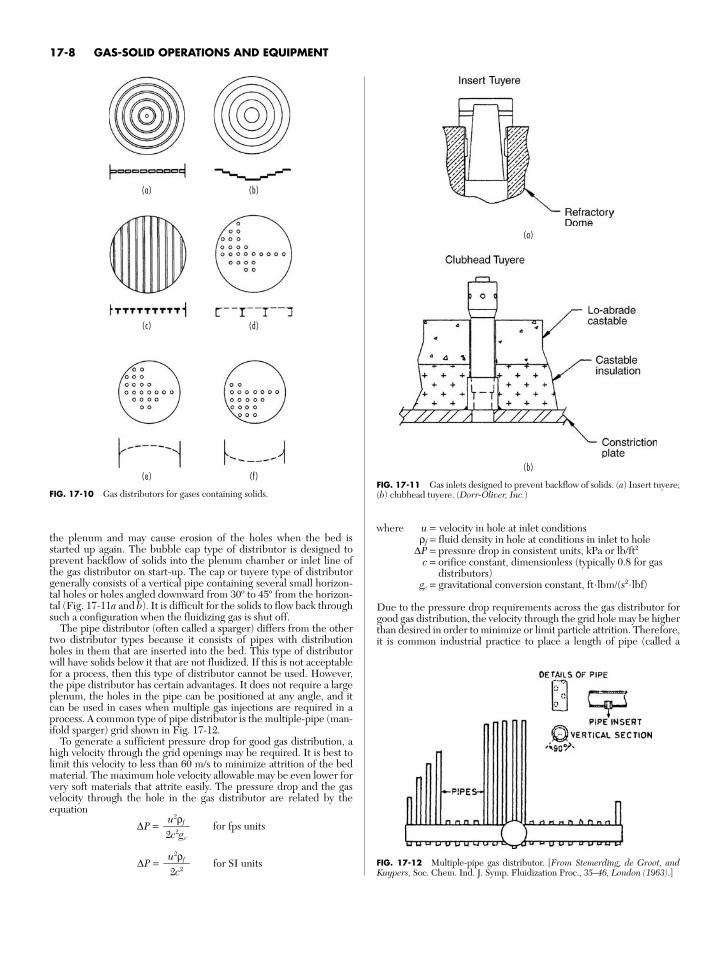
When both solids and gas pass through the distributor, such as insome catalytic cracking units, a number of different gas distributordesigns have been used. Because the inlet gas contains solids, it ismuch more erosive than gas alone, and care has to be taken to mini-mize the erosion of the grid openings as the solids flow through them.Generally, this is done by decreasing the inlet gas/solids velocity sothat erosion of the grid openings is low. Some examples of grids thathave been used with both solids and gases in the inlet gas are concen-tric rings in the same plane, with the annuli open (Fig. 17-10a); con-centric rings in the form of a cone (Fig. 17-10b); grids of T bars orother structural shapes (Fig. 17-10c); flat metal perforated plates sup-ported or reinforced with structural members (Fig. 17-10d); dishedand perforated plates concave both upward and downward (Fig. 17-10e and f). Figure 17-10d, e, and f also uses no solids in the gas to thedistributor. The curved distributors of Fig. 17-10d and e are oftenused because they minimize thermal expansion effects.
There are three basic types of clean inlet gas distributors: (1) a per-forated plate distributor, (2) a bubble cap type of distributor, and (3) asparger or pipe-grid type of gas distributor. The perforated plate dis-tributor (Fig. 17-10d) is the simplest type of gas distributor and con-sists of a flat or curved plate containing a series of vertical holes. Thegas flows upward into the bed from a chamber below the bed called aplenum. This type of distributor is easy and economical to construct.However, when the gas is shut off, the solids can sift downward into
FLUIDIZED-BED SYSTEMS 17-7
7.5
3.01.5
0.60.3
.15
.08
.025Bed diameter, m
Gas velocity, u – umb, m/s
TD
H, m
5
2.5
1.5
1.0
0.5
0.25
0.15
0.1
0.05
0.020.03 0.06 0.12 0.3 0.6 1.2 1.8
FIG. 17-9 Estimating transport disengaging height (TDH).
the plenum and may cause erosion of the holes when the bed isstarted up again. The bubble cap type of distributor is designed toprevent backflow of solids into the plenum chamber or inlet line ofthe gas distributor on start-up. The cap or tuyere type of distributorgenerally consists of a vertical pipe containing several small horizon-tal holes or holes angled downward from 30º to 45º from the horizon-tal (Fig. 17-11a and b). It is difficult for the solids to flow back throughsuch a configuration when the fluidizing gas is shut off.
The pipe distributor (often called a sparger) differs from the othertwo distributor types because it consists of pipes with distributionholes in them that are inserted into the bed. This type of distributorwill have solids below it that are not fluidized. If this is not acceptablefor a process, then this type of distributor cannot be used. However,the pipe distributor has certain advantages. It does not require a largeplenum, the holes in the pipe can be positioned at any angle, and itcan be used in cases when multiple gas injections are required in aprocess. A common type of pipe distributor is the multiple-pipe (man-ifold sparger) grid shown in Fig. 17-12.
To generate a sufficient pressure drop for good gas distribution, ahigh velocity through the grid openings may be required. It is best tolimit this velocity to less than 60 m/s to minimize attrition of the bedmaterial. The maximum hole velocity allowable may be even lower forvery soft materials that attrite easily. The pressure drop and the gasvelocity through the hole in the gas distributor are related by theequation
∆P = for fps units
∆P = for SI unitsu2ρf
2c2
u2ρf2c2gc
where u = velocity in hole at inlet conditionsρf = fluid density in hole at conditions in inlet to hole ∆P = pressure drop in consistent units, kPa or lb/ft2
c = orifice constant, dimensionless (typically 0.8 for gasdistributors)
gc = gravitational conversion constant, ft⋅lbm/(s2⋅lbf)
Due to the pressure drop requirements across the gas distributor forgood gas distribution, the velocity through the grid hole may be higherthan desired in order to minimize or limit particle attrition. Therefore,it is common industrial practice to place a length of pipe (called a
17-8 GAS-SOLID OPERATIONS AND EQUIPMENT
FIG. 17-10 Gas distributors for gases containing solids.FIG. 17-11 Gas inlets designed to prevent backflow of solids. (a) Insert tuyere;(b) clubhead tuyere. (Dorr-Oliver, Inc.)
(a) (b)
(a)
(c) (d)
(e) (f)(b)
FIG. 17-12 Multiple-pipe gas distributor. [From Stemerding, de Groot, andKuypers, Soc. Chem. Ind. J. Symp. Fluidization Proc., 35–46, London (1963).]
shroud) over the gas distributor hole such that the diameter of thepipe is larger than the diameter of the distributor hole. This techniqueeffectively allows a smaller hole to give the required pressure drop,but the larger hole diameter of the shroud reduces the exit gas veloc-ity into the bed so that particle attrition at the grid will be minimized.This technique is applied to both plate and pipe spargers.
Experience has shown that a concave-downward (Fig. 17-10f ) gasdistributor is a better arrangement than a concave-upward (Fig. 17-10-e)gas distributor, as it tends to increase the flow of gases in the outerportion of the bed. This counteracts the normal tendency of the gas toflow into the center of the bed after it exits the gas distributor. In addi-tion, the concave-downward type of gas distributor tends to assist thegeneral solids flow pattern in the bed, which is up in the center anddown near the walls. The concave-upward gas distributor tends tohave a slow-moving region at the bottom near the wall. If solids arelarge (or if they are slightly cohesive), they can build up in this region.
Structurally, distributors must withstand the differential pressureacross the restriction during normal and abnormal flow. In addition,during a shutdown, all or a portion of the bed will be supported by thedistributor until sufficient backflow of the solids has occurred into theplenum to reduce the weight of solids above the distributor and tosupport some of this remaining weight by transmitting the force to thewalls and bottom of the reactor. During start-up, a considerableupward thrust can be exerted against the distributor as the settledsolids under the distributor are carried up into the normal reactorbed.
When the feed gas is devoid of or contains only small quantities offine solids, more sophisticated designs of gas distributors can be usedto effect economies in initial cost and maintenance. This is most pro-nounced when the inlet gas is cold and noncorrosive. When this is thecase, the plenum chamber gas distributor and distributor supports canbe fabricated of mild steel by using normal temperature design fac-tors. The first commercial fluidized-bed ore roaster [Mathews, Trans.Can. Inst. Min. Metall. L11:97 (1949)], supplied by the Dorr Co.(now Dorr-Oliver Inc.) in 1947 to Cochenour-Willans, Red Lake,Ontario, was designed with a mild-steel constriction plate coveredwith castable refractory to insulate the plate from the calcine and toprovide cones in which refractory balls were placed to act as ballchecks. The balls eroded unevenly, and the castable cracked. How-ever, when the unit was shut down by closing the air control valve, therunback of solids was negligible because of bridging. If, however, theunit were shut down by deenergizing the centrifugal blower motor,the higher pressure in the reactor would relieve through the blowerand fluidizing gas plus solids would run back through the constrictionplate. Figure 17-11 illustrates two designs of gas inlets which havebeen successfully used to prevent flowback of solids. For best results,irrespective of the design, the gas flow should be stopped and thepressure relieved from the bottom upward through the bed. Someunits have been built and successfully operated with simple slot-typedistributors made of heat-resistant steel. This requires a heat-resistantplenum chamber but eliminates the frequently encountered problemof corrosion caused by condensation of acids and water vapor on thecold metal of the distributor. When the inlet gas is hot, such as indryers or in the upper distributors of multibed units, ceramic archesor heat-resistant metal grates are generally used. Self-supportingceramic domes have been in successful use for many years as gasdistributors when temperatures range up to 1100°C. Some of thesedomes are fitted with alloy-steel orifices to regulate air distribution.However, the ceramic arch presents the same problem as the dishedhead positioned concave upward. Either the holes in the center mustbe smaller, so that the sum of the pressure drops through the distrib-utor plus the bed is constant across the entire cross section, or the topof the arch must be flattened so that the bed depths in the center andoutside are equal. This is especially important when shallow beds areused.
It is important to consider thermal effects in the design of the grid-to-shell seal. Bypassing of the grid at the seal point is a common prob-lem caused by situations such as uneven expansion of metal andceramic parts, a cold plenum and hot solids in contact with the gridplate at the same time, and start-up and shutdown scenarios. Whenthe atmosphere in the bed is sufficiently benign, a sparger-type
distributor may be used (Fig. 17-12). In some cases, it is impractical touse a plenum chamber under the constriction plate. This conditionarises when a flammable or explosive mixture of gases is being intro-duced to the reactor. One solution is to pipe the gases to a multitudeof individual gas inlets in the floor of the reactor. In this way it may bepossible to maintain the gas velocities in the pipes above the flamevelocity or to reduce the volume of gas in each pipe to the point atwhich an explosion can be safely contained. Another solution is to pro-vide separate inlets for the different gases and to rely on the rapid axialmixing of the fluidized bed. The inlets should be fairly close to oneanother, as lateral gas mixing in fluidized beds is poor.
Much attention has been paid to the effect of gas distribution onbubble growth in the bed and the effect of this on catalyst utilization,space-time yield, etc., in catalytic systems. It would appear that thebest gas distributor would be a porous membrane because of its evendistribution. However, this type of distributor is seldom practical forcommercial units because of structural limitations and the fact that itrequires absolutely clean gas. Practically, the limitations on hole spac-ing in a gas distributor are dependent on the particle size of the solids,materials of construction, and type of distributor. If easily workedmetals are used, then punching, drilling, and welding are not expen-sive operations and permit the use of large numbers of holes. The useof tuyeres or bubble caps permits horizontal distribution of the gas sothat a smaller number of gas inlet ports can still achieve good gas dis-tribution. If a ceramic arch is used, generally only one hole per brickis permissible and brick dimensions must be reasonable.
Scale-upBubbling or Turbulent Beds Scale-up of noncatalytic fluidized
beds when the reaction is fast, as in roasting or calcination, is straight-forward and is usually carried out on an area basis. Small-scale testsare made to determine physical limitations such as sintering, agglom-eration, solids-holdup time required, etc. Slower (k < 1/s) catalytic ormore complex reactions in which several gas interchanges arerequired are usually scaled up in several steps, from laboratory tocommercial size. The hydrodynamics of gas-solids flow and contactingis quite different in small-diameter high-L/D fluid beds as comparedwith large-diameter moderate-L/D beds. In small-diameter beds,bubbles tend to be small and cannot grow larger than the vessel diam-eter. In larger, deeper units, bubbles can grow very large. The largebubbles have less surface for mass transfer to the solids than the samevolume of small bubbles. The large bubbles also rise through the bedmore quickly.
The size of a bubble as a function of height was given by Darton et al.[Trans. Inst. Chem. Eng., 55, 274–280 (1977)] as
db =
where db = bubble diameter, mh = height above the grid, m
At /No = grid area per hole
Bubble growth in fluidized beds will be limited by the diameter ofthe containing vessel and bubble hydrodynamic stability. Bubbles ingroup B systems can grow to over 1 m in diameter if the gas veloc-ity and the bed height are both high enough. Bubbles in group Amaterials with high percentage of fines (material less than 44 µm insize) may reach a maximum stable bubble size in a range of about 5 to15 cm. Furthermore, solids and gas backmixing are much less inhigh-L /D beds (whether they are slugging or bubbling) comparedwith low-L /D beds. Thus, the conversion or yield in large, unstagedreactors is sometimes considerably lower than in small high-L /Dunits. To overcome some of the problems of scale-up, staged units areused (Fig. 17-13). It is generally concluded than an unstaged 1-m-(40-in-) diameter unit will achieve about the same conversion as alarge industrial unit. The validity of this conclusion is dependent onmany variables, including bed depth, particle size, size distribution,temperature, and system pressure. A brief history of fluidization,fluidized-bed scale-up, and modeling will illustrate the problems.
0.54(u − umb)0.4(h + 4At /No)0.8
g0.2
FLUIDIZED-BED SYSTEMS 17-9
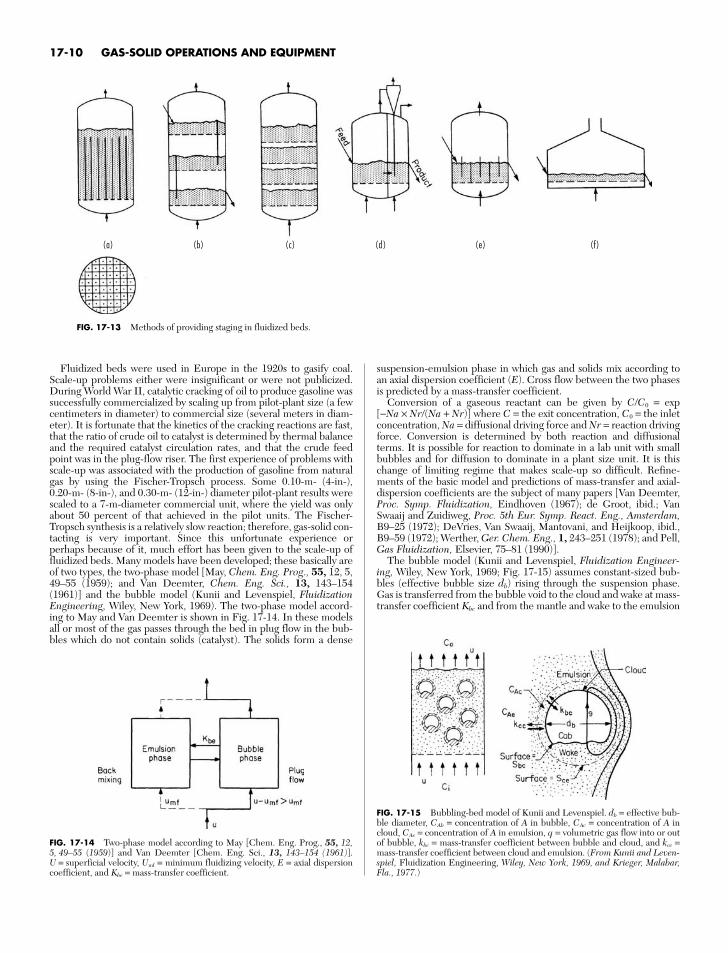
Fluidized beds were used in Europe in the 1920s to gasify coal.Scale-up problems either were insignificant or were not publicized.During World War II, catalytic cracking of oil to produce gasoline wassuccessfully commercialized by scaling up from pilot-plant size (a fewcentimeters in diameter) to commercial size (several meters in diam-eter). It is fortunate that the kinetics of the cracking reactions are fast,that the ratio of crude oil to catalyst is determined by thermal balanceand the required catalyst circulation rates, and that the crude feedpoint was in the plug-flow riser. The first experience of problems withscale-up was associated with the production of gasoline from naturalgas by using the Fischer-Tropsch process. Some 0.10-m- (4-in-), 0.20-m- (8-in-), and 0.30-m- (12-in-) diameter pilot-plant results werescaled to a 7-m-diameter commercial unit, where the yield was onlyabout 50 percent of that achieved in the pilot units. The Fischer-Tropsch synthesis is a relatively slow reaction; therefore, gas-solid con-tacting is very important. Since this unfortunate experience orperhaps because of it, much effort has been given to the scale-up offluidized beds. Many models have been developed; these basically areof two types, the two-phase model [May, Chem. Eng. Prog., 55, 12, 5,49–55 (1959); and Van Deemter, Chem. Eng. Sci., 13, 143–154(1961)] and the bubble model (Kunii and Levenspiel, FluidizationEngineering, Wiley, New York, 1969). The two-phase model accord-ing to May and Van Deemter is shown in Fig. 17-14. In these modelsall or most of the gas passes through the bed in plug flow in the bub-bles which do not contain solids (catalyst). The solids form a dense
suspension-emulsion phase in which gas and solids mix according toan axial dispersion coefficient (E). Cross flow between the two phasesis predicted by a mass-transfer coefficient.
Conversion of a gaseous reactant can be given by C/C0 = exp[−Na × Nr/(Na + Nr)] where C = the exit concentration, C0 = the inletconcentration, Na = diffusional driving force and Nr = reaction drivingforce. Conversion is determined by both reaction and diffusionalterms. It is possible for reaction to dominate in a lab unit with smallbubbles and for diffusion to dominate in a plant size unit. It is thischange of limiting regime that makes scale-up so difficult. Refine-ments of the basic model and predictions of mass-transfer and axial-dispersion coefficients are the subject of many papers [Van Deemter,Proc. Symp. Fluidization, Eindhoven (1967); de Groot, ibid.; VanSwaaij and Zuidiweg, Proc. 5th Eur. Symp. React. Eng., Amsterdam,B9–25 (1972); DeVries, Van Swaaij, Mantovani, and Heijkoop, ibid.,B9–59 (1972); Werther, Ger. Chem. Eng., 1, 243–251 (1978); and Pell,Gas Fluidization, Elsevier, 75–81 (1990)].
The bubble model (Kunii and Levenspiel, Fluidization Engineer-ing, Wiley, New York, 1969; Fig. 17-15) assumes constant-sized bub-bles (effective bubble size db) rising through the suspension phase.Gas is transferred from the bubble void to the cloud and wake at mass-transfer coefficient Kbc and from the mantle and wake to the emulsion
17-10 GAS-SOLID OPERATIONS AND EQUIPMENT
FIG. 17-13 Methods of providing staging in fluidized beds.
FIG. 17-14 Two-phase model according to May [Chem. Eng. Prog., 55, 12,5, 49–55 (1959)] and Van Deemter [Chem. Eng. Sci., 13, 143–154 (1961)].U = superficial velocity, Umf = minimum fluidizing velocity, E = axial dispersioncoefficient, and Kbe = mass-transfer coefficient.
FIG. 17-15 Bubbling-bed model of Kunii and Levenspiel. db = effective bub-ble diameter, CAb = concentration of A in bubble, CAc = concentration of A incloud, CAe = concentration of A in emulsion, q = volumetric gas flow into or outof bubble, kbc = mass-transfer coefficient between bubble and cloud, and kce =mass-transfer coefficient between cloud and emulsion. (From Kunii and Leven-spiel, Fluidization Engineering, Wiley, New York, 1969, and Krieger, Malabar,Fla., 1977.)
(a) (b) (c) (d ) (e) (f)
phase at mass-transfer coefficient Kce. Experimental results have beenfitted to theory by means of adjusting the effective bubble size. Asmentioned previously, bubble size changes from the bottom to the topof the bed, and thus this model is not realistic though of considerableuse in evaluating reactor performance. Several bubble models usingbubbles of increasing size from the distributor to the top of the bedand gas interchange between the bubbles and the emulsion phaseaccording to Kunii and Levenspiel have been proposed [Kato andWen, Chem. Eng. Sci., 24, 1351–1369 (1969); and Fryer and Potter, inKeairns (ed.), Fluidization Technology, vol. I, Hemisphere, Washing-ton, 1975, pp. 171–178].
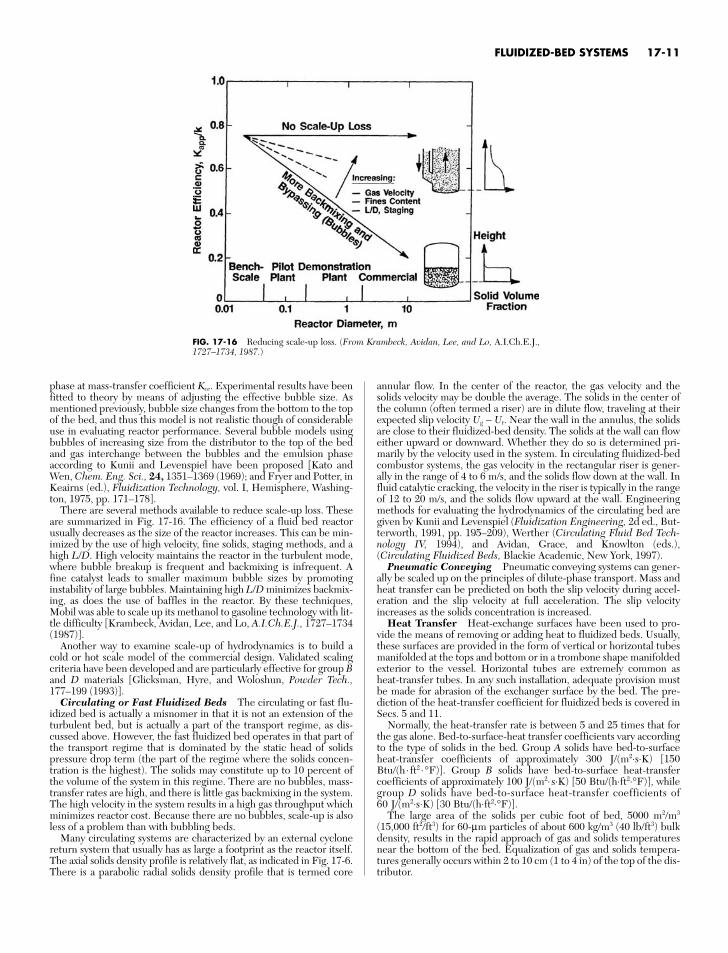
There are several methods available to reduce scale-up loss. Theseare summarized in Fig. 17-16. The efficiency of a fluid bed reactorusually decreases as the size of the reactor increases. This can be min-imized by the use of high velocity, fine solids, staging methods, and ahigh L/D. High velocity maintains the reactor in the turbulent mode,where bubble breakup is frequent and backmixing is infrequent. Afine catalyst leads to smaller maximum bubble sizes by promotinginstability of large bubbles. Maintaining high L/D minimizes backmix-ing, as does the use of baffles in the reactor. By these techniques,Mobil was able to scale up its methanol to gasoline technology with lit-tle difficulty [Krambeck, Avidan, Lee, and Lo, A.I.Ch.E.J., 1727–1734(1987)].
Another way to examine scale-up of hydrodynamics is to build acold or hot scale model of the commercial design. Validated scalingcriteria have been developed and are particularly effective for group Band D materials [Glicksman, Hyre, and Woloshun, Powder Tech.,177–199 (1993)].
Circulating or Fast Fluidized Beds The circulating or fast flu-idized bed is actually a misnomer in that it is not an extension of theturbulent bed, but is actually a part of the transport regime, as dis-cussed above. However, the fast fluidized bed operates in that part ofthe transport regime that is dominated by the static head of solidspressure drop term (the part of the regime where the solids concen-tration is the highest). The solids may constitute up to 10 percent ofthe volume of the system in this regime. There are no bubbles, mass-transfer rates are high, and there is little gas backmixing in the system.The high velocity in the system results in a high gas throughput whichminimizes reactor cost. Because there are no bubbles, scale-up is alsoless of a problem than with bubbling beds.
Many circulating systems are characterized by an external cyclonereturn system that usually has as large a footprint as the reactor itself.The axial solids density profile is relatively flat, as indicated in Fig. 17-6.There is a parabolic radial solids density profile that is termed core
annular flow. In the center of the reactor, the gas velocity and thesolids velocity may be double the average. The solids in the center ofthe column (often termed a riser) are in dilute flow, traveling at theirexpected slip velocity Ug − Ut. Near the wall in the annulus, the solidsare close to their fluidized-bed density. The solids at the wall can floweither upward or downward. Whether they do so is determined pri-marily by the velocity used in the system. In circulating fluidized-bedcombustor systems, the gas velocity in the rectangular riser is gener-ally in the range of 4 to 6 m/s, and the solids flow down at the wall. Influid catalytic cracking, the velocity in the riser is typically in the rangeof 12 to 20 m/s, and the solids flow upward at the wall. Engineeringmethods for evaluating the hydrodynamics of the circulating bed aregiven by Kunii and Levenspiel (Fluidization Engineering, 2d ed., But-terworth, 1991, pp. 195–209), Werther (Circulating Fluid Bed Tech-nology IV, 1994), and Avidan, Grace, and Knowlton (eds.),(Circulating Fluidized Beds, Blackie Academic, New York, 1997).
Pneumatic Conveying Pneumatic conveying systems can gener-ally be scaled up on the principles of dilute-phase transport. Mass andheat transfer can be predicted on both the slip velocity during accel-eration and the slip velocity at full acceleration. The slip velocityincreases as the solids concentration is increased.
Heat Transfer Heat-exchange surfaces have been used to pro-vide the means of removing or adding heat to fluidized beds. Usually,these surfaces are provided in the form of vertical or horizontal tubesmanifolded at the tops and bottom or in a trombone shape manifoldedexterior to the vessel. Horizontal tubes are extremely common asheat-transfer tubes. In any such installation, adequate provision mustbe made for abrasion of the exchanger surface by the bed. The pre-diction of the heat-transfer coefficient for fluidized beds is covered inSecs. 5 and 11.
Normally, the heat-transfer rate is between 5 and 25 times that forthe gas alone. Bed-to-surface-heat transfer coefficients vary accordingto the type of solids in the bed. Group A solids have bed-to-surfaceheat-transfer coefficients of approximately 300 J/(m2⋅s⋅K) [150Btu/(h ⋅ ft2 ⋅°F)]. Group B solids have bed-to-surface heat-transfercoefficients of approximately 100 J/(m2⋅s⋅K) [50 Btu/(h⋅ft2⋅°F)], whilegroup D solids have bed-to-surface heat-transfer coefficients of60 J/(m2⋅s⋅K) [30 Btu/(h⋅ft2⋅°F)].
The large area of the solids per cubic foot of bed, 5000 m2/m3
(15,000 ft2/ft3) for 60-µm particles of about 600 kg/m3 (40 lb/ft3) bulkdensity, results in the rapid approach of gas and solids temperaturesnear the bottom of the bed. Equalization of gas and solids tempera-tures generally occurs within 2 to 10 cm (1 to 4 in) of the top of the dis-tributor.
FLUIDIZED-BED SYSTEMS 17-11
FIG. 17-16 Reducing scale-up loss. (From Krambeck, Avidan, Lee, and Lo, A.I.Ch.E.J.,1727–1734, 1987.)
Bed thermal conductivities in the vertical direction have been mea-sured in the laboratory in the range of 40 to 60 kJ/(m2⋅s⋅K) [20,000 to30,000 Btu/(h⋅ft2⋅°F⋅ ft)]. Horizontal conductivities for 3-mm (0.12-in)particles in the range of 2 kJ/(m2⋅s⋅K) [1000 Btu/(h⋅ft2⋅°F⋅ft)] havebeen measured in large-scale experiments. Except for extreme L/Dratios, the temperature in the fluidized bed is uniform—with the tem-perature at any point in the bed generally being within 5 K (10°F) ofany other point.
Temperature Control Because of the rapid equalization of tem-peratures in fluidized beds, temperature control can be accomplishedin a number of ways.
1. Adiabatic. Control gas flow and/or solids feed rate so that theheat of reaction is removed as sensible heat in off gases and solids orheat supplied by gases or solids.
2. Solids circulation. Remove or add heat by circulating solids.3. Gas circulation. Recycle gas through heat exchangers to cool
or heat.4. Liquid injection. Add volatile liquid so that the latent heat of
vaporization equals excess energy.5. Cooling or heating surfaces in bed.Solids Mixing Solids are mixed in fluidized beds by means of
solids entrained in the lower portion of bubbles, and the shedding ofthese solids from the wake of the bubble (Rowe and Patridge, “Parti-cle Movement Caused by Bubbles in a Fluidized Bed,” Third Con-gress of European Federation of Chemical Engineering, London,1962). Thus, no mixing will occur at incipient fluidization, and mixingincreases as the gas rate is increased. Naturally, particles brought tothe top of the bed must displace particles toward the bottom of thebed. Generally, solids upflow is upward in the center of the bed anddownward at the wall.
At high ratios of fluidizing velocity to minimum fluidizing velocity,tremendous solids circulation from top to bottom of the bed assuresrapid mixing of the solids. For all practical purposes, beds with L/Dratios of from 4 to 0.1 can be considered to be completely mixed continuous-reaction vessels insofar as the solids are concerned.
Batch mixing using fluidization has been successfully employed inmany industries. In this case there is practically no limitation to vesseldimensions.
All the foregoing pertains to solids of approximately the same phys-ical characteristics. There is evidence that solids of widely differentcharacteristics will classify one from the other at certain gas flow rates[Geldart, Baeyens, Pope, and van de Wijer, Powder Technol., 30(2),195 (1981)]. Two fluidized beds, one on top of the other, may beformed, or a lower static bed with a fluidized bed above may result.The latter frequently occurs when agglomeration takes place becauseof either fusion in the bed or poor dispersion of sticky feed solids.Increased gas flows sometimes overcome the problem; however,improved feeding techniques or a change in operating conditions maybe required. Another solution is to remove agglomerates either con-tinuously or periodically from the bottom of the bed.
Gas Mixing The mixing of gases as they pass vertically upthrough the bed has never been considered a problem. However, hor-izontal mixing is very poor and requires effective distributors if twogases are to be mixed in the fluidized bed.
In bubbling beds operated at velocities of less than about 5 to 11times Umf the gases will flow upward in both the emulsion and thebubble phases. At velocities greater than about 5 to 11 times Umf thedownward velocity of the emulsion phase is sufficient to carry the con-tained gas downward. The back mixing of gases increases as U/Umf isincreased until the circulating or fast regime is reached where theback mixing decreases as the velocity is further increased.
Size Enlargement Under proper conditions, solid particles canbe caused to increase in size in the bed. This can be advantageous ordisadvantageous. Particle growth is usually associated with the melt-ing or softening of some portion of the bed material (i.e., addition ofsoda ash to calcium carbonate feed in lime reburning, tars in flu-idized-bed coking, or lead or zinc roasting causes agglomeration of dryparticles in much the same way as binders act in rotary pelletizers).The motion of the particles, one against the other, in the bed results inspherical pellets. If the size of these particles is not controlled, rapidagglomeration and segregation of the large particles from the bed will
17-12 GAS-SOLID OPERATIONS AND EQUIPMENT
occur. Control of agglomeration can be achieved by crushing a portionof the bed product and recycling it to form nuclei for new growth.Often, liquids or slurries are fed via a spray nozzle into the bed tocause particles to grow. In drying solutions or slurries of solutions, thelocation of the feed injection nozzle (spray nozzle) has a great effecton the size of particle that is formed in the bed. Also of importance arethe operating temperature, relative humidity of the off-gas, and gasvelocity in the bed. Particle growth can occur as agglomeration (two ormore particles sticking together) or by the particle growing in layers,often called onion skinning.
Size Reduction Attrition is the term describing particle reduc-tion in the fluidized bed. Three major attrition mechanisms occur inthe fluidized bed: particle fragmentation, particle fracture, and parti-cle thermal decrepitation. Particle fragmentation occurs when theprotruding edges on individual particles are broken off in the bed.These particle fragments are very small—usually on the order of 2 to10 µm. Particle fracture occurs when particle interaction is severeenough to cause the particles to break up into large individual pieces.
Because of the random motion of the solids, some abrasion of thesurface occurs in the bed. However, this abrasion is very small relativeto the particle breakup caused by the high-velocity jets at the distrib-utor. Typically, particle abrasion (fragmentation) will amount to about0.25 to 1 percent of the solids per day. In the area of high gas veloci-ties at the distributor, greater rates of attrition will occur because offracture of the particles by impact. As mentioned above, particle frac-ture of the grid is reduced by adding shrouds to the gas distributor.
Generally, particle attrition is unwanted. However, at times con-trolled attrition is desirable. For example, in coking units whereagglomeration due to wet particles is frequent, jets are used to attritparticles to control particle size [Dunlop, Griffin, and Moser, J. Chem.Eng. Prog. 54:39–43 (1958)].
Thermal decrepitation occurs frequently when crystals arerearranged because of transition from one form to another, or whennew compounds are formed (i.e., calcination of limestone). Some-times the stresses on particles in cases such as this are sufficient toreduce the particle to the basic crystal size. All these mechanisms willcause completion of fractures that were started before the introduc-tion of the solids into the fluidized bed.
Standpipes, Solids Feeders, and Solids Flow Control In afluid catalytic cracking (FCC) unit, hot catalyst is added to aspiratedcrude oil feed in a riser to crack the feed oil into gasoline and otherlight and heavy hydrocarbons. The catalyst activity is reduced by thiscontact as carbon is deposited on the catalyst. The catalyst is thenpassed through a steam stripper to remove the gas product in theinterstices of the catalyst and is transported to a regenerator. The car-bon on the catalyst is burned off in the fluidized-bed regenerator, andthen the regenerated, hot catalyst is transported back to the bottom ofthe riser to crack the feed oil. Large FCC units have to control solidsflow rates from 10 to 80 tons/min. The units require makeup catalystto be added to replace solids losses due to attrition, etc. The amountof catalyst makeup is small, and need not be continuous. Therefore,the makeup catalyst is fed into the commercial unit from pressurizedhoppers into one of the conveying lines. However, the primary solidsflow control problem in this FCC unit is to maintain the correct tem-perature in the riser reactor by controlling the flow of hot regeneratedcatalyst around the test unit. This is done by using large, 1.2-m (4-ft)-diameter slide valves (also known as knife-gate valves) located instandpipes to control the flow rates of catalyst.
In the FCC process, the solids are transferred out of the fluidized-bed regenerator into the bottom of the riser via a standpipe. The pur-pose of a standpipe is to transfer solids from a low-pressure region toa high-pressure region. The point of removal of the solids from theregenerator bed is at a lower pressure than the point of feed introduc-tion into the riser. Therefore, the transfer of solids from the regenera-tor bed to the bottom of the riser is accomplished with a standpipe.The standpipes in FCC units can be as large as 1.5 m (5 ft) in diame-ter and as long as about 30 m (100 ft). They can be either vertical orangled (generally approximately 60° from the horizontal). The pres-sure is higher at the bottom of a standpipe due to the relative flow ofgas counter to the solids flow. The gas in the standpipe may be flowingeither downward relative to the pipe wall but more slowly than the
solids (the most common occurrence) or upward. The standpipe maybe fluidized, or the solids may be in moving packed bed flow.
Fluidized standpipes can accommodate a much higher solids flowrate than moving packed bed standpipes because the friction of thesolids flow on the wall of the standpipe is much less in fluidized stand-pipes. In longer standpipes, the pressure gain over the length of thestandpipe is so great that it compresses the gas relative to the conditionsat the standpipe inlet. This gas “shrinkage” can cause the gas in andaround the particles to compress, which can result in defluidization ofthe solids in the standpipe unless aeration gas is added to the standpipeto replace the gas volume lost via compression. If the solids defluidize,the flow regime will revert to a moving packed bed with a lower pressuregain across the standpipe. In standpipes operating with group B solids,aeration is added to replace the compressed volume approximately every1.5 m along the standpipe. In standpipes operating with group A solids,it has been found that aeration is only required at the bottom of thestandpipe. Typically, the pressure drop across the solids control valve inthe standpipe should be designed for a minimum of approximately 2 psi(14 kPa) for good control. A maximum of no more than 10 to 12 psi (70to 84 kPa) is recommended to prevent excessive erosion of the valve athigh pressure drops [Zenz, Powder Technol. pp. 105–113 (1986)].
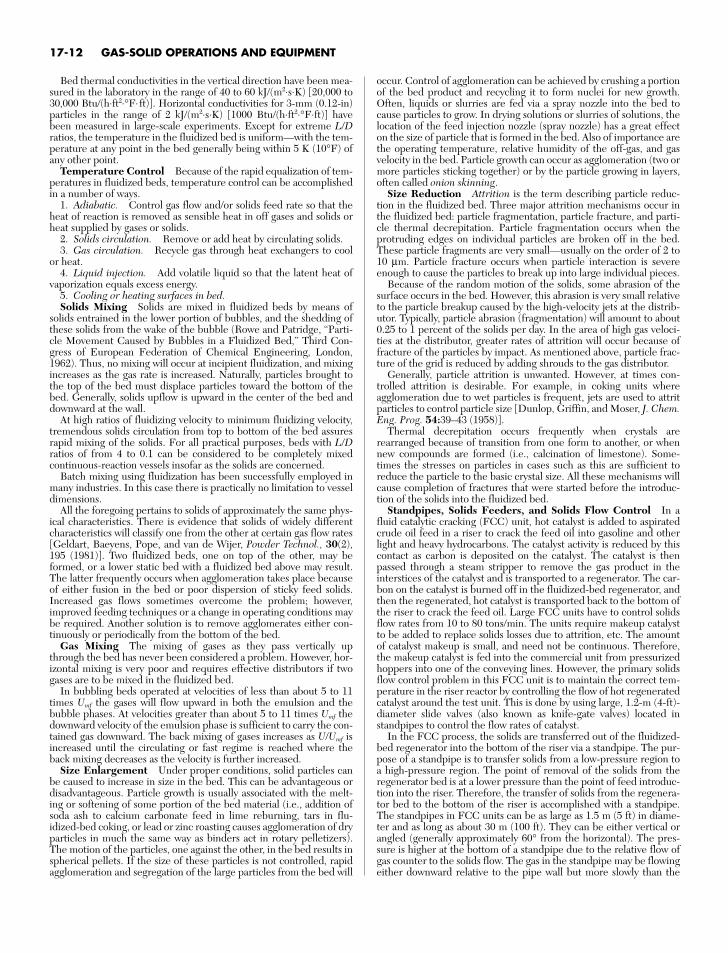
Several designs of valves for solids flow control are used. Theseshould be chosen with care to suit the specific conditions. Usually,block valves are used in conjunction with the control valves. Figure17-17 shows schematically some of the devices used for solids flowcontrol. Not shown in Fig. 17-17 is the flow-control arrangement usedin the Exxon Research & Engineering Co. model IV catalytic-crackingunits. This device consists of a U bend. A variable portion of regener-ating air is injected into the riser leg. Changes in air-injection ratechange the fluid density in the riser and thereby achieve control of thesolids flow rate. Catalyst circulation rates of 1200 kg/s (70 tons/min)have been reported.
When the solid is one of the reactants, such as in ore roasting, theflow must be continuous and precise in order to maintain constantconditions in the reactor. Feeding of free-flowing granular solids intoa fluidized bed is not difficult. Standard commercially available solids-weighing and -conveying equipment can be used to control the rateand deliver the solids to the feeder. Screw conveyors, dip pipes, seallegs, and injectors are used to introduce the solids into the reactorproper (Fig. 17-17). Difficulties arise and special techniques must be used when the solids are not free-flowing, such as is the case withmost filter cakes. One solution to this problem was developed atCochenour-Willans. After much difficulty in attempting to feed a wetand sometimes frozen filter cake into the reactor by means of a screwfeeder, experimental feeding of a water slurry of flotation concen-trates was attempted. This trial was successful, and this method hasbeen used in almost all cases in which the heat balance, particle size ofsolids, and other considerations have permitted. Gilfillan et al. ( J.Chem. Metall. Min. Soc. S. Afr., May 1954) and Soloman and Beal(Uranium in South Africa, 1946–56) present complete details on theuse of this system for feeding.
When slurry feeding is impractical, recycling of solids productto mix with the feed, both to dry and to achieve a better-handling
FLUIDIZED-BED SYSTEMS 17-13
material, has been used successfully. Also, the use of a rotary tablefeeder mounted on top of the reactor, discharging through a mechan-ical disintegrator, has been successful. The wet solids generally mustbe broken up into discrete particles of very fine agglomerates eitherby mechanical action before entering the bed or by rapidly vaporizingwater. If lumps of dry or semidry solids are fed, the agglomerates donot break up but tend to fuse together. As the size of the agglomerateis many times the size of the largest individual particle, these agglom-erates will segregate out of the bed, and in time the whole of the flu-idized bed may be replaced with a static bed of agglomerates.
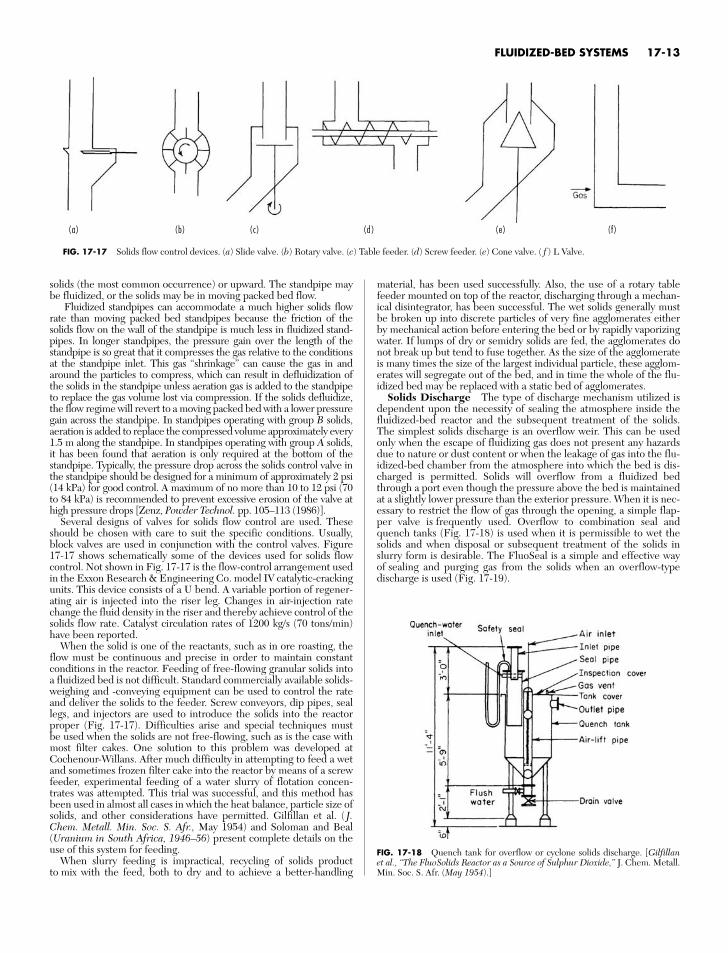
Solids Discharge The type of discharge mechanism utilized isdependent upon the necessity of sealing the atmosphere inside thefluidized-bed reactor and the subsequent treatment of the solids.The simplest solids discharge is an overflow weir. This can be usedonly when the escape of fluidizing gas does not present any hazardsdue to nature or dust content or when the leakage of gas into the flu-idized-bed chamber from the atmosphere into which the bed is dis-charged is permitted. Solids will overflow from a fluidized bedthrough a port even though the pressure above the bed is maintainedat a slightly lower pressure than the exterior pressure. When it is nec-essary to restrict the flow of gas through the opening, a simple flap-per valve is frequently used. Overflow to combination seal andquench tanks (Fig. 17-18) is used when it is permissible to wet thesolids and when disposal or subsequent treatment of the solids inslurry form is desirable. The FluoSeal is a simple and effective wayof sealing and purging gas from the solids when an overflow-typedischarge is used (Fig. 17-19).
FIG. 17-17 Solids flow control devices. (a) Slide valve. (b) Rotary valve. (c) Table feeder. (d) Screw feeder. (e) Cone valve. ( f ) L Valve.
FIG. 17-18 Quench tank for overflow or cyclone solids discharge. [Gilfillanet al., “The FluoSolids Reactor as a Source of Sulphur Dioxide,” J. Chem. Metall.Min. Soc. S. Afr. (May 1954).]
(a) (b) (c) (d ) (e) (f)
Either trickle (flapper) or star (rotary) valves are effective sealingdevices for solids discharge. Each functions with a head of solidsabove it. Bottom of the bed discharge is also acceptable via a slidevalve with a head of solids.
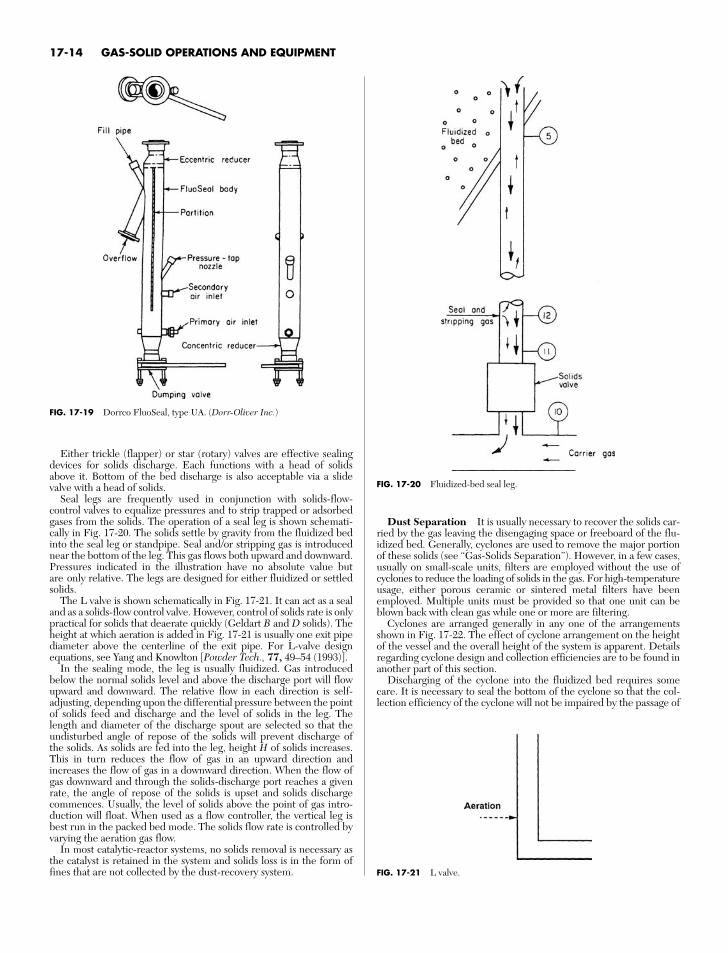
Seal legs are frequently used in conjunction with solids-flow-control valves to equalize pressures and to strip trapped or adsorbedgases from the solids. The operation of a seal leg is shown schemati-cally in Fig. 17-20. The solids settle by gravity from the fluidized bedinto the seal leg or standpipe. Seal and/or stripping gas is introducednear the bottom of the leg. This gas flows both upward and downward.Pressures indicated in the illustration have no absolute value butare only relative. The legs are designed for either fluidized or settledsolids.
The L valve is shown schematically in Fig. 17-21. It can act as a sealand as a solids-flow control valve. However, control of solids rate is onlypractical for solids that deaerate quickly (Geldart B and D solids). Theheight at which aeration is added in Fig. 17-21 is usually one exit pipediameter above the centerline of the exit pipe. For L-valve designequations, see Yang and Knowlton [Powder Tech., 77, 49–54 (1993)].
In the sealing mode, the leg is usually fluidized. Gas introducedbelow the normal solids level and above the discharge port will flowupward and downward. The relative flow in each direction is self-adjusting, depending upon the differential pressure between the pointof solids feed and discharge and the level of solids in the leg. Thelength and diameter of the discharge spout are selected so that theundisturbed angle of repose of the solids will prevent discharge of the solids. As solids are fed into the leg, height H of solids increases.This in turn reduces the flow of gas in an upward direction andincreases the flow of gas in a downward direction. When the flow ofgas downward and through the solids-discharge port reaches a givenrate, the angle of repose of the solids is upset and solids dischargecommences. Usually, the level of solids above the point of gas intro-duction will float. When used as a flow controller, the vertical leg isbest run in the packed bed mode. The solids flow rate is controlled byvarying the aeration gas flow.
In most catalytic-reactor systems, no solids removal is necessary asthe catalyst is retained in the system and solids loss is in the form offines that are not collected by the dust-recovery system.
17-14 GAS-SOLID OPERATIONS AND EQUIPMENT
Dust Separation It is usually necessary to recover the solids car-ried by the gas leaving the disengaging space or freeboard of the flu-idized bed. Generally, cyclones are used to remove the major portionof these solids (see “Gas-Solids Separation”). However, in a few cases,usually on small-scale units, filters are employed without the use ofcyclones to reduce the loading of solids in the gas. For high-temperatureusage, either porous ceramic or sintered metal filters have beenemployed. Multiple units must be provided so that one unit can beblown back with clean gas while one or more are filtering.
Cyclones are arranged generally in any one of the arrangementsshown in Fig. 17-22. The effect of cyclone arrangement on the heightof the vessel and the overall height of the system is apparent. Detailsregarding cyclone design and collection efficiencies are to be found inanother part of this section.
Discharging of the cyclone into the fluidized bed requires somecare. It is necessary to seal the bottom of the cyclone so that the col-lection efficiency of the cyclone will not be impaired by the passage of
FIG. 17-19 Dorrco FluoSeal, type UA. (Dorr-Oliver Inc.)
FIG. 17-20 Fluidized-bed seal leg.
FIG. 17-21 L valve.
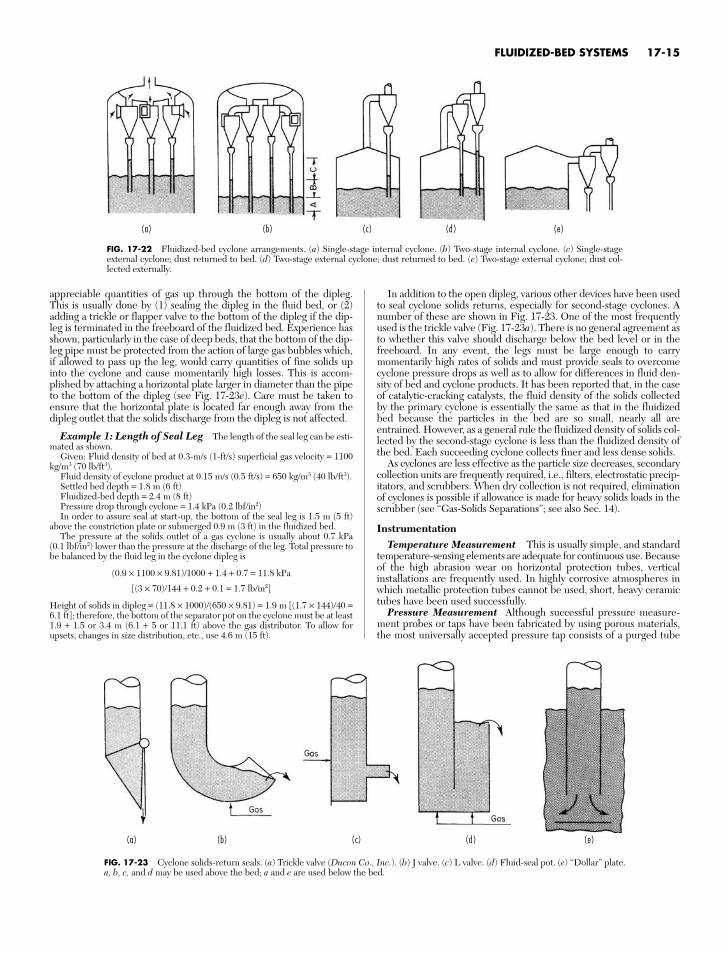
appreciable quantities of gas up through the bottom of the dipleg.This is usually done by (1) sealing the dipleg in the fluid bed, or (2)adding a trickle or flapper valve to the bottom of the dipleg if the dip-leg is terminated in the freeboard of the fluidized bed. Experience hasshown, particularly in the case of deep beds, that the bottom of the dip-leg pipe must be protected from the action of large gas bubbles which,if allowed to pass up the leg, would carry quantities of fine solids upinto the cyclone and cause momentarily high losses. This is accom-plished by attaching a horizontal plate larger in diameter than the pipeto the bottom of the dipleg (see Fig. 17-23e). Care must be taken toensure that the horizontal plate is located far enough away from thedipleg outlet that the solids discharge from the dipleg is not affected.
Example 1: Length of Seal Leg The length of the seal leg can be esti-mated as shown.
Given: Fluid density of bed at 0.3-m/s (1-ft/s) superficial gas velocity = 1100kg/m3 (70 lb/ft3).
Fluid density of cyclone product at 0.15 m/s (0.5 ft/s) = 650 kg/m3 (40 lb/ft3).Settled bed depth = 1.8 m (6 ft)Fluidized-bed depth = 2.4 m (8 ft)Pressure drop through cyclone = 1.4 kPa (0.2 lbf/in2)In order to assure seal at start-up, the bottom of the seal leg is 1.5 m (5 ft)
above the constriction plate or submerged 0.9 m (3 ft) in the fluidized bed.The pressure at the solids outlet of a gas cyclone is usually about 0.7 kPa
(0.1 lbf/in2) lower than the pressure at the discharge of the leg. Total pressure tobe balanced by the fluid leg in the cyclone dipleg is
(0.9 × 1100 × 9.81)/1000 + 1.4 + 0.7 = 11.8 kPa
[(3 × 70)/144 + 0.2 + 0.1 = 1.7 lb/in2]
Height of solids in dipleg = (11.8 × 1000)/(650 × 9.81) = 1.9 m [(1.7 × 144)/40 =6.1 ft]; therefore, the bottom of the separator pot on the cyclone must be at least1.9 + 1.5 or 3.4 m (6.1 + 5 or 11.1 ft) above the gas distributor. To allow forupsets, changes in size distribution, etc., use 4.6 m (15 ft).
In addition to the open dipleg, various other devices have been usedto seal cyclone solids returns, especially for second-stage cyclones. Anumber of these are shown in Fig. 17-23. One of the most frequentlyused is the trickle valve (Fig. 17-23a). There is no general agreement asto whether this valve should discharge below the bed level or in thefreeboard. In any event, the legs must be large enough to carrymomentarily high rates of solids and must provide seals to overcomecyclone pressure drops as well as to allow for differences in fluid den-sity of bed and cyclone products. It has been reported that, in the caseof catalytic-cracking catalysts, the fluid density of the solids collectedby the primary cyclone is essentially the same as that in the fluidizedbed because the particles in the bed are so small, nearly all areentrained. However, as a general rule the fluidized density of solids col-lected by the second-stage cyclone is less than the fluidized density ofthe bed. Each succeeding cyclone collects finer and less dense solids.
As cyclones are less effective as the particle size decreases, secondarycollection units are frequently required, i.e., filters, electrostatic precip-itators, and scrubbers. When dry collection is not required, eliminationof cyclones is possible if allowance is made for heavy solids loads in thescrubber (see “Gas-Solids Separations”; see also Sec. 14).
InstrumentationTemperature Measurement This is usually simple, and standard
temperature-sensing elements are adequate for continuous use. Becauseof the high abrasion wear on horizontal protection tubes, verticalinstallations are frequently used. In highly corrosive atmospheres inwhich metallic protection tubes cannot be used, short, heavy ceramictubes have been used successfully.
Pressure Measurement Although successful pressure measure-ment probes or taps have been fabricated by using porous materials,the most universally accepted pressure tap consists of a purged tube
FLUIDIZED-BED SYSTEMS 17-15
FIG. 17-22 Fluidized-bed cyclone arrangements. (a) Single-stage internal cyclone. (b) Two-stage internal cyclone. (c) Single-stageexternal cyclone; dust returned to bed. (d) Two-stage external cyclone; dust returned to bed. (e) Two-stage external cyclone; dust col-lected externally.
FIG. 17-23 Cyclone solids-return seals. (a) Trickle valve (Ducon Co., Inc.). (b) J valve. (c) L valve. (d) Fluid-seal pot. (e) “Dollar” plate.a, b, c, and d may be used above the bed; a and e are used below the bed.
(a) (b) (c) (d ) (e)
(a) (b) (c) (d ) (e)
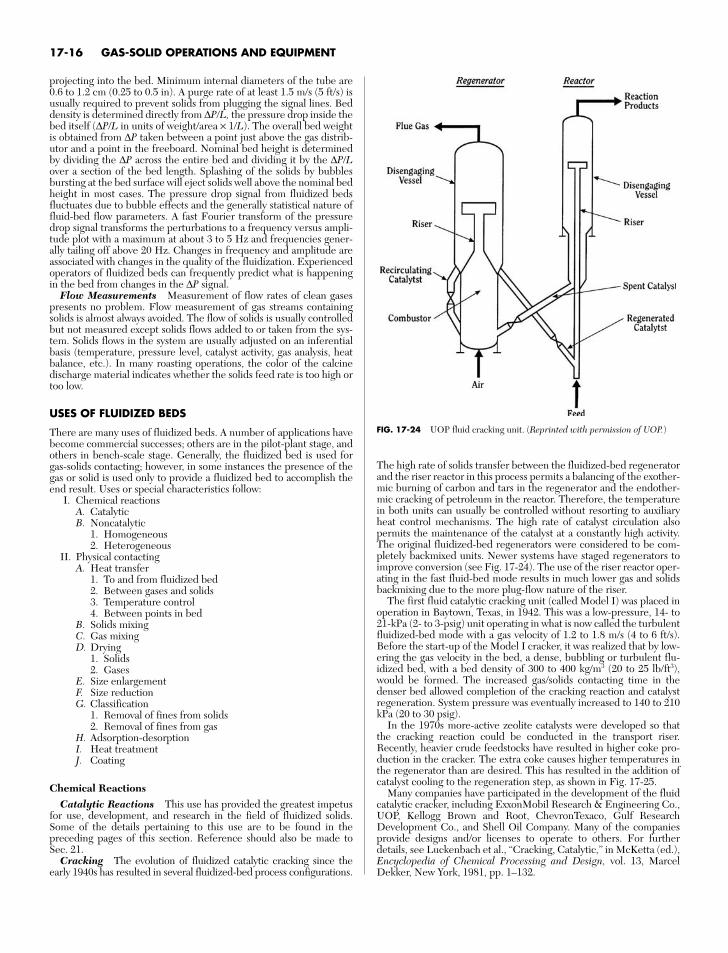
projecting into the bed. Minimum internal diameters of the tube are0.6 to 1.2 cm (0.25 to 0.5 in). A purge rate of at least 1.5 m/s (5 ft/s) isusually required to prevent solids from plugging the signal lines. Beddensity is determined directly from ∆P/L, the pressure drop inside thebed itself (∆P/L in units of weight/area × 1/L). The overall bed weightis obtained from ∆P taken between a point just above the gas distrib-utor and a point in the freeboard. Nominal bed height is determinedby dividing the ∆P across the entire bed and dividing it by the ∆P/Lover a section of the bed length. Splashing of the solids by bubblesbursting at the bed surface will eject solids well above the nominal bedheight in most cases. The pressure drop signal from fluidized bedsfluctuates due to bubble effects and the generally statistical nature offluid-bed flow parameters. A fast Fourier transform of the pressuredrop signal transforms the perturbations to a frequency versus ampli-tude plot with a maximum at about 3 to 5 Hz and frequencies gener-ally tailing off above 20 Hz. Changes in frequency and amplitude areassociated with changes in the quality of the fluidization. Experiencedoperators of fluidized beds can frequently predict what is happeningin the bed from changes in the ∆P signal.
Flow Measurements Measurement of flow rates of clean gasespresents no problem. Flow measurement of gas streams containingsolids is almost always avoided. The flow of solids is usually controlledbut not measured except solids flows added to or taken from the sys-tem. Solids flows in the system are usually adjusted on an inferentialbasis (temperature, pressure level, catalyst activity, gas analysis, heatbalance, etc.). In many roasting operations, the color of the calcinedischarge material indicates whether the solids feed rate is too high ortoo low.
USES OF FLUIDIZED BEDS
There are many uses of fluidized beds. A number of applications havebecome commercial successes; others are in the pilot-plant stage, andothers in bench-scale stage. Generally, the fluidized bed is used forgas-solids contacting; however, in some instances the presence of thegas or solid is used only to provide a fluidized bed to accomplish theend result. Uses or special characteristics follow:
I. Chemical reactionsA. CatalyticB. Noncatalytic
1. Homogeneous2. Heterogeneous
II. Physical contactingA. Heat transfer
1. To and from fluidized bed2. Between gases and solids3. Temperature control4. Between points in bed
B. Solids mixingC. Gas mixingD. Drying
1. Solids2. Gases
E. Size enlargementF. Size reductionG. Classification
1. Removal of fines from solids2. Removal of fines from gas
H. Adsorption-desorptionI. Heat treatmentJ. Coating
Chemical ReactionsCatalytic Reactions This use has provided the greatest impetus
for use, development, and research in the field of fluidized solids.Some of the details pertaining to this use are to be found in the preceding pages of this section. Reference should also be made to Sec. 21.
Cracking The evolution of fluidized catalytic cracking since theearly 1940s has resulted in several fluidized-bed process configurations.
The high rate of solids transfer between the fluidized-bed regeneratorand the riser reactor in this process permits a balancing of the exother-mic burning of carbon and tars in the regenerator and the endother-mic cracking of petroleum in the reactor. Therefore, the temperaturein both units can usually be controlled without resorting to auxiliaryheat control mechanisms. The high rate of catalyst circulation alsopermits the maintenance of the catalyst at a constantly high activity.The original fluidized-bed regenerators were considered to be com-pletely backmixed units. Newer systems have staged regenerators toimprove conversion (see Fig. 17-24). The use of the riser reactor oper-ating in the fast fluid-bed mode results in much lower gas and solidsbackmixing due to the more plug-flow nature of the riser.
The first fluid catalytic cracking unit (called Model I) was placed inoperation in Baytown, Texas, in 1942. This was a low-pressure, 14- to21-kPa (2- to 3-psig) unit operating in what is now called the turbulentfluidized-bed mode with a gas velocity of 1.2 to 1.8 m/s (4 to 6 ft/s).Before the start-up of the Model I cracker, it was realized that by low-ering the gas velocity in the bed, a dense, bubbling or turbulent flu-idized bed, with a bed density of 300 to 400 kg/m3 (20 to 25 lb/ft3),would be formed. The increased gas/solids contacting time in thedenser bed allowed completion of the cracking reaction and catalystregeneration. System pressure was eventually increased to 140 to 210kPa (20 to 30 psig).
In the 1970s more-active zeolite catalysts were developed so thatthe cracking reaction could be conducted in the transport riser.Recently, heavier crude feedstocks have resulted in higher coke pro-duction in the cracker. The extra coke causes higher temperatures inthe regenerator than are desired. This has resulted in the addition ofcatalyst cooling to the regeneration step, as shown in Fig. 17-25.
Many companies have participated in the development of the fluidcatalytic cracker, including ExxonMobil Research & Engineering Co.,UOP, Kellogg Brown and Root, ChevronTexaco, Gulf ResearchDevelopment Co., and Shell Oil Company. Many of the companiesprovide designs and/or licenses to operate to others. For furtherdetails, see Luckenbach et al., “Cracking, Catalytic,” in McKetta (ed.),Encyclopedia of Chemical Processing and Design, vol. 13, MarcelDekker, New York, 1981, pp. 1–132.
17-16 GAS-SOLID OPERATIONS AND EQUIPMENT
FIG. 17-24 UOP fluid cracking unit. (Reprinted with permission of UOP.)
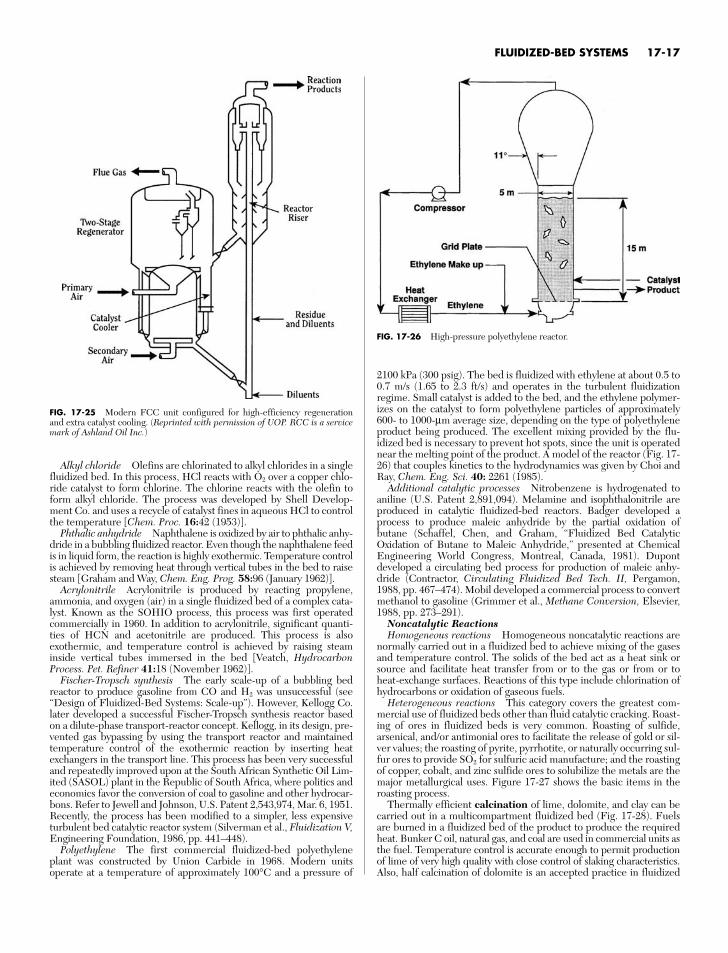
Alkyl chloride Olefins are chlorinated to alkyl chlorides in a singlefluidized bed. In this process, HCl reacts with O2 over a copper chlo-ride catalyst to form chlorine. The chlorine reacts with the olefin toform alkyl chloride. The process was developed by Shell Develop-ment Co. and uses a recycle of catalyst fines in aqueous HCl to controlthe temperature [Chem. Proc. 16:42 (1953)].
Phthalic anhydride Naphthalene is oxidized by air to phthalic anhy-dride in a bubbling fluidized reactor. Even though the naphthalene feedis in liquid form, the reaction is highly exothermic. Temperature controlis achieved by removing heat through vertical tubes in the bed to raisesteam [Graham and Way, Chem. Eng. Prog. 58:96 (January 1962)].
Acrylonitrile Acrylonitrile is produced by reacting propylene,ammonia, and oxygen (air) in a single fluidized bed of a complex cata-lyst. Known as the SOHIO process, this process was first operatedcommercially in 1960. In addition to acrylonitrile, significant quanti-ties of HCN and acetonitrile are produced. This process is alsoexothermic, and temperature control is achieved by raising steaminside vertical tubes immersed in the bed [Veatch, HydrocarbonProcess. Pet. Refiner 41:18 (November 1962)].
Fischer-Tropsch synthesis The early scale-up of a bubbling bedreactor to produce gasoline from CO and H2 was unsuccessful (see“Design of Fluidized-Bed Systems: Scale-up”). However, Kellogg Co.later developed a successful Fischer-Tropsch synthesis reactor basedon a dilute-phase transport-reactor concept. Kellogg, in its design, pre-vented gas bypassing by using the transport reactor and maintainedtemperature control of the exothermic reaction by inserting heatexchangers in the transport line. This process has been very successfuland repeatedly improved upon at the South African Synthetic Oil Lim-ited (SASOL) plant in the Republic of South Africa, where politics andeconomics favor the conversion of coal to gasoline and other hydrocar-bons. Refer to Jewell and Johnson, U.S. Patent 2,543,974, Mar. 6, 1951.Recently, the process has been modified to a simpler, less expensiveturbulent bed catalytic reactor system (Silverman et al., Fluidization V,Engineering Foundation, 1986, pp. 441–448).
Polyethylene The first commercial fluidized-bed polyethyleneplant was constructed by Union Carbide in 1968. Modern unitsoperate at a temperature of approximately 100°C and a pressure of
2100 kPa (300 psig). The bed is fluidized with ethylene at about 0.5 to0.7 m/s (1.65 to 2.3 ft/s) and operates in the turbulent fluidizationregime. Small catalyst is added to the bed, and the ethylene polymer-izes on the catalyst to form polyethylene particles of approximately600- to 1000-µm average size, depending on the type of polyethyleneproduct being produced. The excellent mixing provided by the flu-idized bed is necessary to prevent hot spots, since the unit is operatednear the melting point of the product. A model of the reactor (Fig. 17-26) that couples kinetics to the hydrodynamics was given by Choi andRay, Chem. Eng. Sci. 40: 2261 (1985).
Additional catalytic processes Nitrobenzene is hydrogenated toaniline (U.S. Patent 2,891,094). Melamine and isophthalonitrile areproduced in catalytic fluidized-bed reactors. Badger developed aprocess to produce maleic anhydride by the partial oxidation ofbutane (Schaffel, Chen, and Graham, “Fluidized Bed CatalyticOxidation of Butane to Maleic Anhydride,” presented at ChemicalEngineering World Congress, Montreal, Canada, 1981). Dupontdeveloped a circulating bed process for production of maleic anhy-dride (Contractor, Circulating Fluidized Bed Tech. II, Pergamon,1988, pp. 467–474). Mobil developed a commercial process to convertmethanol to gasoline (Grimmer et al., Methane Conversion, Elsevier,1988, pp. 273–291).
Noncatalytic ReactionsHomogeneous reactions Homogeneous noncatalytic reactions are
normally carried out in a fluidized bed to achieve mixing of the gasesand temperature control. The solids of the bed act as a heat sink orsource and facilitate heat transfer from or to the gas or from or toheat-exchange surfaces. Reactions of this type include chlorination ofhydrocarbons or oxidation of gaseous fuels.
Heterogeneous reactions This category covers the greatest com-mercial use of fluidized beds other than fluid catalytic cracking. Roast-ing of ores in fluidized beds is very common. Roasting of sulfide,arsenical, and/or antimonial ores to facilitate the release of gold or sil-ver values; the roasting of pyrite, pyrrhotite, or naturally occurring sul-fur ores to provide SO2 for sulfuric acid manufacture; and the roastingof copper, cobalt, and zinc sulfide ores to solubilize the metals are themajor metallurgical uses. Figure 17-27 shows the basic items in theroasting process.
Thermally efficient calcination of lime, dolomite, and clay can becarried out in a multicompartment fluidized bed (Fig. 17-28). Fuelsare burned in a fluidized bed of the product to produce the requiredheat. Bunker C oil, natural gas, and coal are used in commercial units asthe fuel. Temperature control is accurate enough to permit productionof lime of very high quality with close control of slaking characteristics.Also, half calcination of dolomite is an accepted practice in fluidized
FLUIDIZED-BED SYSTEMS 17-17
FIG. 17-25 Modern FCC unit configured for high-efficiency regenerationand extra catalyst cooling. (Reprinted with permission of UOP. RCC is a servicemark of Ashland Oil Inc.)
FIG. 17-26 High-pressure polyethylene reactor.
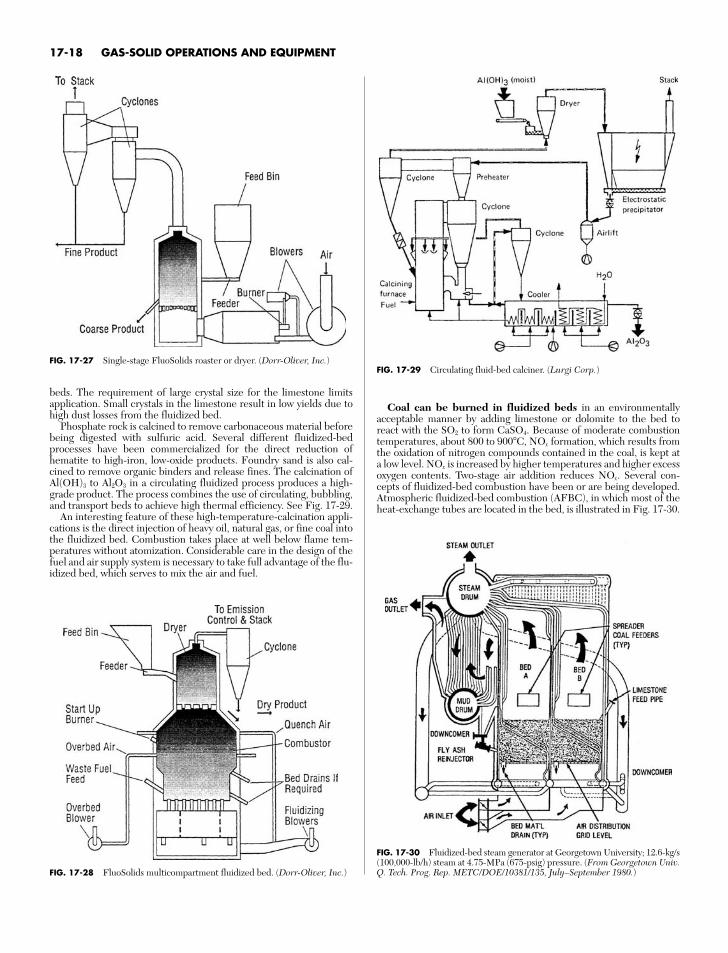
beds. The requirement of large crystal size for the limestone limitsapplication. Small crystals in the limestone result in low yields due tohigh dust losses from the fluidized bed.
Phosphate rock is calcined to remove carbonaceous material beforebeing digested with sulfuric acid. Several different fluidized-bedprocesses have been commercialized for the direct reduction ofhematite to high-iron, low-oxide products. Foundry sand is also cal-cined to remove organic binders and release fines. The calcination ofAl(OH)3 to Al2O3 in a circulating fluidized process produces a high-grade product. The process combines the use of circulating, bubbling,and transport beds to achieve high thermal efficiency. See Fig. 17-29.
An interesting feature of these high-temperature-calcination appli-cations is the direct injection of heavy oil, natural gas, or fine coal intothe fluidized bed. Combustion takes place at well below flame tem-peratures without atomization. Considerable care in the design of thefuel and air supply system is necessary to take full advantage of the flu-idized bed, which serves to mix the air and fuel.
Coal can be burned in fluidized beds in an environmentallyacceptable manner by adding limestone or dolomite to the bed toreact with the SO2 to form CaSO4. Because of moderate combustiontemperatures, about 800 to 900!C, NOx formation, which results fromthe oxidation of nitrogen compounds contained in the coal, is kept ata low level. NOx is increased by higher temperatures and higher excessoxygen contents. Two-stage air addition reduces NOx. Several con-cepts of fluidized-bed combustion have been or are being developed.Atmospheric fluidized-bed combustion (AFBC), in which most of theheat-exchange tubes are located in the bed, is illustrated in Fig. 17-30.
17-18 GAS-SOLID OPERATIONS AND EQUIPMENT
FIG. 17-27 Single-stage FluoSolids roaster or dryer. (Dorr-Oliver, Inc.)FIG. 17-29 Circulating fluid-bed calciner. (Lurgi Corp.)
FIG. 17-28 FluoSolids multicompartment fluidized bed. (Dorr-Oliver, Inc.)
FIG. 17-30 Fluidized-bed steam generator at Georgetown University; 12.6-kg/s(100,000-lb/h) steam at 4.75-MPa (675-psig) pressure. (From Georgetown Univ.Q. Tech. Prog. Rep. METC/DOE/10381/135, July–September 1980.)
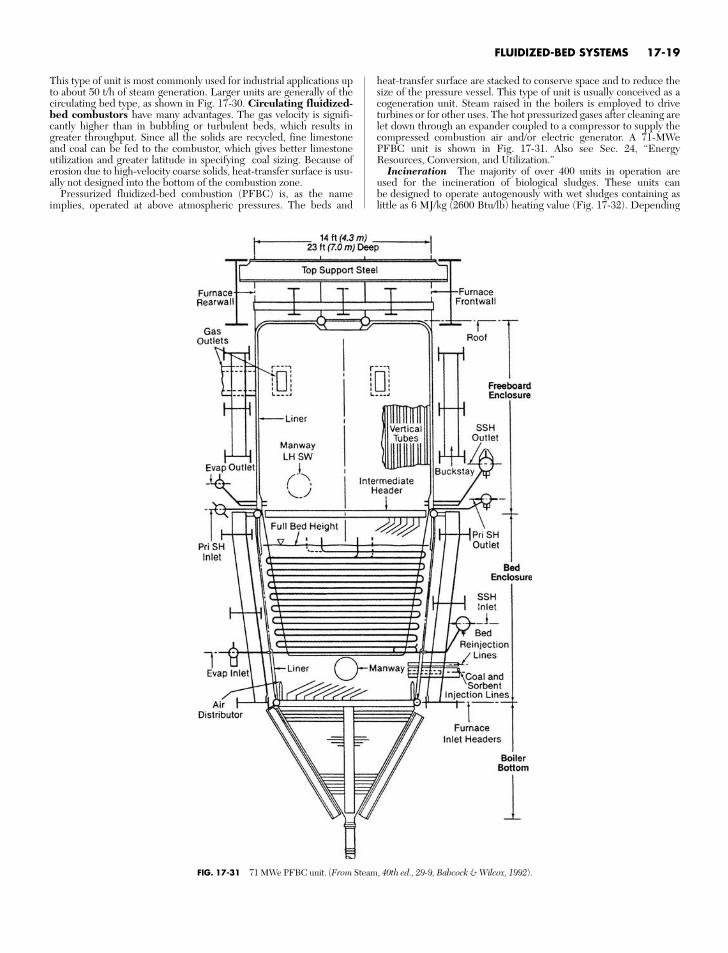
This type of unit is most commonly used for industrial applications upto about 50 t/h of steam generation. Larger units are generally of thecirculating bed type, as shown in Fig. 17-30. Circulating fluidized-bed combustors have many advantages. The gas velocity is signifi-cantly higher than in bubbling or turbulent beds, which results ingreater throughput. Since all the solids are recycled, fine limestoneand coal can be fed to the combustor, which gives better limestoneutilization and greater latitude in specifying coal sizing. Because oferosion due to high-velocity coarse solids, heat-transfer surface is usu-ally not designed into the bottom of the combustion zone.
Pressurized fluidized-bed combustion (PFBC) is, as the nameimplies, operated at above atmospheric pressures. The beds and
heat-transfer surface are stacked to conserve space and to reduce thesize of the pressure vessel. This type of unit is usually conceived as acogeneration unit. Steam raised in the boilers is employed to driveturbines or for other uses. The hot pressurized gases after cleaning arelet down through an expander coupled to a compressor to supply thecompressed combustion air and/or electric generator. A 71-MWePFBC unit is shown in Fig. 17-31. Also see Sec. 24, “EnergyResources, Conversion, and Utilization.”
Incineration The majority of over 400 units in operation areused for the incineration of biological sludges. These units canbe designed to operate autogenously with wet sludges containing aslittle as 6 MJ/kg (2600 Btu/lb) heating value (Fig. 17-32). Depending
FLUIDIZED-BED SYSTEMS 17-19
FIG. 17-31 71 MWe PFBC unit. (From Steam, 40th ed., 29-9, Babcock & Wilcox, 1992).
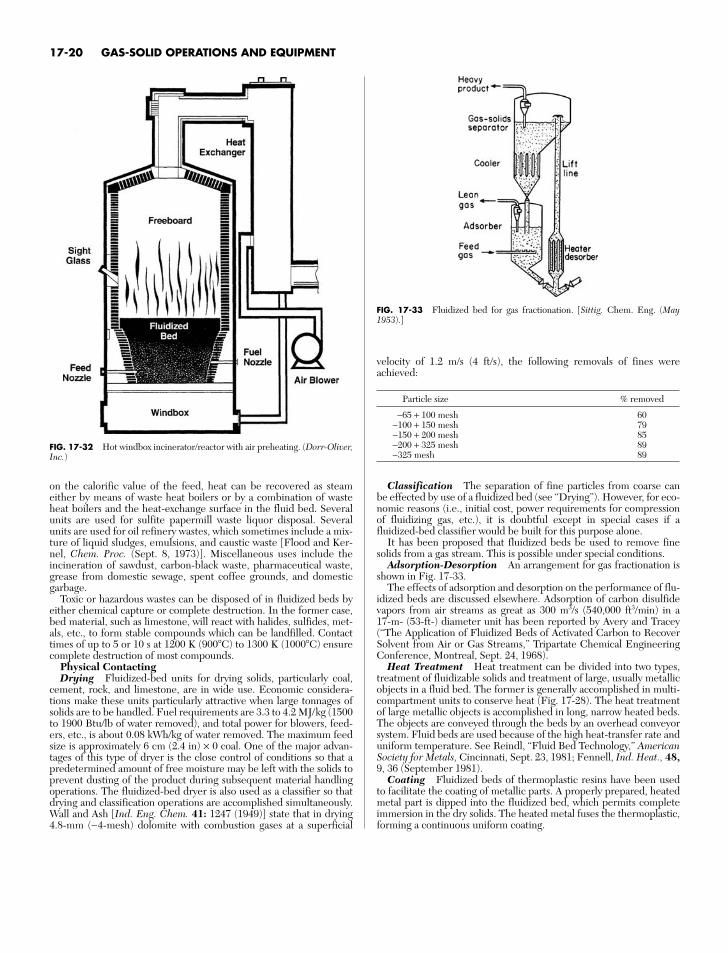
velocity of 1.2 m/s (4 ft/s), the following removals of fines wereachieved:
Particle size % removed
−65 + 100 mesh 60−100 + 150 mesh 79−150 + 200 mesh 85−200 + 325 mesh 89−325 mesh 89
Classification The separation of fine particles from coarse canbe effected by use of a fluidized bed (see “Drying”). However, for eco-nomic reasons (i.e., initial cost, power requirements for compressionof fluidizing gas, etc.), it is doubtful except in special cases if a fluidized-bed classifier would be built for this purpose alone.
It has been proposed that fluidized beds be used to remove finesolids from a gas stream. This is possible under special conditions.
Adsorption-Desorption An arrangement for gas fractionation isshown in Fig. 17-33.
The effects of adsorption and desorption on the performance of flu-idized beds are discussed elsewhere. Adsorption of carbon disulfidevapors from air streams as great as 300 m3/s (540,000 ft3/min) in a 17-m- (53-ft-) diameter unit has been reported by Avery and Tracey(“The Application of Fluidized Beds of Activated Carbon to RecoverSolvent from Air or Gas Streams,” Tripartate Chemical EngineeringConference, Montreal, Sept. 24, 1968).
Heat Treatment Heat treatment can be divided into two types,treatment of fluidizable solids and treatment of large, usually metallicobjects in a fluid bed. The former is generally accomplished in multi-compartment units to conserve heat (Fig. 17-28). The heat treatmentof large metallic objects is accomplished in long, narrow heated beds.The objects are conveyed through the beds by an overhead conveyorsystem. Fluid beds are used because of the high heat-transfer rate anduniform temperature. See Reindl, “Fluid Bed Technology,” AmericanSociety for Metals, Cincinnati, Sept. 23, 1981; Fennell, Ind. Heat., 48,9, 36 (September 1981).
Coating Fluidized beds of thermoplastic resins have been usedto facilitate the coating of metallic parts. A properly prepared, heatedmetal part is dipped into the fluidized bed, which permits completeimmersion in the dry solids. The heated metal fuses the thermoplastic,forming a continuous uniform coating.
17-20 GAS-SOLID OPERATIONS AND EQUIPMENT
FIG. 17-32 Hot windbox incinerator/reactor with air preheating. (Dorr-Oliver,Inc.)
FIG. 17-33 Fluidized bed for gas fractionation. [Sittig. Chem. Eng. (May1953).]
on the calorific value of the feed, heat can be recovered as steameither by means of waste heat boilers or by a combination of wasteheat boilers and the heat-exchange surface in the fluid bed. Severalunits are used for sulfite papermill waste liquor disposal. Severalunits are used for oil refinery wastes, which sometimes include a mix-ture of liquid sludges, emulsions, and caustic waste [Flood and Ker-nel, Chem. Proc. (Sept. 8, 1973)]. Miscellaneous uses include theincineration of sawdust, carbon-black waste, pharmaceutical waste,grease from domestic sewage, spent coffee grounds, and domesticgarbage.
Toxic or hazardous wastes can be disposed of in fluidized beds byeither chemical capture or complete destruction. In the former case,bed material, such as limestone, will react with halides, sulfides, met-als, etc., to form stable compounds which can be landfilled. Contacttimes of up to 5 or 10 s at 1200 K (900!C) to 1300 K (1000!C) ensurecomplete destruction of most compounds.
Physical ContactingDrying Fluidized-bed units for drying solids, particularly coal,
cement, rock, and limestone, are in wide use. Economic considera-tions make these units particularly attractive when large tonnages ofsolids are to be handled. Fuel requirements are 3.3 to 4.2 MJ/kg (1500to 1900 Btu/lb of water removed), and total power for blowers, feed-ers, etc., is about 0.08 kWh/kg of water removed. The maximum feedsize is approximately 6 cm (2.4 in) × 0 coal. One of the major advan-tages of this type of dryer is the close control of conditions so that apredetermined amount of free moisture may be left with the solids toprevent dusting of the product during subsequent material handlingoperations. The fluidized-bed dryer is also used as a classifier so thatdrying and classification operations are accomplished simultaneously.Wall and Ash [Ind. Eng. Chem. 41: 1247 (1949)] state that in drying4.8-mm (−4-mesh) dolomite with combustion gases at a superficial
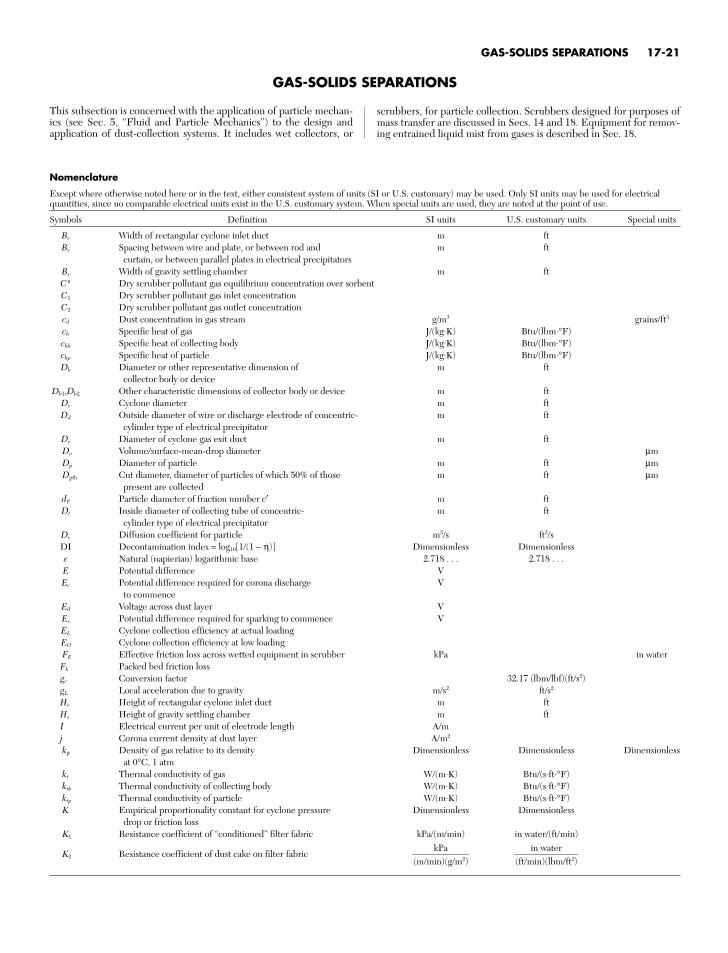
GAS-SOLIDS SEPARATIONS
scrubbers, for particle collection. Scrubbers designed for purposes ofmass transfer are discussed in Secs. 14 and 18. Equipment for remov-ing entrained liquid mist from gases is described in Sec. 18.
GAS-SOLIDS SEPARATIONS 17-21
This subsection is concerned with the application of particle mechan-ics (see Sec. 5, “Fluid and Particle Mechanics”) to the design andapplication of dust-collection systems. It includes wet collectors, or
Nomenclature
Except where otherwise noted here or in the text, either consistent system of units (SI or U.S. customary) may be used. Only SI units may be used for electricalquantities, since no comparable electrical units exist in the U.S. customary system. When special units are used, they are noted at the point of use.
Symbols Definition SI units U.S. customary units Special units
Bc Width of rectangular cyclone inlet duct m ftBe Spacing between wire and plate, or between rod and m ft
curtain, or between parallel plates in electrical precipitatorsBs Width of gravity settling chamber m ftC* Dry scrubber pollutant gas equilibrium concentration over sorbentC1 Dry scrubber pollutant gas inlet concentrationC2 Dry scrubber pollutant gas outlet concentrationcd Dust concentration in gas stream g/m3 grains/ft3
ch Specific heat of gas J/(kg⋅K) Btu/(lbm⋅°F)chb Specific heat of collecting body J/(kg⋅K) Btu/(lbm⋅°F)chp Specific heat of particle J/(kg⋅K) Btu/(lbm⋅°F)Db Diameter or other representative dimension of m ft
collector body or deviceDb1,Db2 Other characteristic dimensions of collector body or device m ft
Dc Cyclone diameter m ftDd Outside diameter of wire or discharge electrode of concentric- m ft
cylinder type of electrical precipitatorDe Diameter of cyclone gas exit duct m ftDo Volume/surface-mean-drop diameter µmDp Diameter of particle m ft µmDpth Cut diameter, diameter of particles of which 50% of those m ft µm
present are collecteddP Particle diameter of fraction number c′ m ftDt Inside diameter of collecting tube of concentric- m ft
cylinder type of electrical precipitatorDv Diffusion coefficient for particle m2/s ft2/sDI Decontamination index = log10[1/(1 − η)] Dimensionless Dimensionlesse Natural (napierian) logarithmic base 2.718 . . . 2.718 . . .E Potential difference VEc Potential difference required for corona discharge V
to commenceEd Voltage across dust layer VEs Potential difference required for sparking to commence VEL Cyclone collection efficiency at actual loadingEO Cyclone collection efficiency at low loadingFE Effective friction loss across wetted equipment in scrubber kPa in waterFk Packed bed friction lossgc Conversion factor 32.17 (lbm/lbf)(ft/s2)gL Local acceleration due to gravity m/s2 ft/s2
Hc Height of rectangular cyclone inlet duct m ftHs Height of gravity settling chamber m ftI Electrical current per unit of electrode length A/mj Corona current density at dust layer A/m2
kρ Density of gas relative to its density Dimensionless Dimensionless Dimensionlessat 0°C, 1 atm
kt Thermal conductivity of gas W/(m⋅K) Btu/(s⋅ft⋅°F)ktb Thermal conductivity of collecting body W/(m⋅K) Btu/(s⋅ft⋅°F)ktp Thermal conductivity of particle W/(m⋅K) Btu/(s⋅ft⋅°F)K Empirical proportionality constant for cyclone pressure Dimensionless Dimensionless
drop or friction lossK1 Resistance coefficient of “conditioned” filter fabric kPa/(m/min) in water/(ft/min)
K2 Resistance coefficient of dust cake on filter fabricin water
(ft/min)(lbm/ft2)
kPa(m/min)(g/m2)
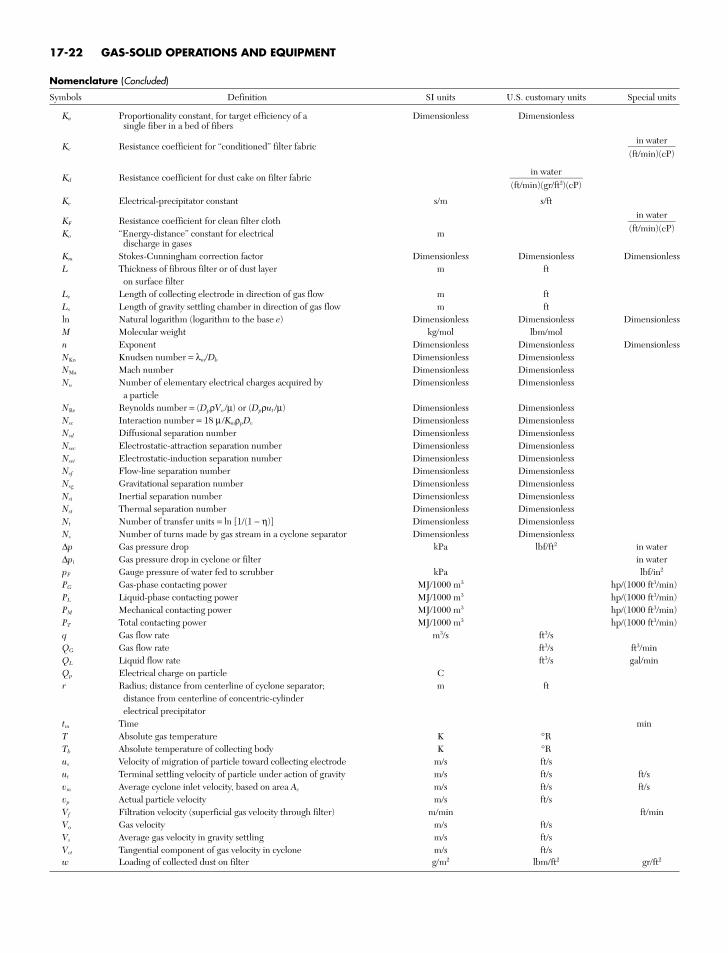
Nomenclature (Concluded)
Symbols Definition SI units U.S. customary units Special units
Ka Proportionality constant, for target efficiency of a Dimensionless Dimensionlesssingle fiber in a bed of fibers
Kc Resistance coefficient for “conditioned” filter fabric
Kd Resistance coefficient for dust cake on filter fabric
Ke Electrical-precipitator constant s/m s/ft
KF Resistance coefficient for clean filter clothKo “Energy-distance” constant for electrical m
discharge in gasesKm Stokes-Cunningham correction factor Dimensionless Dimensionless DimensionlessL Thickness of fibrous filter or of dust layer m ft
on surface filterLe Length of collecting electrode in direction of gas flow m ftLs Length of gravity settling chamber in direction of gas flow m ftln Natural logarithm (logarithm to the base e) Dimensionless Dimensionless DimensionlessM Molecular weight kg/mol lbm/moln Exponent Dimensionless Dimensionless DimensionlessNKn Knudsen number = λm/Db Dimensionless DimensionlessNMa Mach number Dimensionless DimensionlessNo Number of elementary electrical charges acquired by Dimensionless Dimensionless
a particleNRe Reynolds number = (DpρVo /µ) or (Dpρut /µ) Dimensionless DimensionlessNsc Interaction number = 18 µ /KmρpDv Dimensionless DimensionlessNsd Diffusional separation number Dimensionless DimensionlessNsec Electrostatic-attraction separation number Dimensionless DimensionlessNsei Electrostatic-induction separation number Dimensionless DimensionlessNsf Flow-line separation number Dimensionless DimensionlessNsg Gravitational separation number Dimensionless DimensionlessNsi Inertial separation number Dimensionless DimensionlessNst Thermal separation number Dimensionless DimensionlessNt Number of transfer units = ln [1/(1 − η)] Dimensionless DimensionlessNs Number of turns made by gas stream in a cyclone separator Dimensionless Dimensionless∆p Gas pressure drop kPa lbf/ft2 in water∆pi Gas pressure drop in cyclone or filter in waterpF Gauge pressure of water fed to scrubber kPa lbf/in2
PG Gas-phase contacting power MJ/1000 m3 hp/(1000 ft3/min)PL Liquid-phase contacting power MJ/1000 m3 hp/(1000 ft3/min)PM Mechanical contacting power MJ/1000 m3 hp/(1000 ft3/min)PT Total contacting power MJ/1000 m3 hp/(1000 ft3/min)q Gas flow rate m3/s ft3/sQG Gas flow rate ft3/s ft3/minQL Liquid flow rate ft3/s gal/minQp Electrical charge on particle Cr Radius; distance from centerline of cyclone separator; m ft
distance from centerline of concentric-cylinderelectrical precipitator
tm Time minT Absolute gas temperature K °RTb Absolute temperature of collecting body K °Rus Velocity of migration of particle toward collecting electrode m/s ft/sut Terminal settling velocity of particle under action of gravity m/s ft/s ft/svm Average cyclone inlet velocity, based on area Ac m/s ft/s ft/svp Actual particle velocity m/s ft/sVf Filtration velocity (superficial gas velocity through filter) m/min ft/minVo Gas velocity m/s ft/sVs Average gas velocity in gravity settling m/s ft/sVct Tangential component of gas velocity in cyclone m/s ft/sw Loading of collected dust on filter g/m2 lbm/ft2 gr/ft2
in water(ft/min)(cP)
in water(ft/min)(gr/ft2)(cP)
in water(ft/min)(cP)
17-22 GAS-SOLID OPERATIONS AND EQUIPMENT
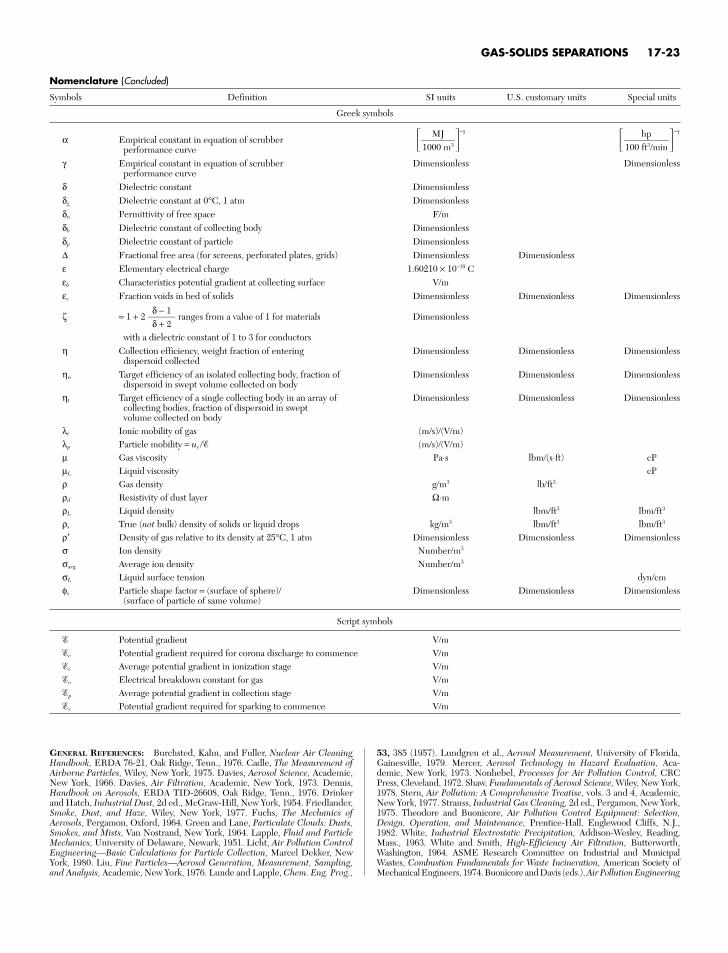
Nomenclature (Concluded)
Symbols Definition SI units U.S. customary units Special units
Greek symbols
α Empirical constant in equation of scrubber −γ
−γ
performance curveγ Empirical constant in equation of scrubber Dimensionless Dimensionless
performance curveδ Dielectric constant Dimensionlessδg Dielectric constant at 0°C, 1 atm Dimensionlessδo Permittivity of free space F/mδb Dielectric constant of collecting body Dimensionlessδp Dielectric constant of particle Dimensionless∆ Fractional free area (for screens, perforated plates, grids) Dimensionless Dimensionlessε Elementary electrical charge 1.60210 × 10⁻¹⁹ Cεb Characteristics potential gradient at collecting surface V/mεv Fraction voids in bed of solids Dimensionless Dimensionless Dimensionless
ζ = 1 + 2 ranges from a value of 1 for materials Dimensionless
with a dielectric constant of 1 to 3 for conductorsη Collection efficiency, weight fraction of entering Dimensionless Dimensionless Dimensionless
dispersoid collectedηo Target efficiency of an isolated collecting body, fraction of Dimensionless Dimensionless Dimensionless
dispersoid in swept volume collected on bodyηt Target efficiency of a single collecting body in an array of Dimensionless Dimensionless Dimensionless
collecting bodies, fraction of dispersoid in swept volume collected on body
λi Ionic mobility of gas (m/s)/(V/m)λp Particle mobility = ue / (m/s)/(V/m)µ Gas viscosity Pa⋅s lbm/(s⋅ft) cPµL Liquid viscosity cPρ Gas density g/m3 lb/ft3
ρd Resistivity of dust layer Ω⋅mρL Liquid density lbm/ft3 lbm/ft3
ρs True (not bulk) density of solids or liquid drops kg/m3 lbm/ft3 lbm/ft3
ρ′ Density of gas relative to its density at 25°C, 1 atm Dimensionless Dimensionless Dimensionlessσ Ion density Number/m3
σavg Average ion density Number/m3
σL Liquid surface tension dyn/cmφs Particle shape factor = (surface of sphere)/ Dimensionless Dimensionless Dimensionless
(surface of particle of same volume)
Script symbols
Potential gradient V/mc Potential gradient required for corona discharge to commence V/mi Average potential gradient in ionization stage V/mo Electrical breakdown constant for gas V/mp Average potential gradient in collection stage V/ms Potential gradient required for sparking to commence V/m
δ − 1δ + 2
hp100 ft3/min
MJ1000 m3
GAS-SOLIDS SEPARATIONS 17-23
GENERAL REFERENCES: Burchsted, Kahn, and Fuller, Nuclear Air CleaningHandbook, ERDA 76-21, Oak Ridge, Tenn., 1976. Cadle, The Measurement ofAirborne Particles, Wiley, New York, 1975. Davies, Aerosol Science, Academic,New York, 1966. Davies, Air Filtration, Academic, New York, 1973. Dennis,Handbook on Aerosols, ERDA TID-26608, Oak Ridge, Tenn., 1976. Drinkerand Hatch, Industrial Dust, 2d ed., McGraw-Hill, New York, 1954. Friedlander,Smoke, Dust, and Haze, Wiley, New York, 1977. Fuchs, The Mechanics ofAerosols, Pergamon, Oxford, 1964. Green and Lane, Particulate Clouds: Dusts,Smokes, and Mists, Van Nostrand, New York, 1964. Lapple, Fluid and ParticleMechanics, University of Delaware, Newark, 1951. Licht, Air Pollution ControlEngineering—Basic Calculations for Particle Collection, Marcel Dekker, NewYork, 1980. Liu, Fine Particles—Aerosol Generation, Measurement, Sampling,and Analysis, Academic, New York, 1976. Lunde and Lapple, Chem. Eng. Prog.,
53, 385 (1957). Lundgren et al., Aerosol Measurement, University of Florida,Gainesville, 1979. Mercer, Aerosol Technology in Hazard Evaluation, Aca-demic, New York, 1973. Nonhebel, Processes for Air Pollution Control, CRCPress, Cleveland, 1972. Shaw, Fundamentals of Aerosol Science, Wiley, New York,1978. Stern, Air Pollution: A Comprehensive Treatise, vols. 3 and 4, Academic,New York, 1977. Strauss, Industrial Gas Cleaning, 2d ed., Pergamon, New York,1975. Theodore and Buonicore, Air Pollution Control Equipment: Selection,Design, Operation, and Maintenance, Prentice-Hall, Englewood Cliffs, N.J.,1982. White, Industrial Electrostatic Precipitation, Addison-Wesley, Reading,Mass., 1963. White and Smith, High-Efficiency Air Filtration, Butterworth,Washington, 1964. ASME Research Committee on Industrial and MunicipalWastes, Combustion Fundamentals for Waste Incineration, American Society ofMechanical Engineers, 1974. Buonicore and Davis (eds.), Air Pollution Engineering
Manual, Air & Waste Management Association, Van Nostrand Reinhold, 1992.Burchsted, Fuller, and Kahn, Nuclear Air Cleaning Handbook, ORNL for theU.S. Energy Research and Development Administration, NTIS Report ERDA76-21, 1976. Dennis (ed.), Handbook on Aerosols, GCA for the U.S. EnergyResearch and Development Administration, NTIS Report TID-26608, 1976.Stern, Air Pollution, 3d ed., Academic Press, 1977 (supplement 1986).
PURPOSE OF DUST COLLECTION
Dust collection is concerned with the removal or collection of soliddispersoids in gases for purposes of:
1. Air-pollution control, as in fly-ash removal from power-plant fluegases
2. Equipment-maintenance reduction, as in filtration of engine-intake air or pyrites furnace-gas treatment prior to its entry to a con-tact sulfuric acid plant
3. Safety- or health-hazard elimination, as in collection of siliceous andmetallic dusts around grinding and drilling equipment and in some met-allurgical operations and flour dusts from milling or bagging operations
4. Product-quality improvement, as in air cleaning in the produc-tion of pharmaceutical products and photographic film
5. Recovery of a valuable product, as in collection of dusts fromdryers and smelters
6. Powdered-product collection, as in pneumatic conveying; thespray drying of milk, eggs, and soap; and the manufacture of high-purity zinc oxide and carbon black
PROPERTIES OF PARTICLE DISPERSOIDS
An understanding of the fundamental properties and characteristicsof gas dispersoids is essential to the design of industrial dust-controlequipment. Figure 17-34 shows characteristics of dispersoids andother particles together with the types of gas-cleaning equipment thatare applicable to their control. Two types of solid dispersoids areshown: (1) dust, which is composed of particles larger than 1 µm; and(2) fume, which consists of particles generally smaller than 1 µm.Dusts usually result from mechanical disintegration of matter. Theymay be redispersed from the settled, or bulk, condition by an air blast.Fumes are submicrometer dispersoids formed by processes such ascombustion, sublimation, and condensation. Once collected, they can-not be redispersed from the settled condition to their original state ofdispersion by air blasts or mechanical dispersion equipment.
The primary distinguishing characteristic of gas dispersoids is particlesize. The generally accepted unit of particle size is the micrometer, µm.(Prior to the adoption of the SI system, the same unit was known as themicron and was designated by µ.) The particle size of a gas dispersoid isusually taken as the diameter of a sphere having the same mass and den-sity as the particle in question. Another common method is to designatethe screen mesh that has an aperture corresponding to the particle diam-eter; the screen scale used must also be specified to avoid confusion.
From the standpoint of collector design and performance, the mostimportant size-related property of a dust particle is its dynamic behav-ior. Particles larger than 100 µm are readily collectible by simple inertialor gravitational methods. For particles under 100 µm, the range of prin-cipal difficulty in dust collection, the resistance to motion in a gas is vis-cous (see Sec. 6, “Fluid and Particle Dynamics”), and for such particles,the most useful size specification is commonly the Stokes settling diam-eter, which is the diameter of the spherical particle of the same densitythat has the same terminal velocity in viscous flow as the particle inquestion. It is yet more convenient in many circumstances to use the“aerodynamic diameter,” which is the diameter of the particle of unitdensity (1 g/cm3) that has the same terminal settling velocity. Use of theaerodynamic diameter permits direct comparisons of the dynamicbehavior of particles that are actually of different sizes, shapes, and den-sities [Raabe, J. Air Pollut. Control Assoc., 26, 856 (1976)].
When the size of a particle approaches the same order of magni-tude as the mean free path of the gas molecules, the settling velocityis greater than predicted by Stokes’ law because of molecular slip. Theslip-flow correction is appreciable for particles smaller than 1 µm andis allowed for by the Cunningham correction for Stokes’ law (Lapple,op. cit.; Licht, op. cit.). The Cunningham correction is applied in
calculations of the aerodynamic diameters of particles that are in theappropriate size range.
Although solid fume particles may range in size down to perhaps 0.001µm, fine particles effectively smaller than about 0.1 µm are not of muchsignificance in industrial dust and fume sources because their aggregatemass is only a very small fraction of the total mass emission. At the con-centrations present in such sources (e.g., production of carbon black) thecoagulation, or flocculation, rate of the ultrafine particles is extremelyhigh, and the particles speedily grow to sizes of 0.1 µm or greater. Themost difficult collection problems are thus concerned with particles inthe range of about 0.1 to 2 µm, in which forces for deposition by inertiaare small. For collection of particles under 0.1 µm, diffusional depositionbecomes increasingly important as the particle size decreases.
In a gas stream carrying dust or fume, some degree of particle floc-culation will exist, so that both discrete particles and clusters of adher-ing particles will be present. The discrete particles composing theclusters may be only loosely attached to each other, as by van derWaals forces [Lapple, Chem. Eng., 75(11), 149 (1968)]. Flocculationtends to increase with increases in particle concentration and maystrongly influence collector performance.
PARTICLE MEASUREMENTS
Measurements of the concentrations and characteristics of dust dis-persed in air or other gases may be necessary (1) to determine theneed for control measures, (2) to establish compliance with legalrequirements, (3) to obtain information for collector design, and (4) todetermine collector performance.
Atmospheric-Pollution Measurements The dust-fall measure-ment is one of the common methods for obtaining a relative long-period evaluation of particulate air pollution. Stack-smoke densities areoften graded visually by means of the Ringelmann chart. Plume opac-ity may be continuously monitored and recorded by a photoelectricdevice which measures the amount of light transmitted through a stackplume. Equipment for local atmospheric-dust-concentration measure-ments fall into five general types: (1) the impinger, (2) the hot-wire orthermal precipitator, (3) the electrostatic precipitator, (4) the filter,and (5) impactors and cyclones. The filter is the most widely used, inthe form of either a continuous tape, or a number of filter disksarranged in an automatic sequencing device, or a single, short-term,high-volume sampler. Samplers such as these are commonly used toobtain mass emission and particle-size distribution. Impactors andsmall cyclones are commonly used as size-discriminating samplers andare usually followed by filters for the determination of the finest frac-tion of the dust (Lundgren et al., Aerosol Measurement, University ofFlorida, Gainesville, 1979; and Dennis, Handbook on Aerosols, U.S.ERDA TID-26608, Oak Ridge, Tenn., 1976).
Process-Gas Sampling In sampling process gases either todetermine dust concentration or to obtain a representative dust sam-ple, it is necessary to take special precautions to avoid inertial segre-gation of the particles. To prevent such classification, a traverse of theduct may be required, and at each point the sampling nozzle must facedirectly into the gas stream with the velocity in the mouth of the noz-zle equal to the local gas velocity at that point. This is called “isokineticsampling.” If the sampling velocity is too high, the dust sample willcontain a lower concentration of dust than the mainstream, with agreater percentage of fine particles; if the sampling velocity is too low,the dust sample will contain a higher concentration of dust with agreater percentage of coarse particles [Lapple, Heat. Piping AirCond., 16, 578 (1944); Manual of Disposal of Refinery Wastes, vol. V,American Petroleum Institute, New York, 1954; and Dennis, op. cit.].
Particle-Size Analysis Methods for particle-size analysis are shownin Fig. 17-34, and examples of size-analysis methods are given in Table17-1. More detailed information may be found in Lapple, Chem. Eng.,75(11), 140 (1968); Lapple, “Particle-Size Analysis,” in Encyclopedia ofScience and Technology, 5th ed., McGraw-Hill, New York, 1982; Cadle,The Measurement of Airborne Particles, Wiley, New York, 1975; Lowell,Introduction to Powder Surface Area, 2d ed., Wiley, New York, 1993;and Allen, Particle Size Measurement, 4th ed, Chapman and Hall,London, 1990. Particle-size distribution may be presented on either afrequency or a cumulative basis; the various methods are discussed in
17-24 GAS-SOLID OPERATIONS AND EQUIPMENT
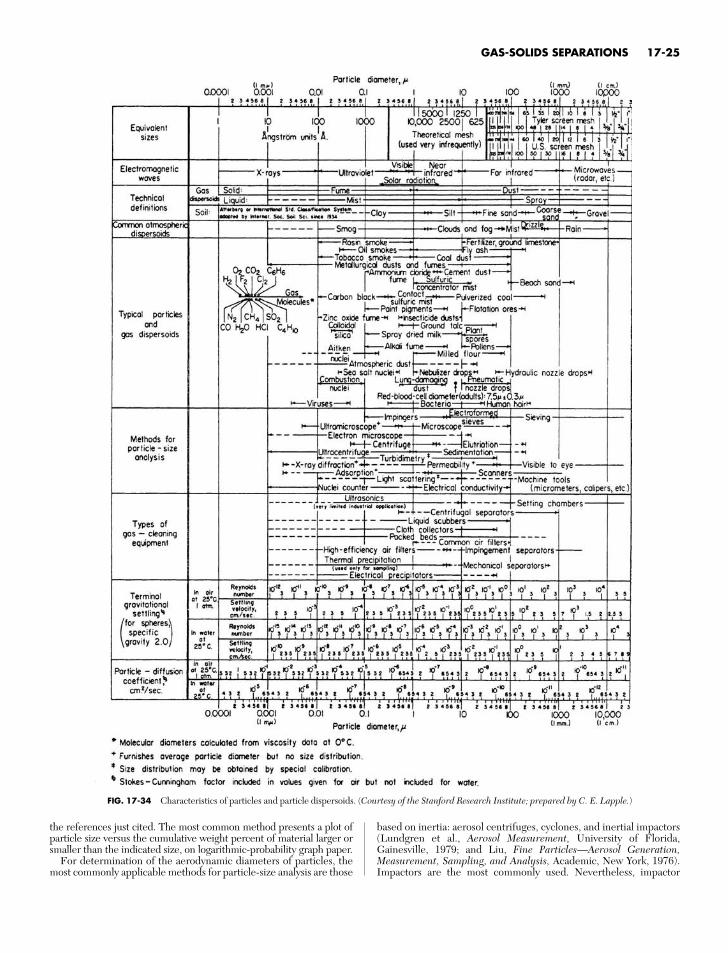
the references just cited. The most common method presents a plot ofparticle size versus the cumulative weight percent of material larger orsmaller than the indicated size, on logarithmic-probability graph paper.
For determination of the aerodynamic diameters of particles, themost commonly applicable methods for particle-size analysis are those
based on inertia: aerosol centrifuges, cyclones, and inertial impactors(Lundgren et al., Aerosol Measurement, University of Florida,Gainesville, 1979; and Liu, Fine Particles—Aerosol Generation,Measurement, Sampling, and Analysis, Academic, New York, 1976).Impactors are the most commonly used. Nevertheless, impactor
GAS-SOLIDS SEPARATIONS 17-25
FIG. 17-34 Characteristics of particles and particle dispersoids. (Courtesy of the Stanford Research Institute; prepared by C. E. Lapple.)
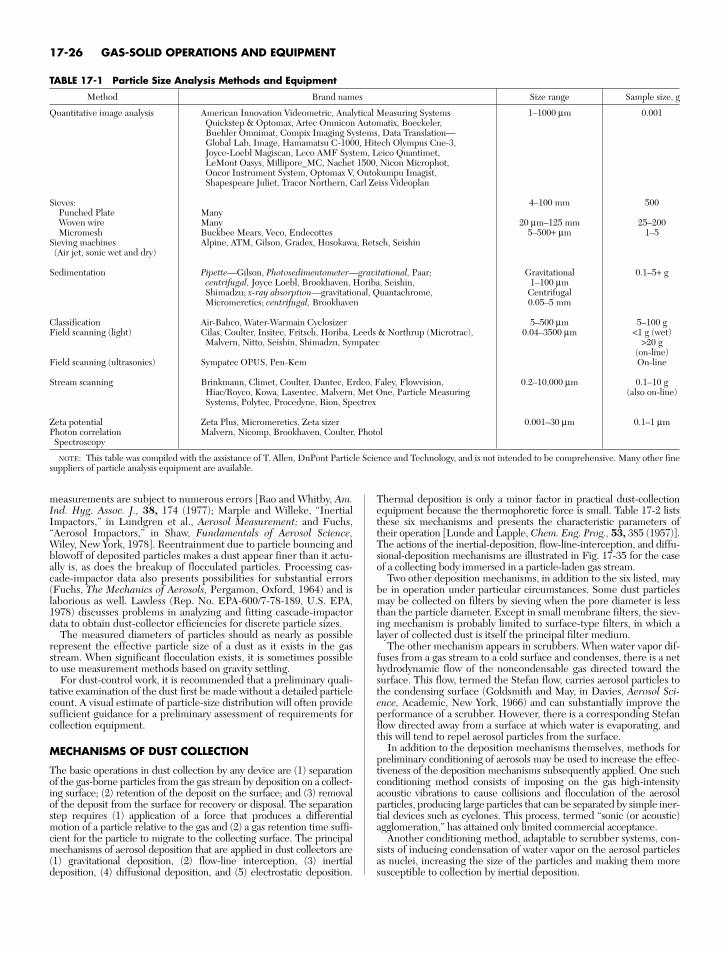
measurements are subject to numerous errors [Rao and Whitby, Am.Ind. Hyg. Assoc. J., 38, 174 (1977); Marple and Willeke, “InertialImpactors,” in Lundgren et al., Aerosol Measurement; and Fuchs,“Aerosol Impactors,” in Shaw, Fundamentals of Aerosol Science,Wiley, New York, 1978]. Reentrainment due to particle bouncing andblowoff of deposited particles makes a dust appear finer than it actu-ally is, as does the breakup of flocculated particles. Processing cas-cade-impactor data also presents possibilities for substantial errors(Fuchs, The Mechanics of Aerosols, Pergamon, Oxford, 1964) and islaborious as well. Lawless (Rep. No. EPA-600/7-78-189, U.S. EPA,1978) discusses problems in analyzing and fitting cascade-impactordata to obtain dust-collector efficiencies for discrete particle sizes.
The measured diameters of particles should as nearly as possiblerepresent the effective particle size of a dust as it exists in the gasstream. When significant flocculation exists, it is sometimes possibleto use measurement methods based on gravity settling.
For dust-control work, it is recommended that a preliminary quali-tative examination of the dust first be made without a detailed particlecount. A visual estimate of particle-size distribution will often providesufficient guidance for a preliminary assessment of requirements forcollection equipment.
MECHANISMS OF DUST COLLECTION
The basic operations in dust collection by any device are (1) separationof the gas-borne particles from the gas stream by deposition on a collect-ing surface; (2) retention of the deposit on the surface; and (3) removalof the deposit from the surface for recovery or disposal. The separationstep requires (1) application of a force that produces a differentialmotion of a particle relative to the gas and (2) a gas retention time suffi-cient for the particle to migrate to the collecting surface. The principalmechanisms of aerosol deposition that are applied in dust collectors are(1) gravitational deposition, (2) flow-line interception, (3) inertialdeposition, (4) diffusional deposition, and (5) electrostatic deposition.
Thermal deposition is only a minor factor in practical dust-collectionequipment because the thermophoretic force is small. Table 17-2 liststhese six mechanisms and presents the characteristic parameters oftheir operation [Lunde and Lapple, Chem. Eng. Prog., 53, 385 (1957)].The actions of the inertial-deposition, flow-line-interception, and diffu-sional-deposition mechanisms are illustrated in Fig. 17-35 for the caseof a collecting body immersed in a particle-laden gas stream.
Two other deposition mechanisms, in addition to the six listed, maybe in operation under particular circumstances. Some dust particlesmay be collected on filters by sieving when the pore diameter is lessthan the particle diameter. Except in small membrane filters, the siev-ing mechanism is probably limited to surface-type filters, in which alayer of collected dust is itself the principal filter medium.
The other mechanism appears in scrubbers. When water vapor dif-fuses from a gas stream to a cold surface and condenses, there is a nethydrodynamic flow of the noncondensable gas directed toward thesurface. This flow, termed the Stefan flow, carries aerosol particles tothe condensing surface (Goldsmith and May, in Davies, Aerosol Sci-ence, Academic, New York, 1966) and can substantially improve theperformance of a scrubber. However, there is a corresponding Stefanflow directed away from a surface at which water is evaporating, andthis will tend to repel aerosol particles from the surface.
In addition to the deposition mechanisms themselves, methods forpreliminary conditioning of aerosols may be used to increase the effec-tiveness of the deposition mechanisms subsequently applied. One suchconditioning method consists of imposing on the gas high-intensityacoustic vibrations to cause collisions and flocculation of the aerosolparticles, producing large particles that can be separated by simple iner-tial devices such as cyclones. This process, termed “sonic (or acoustic)agglomeration,” has attained only limited commercial acceptance.
Another conditioning method, adaptable to scrubber systems, con-sists of inducing condensation of water vapor on the aerosol particlesas nuclei, increasing the size of the particles and making them moresusceptible to collection by inertial deposition.
17-26 GAS-SOLID OPERATIONS AND EQUIPMENT
TABLE 17-1 Particle Size Analysis Methods and Equipment
Method Brand names Size range Sample size, g
Quantitative image analysis American Innovation Videometric, Analytical Measuring Systems 1–1000 µm 0.001Quickstep & Optomax, Artec Omnicon Automatix, Boeckeler, Buehler Omnimat, Compix Imaging Systems, Data Translation—Global Lab, Image, Hamamatsu C-1000, Hitech Olympus Cue-3, Joyce-Loebl Magiscan, Leco AMF System, Leico Quantimet, LeMont Oasys, Millipore_MC, Nachet 1500, Nicon Microphot, Oncor Instrument System, Optomax V, Outokumpu Imagist, Shapespeare Juliet, Tracor Northern, Carl Zeiss Videoplan
Sieves: 4–100 mm 500Punched Plate ManyWoven wire Many 20 µm–125 mm 25–200Micromesh Buckbee Mears, Veco, Endecottes 5–500+ µm 1–5
Sieving machines Alpine, ATM, Gilson, Gradex, Hosokawa, Retsch, Seishin(Air jet, sonic wet and dry)
Sedimentation Pipette—Gilson, Photosedimentometer—gravitational, Paar; Gravitational 0.1–5+ gcentrifugal, Joyce Loebl, Brookhaven, Horiba, Seishin, 1–100 µmShimadzu; x-ray absorption—gravitational, Quantachrome, CentrifugalMicromeretics; centrifugal, Brookhaven 0.05–5 mm
Classification Air-Bahco, Water-Warmain Cyclosizer 5–500 µm 5–100 gField scanning (light) Cilas, Coulter, Insitec, Fritsch, Horiba, Leeds & Northrup (Microtrac), 0.04–3500 µm <1 g (wet)
Malvern, Nitto, Seishin, Shimadzu, Sympatec >20 g(on-line)
Field scanning (ultrasonics) Sympatec OPUS, Pen-Kem On-line
Stream scanning Brinkmann, Climet, Coulter, Dantec, Erdco, Faley, Flowvision, 0.2–10,000 µm 0.1–10 gHiac/Royco, Kowa, Lasentec, Malvern, Met One, Particle Measuring (also on-line)Systems, Polytec, Procedyne, Rion, Spectrex
Zeta potential Zeta Plus, Micromeretics, Zeta sizer 0.001–30 µm 0.1–1 µmPhoton correlation Malvern, Nicomp, Brookhaven, Coulter, Photol
Spectroscopy
NOTE: This table was compiled with the assistance of T. Allen, DuPont Particle Science and Technology, and is not intended to be comprehensive. Many other finesuppliers of particle analysis equipment are available.
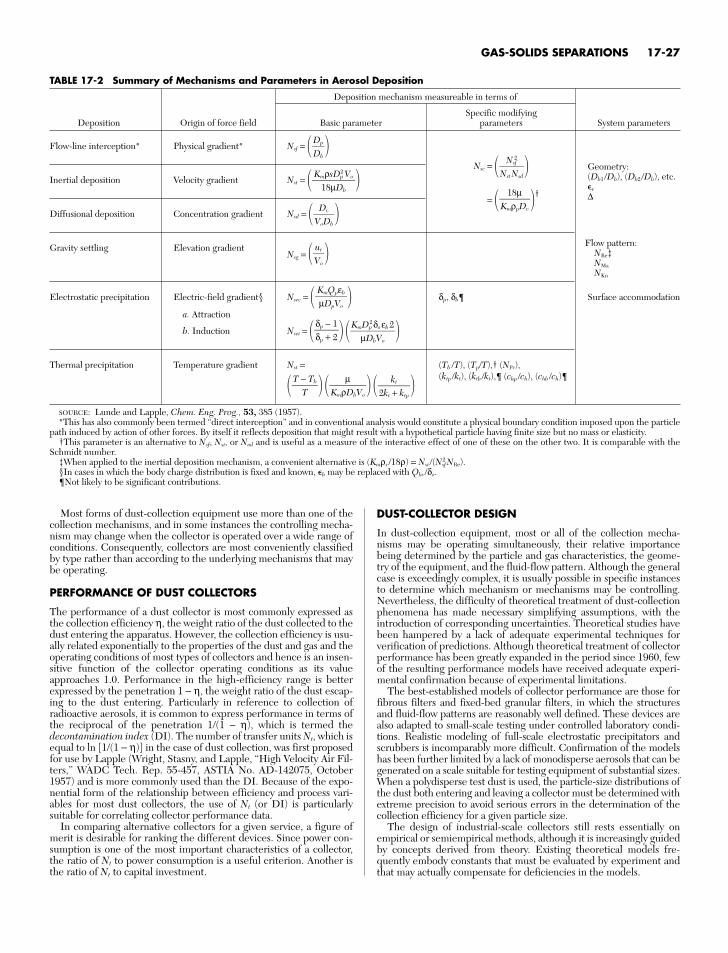
Most forms of dust-collection equipment use more than one of thecollection mechanisms, and in some instances the controlling mecha-nism may change when the collector is operated over a wide range ofconditions. Consequently, collectors are most conveniently classifiedby type rather than according to the underlying mechanisms that maybe operating.
PERFORMANCE OF DUST COLLECTORS
The performance of a dust collector is most commonly expressed asthe collection efficiency η, the weight ratio of the dust collected to thedust entering the apparatus. However, the collection efficiency is usu-ally related exponentially to the properties of the dust and gas and theoperating conditions of most types of collectors and hence is an insen-sitive function of the collector operating conditions as its valueapproaches 1.0. Performance in the high-efficiency range is betterexpressed by the penetration 1 − η, the weight ratio of the dust escap-ing to the dust entering. Particularly in reference to collection ofradioactive aerosols, it is common to express performance in terms ofthe reciprocal of the penetration 1/(1 − η), which is termed thedecontamination index (DI). The number of transfer units Nt, which isequal to ln [1/(1 − η)] in the case of dust collection, was first proposedfor use by Lapple (Wright, Stasny, and Lapple, “High Velocity Air Fil-ters,” WADC Tech. Rep. 55-457, ASTIA No. AD-142075, October1957) and is more commonly used than the DI. Because of the expo-nential form of the relationship between efficiency and process vari-ables for most dust collectors, the use of Nt (or DI) is particularlysuitable for correlating collector performance data.
In comparing alternative collectors for a given service, a figure ofmerit is desirable for ranking the different devices. Since power con-sumption is one of the most important characteristics of a collector,the ratio of Nt to power consumption is a useful criterion. Another isthe ratio of Nt to capital investment.
DUST-COLLECTOR DESIGN
In dust-collection equipment, most or all of the collection mecha-nisms may be operating simultaneously, their relative importancebeing determined by the particle and gas characteristics, the geome-try of the equipment, and the fluid-flow pattern. Although the generalcase is exceedingly complex, it is usually possible in specific instancesto determine which mechanism or mechanisms may be controlling.Nevertheless, the difficulty of theoretical treatment of dust-collectionphenomena has made necessary simplifying assumptions, with theintroduction of corresponding uncertainties. Theoretical studies havebeen hampered by a lack of adequate experimental techniques forverification of predictions. Although theoretical treatment of collectorperformance has been greatly expanded in the period since 1960, fewof the resulting performance models have received adequate experi-mental confirmation because of experimental limitations.
The best-established models of collector performance are those forfibrous filters and fixed-bed granular filters, in which the structuresand fluid-flow patterns are reasonably well defined. These devices arealso adapted to small-scale testing under controlled laboratory condi-tions. Realistic modeling of full-scale electrostatic precipitators andscrubbers is incomparably more difficult. Confirmation of the modelshas been further limited by a lack of monodisperse aerosols that can begenerated on a scale suitable for testing equipment of substantial sizes.When a polydisperse test dust is used, the particle-size distributions ofthe dust both entering and leaving a collector must be determined withextreme precision to avoid serious errors in the determination of thecollection efficiency for a given particle size.
The design of industrial-scale collectors still rests essentially onempirical or semiempirical methods, although it is increasingly guidedby concepts derived from theory. Existing theoretical models fre-quently embody constants that must be evaluated by experiment andthat may actually compensate for deficiencies in the models.
GAS-SOLIDS SEPARATIONS 17-27
TABLE 17-2 Summary of Mechanisms and Parameters in Aerosol Deposition
Deposition mechanism measureable in terms of
Specific modifyingDeposition Origin of force field Basic parameter parameters System parameters
Flow-line interception* Physical gradient* Nsf = Inertial deposition Velocity gradient Nst = Diffusional deposition Concentration gradient Nsd = Gravity settling Elevation gradient
Nsg =
Electrostatic precipitation Electric-field gradient§ Nsec = δp, δb¶ Surface accommodation
a. Attraction
b. Induction Nsei = Thermal precipitation Temperature gradient Nst = (Tb /T), (Tp/T),† (NPr),
(ktp /kt), (ktb /kt),¶ (chp /ch), (chb /ch)¶
SOURCE: Lunde and Lapple, Chem. Eng. Prog., 53, 385 (1957).*This has also commonly been termed “direct interception” and in conventional analysis would constitute a physical boundary condition imposed upon the particle
path induced by action of other forces. By itself it reflects deposition that might result with a hypothetical particle having finite size but no mass or elasticity.†This parameter is an alternative to Nsf, Nsi, or Nad and is useful as a measure of the interactive effect of one of these on the other two. It is comparable with the
Schmidt number.‡When applied to the inertial deposition mechanism, a convenient alternative is (Kmρs /18ρ) = Nsi /(Nsf
2 NRe).§In cases in which the body charge distribution is fixed and known, %b may be replaced with Qbs /δo.¶Not likely to be significant contributions.
kt2kt + ktp
µKmρDbVo
T − Tb
T
KmDp2δoεb2
µDbVo
δp − 1δp + 2
KmQpεbµDpVo
utVo
DvVoDb
KmρsDp2 Vo
18µDb
DpDb
Geometry:(Db1 /Db), (Db2 /Db), etc.%v
∆
Flow pattern:NRe‡NMa
NKn
Nsc = = †18µKmρpDv
Nsf2
NstNsd
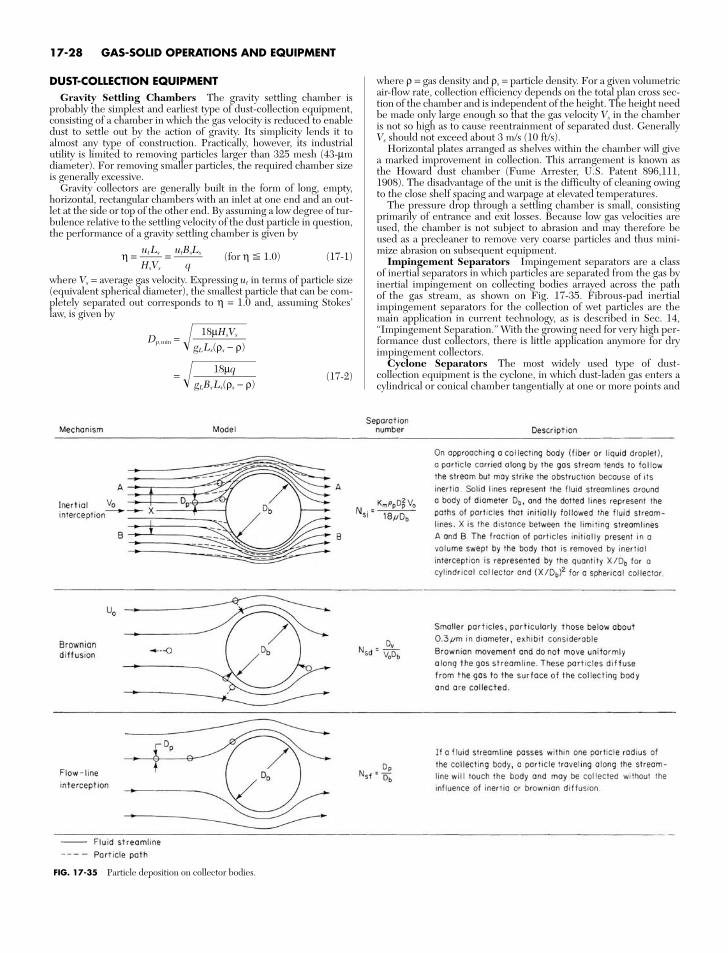
DUST-COLLECTION EQUIPMENTGravity Settling Chambers The gravity settling chamber is
probably the simplest and earliest type of dust-collection equipment,consisting of a chamber in which the gas velocity is reduced to enabledust to settle out by the action of gravity. Its simplicity lends it toalmost any type of construction. Practically, however, its industrialutility is limited to removing particles larger than 325 mesh (43-µmdiameter). For removing smaller particles, the required chamber sizeis generally excessive.
Gravity collectors are generally built in the form of long, empty,horizontal, rectangular chambers with an inlet at one end and an out-let at the side or top of the other end. By assuming a low degree of tur-bulence relative to the settling velocity of the dust particle in question,the performance of a gravity settling chamber is given by
η = = (for η $ 1.0) (17-1)
where Vs = average gas velocity. Expressing ut in terms of particle size(equivalent spherical diameter), the smallest particle that can be com-pletely separated out corresponds to η = 1.0 and, assuming Stokes’law, is given by
Dp,min = = (17-2)
18µqgLBsLs(ρs − ρ)
18µHsVsgLLs(ρs − ρ)
utBsLs
qutLsHsVs
where ρ = gas density and ρs = particle density. For a given volumetricair-flow rate, collection efficiency depends on the total plan cross sec-tion of the chamber and is independent of the height. The height needbe made only large enough so that the gas velocity Vs in the chamberis not so high as to cause reentrainment of separated dust. GenerallyVs should not exceed about 3 m/s (10 ft/s).
Horizontal plates arranged as shelves within the chamber will givea marked improvement in collection. This arrangement is known asthe Howard dust chamber (Fume Arrester, U.S. Patent 896,111,1908). The disadvantage of the unit is the difficulty of cleaning owingto the close shelf spacing and warpage at elevated temperatures.
The pressure drop through a settling chamber is small, consistingprimarily of entrance and exit losses. Because low gas velocities areused, the chamber is not subject to abrasion and may therefore beused as a precleaner to remove very coarse particles and thus mini-mize abrasion on subsequent equipment.
Impingement Separators Impingement separators are a classof inertial separators in which particles are separated from the gas byinertial impingement on collecting bodies arrayed across the pathof the gas stream, as shown on Fig. 17-35. Fibrous-pad inertialimpingement separators for the collection of wet particles are themain application in current technology, as is described in Sec. 14,“Impingement Separation.” With the growing need for very high per-formance dust collectors, there is little application anymore for dryimpingement collectors.
Cyclone Separators The most widely used type of dust-collection equipment is the cyclone, in which dust-laden gas enters acylindrical or conical chamber tangentially at one or more points and
17-28 GAS-SOLID OPERATIONS AND EQUIPMENT
FIG. 17-35 Particle deposition on collector bodies.
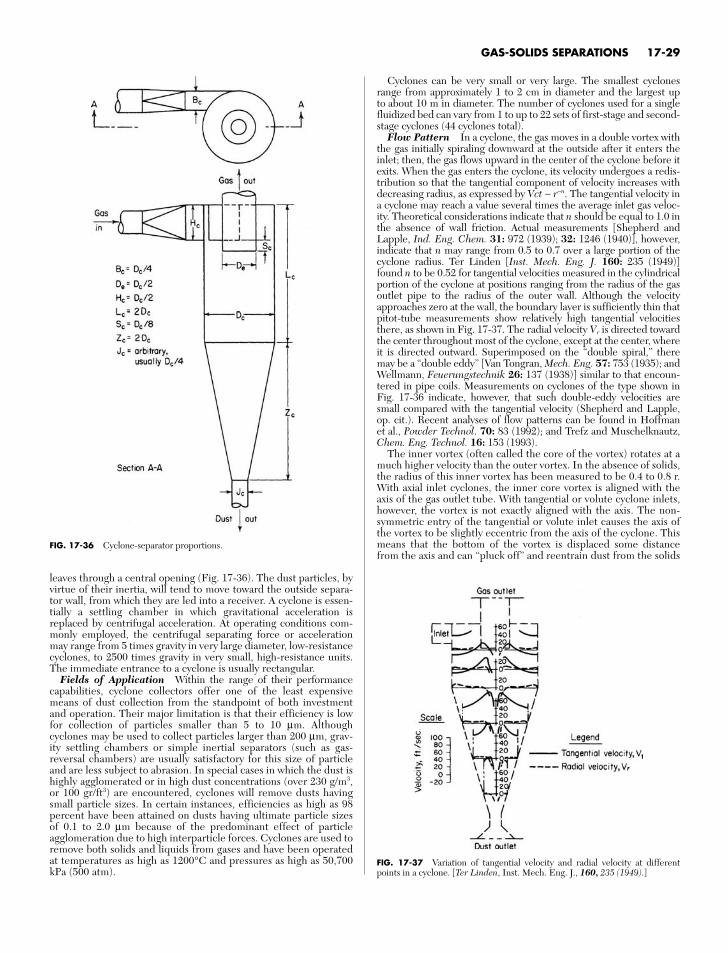
leaves through a central opening (Fig. 17-36). The dust particles, byvirtue of their inertia, will tend to move toward the outside separa-tor wall, from which they are led into a receiver. A cyclone is essen-tially a settling chamber in which gravitational acceleration isreplaced by centrifugal acceleration. At operating conditions com-monly employed, the centrifugal separating force or accelerationmay range from 5 times gravity in very large diameter, low-resistancecyclones, to 2500 times gravity in very small, high-resistance units.The immediate entrance to a cyclone is usually rectangular.
Fields of Application Within the range of their performancecapabilities, cyclone collectors offer one of the least expensivemeans of dust collection from the standpoint of both investmentand operation. Their major limitation is that their efficiency is lowfor collection of particles smaller than 5 to 10 µm. Althoughcyclones may be used to collect particles larger than 200 µm, grav-ity settling chambers or simple inertial separators (such as gas-reversal chambers) are usually satisfactory for this size of particleand are less subject to abrasion. In special cases in which the dust ishighly agglomerated or in high dust concentrations (over 230 g/m3,or 100 gr/ft3) are encountered, cyclones will remove dusts havingsmall particle sizes. In certain instances, efficiencies as high as 98percent have been attained on dusts having ultimate particle sizesof 0.1 to 2.0 µm because of the predominant effect of particleagglomeration due to high interparticle forces. Cyclones are used toremove both solids and liquids from gases and have been operatedat temperatures as high as 1200°C and pressures as high as 50,700kPa (500 atm).
Cyclones can be very small or very large. The smallest cyclonesrange from approximately 1 to 2 cm in diameter and the largest upto about 10 m in diameter. The number of cyclones used for a singlefluidized bed can vary from 1 to up to 22 sets of first-stage and second-stage cyclones (44 cyclones total).
Flow Pattern In a cyclone, the gas moves in a double vortex withthe gas initially spiraling downward at the outside after it enters theinlet; then, the gas flows upward in the center of the cyclone before itexits. When the gas enters the cyclone, its velocity undergoes a redis-tribution so that the tangential component of velocity increases withdecreasing radius, as expressed by Vct ∼ r−n. The tangential velocity ina cyclone may reach a value several times the average inlet gas veloc-ity. Theoretical considerations indicate that n should be equal to 1.0 inthe absence of wall friction. Actual measurements [Shepherd andLapple, Ind. Eng. Chem. 31: 972 (1939); 32: 1246 (1940)], however,indicate that n may range from 0.5 to 0.7 over a large portion of thecyclone radius. Ter Linden [Inst. Mech. Eng. J. 160: 235 (1949)]found n to be 0.52 for tangential velocities measured in the cylindricalportion of the cyclone at positions ranging from the radius of the gasoutlet pipe to the radius of the outer wall. Although the velocityapproaches zero at the wall, the boundary layer is sufficiently thin thatpitot-tube measurements show relatively high tangential velocitiesthere, as shown in Fig. 17-37. The radial velocity Vr is directed towardthe center throughout most of the cyclone, except at the center, whereit is directed outward. Superimposed on the “double spiral,” theremay be a “double eddy” [Van Tongran, Mech. Eng. 57: 753 (1935); andWellmann, Feuerungstechnik 26: 137 (1938)] similar to that encoun-tered in pipe coils. Measurements on cyclones of the type shown inFig. 17-36 indicate, however, that such double-eddy velocities aresmall compared with the tangential velocity (Shepherd and Lapple,op. cit.). Recent analyses of flow patterns can be found in Hoffmanet al., Powder Technol. 70: 83 (1992); and Trefz and Muschelknautz,Chem. Eng. Technol. 16: 153 (1993).
The inner vortex (often called the core of the vortex) rotates at amuch higher velocity than the outer vortex. In the absence of solids,the radius of this inner vortex has been measured to be 0.4 to 0.8 r.With axial inlet cyclones, the inner core vortex is aligned with theaxis of the gas outlet tube. With tangential or volute cyclone inlets,however, the vortex is not exactly aligned with the axis. The non-symmetric entry of the tangential or volute inlet causes the axis ofthe vortex to be slightly eccentric from the axis of the cyclone. Thismeans that the bottom of the vortex is displaced some distancefrom the axis and can “pluck off” and reentrain dust from the solids
GAS-SOLIDS SEPARATIONS 17-29
FIG. 17-36 Cyclone-separator proportions.
FIG. 17-37 Variation of tangential velocity and radial velocity at differentpoints in a cyclone. [Ter Linden, Inst. Mech. Eng. J., 160, 235 (1949).]
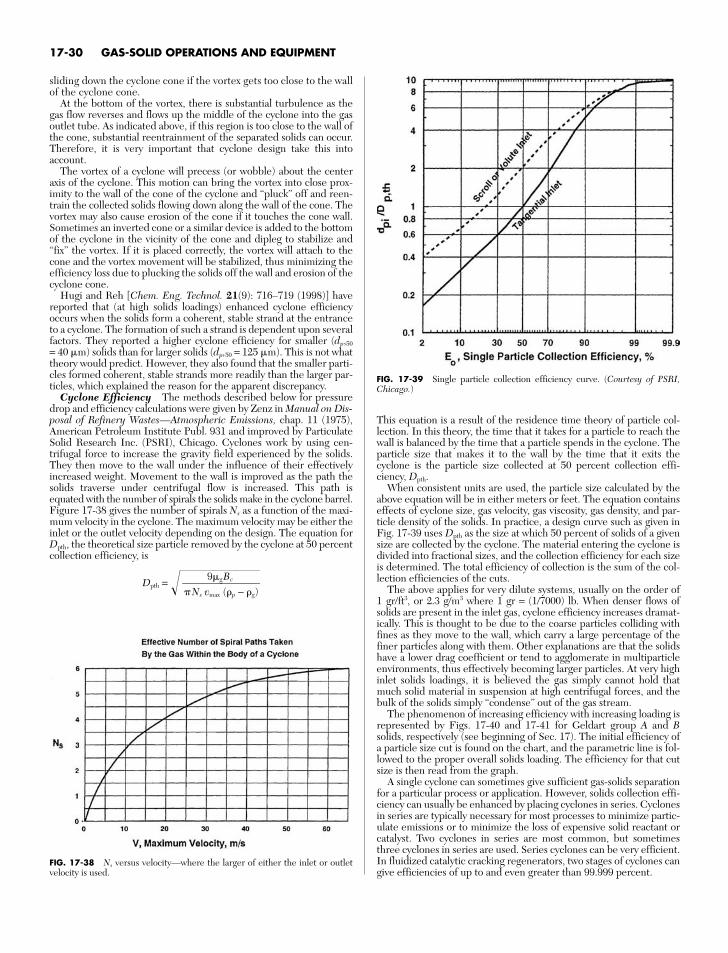
sliding down the cyclone cone if the vortex gets too close to the wallof the cyclone cone.
At the bottom of the vortex, there is substantial turbulence as thegas flow reverses and flows up the middle of the cyclone into the gasoutlet tube. As indicated above, if this region is too close to the wall ofthe cone, substantial reentrainment of the separated solids can occur.Therefore, it is very important that cyclone design take this intoaccount.
The vortex of a cyclone will precess (or wobble) about the centeraxis of the cyclone. This motion can bring the vortex into close prox-imity to the wall of the cone of the cyclone and “pluck” off and reen-train the collected solids flowing down along the wall of the cone. Thevortex may also cause erosion of the cone if it touches the cone wall.Sometimes an inverted cone or a similar device is added to the bottomof the cyclone in the vicinity of the cone and dipleg to stabilize and“fix” the vortex. If it is placed correctly, the vortex will attach to thecone and the vortex movement will be stabilized, thus minimizing theefficiency loss due to plucking the solids off the wall and erosion of thecyclone cone.
Hugi and Reh [Chem. Eng. Technol. 21(9): 716–719 (1998)] havereported that (at high solids loadings) enhanced cyclone efficiencyoccurs when the solids form a coherent, stable strand at the entranceto a cyclone. The formation of such a strand is dependent upon severalfactors. They reported a higher cyclone efficiency for smaller (dp,50
= 40 m) solids than for larger solids (dp,50 = 125 m). This is not whattheory would predict. However, they also found that the smaller parti-cles formed coherent, stable strands more readily than the larger par-ticles, which explained the reason for the apparent discrepancy.
Cyclone Efficiency The methods described below for pressuredrop and efficiency calculations were given by Zenz in Manual on Dis-posal of Refinery Wastes—Atmospheric Emissions, chap. 11 (1975),American Petroleum Institute Publ. 931 and improved by ParticulateSolid Research Inc. (PSRI), Chicago. Cyclones work by using cen-trifugal force to increase the gravity field experienced by the solids.They then move to the wall under the influence of their effectivelyincreased weight. Movement to the wall is improved as the path thesolids traverse under centrifugal flow is increased. This path isequated with the number of spirals the solids make in the cyclone barrel.Figure 17-38 gives the number of spirals Ns as a function of the maxi-mum velocity in the cyclone. The maximum velocity may be either theinlet or the outlet velocity depending on the design. The equation forDpth, the theoretical size particle removed by the cyclone at 50 percentcollection efficiency, is
Dpth =#Ns v 9
m
ax
g
(B
c
p − g)
This equation is a result of the residence time theory of particle col-lection. In this theory, the time that it takes for a particle to reach thewall is balanced by the time that a particle spends in the cyclone. Theparticle size that makes it to the wall by the time that it exits thecyclone is the particle size collected at 50 percent collection effi-ciency, Dpth.
When consistent units are used, the particle size calculated by theabove equation will be in either meters or feet. The equation containseffects of cyclone size, gas velocity, gas viscosity, gas density, and par-ticle density of the solids. In practice, a design curve such as given inFig. 17-39 uses Dpth as the size at which 50 percent of solids of a givensize are collected by the cyclone. The material entering the cyclone isdivided into fractional sizes, and the collection efficiency for each sizeis determined. The total efficiency of collection is the sum of the col-lection efficiencies of the cuts.
The above applies for very dilute systems, usually on the order of1 gr/ft3, or 2.3 g/m3 where 1 gr = (1/7000) lb. When denser flows ofsolids are present in the inlet gas, cyclone efficiency increases dramat-ically. This is thought to be due to the coarse particles colliding withfines as they move to the wall, which carry a large percentage of thefiner particles along with them. Other explanations are that the solidshave a lower drag coefficient or tend to agglomerate in multiparticleenvironments, thus effectively becoming larger particles. At very highinlet solids loadings, it is believed the gas simply cannot hold thatmuch solid material in suspension at high centrifugal forces, and thebulk of the solids simply “condense” out of the gas stream.
The phenomenon of increasing efficiency with increasing loading isrepresented by Figs. 17-40 and 17-41 for Geldart group A and Bsolids, respectively (see beginning of Sec. 17). The initial efficiency ofa particle size cut is found on the chart, and the parametric line is fol-lowed to the proper overall solids loading. The efficiency for that cutsize is then read from the graph.
A single cyclone can sometimes give sufficient gas-solids separationfor a particular process or application. However, solids collection effi-ciency can usually be enhanced by placing cyclones in series. Cyclonesin series are typically necessary for most processes to minimize partic-ulate emissions or to minimize the loss of expensive solid reactant orcatalyst. Two cyclones in series are most common, but sometimesthree cyclones in series are used. Series cyclones can be very efficient.In fluidized catalytic cracking regenerators, two stages of cyclones cangive efficiencies of up to and even greater than 99.999 percent.
17-30 GAS-SOLID OPERATIONS AND EQUIPMENT
FIG. 17-38 Ns versus velocity—where the larger of either the inlet or outletvelocity is used.
FIG. 17-39 Single particle collection efficiency curve. (Courtesy of PSRI,Chicago.)
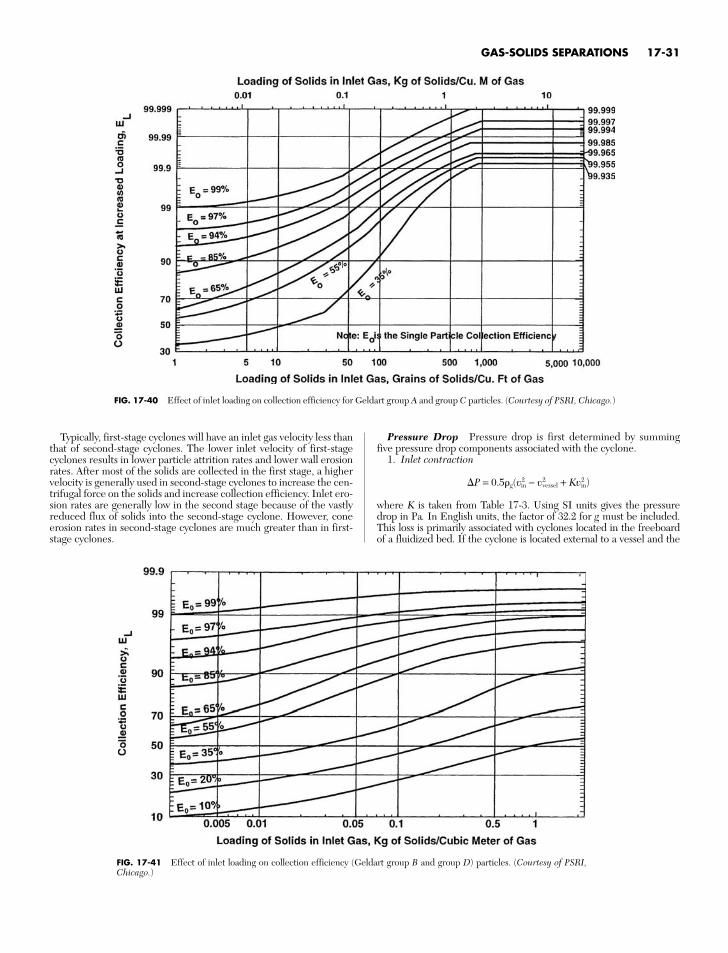
Typically, first-stage cyclones will have an inlet gas velocity less thanthat of second-stage cyclones. The lower inlet velocity of first-stagecyclones results in lower particle attrition rates and lower wall erosionrates. After most of the solids are collected in the first stage, a highervelocity is generally used in second-stage cyclones to increase the cen-trifugal force on the solids and increase collection efficiency. Inlet ero-sion rates are generally low in the second stage because of the vastlyreduced flux of solids into the second-stage cyclone. However, coneerosion rates in second-stage cyclones are much greater than in first-stage cyclones.
Pressure Drop Pressure drop is first determined by summingfive pressure drop components associated with the cyclone.
1. Inlet contraction
P = 0.5g(v2in − v2
vessel + Kv2in)
where K is taken from Table 17-3. Using SI units gives the pressuredrop in Pa. In English units, the factor of 32.2 for g must be included.This loss is primarily associated with cyclones located in the freeboardof a fluidized bed. If the cyclone is located external to a vessel and the
GAS-SOLIDS SEPARATIONS 17-31
FIG. 17-40 Effect of inlet loading on collection efficiency for Geldart group A and group C particles. (Courtesy of PSRI, Chicago.)
FIG. 17-41 Effect of inlet loading on collection efficiency (Geldart group B and group D) particles. (Courtesy of PSRI,Chicago.)
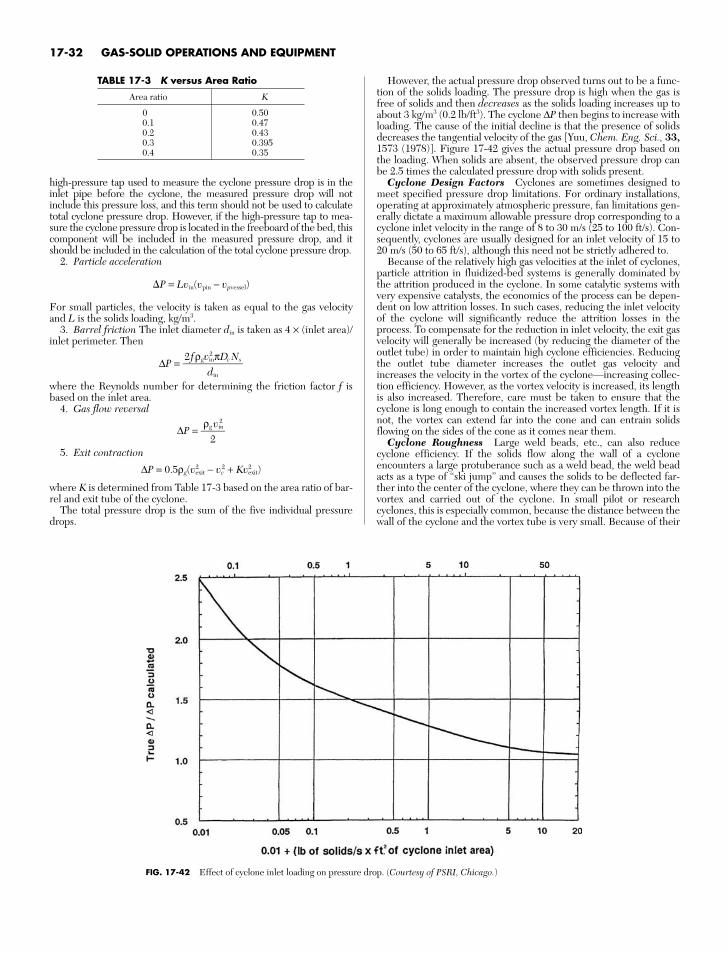
high-pressure tap used to measure the cyclone pressure drop is in theinlet pipe before the cyclone, the measured pressure drop will notinclude this pressure loss, and this term should not be used to calculatetotal cyclone pressure drop. However, if the high-pressure tap to mea-sure the cyclone pressure drop is located in the freeboard of the bed, thiscomponent will be included in the measured pressure drop, and itshould be included in the calculation of the total cyclone pressure drop.
2. Particle acceleration
P = Lvin(vpin − vpvessel)
For small particles, the velocity is taken as equal to the gas velocityand L is the solids loading, kg/m3.
3. Barrel friction The inlet diameter din is taken as 4 × (inlet area)/inlet perimeter. Then
∆P =
where the Reynolds number for determining the friction factor f isbased on the inlet area.
4. Gas flow reversal
∆P =
5. Exit contraction
∆P = 0.5ρg(v2exit − vc
2 + Kv2exit)
where K is determined from Table 17-3 based on the area ratio of bar-rel and exit tube of the cyclone.
The total pressure drop is the sum of the five individual pressuredrops.
ρgvin2
2
2 fρgvin2πDc Ns
din
However, the actual pressure drop observed turns out to be a func-tion of the solids loading. The pressure drop is high when the gas isfree of solids and then decreases as the solids loading increases up toabout 3 kg/m3 (0.2 lb/ft3). The cyclone ∆P then begins to increase withloading. The cause of the initial decline is that the presence of solidsdecreases the tangential velocity of the gas [Yuu, Chem. Eng. Sci., 33,1573 (1978)]. Figure 17-42 gives the actual pressure drop based onthe loading. When solids are absent, the observed pressure drop canbe 2.5 times the calculated pressure drop with solids present.
Cyclone Design Factors Cyclones are sometimes designed tomeet specified pressure drop limitations. For ordinary installations,operating at approximately atmospheric pressure, fan limitations gen-erally dictate a maximum allowable pressure drop corresponding to acyclone inlet velocity in the range of 8 to 30 m/s (25 to 100 ft/s). Con-sequently, cyclones are usually designed for an inlet velocity of 15 to20 m/s (50 to 65 ft/s), although this need not be strictly adhered to.
Because of the relatively high gas velocities at the inlet of cyclones,particle attrition in fluidized-bed systems is generally dominated bythe attrition produced in the cyclone. In some catalytic systems withvery expensive catalysts, the economics of the process can be depen-dent on low attrition losses. In such cases, reducing the inlet velocityof the cyclone will significantly reduce the attrition losses in theprocess. To compensate for the reduction in inlet velocity, the exit gasvelocity will generally be increased (by reducing the diameter of theoutlet tube) in order to maintain high cyclone efficiencies. Reducingthe outlet tube diameter increases the outlet gas velocity andincreases the velocity in the vortex of the cyclone—increasing collec-tion efficiency. However, as the vortex velocity is increased, its lengthis also increased. Therefore, care must be taken to ensure that thecyclone is long enough to contain the increased vortex length. If it isnot, the vortex can extend far into the cone and can entrain solidsflowing on the sides of the cone as it comes near them.
Cyclone Roughness Large weld beads, etc., can also reducecyclone efficiency. If the solids flow along the wall of a cycloneencounters a large protuberance such as a weld bead, the weld beadacts as a type of “ski jump” and causes the solids to be deflected far-ther into the center of the cyclone, where they can be thrown into thevortex and carried out of the cyclone. In small pilot or researchcyclones, this is especially common, because the distance between thewall of the cyclone and the vortex tube is very small. Because of their
17-32 GAS-SOLID OPERATIONS AND EQUIPMENT
TABLE 17-3 K versus Area Ratio
Area ratio K
0 0.500.1 0.470.2 0.430.3 0.3950.4 0.35
FIG. 17-42 Effect of cyclone inlet loading on pressure drop. (Courtesy of PSRI, Chicago.)
detrimental effect on cyclone efficiency, weld beads should be groundoff to make the cyclone inner wall smooth.
In high-temperature processes, cyclones are often lined withrefractory to both minimize heat loss and protect the metal surfacesfrom abrasion. These refractory surfaces are not as smooth as metal,but after a few days of operation, the refractory becomes smootherbecause of the abrasive action of the solids.
With very small laboratory or pilot cyclones, some solids (large poly-mer beads, spherical particles, etc.) can sometimes bounce off thecyclone wall immediately across from the cyclone inlet and bedeflected into the vortex. Very large particles can be found in the gasoutlet stream of the cyclone with these very small cyclones and withparticles that bounce. To increase cyclone efficiency with these typesof solids, the cyclone barrel diameter can be increased. This increasesthe distance between the cyclone vortex and the wall and preventsmost of the solids from bouncing back into the vortex.
Theoretically, a primary design factor that can be utilized to controlcollection efficiency is the cyclone diameter. A smaller-diameter unitoperating at a fixed pressure drop has a higher efficiency than a larger-diameter cyclone [Anderson, Chem. Metall. 40: 525 (1933); Drijver,Wärme 60: 333 (1937); and Whiton, Power 75: 344 (1932); Chem.Metall. 39: 150 (1932)]. In addition, smaller-diameter cyclones have amuch smaller overall length. Small-diameter cyclones, however, willrequire multiple units in parallel to give the same capacity as a largecyclone. In such cases, the smaller cyclones generally discharge thedust into a common receiving hopper [Whiton, Trans. Am. Soc. Mech.Eng. 63: 213 (1941)]. However, when cyclones discharge into a com-mon hopper, there is a tendency of the gas to produce “cross-talk.”This occurs when the gas exiting from one small cyclone passes up theexit of an adjoining cyclone, thus reducing efficiency. Various types ofmechanical devices are generally added to the bottom of these smallcyclones in parallel to reduce the cross-talk. The final cyclone designinvolves a compromise between collection efficiency and the com-plexity of equipment. It is customary to design systems for a singlecyclone for a given capacity, resorting to multiple parallel units only ifthe predicted collection efficiency is inadequate for a single unit orsingle units in series.
Reducing the gas outlet diameter should increase both collectionefficiency and pressure drop. To exit the cyclone, gas must enter thecyclonic flow associated with the outlet tube. If the outlet diameter isreduced, the outlet vortex increases in length to compensate. There-fore, when the outlet area is less than the inlet area, the length of thecyclone must increase. Too short a cyclone is associated with erosionof the cone and reentrainment of solids into the exit flow. Table 17-4gives the required increase in cyclone length as a function of outlet-to-inlet area. The cyclone length is measured centrally along a cylinder10 cm larger than the inner diameter of the outlet tube to preventinterference with the cone. If the cone interferes with this “extendedvortex,” the barrel must be lengthened.
As discussed above, theoretically a smaller-diameter cyclone shouldbe able to collect smaller particles because it can develop a highercentrifugal force. However, using smaller cyclones generally meansthat many have to be used in parallel to accommodate large gas flows.The problem with parallel cyclones (as indicated above) is that it is dif-ficult to get even distribution of solids into all the cyclones. If maldis-tribution occurs, this can cause inefficiencies that can negate thenatural advantage of the smaller cyclones.
Cyclone diameters can be very large. Perhaps the largest cyclonesare those used in circulating fluidized-bed combustors, where cyclonediameters approach 10 m. Large-diameter cyclones also result in verylong cyclones, and so these large-diameter, long-length cyclones are
really not feasible as internal cyclones in fluidized beds (they make thevessel too tall).
The minimum cone angle of the cyclone should be 60°. It is gener-ally greater, with steeper cone angles appropriate to materials that aremore cohesive. The cyclone inlet is usually rectangular (more efficientat getting material to the wall), but in some cases has been circular. Ineither case, projection of the inlet flow path should never cause inter-ference with the outlet tube. This generally means that the inlet widthof a cyclone should always be less than the distance between the walland the outside diameter of the outlet tube. If a very heavy solids load-ing is anticipated, the barrel diameter should be increased slightly tominimize interference with the outlet gas tube.
Collection efficiency is normally increased by increasing the gasthroughput (Drijver, op. cit.). However, if the entering dust is agglom-erated, high gas velocities may cause breakup of the agglomeratedsolids in the cyclone, so that efficiency remains the same or actuallydecreases. Also, variations in design proportions that result inincreased collection efficiency with dispersed dusts may be detrimen-tal with agglomerated dusts. Kalen and Zenz [Am. Inst. Chem. Eng.Symp. Ser. 70(137): 388 (1974)] report that collection efficiencyincreases with increasing gas inlet velocity up to a minimum tangentialvelocity at which dust is either reentrained or not deposited becauseof saltation. Koch and Licht [Chem. Eng. 84(24): 80 (1977)] estimatethat for typical cyclones the saltation velocity is consistent withcyclone inlet velocities in the range of 15 to 27 m/s (50 to 90 ft/s). Lap-ple (private communication) reports that in cyclone tests with talcdust, collection efficiency increased steadily as the inlet velocity wasincreased up to a maximum of 52 m/s (170 ft/s). With ilmenite dust,which was much more strongly flocculated, efficiency decreased overthe same inlet velocity range. In later experiments with well-dispersedtalc dust, collection efficiency continued to increase at inlet velocitiesup to the maximum used, 82 m/s (270 ft/s).
Another effect of increasing the cyclone inlet gas velocity is that fri-able materials may disintegrate (or attrit) as they hit the cyclone wallat high velocity. Thus, the increase in efficiency associated withincreased velocity may be more than lost due to generation of fineattrited material that the cyclone cannot contain.
Cyclones can be either placed in the freeboard above the fluidizedbed or located outside of the fluidized-bed vessel. There are advan-tages and disadvantages to each type of placement, and the optimumtype of placement depends on what is best for a particular process.
Internal cyclones have the advantages that they require no inletpiping (their inlets can be open to the freeboard) and no high-pres-sure shell, and they have straight cyclone diplegs. Internal cyclonesare generally smaller in diameter than external cyclones because theirsize is limited by the headspace available in the freeboard above thefluidized bed. These size limitations result in using several smallercyclones in parallel instead of one large cyclone. In addition, it is diffi-cult to aerate second-stage cyclone diplegs (generally an advantageoustechnique) when internal cyclones are used. Aerating secondarycyclone diplegs can improve the operation of the diplegs significantly.
The advantages of external cyclones are that (1) they can be muchlarger than internal cyclones, (2) they are more accessible than inter-nal cyclones, and (3) their diplegs can be aerated more easily. The dis-advantages of external cyclones are that (1) they require a pressureshell and (2) external cyclone diplegs generally require a section withan angled or a horizontal pipe to return the solids to the bed. Theangled or horizontal dipleg sections can result in poor dipleg opera-tion, if not designed correctly.
Cyclones in series may be justified under the following circum-stances:
1. The dust has a broad size distribution, including particles under10 to 15 µm as well as larger and possibly abrasive particles. A largelow-velocity cyclone may be used to remove the coarse particles aheadof a unit with small-diameter multiple tubes.
2. The dust is composed of fine particles but is highly flocculated ortends to flocculate in preceding equipment and in the cyclones them-selves. Efficiencies predicted on the basis of ultimate particle size willbe highly conservative.
3. The dust is relatively uniform, and the efficiency of the second-stage cyclone is not greatly lower than that of the first stage.
GAS-SOLIDS SEPARATIONS 17-33
TABLE 17-4 Required Cyclone Length as a Functionof Area Ratio
Aout /Ain Length below outlet tube/Dc
>1.0 2.00.8 2.20.6 2.60.4 3.2
4. Dependable operation is critical. Second-stage or even third-stage cyclones may be used as backup.
Cyclone Inlets The design of the cyclone inlet can greatly affectcyclone performance. It is generally desired to have the width of theinlet Bc as narrow as possible so that the entering solids will be as closeas possible to the cyclone wall where they can be collected. However,narrow inlet widths require that the height of the inlet H be very longin order to give an inlet area required for the desired inlet gas veloci-ties. Therefore, a balance between narrow inlet widths and the lengthof the inlet height has to be struck. Typically, low-loading cyclones(cyclones with inlet loadings less than approximately 2 to 5 kg/m3) haveheight/width ratios H/Bc of between 2.5 and 3.0. For high-loadingcyclones, this inlet aspect ratio can be increased to as high as 7 or sowith the correct design. Such high inlet aspect ratios require that thecyclone barrel length increase.
A common cyclone inlet is a rectangular tangential inlet with a con-stant area along its length. This type of inlet is satisfactory for manycyclones, especially those operating at low solids loadings. However, abetter type of inlet is one in which the inner wall of the inlet is angledtoward the outer cyclone wall at the cyclone inlet. This induces solidsmomentum toward the outer wall of the cyclone. The bottom wall ofthe inlet is angled downward so that the area decrease along the inletflow path is not too rapid and acceleration is controlled. In addition,the entire inlet can be angled slightly downward to give enhanced effi-ciencies. This type of inlet is superior to the constant-area tangentialinlet, especially for higher solids loadings (greater than 2 to 5 kg/m3).
Hugi and Reh [Chem. Eng. Technol. 21(9):716–719 (1998)] reportthat continuous acceleration of the solids throughout the inlet isdesired for improved efficiency and that the angled inlet describedabove achieves this. If the momentum of the solids is sufficient andthe solids are continuously accelerating along the length of the inlet,the stable, coherent strand important for high collection efficiencies isproduced.
The best inlet for high solids loadings is the volute cyclone inlet. Athigh inlet loadings (above approximately 2 to 3 kg/m3) in a tangentialcyclone inlet, the gas-solids stream expands rapidly from its minimumwidth at the point of contact. This rapid expansion disturbs the lami-nar gas flow around the gas outlet tube and causes flow separationaround the tube. At some loadings, the inlet stream can expand tosuch an extent that the solids can impact the gas outlet tube. Botheffects result in lowered cyclone efficiency. However, when a voluteinlet is used, the expanding solids stream is farther from the gas outlettube and enters at an angle so that the solids do not induce as muchflow separation or asymmetric flow around the gas outlet tube. There-fore, cyclone efficiency is not affected to as great a degree. If a tan-gential cyclone is used at high solids loadings, an extra distancebetween the gas outlet tube and the cyclone wall should be designedinto the cyclone to prevent the solids from impacting on the gas outlettube. At low solid loadings, the impacting on the gas outlet tube doesnot occur. Because tangential cyclone inlets are less expensive thanvolute inlets, the tangential cyclone is typically utilized for low load-ings—and the volute inlet cyclone is used for high loadings.
The nature of the gas solids flow in the inlet ducting to the cyclonecan affect cyclone efficiency significantly. If the solids in the inlet saltout on the bottom and result in dune formation and the resultingunsteady or pulsing flow, cyclone efficiency is adversely affected. Tominimize the possibility of this occurring, it is recommended that theinlet line to the cyclone operate above the saltation velocity [Gauthieret al., in Circulating Fluidized Bed Technology III, Basu, Horio, andHasatani (eds.), 1990, pp. 639–644], which will prevent the solidsfrom operating in the dune or pulsing flow regime. If this is not possi-ble, then the inlet line can be angled downward (approximately 15! to20!) to let gravity assist in the flow of the solids. Keeping the inlet lineas short as possible can also minimize any pulsing of the solids flow.
A cyclone will operate equally well on the suction or pressure sideof a fan if the dust receiver is airtight. Probably the greatest singlecause of poor cyclone performance, however, is the leakage of air intothe dust outlet of the cyclone. A slight air leak at this point can resultin a tremendous drop in collection efficiency, particularly with finedusts. For a cyclone operating under pressure, air leakage at this pointis objectionable primarily because of the local dust nuisance created.
For batch operation, an airtight hopper or receiver may be used. Forcontinuous withdrawal of collected dust, a rotary star valve, a double-lock valve, or a screw conveyor may be used, the latter only with finedusts. A collapsible open-ended rubber tube can be used for cyclonesoperating under slight negative pressure. Mechanical trickle and flap-per valves at the end of cyclone diplegs can also be used for continu-ous withdrawal into fluidized beds or into the freeboard of fluidizedbeds. Open diplegs simply immersed in a fluidized bed can be used incases where start-up losses are not excessive and are the simplest typeof discharge system returning solids to a fluidized bed (see “Fluidized-Bed Systems: Solids Discharge”). Special pneumatic unloadingdevices can also be used with dusts. In any case it is essential that suf-ficient unloading and receiving capacity be provided to prevent col-lected material from accumulating in the cyclone.
Solids Loading Cyclones can collect solids over a wide range ofloadings. Traditionally, solids loadings have been reported as eitherkilograms of solids per cubic meter of gas (kg/m3), or as kilograms ofsolids per kilogram of gas (kgs/kgg). However, loading based on massis probably not the best way to report solids loadings for cyclones.This is so because the volume of solids processed by a cyclone at thesame mass loading can vary greatly, depending on the density of thesolids. For example, many polymers have a bulk density of approxi-mately 400 kg/m3, and iron ore has a bulk density of approximately2400 kg/m3. This is a factor of 6. Therefore, a cyclone operating withpolymer would have to process 6 times the volume of solids that acyclone operating with iron ore would process at the same mass load-ing. If the cyclone operating with the polymer were designed to oper-ate at high loadings on a mass basis, it would probably plug. Inaddition, the diplegs below the cyclone operating with the polymermay experience operational problems because of the high volumetricloading.
At ambient conditions, cyclones have been operated at solids load-ings as low as 0.02 kg/m3 (0.0125 kg/kg) and as high as 64 kg/m3 (50kgs/kgg) or more. This is a factor of 3200. In general, cyclone efficiencyincreases with increasing solids loading. This is so because at higherloadings, very fine particles are trapped in the interstices of the largerparticles, and this entrapment increases the collection efficiency ofthe small particles. Even though collection efficiencies are increasedwith increased loading, cyclone loss rates are also increased as loadingis increased. This is so because the cyclone efficiency increase isalmost always less than the increase in the solids loading.
Generally cone-and-disk baffles, helical guide vanes, etc., placedinside a cyclone, will have a detrimental effect on performance. How-ever, a few of these devices do have some merit under special circum-stances. Although an inlet vane will reduce pressure drop (and mayresult in significant erosion), it generally causes a correspondinglygreater reduction in collection efficiency. Its use is recommended onlywhen collection efficiency is normally so high as to be a secondaryconsideration, and when it is desired to decrease the resistance of anexisting cyclone system for purposes of increased air handling capac-ity or when floorspace or headroom requirements are controlling fac-tors. If an inlet vane is used, it is advantageous to increase the gas exitduct length inside the cyclone chamber.
A disk or cone baffle located beneath the gas outlet duct may bebeneficial if air in-leakage at the dust outlet cannot be avoided. Aheavy chain suspended from the gas outlet duct has been found ben-eficial to minimize dust buildup on the cyclone walls in certain cir-cumstances. Such a chain should be suspended from a swivel so that itis free to rotate without twisting. Substantially all devices that havebeen reported to reduce pressure drop do so by reducing spiral veloc-ities in the cyclone chamber and consequently result in reduced col-lection efficiency.
At low dust loadings, the pressure in the dust receiver of a singlecyclone will generally be lower than in the gas outlet duct. Increaseddust loadings will increase the pressure in the dust receiver. Suchdevices as cones, disks, and inlet vanes will generally cause the pres-sure in the dust receiver to exceed that in the gas outlet duct. Acyclone will operate as well in a horizontal position as in a verticalposition. However, departure from the normal vertical position resultsin an increasing tendency to plug the dust outlet. If the dust outletbecomes plugged, collection efficiency will, of course, be low. If the
17-34 GAS-SOLID OPERATIONS AND EQUIPMENT
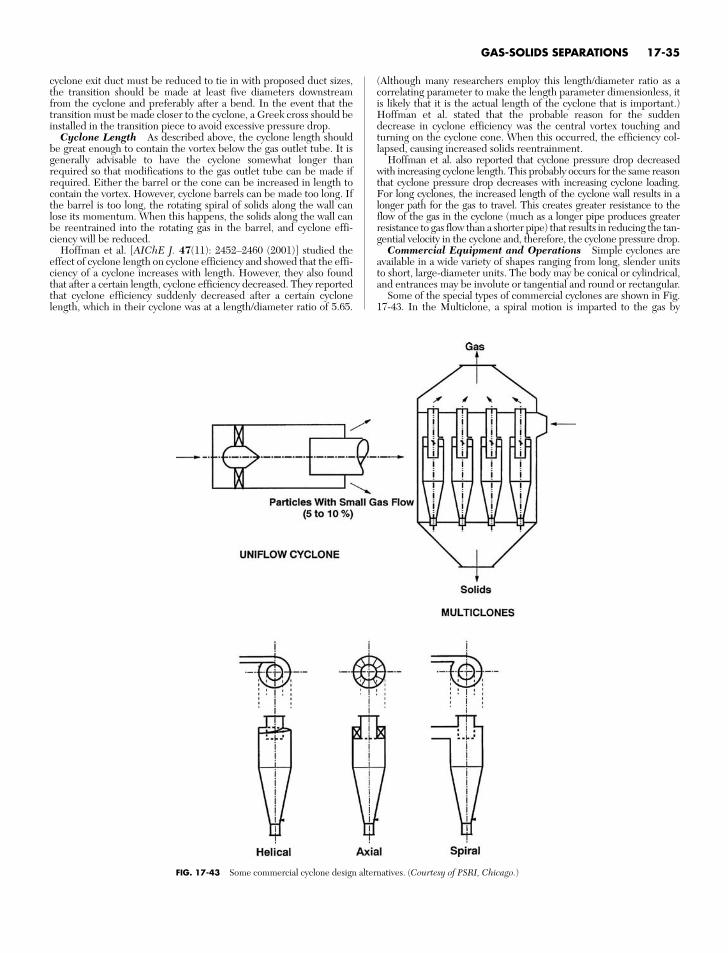
cyclone exit duct must be reduced to tie in with proposed duct sizes,the transition should be made at least five diameters downstreamfrom the cyclone and preferably after a bend. In the event that thetransition must be made closer to the cyclone, a Greek cross should beinstalled in the transition piece to avoid excessive pressure drop.
Cyclone Length As described above, the cyclone length shouldbe great enough to contain the vortex below the gas outlet tube. It isgenerally advisable to have the cyclone somewhat longer thanrequired so that modifications to the gas outlet tube can be made ifrequired. Either the barrel or the cone can be increased in length tocontain the vortex. However, cyclone barrels can be made too long. Ifthe barrel is too long, the rotating spiral of solids along the wall canlose its momentum. When this happens, the solids along the wall canbe reentrained into the rotating gas in the barrel, and cyclone effi-ciency will be reduced.
Hoffman et al. [AIChE J. 47(11): 2452–2460 (2001)] studied theeffect of cyclone length on cyclone efficiency and showed that the effi-ciency of a cyclone increases with length. However, they also foundthat after a certain length, cyclone efficiency decreased. They reportedthat cyclone efficiency suddenly decreased after a certain cyclonelength, which in their cyclone was at a length/diameter ratio of 5.65.
(Although many researchers employ this length/diameter ratio as acorrelating parameter to make the length parameter dimensionless, itis likely that it is the actual length of the cyclone that is important.)Hoffman et al. stated that the probable reason for the suddendecrease in cyclone efficiency was the central vortex touching andturning on the cyclone cone. When this occurred, the efficiency col-lapsed, causing increased solids reentrainment.
Hoffman et al. also reported that cyclone pressure drop decreasedwith increasing cyclone length. This probably occurs for the same reasonthat cyclone pressure drop decreases with increasing cyclone loading.For long cyclones, the increased length of the cyclone wall results in alonger path for the gas to travel. This creates greater resistance to theflow of the gas in the cyclone (much as a longer pipe produces greaterresistance to gas flow than a shorter pipe) that results in reducing the tan-gential velocity in the cyclone and, therefore, the cyclone pressure drop.
Commercial Equipment and Operations Simple cyclones areavailable in a wide variety of shapes ranging from long, slender unitsto short, large-diameter units. The body may be conical or cylindrical,and entrances may be involute or tangential and round or rectangular.
Some of the special types of commercial cyclones are shown in Fig.17-43. In the Multiclone, a spiral motion is imparted to the gas by
GAS-SOLIDS SEPARATIONS 17-35
FIG. 17-43 Some commercial cyclone design alternatives. (Courtesy of PSRI, Chicago.)
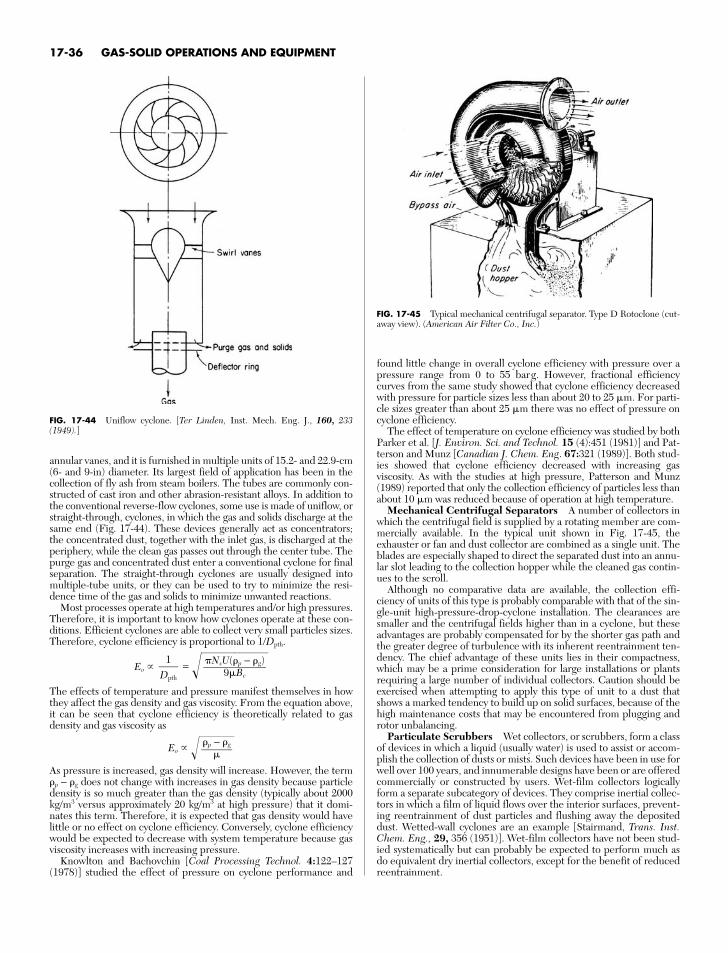
annular vanes, and it is furnished in multiple units of 15.2- and 22.9-cm(6- and 9-in) diameter. Its largest field of application has been in thecollection of fly ash from steam boilers. The tubes are commonly con-structed of cast iron and other abrasion-resistant alloys. In addition tothe conventional reverse-flow cyclones, some use is made of uniflow, orstraight-through, cyclones, in which the gas and solids discharge at thesame end (Fig. 17-44). These devices generally act as concentrators;the concentrated dust, together with the inlet gas, is discharged at theperiphery, while the clean gas passes out through the center tube. Thepurge gas and concentrated dust enter a conventional cyclone for finalseparation. The straight-through cyclones are usually designed intomultiple-tube units, or they can be used to try to minimize the resi-dence time of the gas and solids to minimize unwanted reactions.
Most processes operate at high temperatures and/or high pressures.Therefore, it is important to know how cyclones operate at these con-ditions. Efficient cyclones are able to collect very small particles sizes.Therefore, cyclone efficiency is proportional to 1/Dpth.
Eo - = The effects of temperature and pressure manifest themselves in howthey affect the gas density and gas viscosity. From the equation above,it can be seen that cyclone efficiency is theoretically related to gasdensity and gas viscosity as
Eo - As pressure is increased, gas density will increase. However, the termp − g does not change with increases in gas density because particledensity is so much greater than the gas density (typically about 2000kg/m3 versus approximately 20 kg/m3 at high pressure) that it domi-nates this term. Therefore, it is expected that gas density would havelittle or no effect on cyclone efficiency. Conversely, cyclone efficiencywould be expected to decrease with system temperature because gasviscosity increases with increasing pressure.
Knowlton and Bachovchin [Coal Processing Technol. 4:122–127(1978)] studied the effect of pressure on cyclone performance and
p − g
#NsU(p − g)9Bc
1Dpth
found little change in overall cyclone efficiency with pressure over apressure range from 0 to 55 barg. However, fractional efficiencycurves from the same study showed that cyclone efficiency decreasedwith pressure for particle sizes less than about 20 to 25 m. For parti-cle sizes greater than about 25 m there was no effect of pressure oncyclone efficiency.
The effect of temperature on cyclone efficiency was studied by bothParker et al. [J. Environ. Sci. and Technol. 15 (4):451 (1981)] and Pat-terson and Munz [Canadian J. Chem. Eng. 67:321 (1989)]. Both stud-ies showed that cyclone efficiency decreased with increasing gasviscosity. As with the studies at high pressure, Patterson and Munz(1989) reported that only the collection efficiency of particles less thanabout 10 m was reduced because of operation at high temperature.
Mechanical Centrifugal Separators A number of collectors inwhich the centrifugal field is supplied by a rotating member are com-mercially available. In the typical unit shown in Fig. 17-45, theexhauster or fan and dust collector are combined as a single unit. Theblades are especially shaped to direct the separated dust into an annu-lar slot leading to the collection hopper while the cleaned gas contin-ues to the scroll.
Although no comparative data are available, the collection effi-ciency of units of this type is probably comparable with that of the sin-gle-unit high-pressure-drop-cyclone installation. The clearances aresmaller and the centrifugal fields higher than in a cyclone, but theseadvantages are probably compensated for by the shorter gas path andthe greater degree of turbulence with its inherent reentrainment ten-dency. The chief advantage of these units lies in their compactness,which may be a prime consideration for large installations or plantsrequiring a large number of individual collectors. Caution should beexercised when attempting to apply this type of unit to a dust thatshows a marked tendency to build up on solid surfaces, because of thehigh maintenance costs that may be encountered from plugging androtor unbalancing.
Particulate Scrubbers Wet collectors, or scrubbers, form a classof devices in which a liquid (usually water) is used to assist or accom-plish the collection of dusts or mists. Such devices have been in use forwell over 100 years, and innumerable designs have been or are offeredcommercially or constructed by users. Wet-film collectors logicallyform a separate subcategory of devices. They comprise inertial collec-tors in which a film of liquid flows over the interior surfaces, prevent-ing reentrainment of dust particles and flushing away the depositeddust. Wetted-wall cyclones are an example [Stairmand, Trans. Inst.Chem. Eng., 29, 356 (1951)]. Wet-film collectors have not been stud-ied systematically but can probably be expected to perform much asdo equivalent dry inertial collectors, except for the benefit of reducedreentrainment.
17-36 GAS-SOLID OPERATIONS AND EQUIPMENT
FIG. 17-44 Uniflow cyclone. [Ter Linden, Inst. Mech. Eng. J., 160, 233(1949).]
FIG. 17-45 Typical mechanical centrifugal separator. Type D Rotoclone (cut-away view). (American Air Filter Co., Inc.)
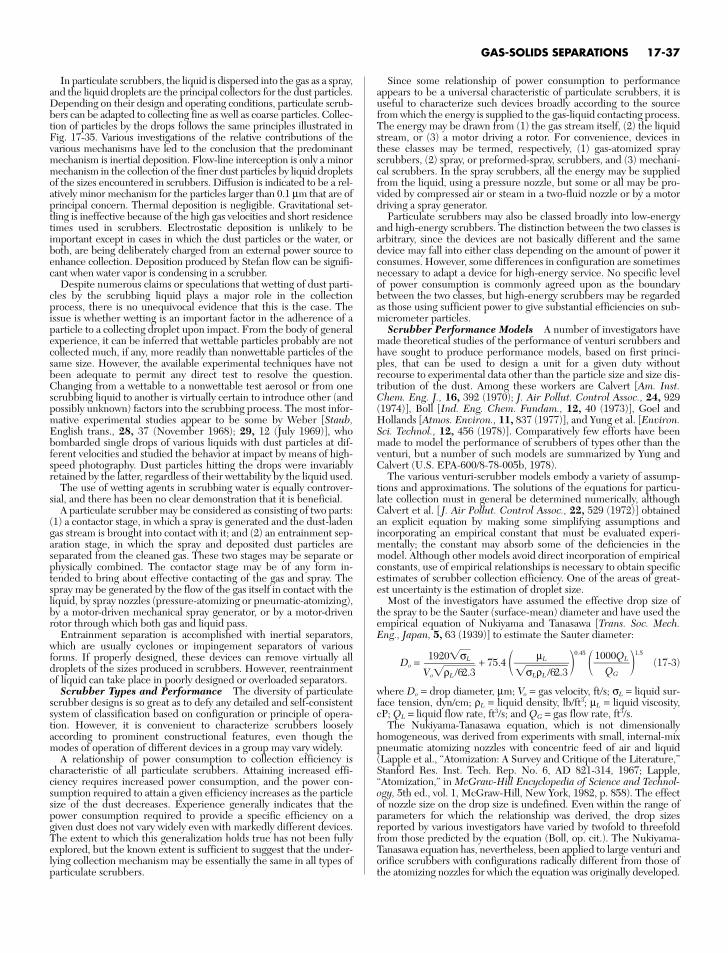
In particulate scrubbers, the liquid is dispersed into the gas as a spray,and the liquid droplets are the principal collectors for the dust particles.Depending on their design and operating conditions, particulate scrub-bers can be adapted to collecting fine as well as coarse particles. Collec-tion of particles by the drops follows the same principles illustrated inFig. 17-35. Various investigations of the relative contributions of thevarious mechanisms have led to the conclusion that the predominantmechanism is inertial deposition. Flow-line interception is only a minormechanism in the collection of the finer dust particles by liquid dropletsof the sizes encountered in scrubbers. Diffusion is indicated to be a rel-atively minor mechanism for the particles larger than 0.1 µm that are ofprincipal concern. Thermal deposition is negligible. Gravitational set-tling is ineffective because of the high gas velocities and short residencetimes used in scrubbers. Electrostatic deposition is unlikely to beimportant except in cases in which the dust particles or the water, orboth, are being deliberately charged from an external power source toenhance collection. Deposition produced by Stefan flow can be signifi-cant when water vapor is condensing in a scrubber.
Despite numerous claims or speculations that wetting of dust parti-cles by the scrubbing liquid plays a major role in the collectionprocess, there is no unequivocal evidence that this is the case. Theissue is whether wetting is an important factor in the adherence of aparticle to a collecting droplet upon impact. From the body of generalexperience, it can be inferred that wettable particles probably are notcollected much, if any, more readily than nonwettable particles of thesame size. However, the available experimental techniques have notbeen adequate to permit any direct test to resolve the question.Changing from a wettable to a nonwettable test aerosol or from onescrubbing liquid to another is virtually certain to introduce other (andpossibly unknown) factors into the scrubbing process. The most infor-mative experimental studies appear to be some by Weber [Staub,English trans., 28, 37 (November 1968); 29, 12 (July 1969)], whobombarded single drops of various liquids with dust particles at dif-ferent velocities and studied the behavior at impact by means of high-speed photography. Dust particles hitting the drops were invariablyretained by the latter, regardless of their wettability by the liquid used.
The use of wetting agents in scrubbing water is equally controver-sial, and there has been no clear demonstration that it is beneficial.
A particulate scrubber may be considered as consisting of two parts:(1) a contactor stage, in which a spray is generated and the dust-ladengas stream is brought into contact with it; and (2) an entrainment sep-aration stage, in which the spray and deposited dust particles are separated from the cleaned gas. These two stages may be separate orphysically combined. The contactor stage may be of any form in-tended to bring about effective contacting of the gas and spray. Thespray may be generated by the flow of the gas itself in contact with theliquid, by spray nozzles (pressure-atomizing or pneumatic-atomizing),by a motor-driven mechanical spray generator, or by a motor-drivenrotor through which both gas and liquid pass.
Entrainment separation is accomplished with inertial separators,which are usually cyclones or impingement separators of variousforms. If properly designed, these devices can remove virtually alldroplets of the sizes produced in scrubbers. However, reentrainmentof liquid can take place in poorly designed or overloaded separators.
Scrubber Types and Performance The diversity of particulatescrubber designs is so great as to defy any detailed and self-consistentsystem of classification based on configuration or principle of opera-tion. However, it is convenient to characterize scrubbers looselyaccording to prominent constructional features, even though themodes of operation of different devices in a group may vary widely.
A relationship of power consumption to collection efficiency ischaracteristic of all particulate scrubbers. Attaining increased effi-ciency requires increased power consumption, and the power con-sumption required to attain a given efficiency increases as the particlesize of the dust decreases. Experience generally indicates that thepower consumption required to provide a specific efficiency on agiven dust does not vary widely even with markedly different devices.The extent to which this generalization holds true has not been fullyexplored, but the known extent is sufficient to suggest that the under-lying collection mechanism may be essentially the same in all types ofparticulate scrubbers.
Since some relationship of power consumption to performanceappears to be a universal characteristic of particulate scrubbers, it isuseful to characterize such devices broadly according to the sourcefrom which the energy is supplied to the gas-liquid contacting process.The energy may be drawn from (1) the gas stream itself, (2) the liquidstream, or (3) a motor driving a rotor. For convenience, devices inthese classes may be termed, respectively, (1) gas-atomized sprayscrubbers, (2) spray, or preformed-spray, scrubbers, and (3) mechani-cal scrubbers. In the spray scrubbers, all the energy may be suppliedfrom the liquid, using a pressure nozzle, but some or all may be pro-vided by compressed air or steam in a two-fluid nozzle or by a motordriving a spray generator.
Particulate scrubbers may also be classed broadly into low-energyand high-energy scrubbers. The distinction between the two classes isarbitrary, since the devices are not basically different and the samedevice may fall into either class depending on the amount of power itconsumes. However, some differences in configuration are sometimesnecessary to adapt a device for high-energy service. No specific levelof power consumption is commonly agreed upon as the boundarybetween the two classes, but high-energy scrubbers may be regardedas those using sufficient power to give substantial efficiencies on sub-micrometer particles.
Scrubber Performance Models A number of investigators havemade theoretical studies of the performance of venturi scrubbers andhave sought to produce performance models, based on first princi-ples, that can be used to design a unit for a given duty withoutrecourse to experimental data other than the particle size and size dis-tribution of the dust. Among these workers are Calvert [Am. Inst.Chem. Eng. J., 16, 392 (1970); J. Air Pollut. Control Assoc., 24, 929(1974)], Boll [Ind. Eng. Chem. Fundam., 12, 40 (1973)], Goel andHollands [Atmos. Environ., 11, 837 (1977)], and Yung et al. [Environ.Sci. Technol., 12, 456 (1978)]. Comparatively few efforts have beenmade to model the performance of scrubbers of types other than theventuri, but a number of such models are summarized by Yung andCalvert (U.S. EPA-600/8-78-005b, 1978).
The various venturi-scrubber models embody a variety of assump-tions and approximations. The solutions of the equations for particu-late collection must in general be determined numerically, althoughCalvert et al. [J. Air Pollut. Control Assoc., 22, 529 (1972)] obtainedan explicit equation by making some simplifying assumptions andincorporating an empirical constant that must be evaluated experi-mentally; the constant may absorb some of the deficiencies in themodel. Although other models avoid direct incorporation of empiricalconstants, use of empirical relationships is necessary to obtain specificestimates of scrubber collection efficiency. One of the areas of great-est uncertainty is the estimation of droplet size.
Most of the investigators have assumed the effective drop size ofthe spray to be the Sauter (surface-mean) diameter and have used theempirical equation of Nukiyama and Tanasawa [Trans. Soc. Mech.Eng., Japan, 5, 63 (1939)] to estimate the Sauter diameter:
Do = + 75.4 0.45
1.5
(17-3)
where Do = drop diameter, µm; Vo = gas velocity, ft/s; σL = liquid sur-face tension, dyn/cm; ρL = liquid density, lb/ft3; µL = liquid viscosity,cP; QL = liquid flow rate, ft3/s; and QG = gas flow rate, ft3/s.
The Nukiyama-Tanasawa equation, which is not dimensionallyhomogeneous, was derived from experiments with small, internal-mixpneumatic atomizing nozzles with concentric feed of air and liquid(Lapple et al., “Atomization: A Survey and Critique of the Literature,”Stanford Res. Inst. Tech. Rep. No. 6, AD 821-314, 1967; Lapple,“Atomization,” in McGraw-Hill Encyclopedia of Science and Technol-ogy, 5th ed., vol. 1, McGraw-Hill, New York, 1982, p. 858). The effectof nozzle size on the drop size is undefined. Even within the range ofparameters for which the relationship was derived, the drop sizesreported by various investigators have varied by twofold to threefoldfrom those predicted by the equation (Boll, op. cit.). The Nukiyama-Tanasawa equation has, nevertheless, been applied to large venturi andorifice scrubbers with configurations radically different from those ofthe atomizing nozzles for which the equation was originally developed.
1000QL
QG
µLσLρL /62.3
1920σLVoρL / 62.3
GAS-SOLIDS SEPARATIONS 17-37
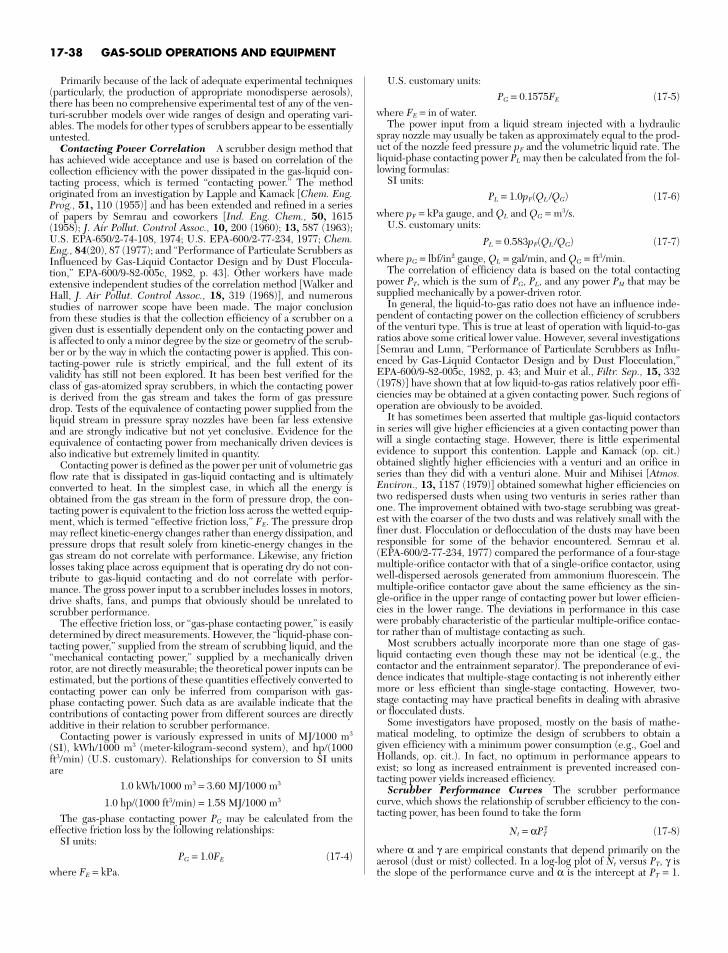
Primarily because of the lack of adequate experimental techniques(particularly, the production of appropriate monodisperse aerosols),there has been no comprehensive experimental test of any of the ven-turi-scrubber models over wide ranges of design and operating vari-ables. The models for other types of scrubbers appear to be essentiallyuntested.
Contacting Power Correlation A scrubber design method thathas achieved wide acceptance and use is based on correlation of thecollection efficiency with the power dissipated in the gas-liquid con-tacting process, which is termed “contacting power.” The methodoriginated from an investigation by Lapple and Kamack [Chem. Eng.Prog., 51, 110 (1955)] and has been extended and refined in a seriesof papers by Semrau and coworkers [Ind. Eng. Chem., 50, 1615(1958); J. Air Pollut. Control Assoc., 10, 200 (1960); 13, 587 (1963);U.S. EPA-650/2-74-108, 1974; U.S. EPA-600/2-77-234, 1977; Chem.Eng., 84(20), 87 (1977); and “Performance of Particulate Scrubbers asInfluenced by Gas-Liquid Contactor Design and by Dust Floccula-tion,” EPA-600/9-82-005c, 1982, p. 43]. Other workers have madeextensive independent studies of the correlation method [Walker andHall, J. Air Pollut. Control Assoc., 18, 319 (1968)], and numerousstudies of narrower scope have been made. The major conclusionfrom these studies is that the collection efficiency of a scrubber on agiven dust is essentially dependent only on the contacting power andis affected to only a minor degree by the size or geometry of the scrub-ber or by the way in which the contacting power is applied. This con-tacting-power rule is strictly empirical, and the full extent of itsvalidity has still not been explored. It has been best verified for theclass of gas-atomized spray scrubbers, in which the contacting poweris derived from the gas stream and takes the form of gas pressuredrop. Tests of the equivalence of contacting power supplied from theliquid stream in pressure spray nozzles have been far less extensiveand are strongly indicative but not yet conclusive. Evidence for theequivalence of contacting power from mechanically driven devices isalso indicative but extremely limited in quantity.
Contacting power is defined as the power per unit of volumetric gasflow rate that is dissipated in gas-liquid contacting and is ultimatelyconverted to heat. In the simplest case, in which all the energy isobtained from the gas stream in the form of pressure drop, the con-tacting power is equivalent to the friction loss across the wetted equip-ment, which is termed “effective friction loss,” FE. The pressure dropmay reflect kinetic-energy changes rather than energy dissipation, andpressure drops that result solely from kinetic-energy changes in thegas stream do not correlate with performance. Likewise, any frictionlosses taking place across equipment that is operating dry do not con-tribute to gas-liquid contacting and do not correlate with perfor-mance. The gross power input to a scrubber includes losses in motors,drive shafts, fans, and pumps that obviously should be unrelated toscrubber performance.
The effective friction loss, or “gas-phase contacting power,” is easilydetermined by direct measurements. However, the “liquid-phase con-tacting power,” supplied from the stream of scrubbing liquid, and the“mechanical contacting power,” supplied by a mechanically drivenrotor, are not directly measurable; the theoretical power inputs can beestimated, but the portions of these quantities effectively converted tocontacting power can only be inferred from comparison with gas-phase contacting power. Such data as are available indicate that thecontributions of contacting power from different sources are directlyadditive in their relation to scrubber performance.
Contacting power is variously expressed in units of MJ/1000 m3
(SI), kWh/1000 m3 (meter-kilogram-second system), and hp/(1000ft3/min) (U.S. customary). Relationships for conversion to SI unitsare
1.0 kWh/1000 m3 = 3.60 MJ/1000 m3
1.0 hp/(1000 ft3/min) = 1.58 MJ/1000 m3
The gas-phase contacting power PG may be calculated from theeffective friction loss by the following relationships:
SI units:PG = 1.0FE (17-4)
where FE = kPa.
U.S. customary units:PG = 0.1575FE (17-5)
where FE = in of water.The power input from a liquid stream injected with a hydraulic
spray nozzle may usually be taken as approximately equal to the prod-uct of the nozzle feed pressure pF and the volumetric liquid rate. Theliquid-phase contacting power PL may then be calculated from the fol-lowing formulas:
SI units:PL = 1.0pF(QL /QG) (17-6)
where pF = kPa gauge, and QL and QG = m3/s.U.S. customary units:
PL = 0.583pF(QL /QG) (17-7)
where pG = lbf/in2 gauge, QL = gal/min, and QG = ft3/min.The correlation of efficiency data is based on the total contacting
power PT, which is the sum of PG, PL, and any power PM that may besupplied mechanically by a power-driven rotor.
In general, the liquid-to-gas ratio does not have an influence inde-pendent of contacting power on the collection efficiency of scrubbersof the venturi type. This is true at least of operation with liquid-to-gasratios above some critical lower value. However, several investigations[Semrau and Lunn, “Performance of Particulate Scrubbers as Influ-enced by Gas-Liquid Contactor Design and by Dust Flocculation,”EPA-600/9-82-005c, 1982, p. 43; and Muir et al., Filtr. Sep., 15, 332(1978)] have shown that at low liquid-to-gas ratios relatively poor effi-ciencies may be obtained at a given contacting power. Such regions ofoperation are obviously to be avoided.
It has sometimes been asserted that multiple gas-liquid contactorsin series will give higher efficiencies at a given contacting power thanwill a single contacting stage. However, there is little experimental evidence to support this contention. Lapple and Kamack (op. cit.)obtained slightly higher efficiencies with a venturi and an orifice inseries than they did with a venturi alone. Muir and Mihisei [Atmos.Environ., 13, 1187 (1979)] obtained somewhat higher efficiencies ontwo redispersed dusts when using two venturis in series rather thanone. The improvement obtained with two-stage scrubbing was great-est with the coarser of the two dusts and was relatively small with thefiner dust. Flocculation or deflocculation of the dusts may have beenresponsible for some of the behavior encountered. Semrau et al.(EPA-600/2-77-234, 1977) compared the performance of a four-stagemultiple-orifice contactor with that of a single-orifice contactor, usingwell-dispersed aerosols generated from ammonium fluorescein. Themultiple-orifice contactor gave about the same efficiency as the sin-gle-orifice in the upper range of contacting power but lower efficien-cies in the lower range. The deviations in performance in this casewere probably characteristic of the particular multiple-orifice contac-tor rather than of multistage contacting as such.
Most scrubbers actually incorporate more than one stage of gas-liquid contacting even though these may not be identical (e.g., thecontactor and the entrainment separator). The preponderance of evi-dence indicates that multiple-stage contacting is not inherently eithermore or less efficient than single-stage contacting. However, two-stage contacting may have practical benefits in dealing with abrasiveor flocculated dusts.
Some investigators have proposed, mostly on the basis of mathe-matical modeling, to optimize the design of scrubbers to obtain agiven efficiency with a minimum power consumption (e.g., Goel andHollands, op. cit.). In fact, no optimum in performance appears toexist; so long as increased entrainment is prevented increased con-tacting power yields increased efficiency.
Scrubber Performance Curves The scrubber performancecurve, which shows the relationship of scrubber efficiency to the con-tacting power, has been found to take the form
Nt = αPTγ (17-8)
where α and γ are empirical constants that depend primarily on theaerosol (dust or mist) collected. In a log-log plot of Nt versus PT, γ isthe slope of the performance curve and α is the intercept at PT = 1.
17-38 GAS-SOLID OPERATIONS AND EQUIPMENT
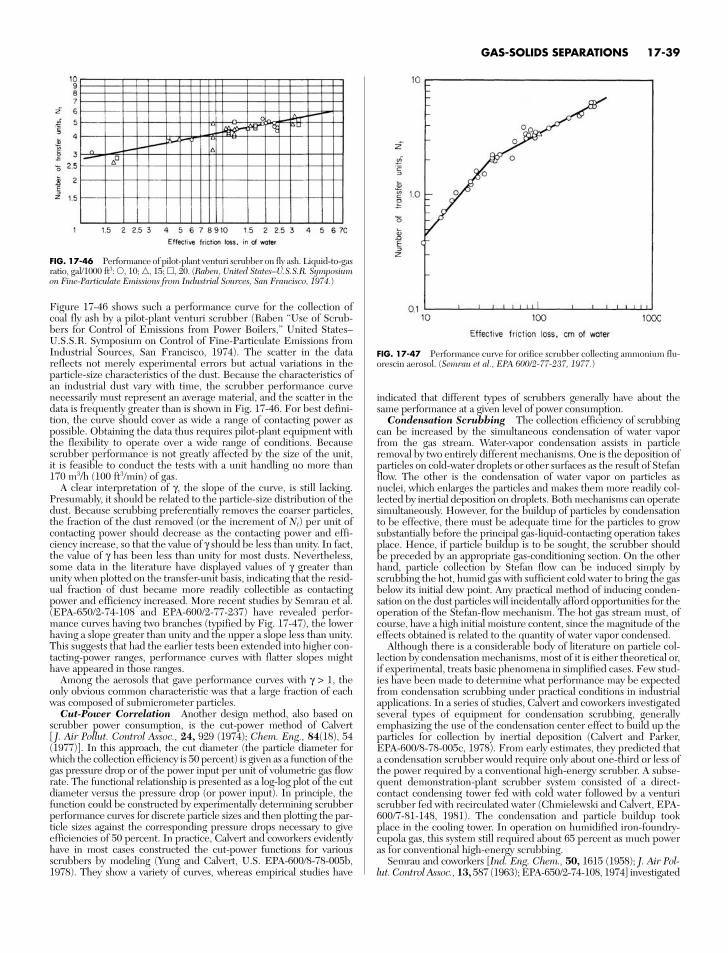
Figure 17-46 shows such a performance curve for the collection ofcoal fly ash by a pilot-plant venturi scrubber (Raben “Use of Scrub-bers for Control of Emissions from Power Boilers,” United States–U.S.S.R. Symposium on Control of Fine-Particulate Emissions fromIndustrial Sources, San Francisco, 1974). The scatter in the datareflects not merely experimental errors but actual variations in theparticle-size characteristics of the dust. Because the characteristics ofan industrial dust vary with time, the scrubber performance curvenecessarily must represent an average material, and the scatter in thedata is frequently greater than is shown in Fig. 17-46. For best defini-tion, the curve should cover as wide a range of contacting power aspossible. Obtaining the data thus requires pilot-plant equipment withthe flexibility to operate over a wide range of conditions. Becausescrubber performance is not greatly affected by the size of the unit, it is feasible to conduct the tests with a unit handling no more than 170 m3/h (100 ft3/min) of gas.
A clear interpretation of γ, the slope of the curve, is still lacking.Presumably, it should be related to the particle-size distribution of thedust. Because scrubbing preferentially removes the coarser particles,the fraction of the dust removed (or the increment of Nt) per unit ofcontacting power should decrease as the contacting power and effi-ciency increase, so that the value of γ should be less than unity. In fact,the value of γ has been less than unity for most dusts. Nevertheless,some data in the literature have displayed values of γ greater thanunity when plotted on the transfer-unit basis, indicating that the resid-ual fraction of dust became more readily collectible as contactingpower and efficiency increased. More recent studies by Semrau et al.(EPA-650/2-74-108 and EPA-600/2-77-237) have revealed perfor-mance curves having two branches (typified by Fig. 17-47), the lowerhaving a slope greater than unity and the upper a slope less than unity.This suggests that had the earlier tests been extended into higher con-tacting-power ranges, performance curves with flatter slopes mighthave appeared in those ranges.
Among the aerosols that gave performance curves with γ > 1, theonly obvious common characteristic was that a large fraction of eachwas composed of submicrometer particles.
Cut-Power Correlation Another design method, also based onscrubber power consumption, is the cut-power method of Calvert [ J. Air Pollut. Control Assoc., 24, 929 (1974); Chem. Eng., 84(18), 54(1977)]. In this approach, the cut diameter (the particle diameter forwhich the collection efficiency is 50 percent) is given as a function of thegas pressure drop or of the power input per unit of volumetric gas flowrate. The functional relationship is presented as a log-log plot of the cutdiameter versus the pressure drop (or power input). In principle, thefunction could be constructed by experimentally determining scrubberperformance curves for discrete particle sizes and then plotting the par-ticle sizes against the corresponding pressure drops necessary to giveefficiencies of 50 percent. In practice, Calvert and coworkers evidentlyhave in most cases constructed the cut-power functions for variousscrubbers by modeling (Yung and Calvert, U.S. EPA-600/8-78-005b,1978). They show a variety of curves, whereas empirical studies have
indicated that different types of scrubbers generally have about thesame performance at a given level of power consumption.
Condensation Scrubbing The collection efficiency of scrubbingcan be increased by the simultaneous condensation of water vaporfrom the gas stream. Water-vapor condensation assists in particleremoval by two entirely different mechanisms. One is the deposition ofparticles on cold-water droplets or other surfaces as the result of Stefanflow. The other is the condensation of water vapor on particles asnuclei, which enlarges the particles and makes them more readily col-lected by inertial deposition on droplets. Both mechanisms can operatesimultaneously. However, for the buildup of particles by condensationto be effective, there must be adequate time for the particles to growsubstantially before the principal gas-liquid-contacting operation takesplace. Hence, if particle buildup is to be sought, the scrubber shouldbe preceded by an appropriate gas-conditioning section. On the otherhand, particle collection by Stefan flow can be induced simply byscrubbing the hot, humid gas with sufficient cold water to bring the gasbelow its initial dew point. Any practical method of inducing conden-sation on the dust particles will incidentally afford opportunities for theoperation of the Stefan-flow mechanism. The hot gas stream must, ofcourse, have a high initial moisture content, since the magnitude of theeffects obtained is related to the quantity of water vapor condensed.
Although there is a considerable body of literature on particle col-lection by condensation mechanisms, most of it is either theoretical or,if experimental, treats basic phenomena in simplified cases. Few stud-ies have been made to determine what performance may be expectedfrom condensation scrubbing under practical conditions in industrialapplications. In a series of studies, Calvert and coworkers investigatedseveral types of equipment for condensation scrubbing, generallyemphasizing the use of the condensation center effect to build up theparticles for collection by inertial deposition (Calvert and Parker,EPA-600/8-78-005c, 1978). From early estimates, they predicted thata condensation scrubber would require only about one-third or less ofthe power required by a conventional high-energy scrubber. A subse-quent demonstration-plant scrubber system consisted of a direct-contact condensing tower fed with cold water followed by a venturiscrubber fed with recirculated water (Chmielewski and Calvert, EPA-600/7-81-148, 1981). The condensation and particle buildup tookplace in the cooling tower. In operation on humidified iron-foundry-cupola gas, this system still required about 65 percent as much poweras for conventional high-energy scrubbing.
Semrau and coworkers [Ind. Eng. Chem., 50, 1615 (1958); J. Air Pol-lut. Control Assoc., 13, 587 (1963); EPA-650/2-74-108, 1974] investigated
GAS-SOLIDS SEPARATIONS 17-39
FIG. 17-46 Performance of pilot-plant venturi scrubber on fly ash. Liquid-to-gasratio, gal/1000 ft3: , 10; , 15; , 20. (Raben, United States–U.S.S.R. Symposiumon Fine-Particulate Emissions from Industrial Sources, San Francisco, 1974.)
FIG. 17-47 Performance curve for orifice scrubber collecting ammonium flu-orescin aerosol. (Semrau et al., EPA 600/2-77-237, 1977.)
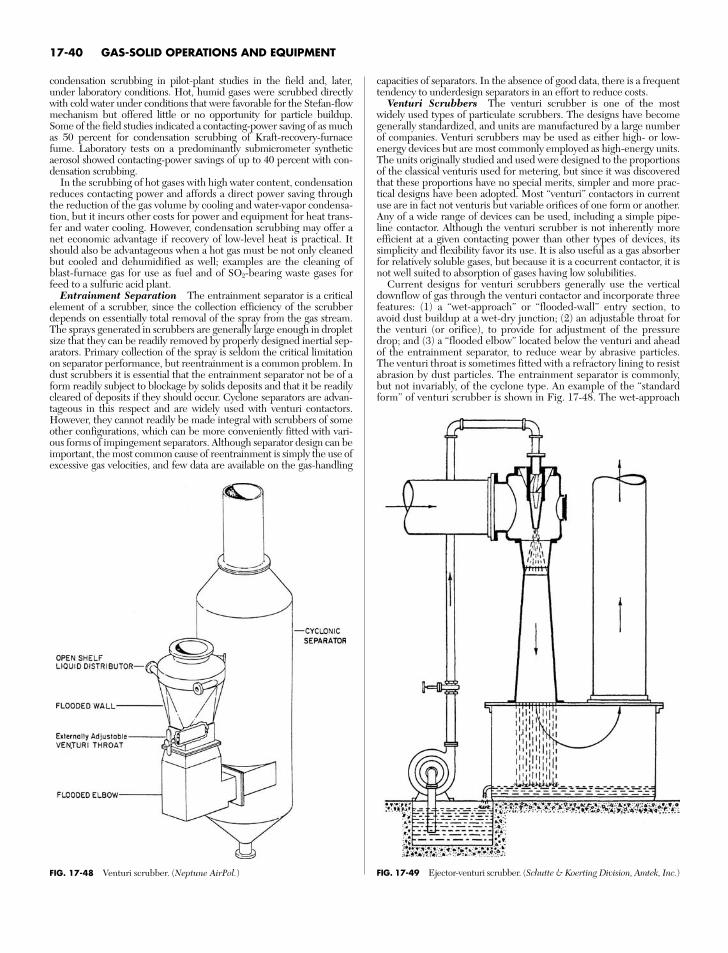
condensation scrubbing in pilot-plant studies in the field and, later,under laboratory conditions. Hot, humid gases were scrubbed directlywith cold water under conditions that were favorable for the Stefan-flowmechanism but offered little or no opportunity for particle buildup.Some of the field studies indicated a contacting-power saving of as muchas 50 percent for condensation scrubbing of Kraft-recovery-furnacefume. Laboratory tests on a predominantly submicrometer syntheticaerosol showed contacting-power savings of up to 40 percent with con-densation scrubbing.
In the scrubbing of hot gases with high water content, condensationreduces contacting power and affords a direct power saving throughthe reduction of the gas volume by cooling and water-vapor condensa-tion, but it incurs other costs for power and equipment for heat trans-fer and water cooling. However, condensation scrubbing may offer anet economic advantage if recovery of low-level heat is practical. Itshould also be advantageous when a hot gas must be not only cleanedbut cooled and dehumidified as well; examples are the cleaning ofblast-furnace gas for use as fuel and of SO2-bearing waste gases forfeed to a sulfuric acid plant.
Entrainment Separation The entrainment separator is a criticalelement of a scrubber, since the collection efficiency of the scrubberdepends on essentially total removal of the spray from the gas stream.The sprays generated in scrubbers are generally large enough in dropletsize that they can be readily removed by properly designed inertial sep-arators. Primary collection of the spray is seldom the critical limitationon separator performance, but reentrainment is a common problem. Indust scrubbers it is essential that the entrainment separator not be of aform readily subject to blockage by solids deposits and that it be readilycleared of deposits if they should occur. Cyclone separators are advan-tageous in this respect and are widely used with venturi contactors.However, they cannot readily be made integral with scrubbers of someother configurations, which can be more conveniently fitted with vari-ous forms of impingement separators. Although separator design can beimportant, the most common cause of reentrainment is simply the use ofexcessive gas velocities, and few data are available on the gas-handling
capacities of separators. In the absence of good data, there is a frequenttendency to underdesign separators in an effort to reduce costs.
Venturi Scrubbers The venturi scrubber is one of the mostwidely used types of particulate scrubbers. The designs have becomegenerally standardized, and units are manufactured by a large numberof companies. Venturi scrubbers may be used as either high- or low-energy devices but are most commonly employed as high-energy units.The units originally studied and used were designed to the proportionsof the classical venturis used for metering, but since it was discoveredthat these proportions have no special merits, simpler and more prac-tical designs have been adopted. Most “venturi” contactors in currentuse are in fact not venturis but variable orifices of one form or another.Any of a wide range of devices can be used, including a simple pipe-line contactor. Although the venturi scrubber is not inherently moreefficient at a given contacting power than other types of devices, itssimplicity and flexibility favor its use. It is also useful as a gas absorberfor relatively soluble gases, but because it is a cocurrent contactor, it isnot well suited to absorption of gases having low solubilities.
Current designs for venturi scrubbers generally use the verticaldownflow of gas through the venturi contactor and incorporate threefeatures: (1) a “wet-approach” or “flooded-wall” entry section, toavoid dust buildup at a wet-dry junction; (2) an adjustable throat forthe venturi (or orifice), to provide for adjustment of the pressuredrop; and (3) a “flooded elbow” located below the venturi and aheadof the entrainment separator, to reduce wear by abrasive particles.The venturi throat is sometimes fitted with a refractory lining to resistabrasion by dust particles. The entrainment separator is commonly,but not invariably, of the cyclone type. An example of the “standardform” of venturi scrubber is shown in Fig. 17-48. The wet-approach
17-40 GAS-SOLID OPERATIONS AND EQUIPMENT
FIG. 17-48 Venturi scrubber. (Neptune AirPol.) FIG. 17-49 Ejector-venturi scrubber. (Schutte & Koerting Division, Amtek, Inc.)
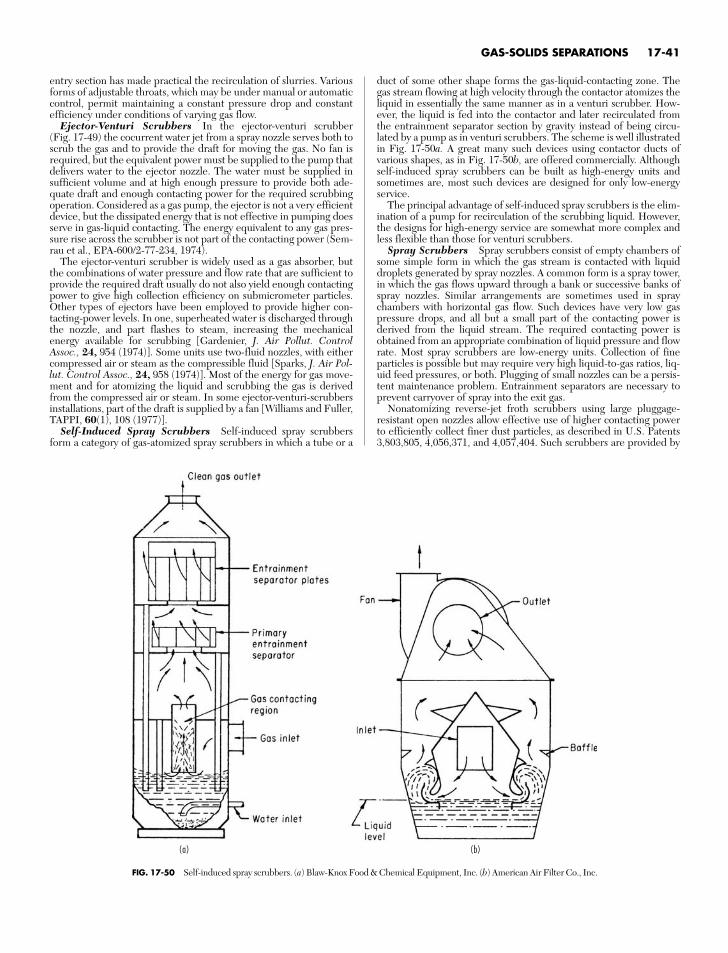
entry section has made practical the recirculation of slurries. Variousforms of adjustable throats, which may be under manual or automaticcontrol, permit maintaining a constant pressure drop and constantefficiency under conditions of varying gas flow.
Ejector-Venturi Scrubbers In the ejector-venturi scrubber(Fig. 17-49) the cocurrent water jet from a spray nozzle serves both toscrub the gas and to provide the draft for moving the gas. No fan isrequired, but the equivalent power must be supplied to the pump thatdelivers water to the ejector nozzle. The water must be supplied insufficient volume and at high enough pressure to provide both ade-quate draft and enough contacting power for the required scrubbingoperation. Considered as a gas pump, the ejector is not a very efficientdevice, but the dissipated energy that is not effective in pumping doesserve in gas-liquid contacting. The energy equivalent to any gas pres-sure rise across the scrubber is not part of the contacting power (Sem-rau et al., EPA-600/2-77-234, 1974).
The ejector-venturi scrubber is widely used as a gas absorber, butthe combinations of water pressure and flow rate that are sufficient toprovide the required draft usually do not also yield enough contactingpower to give high collection efficiency on submicrometer particles.Other types of ejectors have been employed to provide higher con-tacting-power levels. In one, superheated water is discharged throughthe nozzle, and part flashes to steam, increasing the mechanicalenergy available for scrubbing [Gardenier, J. Air Pollut. ControlAssoc., 24, 954 (1974)]. Some units use two-fluid nozzles, with eithercompressed air or steam as the compressible fluid [Sparks, J. Air Pol-lut. Control Assoc., 24, 958 (1974)]. Most of the energy for gas move-ment and for atomizing the liquid and scrubbing the gas is derivedfrom the compressed air or steam. In some ejector-venturi-scrubbersinstallations, part of the draft is supplied by a fan [Williams and Fuller,TAPPI, 60(1), 108 (1977)].
Self-Induced Spray Scrubbers Self-induced spray scrubbersform a category of gas-atomized spray scrubbers in which a tube or a
duct of some other shape forms the gas-liquid-contacting zone. Thegas stream flowing at high velocity through the contactor atomizes theliquid in essentially the same manner as in a venturi scrubber. How-ever, the liquid is fed into the contactor and later recirculated fromthe entrainment separator section by gravity instead of being circu-lated by a pump as in venturi scrubbers. The scheme is well illustratedin Fig. 17-50a. A great many such devices using contactor ducts of various shapes, as in Fig. 17-50b, are offered commercially. Althoughself-induced spray scrubbers can be built as high-energy units andsometimes are, most such devices are designed for only low-energyservice.
The principal advantage of self-induced spray scrubbers is the elim-ination of a pump for recirculation of the scrubbing liquid. However,the designs for high-energy service are somewhat more complex andless flexible than those for venturi scrubbers.
Spray Scrubbers Spray scrubbers consist of empty chambers ofsome simple form in which the gas stream is contacted with liquiddroplets generated by spray nozzles. A common form is a spray tower,in which the gas flows upward through a bank or successive banks ofspray nozzles. Similar arrangements are sometimes used in spraychambers with horizontal gas flow. Such devices have very low gaspressure drops, and all but a small part of the contacting power isderived from the liquid stream. The required contacting power isobtained from an appropriate combination of liquid pressure and flowrate. Most spray scrubbers are low-energy units. Collection of fineparticles is possible but may require very high liquid-to-gas ratios, liq-uid feed pressures, or both. Plugging of small nozzles can be a persis-tent maintenance problem. Entrainment separators are necessary toprevent carryover of spray into the exit gas.
Nonatomizing reverse-jet froth scrubbers using large pluggage-resistant open nozzles allow effective use of higher contacting powerto efficiently collect finer dust particles, as described in U.S. Patents3,803,805, 4,056,371, and 4,057,404. Such scrubbers are provided by
GAS-SOLIDS SEPARATIONS 17-41
FIG. 17-50 Self-induced spray scrubbers. (a) Blaw-Knox Food & Chemical Equipment, Inc. (b) American Air Filter Co., Inc.
(a) (b)
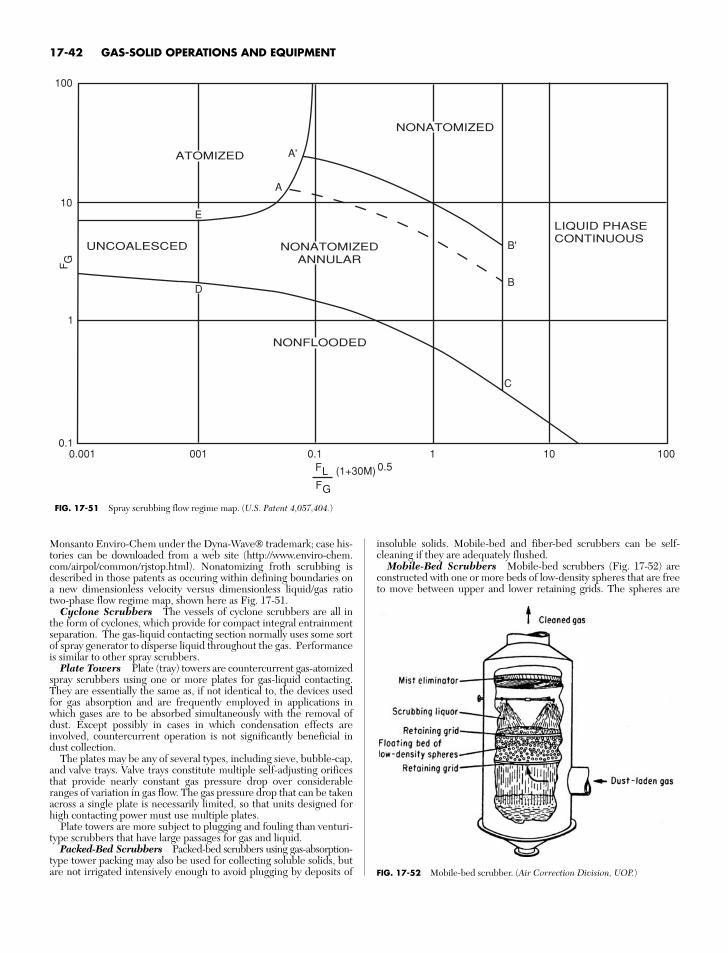
Monsanto Enviro-Chem under the Dyna-Wave® trademark; case his-tories can be downloaded from a web site (http://www.enviro-chem.com/airpol/common/rjstop.html). Nonatomizing froth scrubbing isdescribed in those patents as occuring within defining boundaries ona new dimensionless velocity versus dimensionless liquid/gas ratiotwo-phase flow regime map, shown here as Fig. 17-51.
Cyclone Scrubbers The vessels of cyclone scrubbers are all inthe form of cyclones, which provide for compact integral entrainmentseparation. The gas-liquid contacting section normally uses some sortof spray generator to disperse liquid throughout the gas. Performanceis similar to other spray scrubbers.
Plate Towers Plate (tray) towers are countercurrent gas-atomizedspray scrubbers using one or more plates for gas-liquid contacting.They are essentially the same as, if not identical to, the devices usedfor gas absorption and are frequently employed in applications inwhich gases are to be absorbed simultaneously with the removal ofdust. Except possibly in cases in which condensation effects areinvolved, countercurrent operation is not significantly beneficial indust collection.
The plates may be any of several types, including sieve, bubble-cap,and valve trays. Valve trays constitute multiple self-adjusting orificesthat provide nearly constant gas pressure drop over considerableranges of variation in gas flow. The gas pressure drop that can be takenacross a single plate is necessarily limited, so that units designed forhigh contacting power must use multiple plates.
Plate towers are more subject to plugging and fouling than venturi-type scrubbers that have large passages for gas and liquid.
Packed-Bed Scrubbers Packed-bed scrubbers using gas-absorption-type tower packing may also be used for collecting soluble solids, butare not irrigated intensively enough to avoid plugging by deposits of
insoluble solids. Mobile-bed and fiber-bed scrubbers can be self-cleaning if they are adequately flushed.
Mobile-Bed Scrubbers Mobile-bed scrubbers (Fig. 17-52) areconstructed with one or more beds of low-density spheres that are freeto move between upper and lower retaining grids. The spheres are
17-42 GAS-SOLID OPERATIONS AND EQUIPMENT
NONATOMIZED
NONATOMIZEDANNULAR
NONFLOODED
LIQUID PHASECONTINUOUS
ATOMIZED
UNCOALESCED
A'
B'
B
A
E
D
C
1001010.10010.0010.1
1
10
100
F G
FG
FL (1+30M) 0.5
FIG. 17-51 Spray scrubbing flow regime map. (U.S. Patent 4,057,404.)
FIG. 17-52 Mobile-bed scrubber. (Air Correction Division, UOP.)
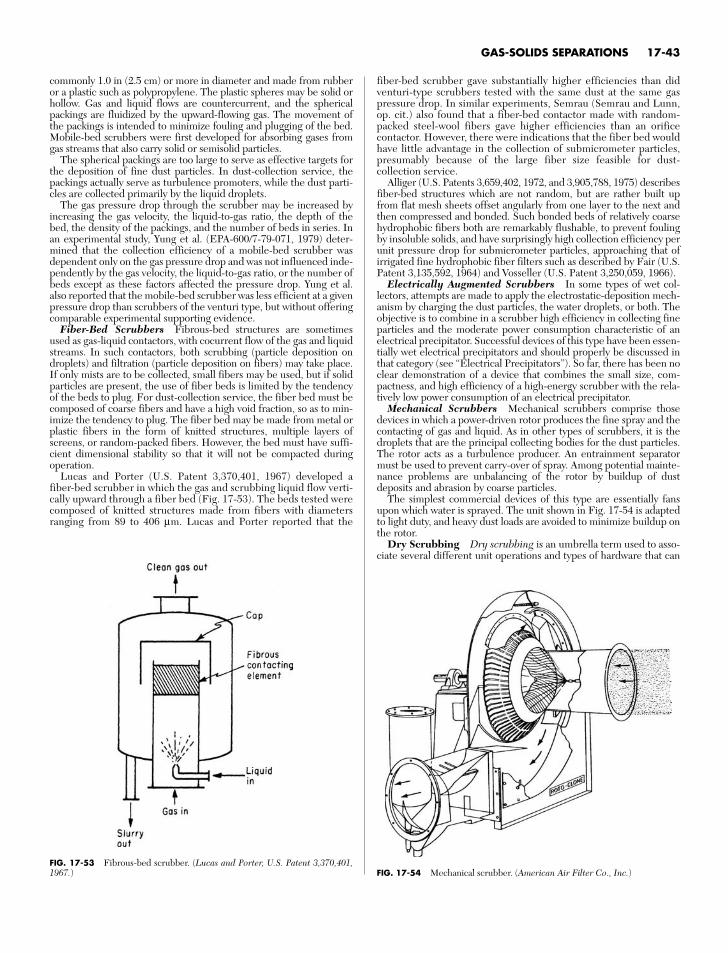
commonly 1.0 in (2.5 cm) or more in diameter and made from rubberor a plastic such as polypropylene. The plastic spheres may be solid orhollow. Gas and liquid flows are countercurrent, and the sphericalpackings are fluidized by the upward-flowing gas. The movement ofthe packings is intended to minimize fouling and plugging of the bed.Mobile-bed scrubbers were first developed for absorbing gases fromgas streams that also carry solid or semisolid particles.
The spherical packings are too large to serve as effective targets forthe deposition of fine dust particles. In dust-collection service, thepackings actually serve as turbulence promoters, while the dust parti-cles are collected primarily by the liquid droplets.
The gas pressure drop through the scrubber may be increased byincreasing the gas velocity, the liquid-to-gas ratio, the depth of thebed, the density of the packings, and the number of beds in series. Inan experimental study, Yung et al. (EPA-600/7-79-071, 1979) deter-mined that the collection efficiency of a mobile-bed scrubber wasdependent only on the gas pressure drop and was not influenced inde-pendently by the gas velocity, the liquid-to-gas ratio, or the number ofbeds except as these factors affected the pressure drop. Yung et al.also reported that the mobile-bed scrubber was less efficient at a givenpressure drop than scrubbers of the venturi type, but without offeringcomparable experimental supporting evidence.
Fiber-Bed Scrubbers Fibrous-bed structures are sometimesused as gas-liquid contactors, with cocurrent flow of the gas and liquidstreams. In such contactors, both scrubbing (particle deposition ondroplets) and filtration (particle deposition on fibers) may take place.If only mists are to be collected, small fibers may be used, but if solidparticles are present, the use of fiber beds is limited by the tendencyof the beds to plug. For dust-collection service, the fiber bed must becomposed of coarse fibers and have a high void fraction, so as to min-imize the tendency to plug. The fiber bed may be made from metal orplastic fibers in the form of knitted structures, multiple layers ofscreens, or random-packed fibers. However, the bed must have suffi-cient dimensional stability so that it will not be compacted duringoperation.
Lucas and Porter (U.S. Patent 3,370,401, 1967) developed afiber-bed scrubber in which the gas and scrubbing liquid flow verti-cally upward through a fiber bed (Fig. 17-53). The beds tested werecomposed of knitted structures made from fibers with diametersranging from 89 to 406 µm. Lucas and Porter reported that the
fiber-bed scrubber gave substantially higher efficiencies than didventuri-type scrubbers tested with the same dust at the same gaspressure drop. In similar experiments, Semrau (Semrau and Lunn,op. cit.) also found that a fiber-bed contactor made with random-packed steel-wool fibers gave higher efficiencies than an orificecontactor. However, there were indications that the fiber bed wouldhave little advantage in the collection of submicrometer particles,presumably because of the large fiber size feasible for dust-collection service.
Alliger (U.S. Patents 3,659,402, 1972, and 3,905,788, 1975) describesfiber-bed structures which are not random, but are rather built upfrom flat mesh sheets offset angularly from one layer to the next andthen compressed and bonded. Such bonded beds of relatively coarsehydrophobic fibers both are remarkably flushable, to prevent foulingby insoluble solids, and have surprisingly high collection efficiency perunit pressure drop for submicrometer particles, approaching that ofirrigated fine hydrophobic fiber filters such as described by Fair (U.S.Patent 3,135,592, 1964) and Vosseller (U.S. Patent 3,250,059, 1966).
Electrically Augmented Scrubbers In some types of wet col-lectors, attempts are made to apply the electrostatic-deposition mech-anism by charging the dust particles, the water droplets, or both. Theobjective is to combine in a scrubber high efficiency in collecting fineparticles and the moderate power consumption characteristic of anelectrical precipitator. Successful devices of this type have been essen-tially wet electrical precipitators and should properly be discussed inthat category (see “Electrical Precipitators”). So far, there has been noclear demonstration of a device that combines the small size, com-pactness, and high efficiency of a high-energy scrubber with the rela-tively low power consumption of an electrical precipitator.
Mechanical Scrubbers Mechanical scrubbers comprise thosedevices in which a power-driven rotor produces the fine spray and thecontacting of gas and liquid. As in other types of scrubbers, it is thedroplets that are the principal collecting bodies for the dust particles.The rotor acts as a turbulence producer. An entrainment separatormust be used to prevent carry-over of spray. Among potential mainte-nance problems are unbalancing of the rotor by buildup of dustdeposits and abrasion by coarse particles.
The simplest commercial devices of this type are essentially fansupon which water is sprayed. The unit shown in Fig. 17-54 is adaptedto light duty, and heavy dust loads are avoided to minimize buildup onthe rotor.
Dry Scrubbing Dry scrubbing is an umbrella term used to asso-ciate several different unit operations and types of hardware that can
GAS-SOLIDS SEPARATIONS 17-43
FIG. 17-53 Fibrous-bed scrubber. (Lucas and Porter, U.S. Patent 3,370,401,1967.) FIG. 17-54 Mechanical scrubber. (American Air Filter Co., Inc.)
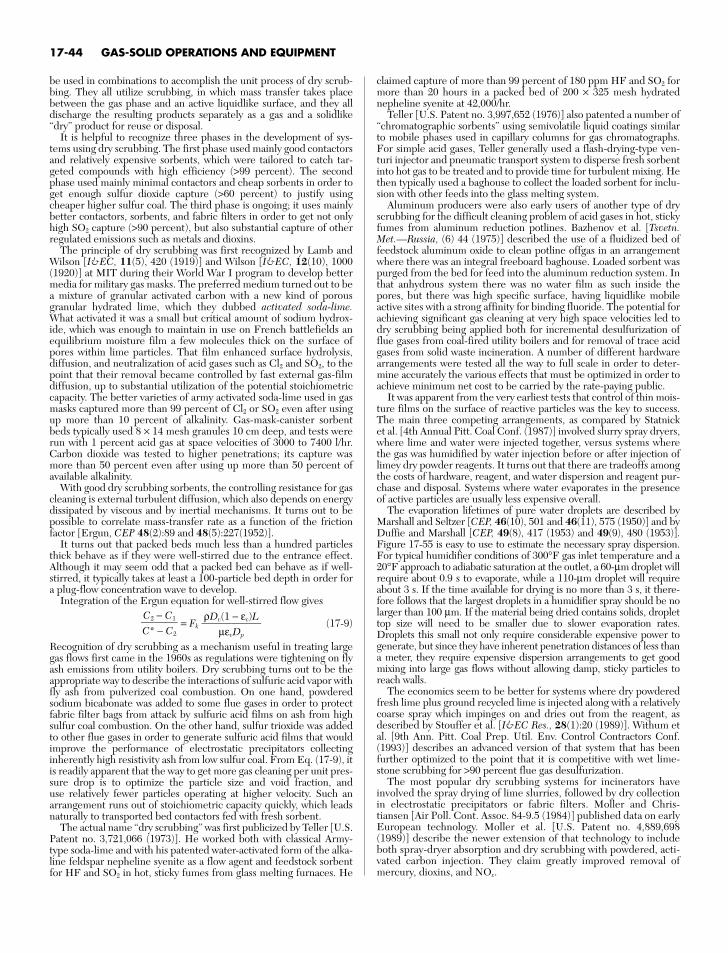
be used in combinations to accomplish the unit process of dry scrub-bing. They all utilize scrubbing, in which mass transfer takes placebetween the gas phase and an active liquidlike surface, and they alldischarge the resulting products separately as a gas and a solidlike“dry” product for reuse or disposal.
It is helpful to recognize three phases in the development of sys-tems using dry scrubbing. The first phase used mainly good contactorsand relatively expensive sorbents, which were tailored to catch tar-geted compounds with high efficiency (>99 percent). The secondphase used mainly minimal contactors and cheap sorbents in order toget enough sulfur dioxide capture (>60 percent) to justify usingcheaper higher sulfur coal. The third phase is ongoing; it uses mainlybetter contactors, sorbents, and fabric filters in order to get not onlyhigh SO2 capture (>90 percent), but also substantial capture of otherregulated emissions such as metals and dioxins.
The principle of dry scrubbing was first recognized by Lamb andWilson [I&EC, 11(5), 420 (1919)] and Wilson [I&EC, 12(10), 1000(1920)] at MIT during their World War I program to develop bettermedia for military gas masks. The preferred medium turned out to bea mixture of granular activated carbon with a new kind of porousgranular hydrated lime, which they dubbed activated soda-lime.What activated it was a small but critical amount of sodium hydrox-ide, which was enough to maintain in use on French battlefields anequilibrium moisture film a few molecules thick on the surface ofpores within lime particles. That film enhanced surface hydrolysis,diffusion, and neutralization of acid gases such as Cl2 and SO2, to thepoint that their removal became controlled by fast external gas-filmdiffusion, up to substantial utilization of the potential stoichiometriccapacity. The better varieties of army activated soda-lime used in gasmasks captured more than 99 percent of Cl2 or SO2 even after usingup more than 10 percent of alkalinity. Gas-mask-canister sorbentbeds typically used 8 × 14 mesh granules 10 cm deep, and tests wererun with 1 percent acid gas at space velocities of 3000 to 7400 l/hr.Carbon dioxide was tested to higher penetrations; its capture wasmore than 50 percent even after using up more than 50 percent ofavailable alkalinity.
With good dry scrubbing sorbents, the controlling resistance for gascleaning is external turbulent diffusion, which also depends on energydissipated by viscous and by inertial mechanisms. It turns out to bepossible to correlate mass-transfer rate as a function of the frictionfactor [Ergun, CEP 48(2):89 and 48(5):227(1952)].
It turns out that packed beds much less than a hundred particlesthick behave as if they were well-stirred due to the entrance effect.Although it may seem odd that a packed bed can behave as if well-stirred, it typically takes at least a 100-particle bed depth in order fora plug-flow concentration wave to develop.
Integration of the Ergun equation for well-stirred flow gives
= Fk (17-9)
Recognition of dry scrubbing as a mechanism useful in treating largegas flows first came in the 1960s as regulations were tightening on flyash emissions from utility boilers. Dry scrubbing turns out to be theappropriate way to describe the interactions of sulfuric acid vapor withfly ash from pulverized coal combustion. On one hand, powderedsodium bicabonate was added to some flue gases in order to protectfabric filter bags from attack by sulfuric acid films on ash from highsulfur coal combustion. On the other hand, sulfur trioxide was addedto other flue gases in order to generate sulfuric acid films that wouldimprove the performance of electrostatic precipitators collectinginherently high resistivity ash from low sulfur coal. From Eq. (17-9), itis readily apparent that the way to get more gas cleaning per unit pres-sure drop is to optimize the particle size and void fraction, and use relatively fewer particles operating at higher velocity. Such anarrangement runs out of stoichiometric capacity quickly, which leadsnaturally to transported bed contactors fed with fresh sorbent.
The actual name “dry scrubbing” was first publicized by Teller [U.S.Patent no. 3,721,066 (1973)]. He worked both with classical Army-type soda-lime and with his patented water-activated form of the alka-line feldspar nepheline syenite as a flow agent and feedstock sorbentfor HF and SO2 in hot, sticky fumes from glass melting furnaces. He
ρDv(1 − εv)L
µεvDp
C2 − C1C* − C2
claimed capture of more than 99 percent of 180 ppm HF and SO2 formore than 20 hours in a packed bed of 200 × 325 mesh hydratednepheline syenite at 42,000/hr.
Teller [U.S. Patent no. 3,997,652 (1976)] also patented a number of“chromatographic sorbents” using semivolatile liquid coatings similarto mobile phases used in capillary columns for gas chromatographs.For simple acid gases, Teller generally used a flash-drying-type ven-turi injector and pneumatic transport system to disperse fresh sorbentinto hot gas to be treated and to provide time for turbulent mixing. Hethen typically used a baghouse to collect the loaded sorbent for inclu-sion with other feeds into the glass melting system.
Aluminum producers were also early users of another type of dryscrubbing for the difficult cleaning problem of acid gases in hot, stickyfumes from aluminum reduction potlines. Bazhenov et al. [Tsvetn.Met.—Russia, (6) 44 (1975)] described the use of a fluidized bed offeedstock aluminum oxide to clean potline offgas in an arrangementwhere there was an integral freeboard baghouse. Loaded sorbent waspurged from the bed for feed into the aluminum reduction system. Inthat anhydrous system there was no water film as such inside thepores, but there was high specific surface, having liquidlike mobileactive sites with a strong affinity for binding fluoride. The potential forachieving significant gas cleaning at very high space velocities led todry scrubbing being applied both for incremental desulfurization offlue gases from coal-fired utility boilers and for removal of trace acidgases from solid waste incineration. A number of different hardwarearrangements were tested all the way to full scale in order to deter-mine accurately the various effects that must be optimized in order toachieve minimum net cost to be carried by the rate-paying public.
It was apparent from the very earliest tests that control of thin mois-ture films on the surface of reactive particles was the key to success.The main three competing arrangements, as compared by Statnicket al. [4th Annual Pitt. Coal Conf. (1987)] involved slurry spray dryers,where lime and water were injected together, versus systems wherethe gas was humidified by water injection before or after injection oflimey dry powder reagents. It turns out that there are tradeoffs amongthe costs of hardware, reagent, and water dispersion and reagent pur-chase and disposal. Systems where water evaporates in the presenceof active particles are usually less expensive overall.
The evaporation lifetimes of pure water droplets are described byMarshall and Seltzer [CEP, 46(10), 501 and 46(11), 575 (1950)] and byDuffie and Marshall [CEP, 49(8), 417 (1953) and 49(9), 480 (1953)].Figure 17-55 is easy to use to estimate the necessary spray dispersion.For typical humidifier conditions of 300°F gas inlet temperature and a20°F approach to adiabatic saturation at the outlet, a 60-µm droplet willrequire about 0.9 s to evaporate, while a 110-µm droplet will requireabout 3 s. If the time available for drying is no more than 3 s, it there-fore follows that the largest droplets in a humidifier spray should be nolarger than 100 µm. If the material being dried contains solids, droplettop size will need to be smaller due to slower evaporation rates.Droplets this small not only require considerable expensive power togenerate, but since they have inherent penetration distances of less thana meter, they require expensive dispersion arrangements to get goodmixing into large gas flows without allowing damp, sticky particles toreach walls.
The economics seem to be better for systems where dry powderedfresh lime plus ground recycled lime is injected along with a relativelycoarse spray which impinges on and dries out from the reagent, asdescribed by Stouffer et al. [I&EC Res., 28(1):20 (1989)]. Withum etal. [9th Ann. Pitt. Coal Prep. Util. Env. Control Contractors Conf.(1993)] describes an advanced version of that system that has beenfurther optimized to the point that it is competitive with wet lime-stone scrubbing for >90 percent flue gas desulfurization.
The most popular dry scrubbing systems for incinerators haveinvolved the spray drying of lime slurries, followed by dry collectionin electrostatic precipitators or fabric filters. Moller and Chris-tiansen [Air Poll. Cont. Assoc. 84-9.5 (1984)] published data on earlyEuropean technology. Moller et al. [U.S. Patent no. 4,889,698(1989)] describe the newer extension of that technology to includeboth spray-dryer absorption and dry scrubbing with powdered, acti-vated carbon injection. They claim greatly improved removal ofmercury, dioxins, and NOx.
17-44 GAS-SOLID OPERATIONS AND EQUIPMENT
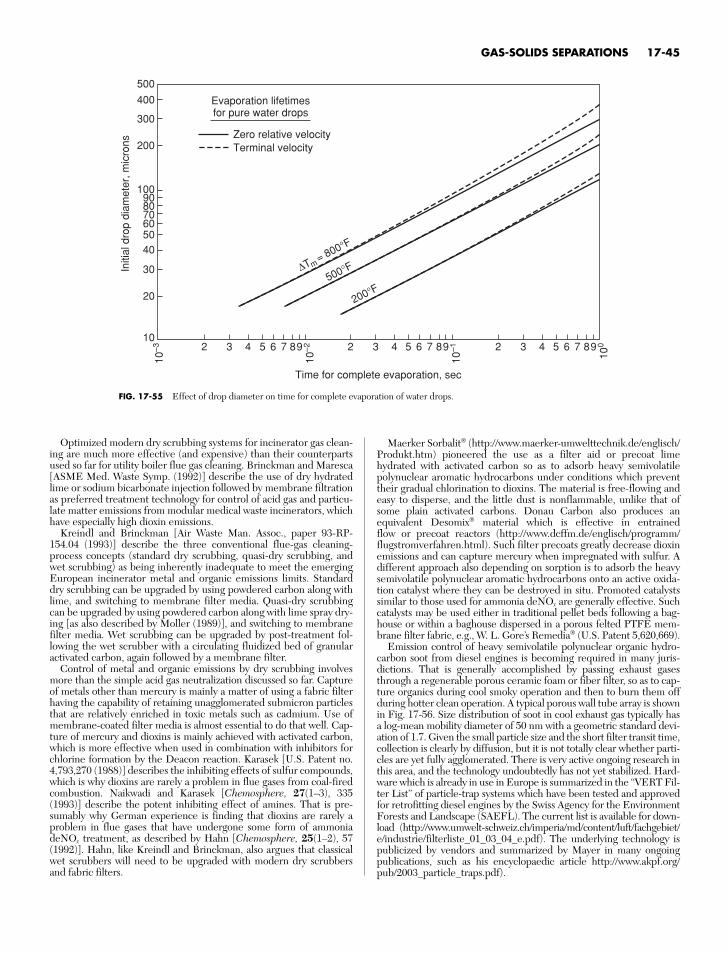
Optimized modern dry scrubbing systems for incinerator gas clean-ing are much more effective (and expensive) than their counterpartsused so far for utility boiler flue gas cleaning. Brinckman and Maresca[ASME Med. Waste Symp. (1992)] describe the use of dry hydratedlime or sodium bicarbonate injection followed by membrane filtrationas preferred treatment technology for control of acid gas and particu-late matter emissions from modular medical waste incinerators, whichhave especially high dioxin emissions.
Kreindl and Brinckman [Air Waste Man. Assoc., paper 93-RP-154.04 (1993)] describe the three conventional flue-gas cleaning-process concepts (standard dry scrubbing, quasi-dry scrubbing, andwet scrubbing) as being inherently inadequate to meet the emergingEuropean incinerator metal and organic emissions limits. Standarddry scrubbing can be upgraded by using powdered carbon along withlime, and switching to membrane filter media. Quasi-dry scrubbingcan be upgraded by using powdered carbon along with lime spray dry-ing [as also described by Moller (1989)], and switching to membranefilter media. Wet scrubbing can be upgraded by post-treatment fol-lowing the wet scrubber with a circulating fluidized bed of granularactivated carbon, again followed by a membrane filter.
Control of metal and organic emissions by dry scrubbing involvesmore than the simple acid gas neutralization discussed so far. Captureof metals other than mercury is mainly a matter of using a fabric filterhaving the capability of retaining unagglomerated submicron particlesthat are relatively enriched in toxic metals such as cadmium. Use ofmembrane-coated filter media is almost essential to do that well. Cap-ture of mercury and dioxins is mainly achieved with activated carbon,which is more effective when used in combination with inhibitors forchlorine formation by the Deacon reaction. Karasek [U.S. Patent no.4,793,270 (1988)] describes the inhibiting effects of sulfur compounds,which is why dioxins are rarely a problem in flue gases from coal-firedcombustion. Naikwadi and Karasek [Chemosphere, 27(1–3), 335(1993)] describe the potent inhibiting effect of amines. That is pre-sumably why German experience is finding that dioxins are rarely aproblem in flue gases that have undergone some form of ammoniadeNOx treatment, as described by Hahn [Chemosphere, 25(1–2), 57(1992)]. Hahn, like Kreindl and Brinckman, also argues that classicalwet scrubbers will need to be upgraded with modern dry scrubbersand fabric filters.
Maerker Sorbalit® (http://www.maerker-umwelttechnik.de/englisch/Produkt.htm) pioneered the use as a filter aid or precoat limehydrated with activated carbon so as to adsorb heavy semivolatilepolynuclear aromatic hydrocarbons under conditions which preventtheir gradual chlorination to dioxins. The material is free-flowing andeasy to disperse, and the little dust is nonflammable, unlike that ofsome plain activated carbons. Donau Carbon also produces anequivalent Desomix® material which is effective in entrainedflow or precoat reactors (http://www.dcffm.de/englisch/programm/flugstromverfahren.html). Such filter precoats greatly decrease dioxinemissions and can capture mercury when impregnated with sulfur. Adifferent approach also depending on sorption is to adsorb the heavysemivolatile polynuclear aromatic hydrocarbons onto an active oxida-tion catalyst where they can be destroyed in situ. Promoted catalystssimilar to those used for ammonia deNOx are generally effective. Suchcatalysts may be used either in traditional pellet beds following a bag-house or within a baghouse dispersed in a porous felted PTFE mem-brane filter fabric, e.g., W. L. Gore’s Remedia® (U.S. Patent 5,620,669).
Emission control of heavy semivolatile polynuclear organic hydro-carbon soot from diesel engines is becoming required in many juris-dictions. That is generally accomplished by passing exhaust gasesthrough a regenerable porous ceramic foam or fiber filter, so as to cap-ture organics during cool smoky operation and then to burn them offduring hotter clean operation. A typical porous wall tube array is shownin Fig. 17-56. Size distribution of soot in cool exhaust gas typically hasa log-mean mobility diameter of 50 nm with a geometric standard devi-ation of 1.7. Given the small particle size and the short filter transit time,collection is clearly by diffusion, but it is not totally clear whether parti-cles are yet fully agglomerated. There is very active ongoing research inthis area, and the technology undoubtedly has not yet stabilized. Hard-ware which is already in use in Europe is summarized in the “VERT Fil-ter List” of particle-trap systems which have been tested and approvedfor retrofitting diesel engines by the Swiss Agency for the EnvironmentForests and Landscape (SAEFL). The current list is available for down-load (http://www.umwelt-schweiz.ch/imperia/md/content/luft/fachgebiet/e/industrie/filterliste_01_03_04_e.pdf). The underlying technology ispublicized by vendors and summarized by Mayer in many ongoingpublications, such as his encyclopaedic article http://www.akpf.org/pub/2003_particle_traps.pdf).
GAS-SOLIDS SEPARATIONS 17-45
5 6 7 5 6 78
Time for complete evaporation, sec
Initi
al d
rop
diam
eter
, mic
rons
3 4 9
10–2
10–3 2 83 4 9
10–12
∆T = 800°F
500°F
200°F
5 6 7 83 4 9
1002
10
20
30
4050607080
500
400
300
200
Evaporation lifetimesfor pure water drops
Zero relative velocityTerminal velocity
10090
m
FIG. 17-55 Effect of drop diameter on time for complete evaporation of water drops.
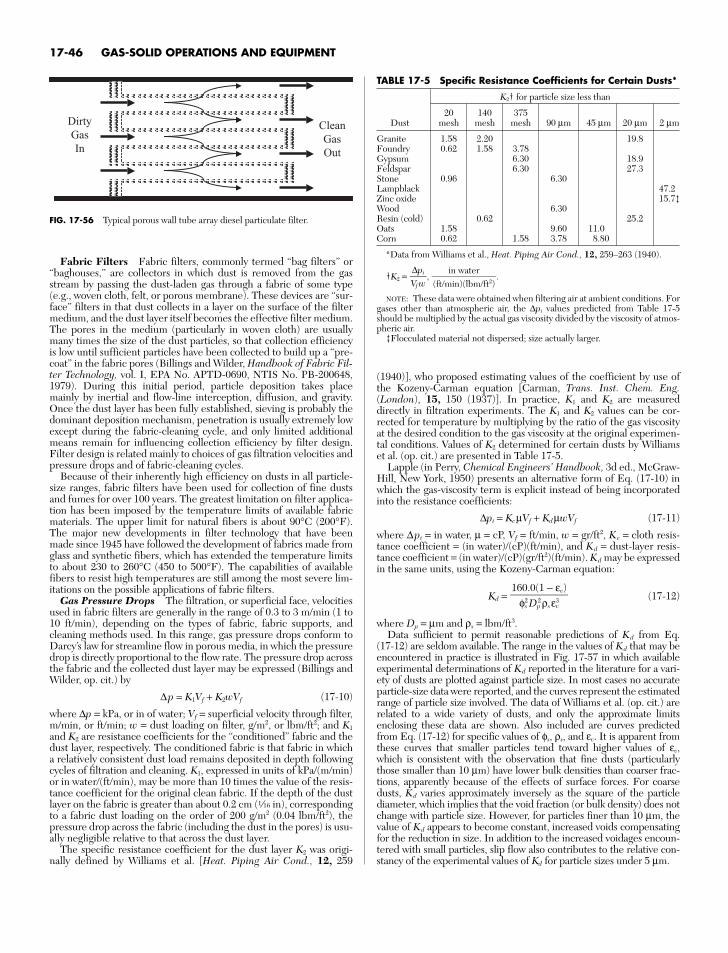
Fabric Filters Fabric filters, commonly termed “bag filters” or“baghouses,” are collectors in which dust is removed from the gasstream by passing the dust-laden gas through a fabric of some type(e.g., woven cloth, felt, or porous membrane). These devices are “sur-face” filters in that dust collects in a layer on the surface of the filtermedium, and the dust layer itself becomes the effective filter medium.The pores in the medium (particularly in woven cloth) are usuallymany times the size of the dust particles, so that collection efficiencyis low until sufficient particles have been collected to build up a “pre-coat” in the fabric pores (Billings and Wilder, Handbook of Fabric Fil-ter Technology, vol. I, EPA No. APTD-0690, NTIS No. PB-200648,1979). During this initial period, particle deposition takes placemainly by inertial and flow-line interception, diffusion, and gravity.Once the dust layer has been fully established, sieving is probably thedominant deposition mechanism, penetration is usually extremely lowexcept during the fabric-cleaning cycle, and only limited additionalmeans remain for influencing collection efficiency by filter design.Filter design is related mainly to choices of gas filtration velocities andpressure drops and of fabric-cleaning cycles.
Because of their inherently high efficiency on dusts in all particle-size ranges, fabric filters have been used for collection of fine dustsand fumes for over 100 years. The greatest limitation on filter applica-tion has been imposed by the temperature limits of available fabricmaterials. The upper limit for natural fibers is about 90°C (200°F).The major new developments in filter technology that have beenmade since 1945 have followed the development of fabrics made fromglass and synthetic fibers, which has extended the temperature limitsto about 230 to 260°C (450 to 500°F). The capabilities of availablefibers to resist high temperatures are still among the most severe lim-itations on the possible applications of fabric filters.
Gas Pressure Drops The filtration, or superficial face, velocitiesused in fabric filters are generally in the range of 0.3 to 3 m/min (1 to10 ft/min), depending on the types of fabric, fabric supports, andcleaning methods used. In this range, gas pressure drops conform toDarcy’s law for streamline flow in porous media, in which the pressuredrop is directly proportional to the flow rate. The pressure drop acrossthe fabric and the collected dust layer may be expressed (Billings andWilder, op. cit.) by
∆p = K1Vf + K2wVf (17-10)
where ∆p = kPa, or in of water; Vf = superficial velocity through filter,m/min, or ft/min; w = dust loading on filter, g/m2, or lbm/ft2; and K1
and K2 are resistance coefficients for the “conditioned” fabric and thedust layer, respectively. The conditioned fabric is that fabric in whicha relatively consistent dust load remains deposited in depth followingcycles of filtration and cleaning. K1, expressed in units of kPa/(m/min)or in water/(ft/min), may be more than 10 times the value of the resis-tance coefficient for the original clean fabric. If the depth of the dustlayer on the fabric is greater than about 0.2 cm (g in), correspondingto a fabric dust loading on the order of 200 g/m2 (0.04 lbm/ft2), thepressure drop across the fabric (including the dust in the pores) is usu-ally negligible relative to that across the dust layer.
The specific resistance coefficient for the dust layer K2 was origi-nally defined by Williams et al. [Heat. Piping Air Cond., 12, 259
17-46 GAS-SOLID OPERATIONS AND EQUIPMENT
(1940)], who proposed estimating values of the coefficient by use ofthe Kozeny-Carman equation [Carman, Trans. Inst. Chem. Eng.(London), 15, 150 (1937)]. In practice, K1 and K2 are measureddirectly in filtration experiments. The K1 and K2 values can be cor-rected for temperature by multiplying by the ratio of the gas viscosityat the desired condition to the gas viscosity at the original experimen-tal conditions. Values of K2 determined for certain dusts by Williamset al. (op. cit.) are presented in Table 17-5.
Lapple (in Perry, Chemical Engineers’ Handbook, 3d ed., McGraw-Hill, New York, 1950) presents an alternative form of Eq. (17-10) inwhich the gas-viscosity term is explicit instead of being incorporatedinto the resistance coefficients:
∆pi = KcµVf + KdµwVf (17-11)
where ∆pi = in water, µ = cP, Vf = ft/min, w = gr/ft2, Kc = cloth resis-tance coefficient = (in water)/(cP)(ft/min), and K d = dust-layer resis-tance coefficient = (in water)/(cP)(gr/ft2)(ft/min). Kd may be expressedin the same units, using the Kozeny-Carman equation:
Kd = (17-12)
where Dp = µm and ρs = lbm/ft3.Data sufficient to permit reasonable predictions of Kd from Eq.
(17-12) are seldom available. The range in the values of Kd that may beencountered in practice is illustrated in Fig. 17-57 in which availableexperimental determinations of Kd reported in the literature for a vari-ety of dusts are plotted against particle size. In most cases no accurateparticle-size data were reported, and the curves represent the estimatedrange of particle size involved. The data of Williams et al. (op. cit.) arerelated to a wide variety of dusts, and only the approximate limitsenclosing these data are shown. Also included are curves predictedfrom Eq. (17-12) for specific values of φs, ρs, and εv. It is apparent fromthese curves that smaller particles tend toward higher values of εv,which is consistent with the observation that fine dusts (particularlythose smaller than 10 µm) have lower bulk densities than coarser frac-tions, apparently because of the effects of surface forces. For coarsedusts, Kd varies approximately inversely as the square of the particlediameter, which implies that the void fraction (or bulk density) does notchange with particle size. However, for particles finer than 10 µm, thevalue of Kd appears to become constant, increased voids compensatingfor the reduction in size. In addition to the increased voidages encoun-tered with small particles, slip flow also contributes to the relative con-stancy of the experimental values of Kd for particle sizes under 5 µm.
160.0(1 − εv)φs
2 Dp2ρsεv
3
Dirty
Gas
In
Clean
Gas
Out
FIG. 17-56 Typical porous wall tube array diesel particulate filter.
TABLE 17-5 Specific Resistance Coefficients for Certain Dusts*
K2† for particle size less than
20 140 375Dust mesh mesh mesh 90 µm 45 µm 20 µm 2 µm
Granite 1.58 2.20 19.8Foundry 0.62 1.58 3.78Gypsum 6.30 18.9Feldspar 6.30 27.3Stone 0.96 6.30Lampblack 47.2Zinc oxide 15.7‡Wood 6.30Resin (cold) 0.62 25.2Oats 1.58 9.60 11.0Corn 0.62 1.58 3.78 8.80
*Data from Williams et al., Heat. Piping Air Cond., 12, 259–263 (1940).
†K2 = , .
NOTE: These data were obtained when filtering air at ambient conditions. Forgases other than atmospheric air, the ∆pi values predicted from Table 17-5should be multiplied by the actual gas viscosity divided by the viscosity of atmos-pheric air.
‡Flocculated material not dispersed; size actually larger.
in water(ft/min)(lbm/ft2)
∆piVf w
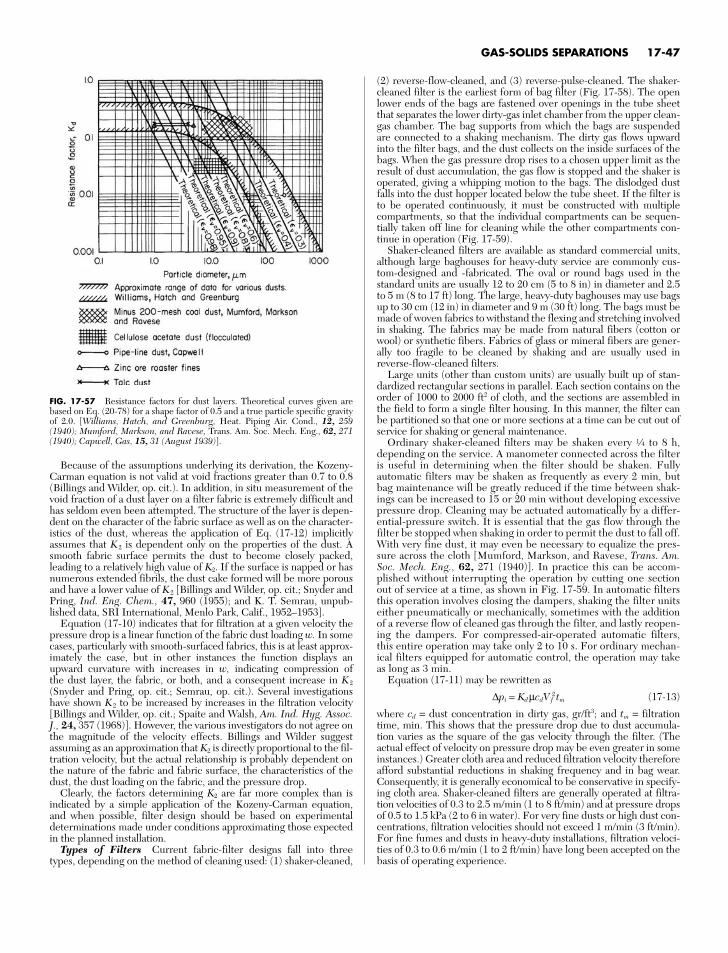
Because of the assumptions underlying its derivation, the Kozeny-Carman equation is not valid at void fractions greater than 0.7 to 0.8(Billings and Wilder, op. cit.). In addition, in situ measurement of thevoid fraction of a dust layer on a filter fabric is extremely difficult andhas seldom even been attempted. The structure of the layer is depen-dent on the character of the fabric surface as well as on the character-istics of the dust, whereas the application of Eq. (17-12) implicitlyassumes that K 2 is dependent only on the properties of the dust. Asmooth fabric surface permits the dust to become closely packed,leading to a relatively high value of K2. If the surface is napped or hasnumerous extended fibrils, the dust cake formed will be more porousand have a lower value of K 2 [Billings and Wilder, op. cit.; Snyder andPring, Ind. Eng. Chem., 47, 960 (1955); and K. T. Semrau, unpub-lished data, SRI International, Menlo Park, Calif., 1952–1953].
Equation (17-10) indicates that for filtration at a given velocity thepressure drop is a linear function of the fabric dust loading w. In somecases, particularly with smooth-surfaced fabrics, this is at least approx-imately the case, but in other instances the function displays anupward curvature with increases in w, indicating compression of the dust layer, the fabric, or both, and a consequent increase in K 2
(Snyder and Pring, op. cit.; Semrau, op. cit.). Several investigationshave shown K 2 to be increased by increases in the filtration velocity[Billings and Wilder, op. cit.; Spaite and Walsh, Am. Ind. Hyg. Assoc.J., 24, 357 (1968)]. However, the various investigators do not agree onthe magnitude of the velocity effects. Billings and Wilder suggestassuming as an approximation that K2 is directly proportional to the fil-tration velocity, but the actual relationship is probably dependent onthe nature of the fabric and fabric surface, the characteristics of thedust, the dust loading on the fabric, and the pressure drop.
Clearly, the factors determining K2 are far more complex than isindicated by a simple application of the Kozeny-Carman equation,and when possible, filter design should be based on experimentaldeterminations made under conditions approximating those expectedin the planned installation.
Types of Filters Current fabric-filter designs fall into threetypes, depending on the method of cleaning used: (1) shaker-cleaned,
(2) reverse-flow-cleaned, and (3) reverse-pulse-cleaned. The shaker-cleaned filter is the earliest form of bag filter (Fig. 17-58). The openlower ends of the bags are fastened over openings in the tube sheetthat separates the lower dirty-gas inlet chamber from the upper clean-gas chamber. The bag supports from which the bags are suspendedare connected to a shaking mechanism. The dirty gas flows upwardinto the filter bags, and the dust collects on the inside surfaces of thebags. When the gas pressure drop rises to a chosen upper limit as theresult of dust accumulation, the gas flow is stopped and the shaker isoperated, giving a whipping motion to the bags. The dislodged dustfalls into the dust hopper located below the tube sheet. If the filter isto be operated continuously, it must be constructed with multiplecompartments, so that the individual compartments can be sequen-tially taken off line for cleaning while the other compartments con-tinue in operation (Fig. 17-59).
Shaker-cleaned filters are available as standard commercial units,although large baghouses for heavy-duty service are commonly cus-tom-designed and -fabricated. The oval or round bags used in thestandard units are usually 12 to 20 cm (5 to 8 in) in diameter and 2.5to 5 m (8 to 17 ft) long. The large, heavy-duty baghouses may use bagsup to 30 cm (12 in) in diameter and 9 m (30 ft) long. The bags must bemade of woven fabrics to withstand the flexing and stretching involvedin shaking. The fabrics may be made from natural fibers (cotton orwool) or synthetic fibers. Fabrics of glass or mineral fibers are gener-ally too fragile to be cleaned by shaking and are usually used inreverse-flow-cleaned filters.
Large units (other than custom units) are usually built up of stan-dardized rectangular sections in parallel. Each section contains on theorder of 1000 to 2000 ft2 of cloth, and the sections are assembled inthe field to form a single filter housing. In this manner, the filter canbe partitioned so that one or more sections at a time can be cut out ofservice for shaking or general maintenance.
Ordinary shaker-cleaned filters may be shaken every d to 8 h,depending on the service. A manometer connected across the filteris useful in determining when the filter should be shaken. Fullyautomatic filters may be shaken as frequently as every 2 min, butbag maintenance will be greatly reduced if the time between shak-ings can be increased to 15 or 20 min without developing excessivepressure drop. Cleaning may be actuated automatically by a differ-ential-pressure switch. It is essential that the gas flow through thefilter be stopped when shaking in order to permit the dust to fall off.With very fine dust, it may even be necessary to equalize the pres-sure across the cloth [Mumford, Markson, and Ravese, Trans. Am.Soc. Mech. Eng., 62, 271 (1940)]. In practice this can be accom-plished without interrupting the operation by cutting one sectionout of service at a time, as shown in Fig. 17-59. In automatic filtersthis operation involves closing the dampers, shaking the filter unitseither pneumatically or mechanically, sometimes with the additionof a reverse flow of cleaned gas through the filter, and lastly reopen-ing the dampers. For compressed-air-operated automatic filters,this entire operation may take only 2 to 10 s. For ordinary mechan-ical filters equipped for automatic control, the operation may takeas long as 3 min.
Equation (17-11) may be rewritten as
∆pi = KdµcdVf2 tm (17-13)
where cd = dust concentration in dirty gas, gr/ft3; and tm = filtrationtime, min. This shows that the pressure drop due to dust accumula-tion varies as the square of the gas velocity through the filter. (Theactual effect of velocity on pressure drop may be even greater in someinstances.) Greater cloth area and reduced filtration velocity thereforeafford substantial reductions in shaking frequency and in bag wear.Consequently, it is generally economical to be conservative in specify-ing cloth area. Shaker-cleaned filters are generally operated at filtra-tion velocities of 0.3 to 2.5 m/min (1 to 8 ft/min) and at pressure dropsof 0.5 to 1.5 kPa (2 to 6 in water). For very fine dusts or high dust con-centrations, filtration velocities should not exceed 1 m/min (3 ft/min).For fine fumes and dusts in heavy-duty installations, filtration veloci-ties of 0.3 to 0.6 m/min (1 to 2 ft/min) have long been accepted on thebasis of operating experience.
GAS-SOLIDS SEPARATIONS 17-47
FIG. 17-57 Resistance factors for dust layers. Theoretical curves given arebased on Eq. (20-78) for a shape factor of 0.5 and a true particle specific gravityof 2.0. [Williams, Hatch, and Greenburg, Heat. Piping Air. Cond., 12, 259(1940); Mumford, Markson, and Ravese, Trans. Am. Soc. Mech. Eng., 62, 271(1940); Capwell, Gas, 15, 31 (August 1939)].
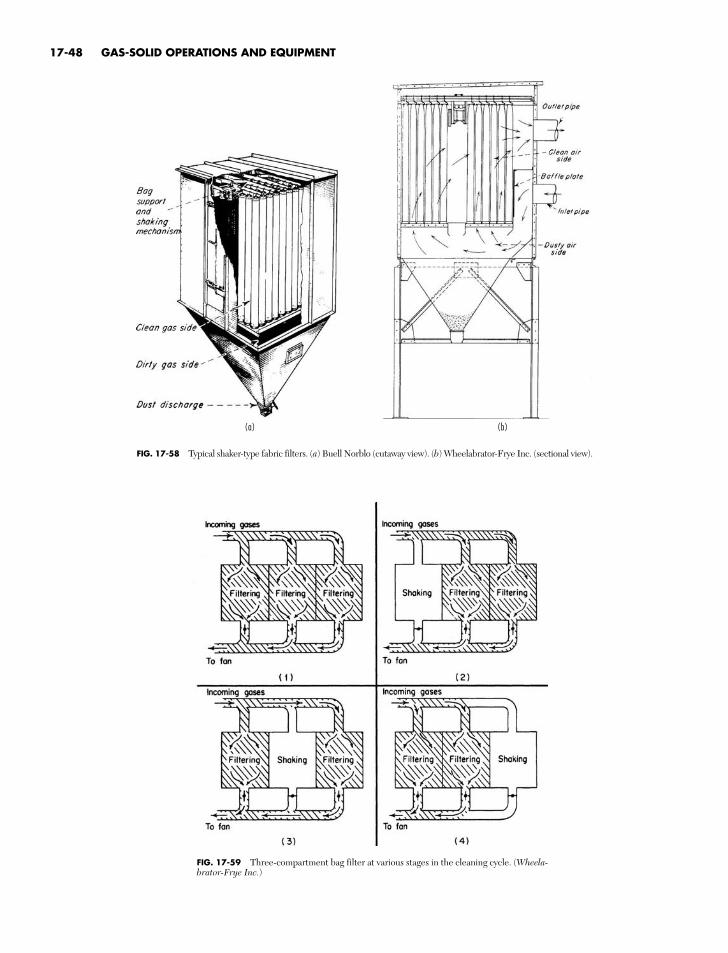
17-48 GAS-SOLID OPERATIONS AND EQUIPMENT
FIG. 17-58 Typical shaker-type fabric filters. (a) Buell Norblo (cutaway view). (b) Wheelabrator-Frye Inc. (sectional view).
FIG. 17-59 Three-compartment bag filter at various stages in the cleaning cycle. (Wheela-brator-Frye Inc.)
(a) (b)
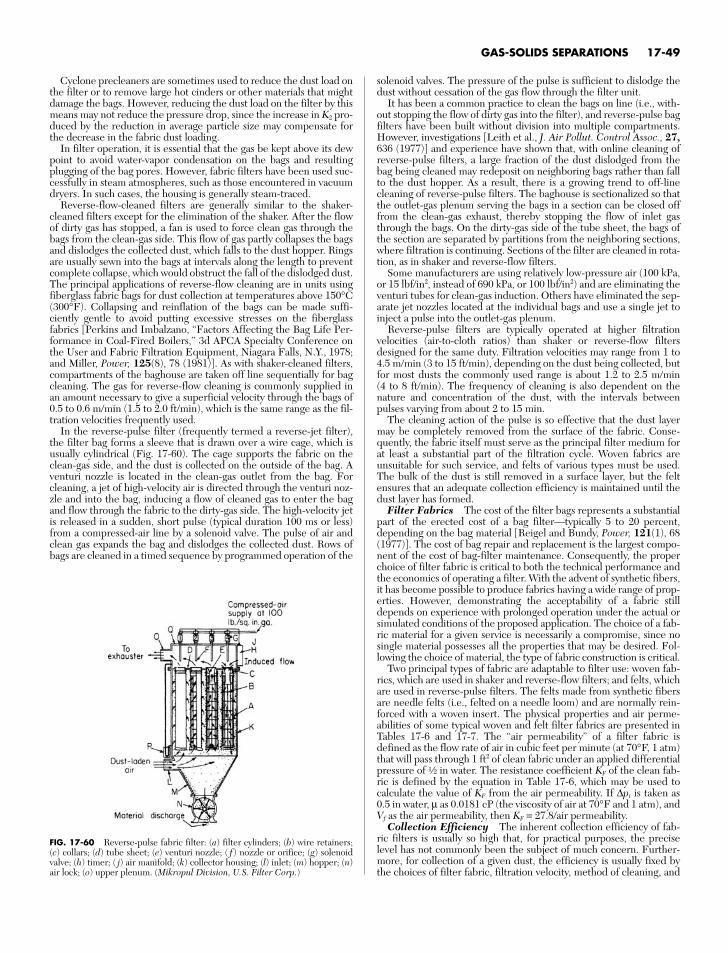
Cyclone precleaners are sometimes used to reduce the dust load onthe filter or to remove large hot cinders or other materials that mightdamage the bags. However, reducing the dust load on the filter by thismeans may not reduce the pressure drop, since the increase in K2 pro-duced by the reduction in average particle size may compensate forthe decrease in the fabric dust loading.
In filter operation, it is essential that the gas be kept above its dewpoint to avoid water-vapor condensation on the bags and resultingplugging of the bag pores. However, fabric filters have been used suc-cessfully in steam atmospheres, such as those encountered in vacuumdryers. In such cases, the housing is generally steam-traced.
Reverse-flow-cleaned filters are generally similar to the shaker-cleaned filters except for the elimination of the shaker. After the flowof dirty gas has stopped, a fan is used to force clean gas through thebags from the clean-gas side. This flow of gas partly collapses the bagsand dislodges the collected dust, which falls to the dust hopper. Ringsare usually sewn into the bags at intervals along the length to preventcomplete collapse, which would obstruct the fall of the dislodged dust.The principal applications of reverse-flow cleaning are in units usingfiberglass fabric bags for dust collection at temperatures above 150°C(300°F). Collapsing and reinflation of the bags can be made suffi-ciently gentle to avoid putting excessive stresses on the fiberglass fabrics [Perkins and Imbalzano, “Factors Affecting the Bag Life Per-formance in Coal-Fired Boilers,” 3d APCA Specialty Conference onthe User and Fabric Filtration Equipment, Niagara Falls, N.Y., 1978;and Miller, Power, 125(8), 78 (1981)]. As with shaker-cleaned filters,compartments of the baghouse are taken off line sequentially for bagcleaning. The gas for reverse-flow cleaning is commonly supplied inan amount necessary to give a superficial velocity through the bags of0.5 to 0.6 m/min (1.5 to 2.0 ft/min), which is the same range as the fil-tration velocities frequently used.
In the reverse-pulse filter (frequently termed a reverse-jet filter),the filter bag forms a sleeve that is drawn over a wire cage, which isusually cylindrical (Fig. 17-60). The cage supports the fabric on theclean-gas side, and the dust is collected on the outside of the bag. Aventuri nozzle is located in the clean-gas outlet from the bag. Forcleaning, a jet of high-velocity air is directed through the venturi noz-zle and into the bag, inducing a flow of cleaned gas to enter the bagand flow through the fabric to the dirty-gas side. The high-velocity jetis released in a sudden, short pulse (typical duration 100 ms or less)from a compressed-air line by a solenoid valve. The pulse of air andclean gas expands the bag and dislodges the collected dust. Rows ofbags are cleaned in a timed sequence by programmed operation of the
solenoid valves. The pressure of the pulse is sufficient to dislodge thedust without cessation of the gas flow through the filter unit.
It has been a common practice to clean the bags on line (i.e., with-out stopping the flow of dirty gas into the filter), and reverse-pulse bagfilters have been built without division into multiple compartments.However, investigations [Leith et al., J. Air Pollut. Control Assoc., 27,636 (1977)] and experience have shown that, with online cleaning ofreverse-pulse filters, a large fraction of the dust dislodged from thebag being cleaned may redeposit on neighboring bags rather than fallto the dust hopper. As a result, there is a growing trend to off-linecleaning of reverse-pulse filters. The baghouse is sectionalized so thatthe outlet-gas plenum serving the bags in a section can be closed offfrom the clean-gas exhaust, thereby stopping the flow of inlet gasthrough the bags. On the dirty-gas side of the tube sheet, the bags ofthe section are separated by partitions from the neighboring sections,where filtration is continuing. Sections of the filter are cleaned in rota-tion, as in shaker and reverse-flow filters.
Some manufacturers are using relatively low-pressure air (100 kPa,or 15 lbf/in2, instead of 690 kPa, or 100 lbf/in2) and are eliminating theventuri tubes for clean-gas induction. Others have eliminated the sep-arate jet nozzles located at the individual bags and use a single jet toinject a pulse into the outlet-gas plenum.
Reverse-pulse filters are typically operated at higher filtrationvelocities (air-to-cloth ratios) than shaker or reverse-flow filtersdesigned for the same duty. Filtration velocities may range from 1 to4.5 m/min (3 to 15 ft/min), depending on the dust being collected, butfor most dusts the commonly used range is about 1.2 to 2.5 m/min (4 to 8 ft/min). The frequency of cleaning is also dependent on thenature and concentration of the dust, with the intervals betweenpulses varying from about 2 to 15 min.
The cleaning action of the pulse is so effective that the dust layermay be completely removed from the surface of the fabric. Conse-quently, the fabric itself must serve as the principal filter medium forat least a substantial part of the filtration cycle. Woven fabrics areunsuitable for such service, and felts of various types must be used.The bulk of the dust is still removed in a surface layer, but the feltensures that an adequate collection efficiency is maintained until thedust layer has formed.
Filter Fabrics The cost of the filter bags represents a substantialpart of the erected cost of a bag filter—typically 5 to 20 percent,depending on the bag material [Reigel and Bundy, Power, 121(1), 68(1977)]. The cost of bag repair and replacement is the largest compo-nent of the cost of bag-filter maintenance. Consequently, the properchoice of filter fabric is critical to both the technical performance andthe economics of operating a filter. With the advent of synthetic fibers,it has become possible to produce fabrics having a wide range of prop-erties. However, demonstrating the acceptability of a fabric stilldepends on experience with prolonged operation under the actual orsimulated conditions of the proposed application. The choice of a fab-ric material for a given service is necessarily a compromise, since nosingle material possesses all the properties that may be desired. Fol-lowing the choice of material, the type of fabric construction is critical.
Two principal types of fabric are adaptable to filter use: woven fab-rics, which are used in shaker and reverse-flow filters; and felts, whichare used in reverse-pulse filters. The felts made from synthetic fibersare needle felts (i.e., felted on a needle loom) and are normally rein-forced with a woven insert. The physical properties and air perme-abilities of some typical woven and felt filter fabrics are presented inTables 17-6 and 17-7. The “air permeability” of a filter fabric isdefined as the flow rate of air in cubic feet per minute (at 70°F, 1 atm)that will pass through 1 ft2 of clean fabric under an applied differentialpressure of a in water. The resistance coefficient KF of the clean fab-ric is defined by the equation in Table 17-6, which may be used to calculate the value of KF from the air permeability. If ∆pi is taken as0.5 in water, µ as 0.0181 cP (the viscosity of air at 70°F and 1 atm), andVf as the air permeability, then KF = 27.8/air permeability.
Collection Efficiency The inherent collection efficiency of fab-ric filters is usually so high that, for practical purposes, the preciselevel has not commonly been the subject of much concern. Further-more, for collection of a given dust, the efficiency is usually fixed bythe choices of filter fabric, filtration velocity, method of cleaning, and
GAS-SOLIDS SEPARATIONS 17-49
FIG. 17-60 Reverse-pulse fabric filter: (a) filter cylinders; (b) wire retainers;(c) collars; (d) tube sheet; (e) venturi nozzle; ( f) nozzle or orifice; (g) solenoidvalve; (h) timer; ( j) air manifold; (k) collector housing; (l) inlet; (m) hopper; (n)air lock; (o) upper plenum. (Mikropul Division, U.S. Filter Corp.)
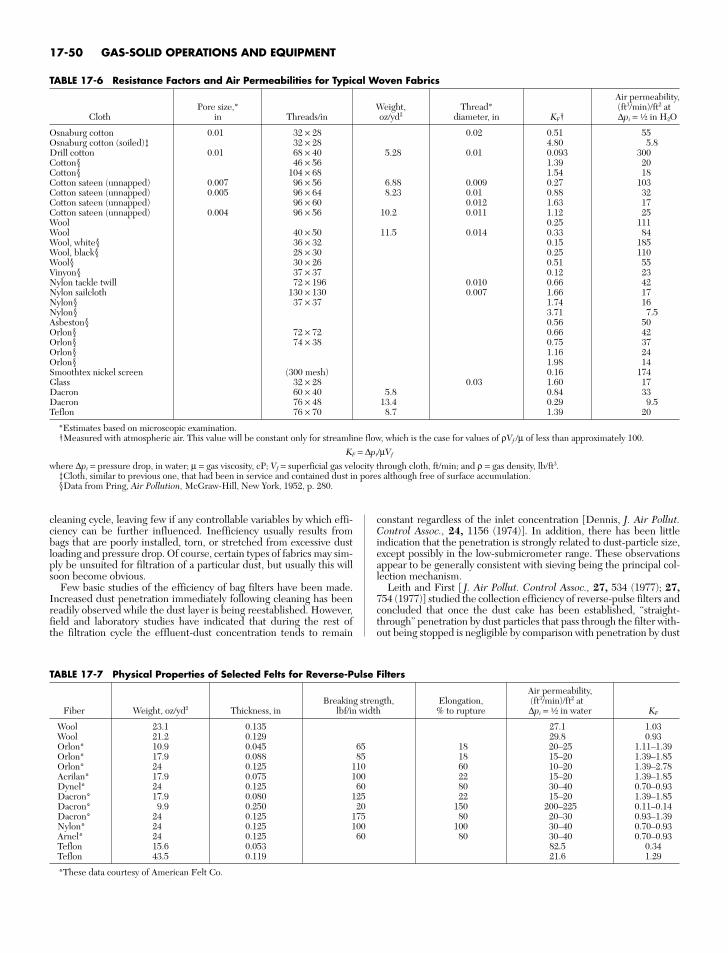
17-50 GAS-SOLID OPERATIONS AND EQUIPMENT
TABLE 17-6 Resistance Factors and Air Permeabilities for Typical Woven Fabrics
Air permeability,Pore size,* Weight, Thread* (ft3/min)/ft2 at
Cloth in Threads/in oz/yd2 diameter, in KF† ∆pi = a in H2O
Osnaburg cotton 0.01 32 × 28 0.02 0.51 55Osnaburg cotton (soiled)‡ 32 × 28 4.80 5.8Drill cotton 0.01 68 × 40 5.28 0.01 0.093 300Cotton§ 46 × 56 1.39 20Cotton§ 104 × 68 1.54 18Cotton sateen (unnapped) 0.007 96 × 56 6.88 0.009 0.27 103Cotton sateen (unnapped) 0.005 96 × 64 8.23 0.01 0.88 32Cotton sateen (unnapped) 96 × 60 0.012 1.63 17Cotton sateen (unnapped) 0.004 96 × 56 10.2 0.011 1.12 25Wool 0.25 111Wool 40 × 50 11.5 0.014 0.33 84Wool, white§ 36 × 32 0.15 185Wool, black§ 28 × 30 0.25 110Wool§ 30 × 26 0.51 55Vinyon§ 37 × 37 0.12 23Nylon tackle twill 72 × 196 0.010 0.66 42Nylon sailcloth 130 × 130 0.007 1.66 17Nylon§ 37 × 37 1.74 16Nylon§ 3.71 7.5Asbeston§ 0.56 50Orlon§ 72 × 72 0.66 42Orlon§ 74 × 38 0.75 37Orlon§ 1.16 24Orlon§ 1.98 14Smoothtex nickel screen (300 mesh) 0.16 174Glass 32 × 28 0.03 1.60 17Dacron 60 × 40 5.8 0.84 33Dacron 76 × 48 13.4 0.29 9.5Teflon 76 × 70 8.7 1.39 20
*Estimates based on microscopic examination.†Measured with atmospheric air. This value will be constant only for streamline flow, which is the case for values of ρVf /µ of less than approximately 100.
KF = ∆pi/µVf
where ∆pi = pressure drop, in water; µ = gas viscosity, cP; Vf = superficial gas velocity through cloth, ft/min; and ρ = gas density, lb/ft3.‡Cloth, similar to previous one, that had been in service and contained dust in pores although free of surface accumulation.§Data from Pring, Air Pollution, McGraw-Hill, New York, 1952, p. 280.
TABLE 17-7 Physical Properties of Selected Felts for Reverse-Pulse Filters
Air permeability,Breaking strength, Elongation, (ft3/min)/ft2 at
Fiber Weight, oz/yd2 Thickness, in lbf/in width % to rupture ∆pi = a in water KF
Wool 23.1 0.135 27.1 1.03Wool 21.2 0.129 29.8 0.93Orlon* 10.9 0.045 65 18 20–25 1.11–1.39Orlon* 17.9 0.088 85 18 15–20 1.39–1.85Orlon* 24 0.125 110 60 10–20 1.39–2.78Acrilan* 17.9 0.075 100 22 15–20 1.39–1.85Dynel* 24 0.125 60 80 30–40 0.70–0.93Dacron* 17.9 0.080 125 22 15–20 1.39–1.85Dacron* 9.9 0.250 20 150 200–225 0.11–0.14Dacron* 24 0.125 175 80 20–30 0.93–1.39Nylon* 24 0.125 100 100 30–40 0.70–0.93Arnel* 24 0.125 60 80 30–40 0.70–0.93Teflon 15.6 0.053 82.5 0.34Teflon 43.5 0.119 21.6 1.29
*These data courtesy of American Felt Co.
cleaning cycle, leaving few if any controllable variables by which effi-ciency can be further influenced. Inefficiency usually results frombags that are poorly installed, torn, or stretched from excessive dustloading and pressure drop. Of course, certain types of fabrics may sim-ply be unsuited for filtration of a particular dust, but usually this willsoon become obvious.
Few basic studies of the efficiency of bag filters have been made.Increased dust penetration immediately following cleaning has beenreadily observed while the dust layer is being reestablished. However,field and laboratory studies have indicated that during the rest of the filtration cycle the effluent-dust concentration tends to remain
constant regardless of the inlet concentration [Dennis, J. Air Pollut.Control Assoc., 24, 1156 (1974)]. In addition, there has been littleindication that the penetration is strongly related to dust-particle size,except possibly in the low-submicrometer range. These observationsappear to be generally consistent with sieving being the principal col-lection mechanism.
Leith and First [ J. Air Pollut. Control Assoc., 27, 534 (1977); 27,754 (1977)] studied the collection efficiency of reverse-pulse filters andconcluded that once the dust cake has been established, “straight-through” penetration by dust particles that pass through the filter with-out being stopped is negligible by comparison with penetration by dust
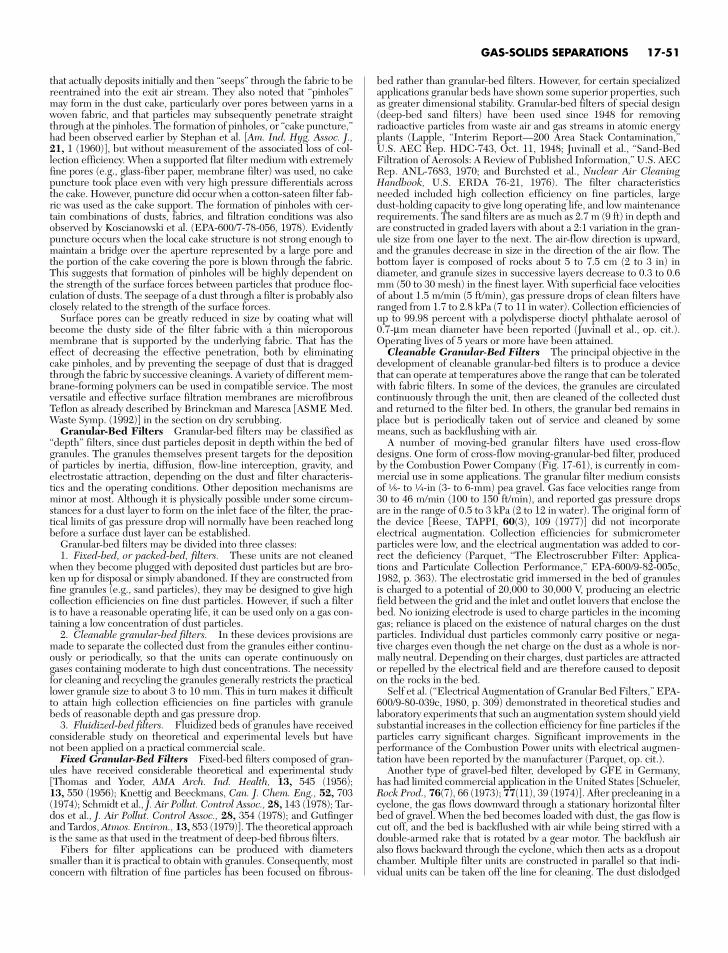
that actually deposits initially and then “seeps” through the fabric to bereentrained into the exit air stream. They also noted that “pinholes”may form in the dust cake, particularly over pores between yarns in awoven fabric, and that particles may subsequently penetrate straightthrough at the pinholes. The formation of pinholes, or “cake puncture,”had been observed earlier by Stephan et al. [Am. Ind. Hyg. Assoc. J.,21, 1 (1960)], but without measurement of the associated loss of col-lection efficiency. When a supported flat filter medium with extremelyfine pores (e.g., glass-fiber paper, membrane filter) was used, no cakepuncture took place even with very high pressure differentials acrossthe cake. However, puncture did occur when a cotton-sateen filter fab-ric was used as the cake support. The formation of pinholes with cer-tain combinations of dusts, fabrics, and filtration conditions was alsoobserved by Koscianowski et al. (EPA-600/7-78-056, 1978). Evidentlypuncture occurs when the local cake structure is not strong enough tomaintain a bridge over the aperture represented by a large pore andthe portion of the cake covering the pore is blown through the fabric.This suggests that formation of pinholes will be highly dependent onthe strength of the surface forces between particles that produce floc-culation of dusts. The seepage of a dust through a filter is probably alsoclosely related to the strength of the surface forces.
Surface pores can be greatly reduced in size by coating what willbecome the dusty side of the filter fabric with a thin microporousmembrane that is supported by the underlying fabric. That has theeffect of decreasing the effective penetration, both by eliminatingcake pinholes, and by preventing the seepage of dust that is draggedthrough the fabric by successive cleanings. A variety of different mem-brane-forming polymers can be used in compatible service. The mostversatile and effective surface filtration membranes are microfibrousTeflon as already described by Brinckman and Maresca [ASME Med.Waste Symp. (1992)] in the section on dry scrubbing.
Granular-Bed Filters Granular-bed filters may be classified as“depth” filters, since dust particles deposit in depth within the bed ofgranules. The granules themselves present targets for the depositionof particles by inertia, diffusion, flow-line interception, gravity, andelectrostatic attraction, depending on the dust and filter characteris-tics and the operating conditions. Other deposition mechanisms areminor at most. Although it is physically possible under some circum-stances for a dust layer to form on the inlet face of the filter, the prac-tical limits of gas pressure drop will normally have been reached longbefore a surface dust layer can be established.
Granular-bed filters may be divided into three classes:1. Fixed-bed, or packed-bed, filters. These units are not cleaned
when they become plugged with deposited dust particles but are bro-ken up for disposal or simply abandoned. If they are constructed fromfine granules (e.g., sand particles), they may be designed to give highcollection efficiencies on fine dust particles. However, if such a filteris to have a reasonable operating life, it can be used only on a gas con-taining a low concentration of dust particles.
2. Cleanable granular-bed filters. In these devices provisions aremade to separate the collected dust from the granules either continu-ously or periodically, so that the units can operate continuously ongases containing moderate to high dust concentrations. The necessityfor cleaning and recycling the granules generally restricts the practicallower granule size to about 3 to 10 mm. This in turn makes it difficultto attain high collection efficiencies on fine particles with granulebeds of reasonable depth and gas pressure drop.
3. Fluidized-bed filters. Fluidized beds of granules have receivedconsiderable study on theoretical and experimental levels but havenot been applied on a practical commercial scale.
Fixed Granular-Bed Filters Fixed-bed filters composed of gran-ules have received considerable theoretical and experimental study[Thomas and Yoder, AMA Arch. Ind. Health, 13, 545 (1956); 13, 550 (1956); Knettig and Beeckmans, Can. J. Chem. Eng., 52, 703(1974); Schmidt et al., J. Air Pollut. Control Assoc., 28, 143 (1978); Tar-dos et al., J. Air Pollut. Control Assoc., 28, 354 (1978); and Gutfingerand Tardos, Atmos. Environ., 13, 853 (1979)]. The theoretical approachis the same as that used in the treatment of deep-bed fibrous filters.
Fibers for filter applications can be produced with diameterssmaller than it is practical to obtain with granules. Consequently, mostconcern with filtration of fine particles has been focused on fibrous-
bed rather than granular-bed filters. However, for certain specializedapplications granular beds have shown some superior properties, suchas greater dimensional stability. Granular-bed filters of special design(deep-bed sand filters) have been used since 1948 for removingradioactive particles from waste air and gas streams in atomic energyplants (Lapple, “Interim Report—200 Area Stack Contamination,”U.S. AEC Rep. HDC-743, Oct. 11, 1948; Juvinall et al., “Sand-BedFiltration of Aerosols: A Review of Published Information,” U.S. AECRep. ANL-7683, 1970; and Burchsted et al., Nuclear Air CleaningHandbook, U.S. ERDA 76-21, 1976). The filter characteristicsneeded included high collection efficiency on fine particles, largedust-holding capacity to give long operating life, and low maintenancerequirements. The sand filters are as much as 2.7 m (9 ft) in depth andare constructed in graded layers with about a 2:1 variation in the gran-ule size from one layer to the next. The air-flow direction is upward,and the granules decrease in size in the direction of the air flow. Thebottom layer is composed of rocks about 5 to 7.5 cm (2 to 3 in) indiameter, and granule sizes in successive layers decrease to 0.3 to 0.6mm (50 to 30 mesh) in the finest layer. With superficial face velocitiesof about 1.5 m/min (5 ft/min), gas pressure drops of clean filters haveranged from 1.7 to 2.8 kPa (7 to 11 in water). Collection efficiencies ofup to 99.98 percent with a polydisperse dioctyl phthalate aerosol of0.7-µm mean diameter have been reported (Juvinall et al., op. cit.).Operating lives of 5 years or more have been attained.
Cleanable Granular-Bed Filters The principal objective in thedevelopment of cleanable granular-bed filters is to produce a devicethat can operate at temperatures above the range that can be toleratedwith fabric filters. In some of the devices, the granules are circulatedcontinuously through the unit, then are cleaned of the collected dustand returned to the filter bed. In others, the granular bed remains inplace but is periodically taken out of service and cleaned by somemeans, such as backflushing with air.
A number of moving-bed granular filters have used cross-flowdesigns. One form of cross-flow moving-granular-bed filter, producedby the Combustion Power Company (Fig. 17-61), is currently in com-mercial use in some applications. The granular filter medium consistsof f- to d-in (3- to 6-mm) pea gravel. Gas face velocities range from30 to 46 m/min (100 to 150 ft/min), and reported gas pressure dropsare in the range of 0.5 to 3 kPa (2 to 12 in water). The original form ofthe device [Reese, TAPPI, 60(3), 109 (1977)] did not incorporateelectrical augmentation. Collection efficiencies for submicrometerparticles were low, and the electrical augmentation was added to cor-rect the deficiency (Parquet, “The Electroscrubber Filter: Applica-tions and Particulate Collection Performance,” EPA-600/9-82-005c,1982, p. 363). The electrostatic grid immersed in the bed of granulesis charged to a potential of 20,000 to 30,000 V, producing an electricfield between the grid and the inlet and outlet louvers that enclose thebed. No ionizing electrode is used to charge particles in the incominggas; reliance is placed on the existence of natural charges on the dustparticles. Individual dust particles commonly carry positive or nega-tive charges even though the net charge on the dust as a whole is nor-mally neutral. Depending on their charges, dust particles are attractedor repelled by the electrical field and are therefore caused to depositon the rocks in the bed.
Self et al. (“Electrical Augmentation of Granular Bed Filters,” EPA-600/9-80-039c, 1980, p. 309) demonstrated in theoretical studies andlaboratory experiments that such an augmentation system should yieldsubstantial increases in the collection efficiency for fine particles if theparticles carry significant charges. Significant improvements in theperformance of the Combustion Power units with electrical augmen-tation have been reported by the manufacturer (Parquet, op. cit.).
Another type of gravel-bed filter, developed by GFE in Germany,has had limited commercial application in the United States [Schueler,Rock Prod., 76(7), 66 (1973); 77(11), 39 (1974)]. After precleaning in acyclone, the gas flows downward through a stationary horizontal filterbed of gravel. When the bed becomes loaded with dust, the gas flow iscut off, and the bed is backflushed with air while being stirred with adouble-armed rake that is rotated by a gear motor. The backflush airalso flows backward through the cyclone, which then acts as a dropoutchamber. Multiple filter units are constructed in parallel so that indi-vidual units can be taken off the line for cleaning. The dust dislodged
GAS-SOLIDS SEPARATIONS 17-51
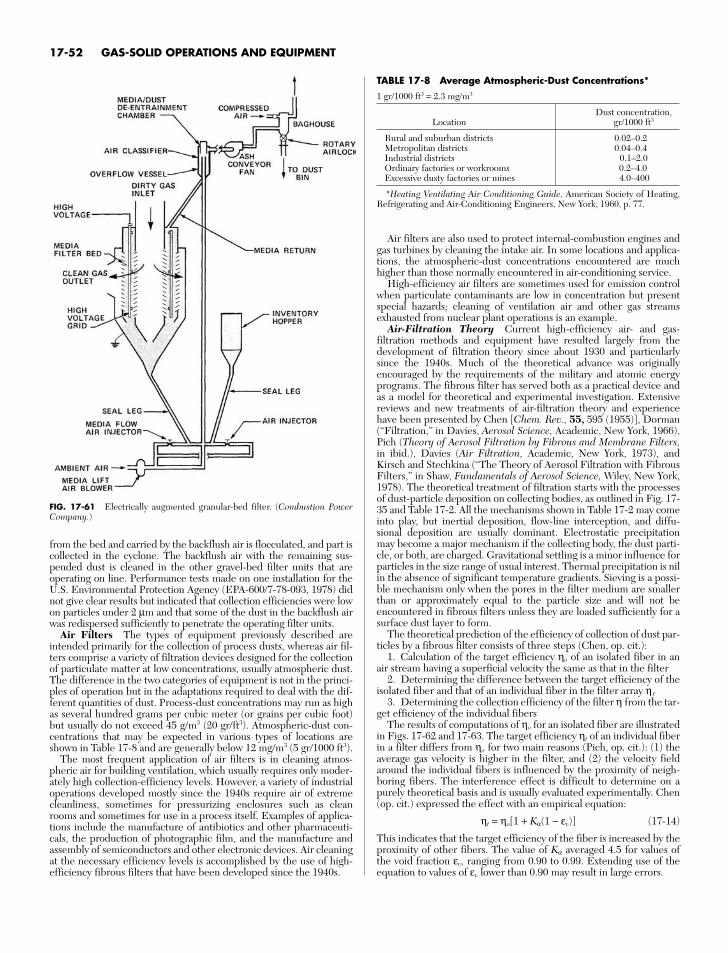
from the bed and carried by the backflush air is flocculated, and part iscollected in the cyclone. The backflush air with the remaining sus-pended dust is cleaned in the other gravel-bed filter units that areoperating on line. Performance tests made on one installation for theU.S. Environmental Protection Agency (EPA-600/7-78-093, 1978) didnot give clear results but indicated that collection efficiencies were lowon particles under 2 µm and that some of the dust in the backflush airwas redispersed sufficiently to penetrate the operating filter units.
Air Filters The types of equipment previously described areintended primarily for the collection of process dusts, whereas air fil-ters comprise a variety of filtration devices designed for the collectionof particulate matter at low concentrations, usually atmospheric dust.The difference in the two categories of equipment is not in the princi-ples of operation but in the adaptations required to deal with the dif-ferent quantities of dust. Process-dust concentrations may run as highas several hundred grams per cubic meter (or grains per cubic foot)but usually do not exceed 45 g/m3 (20 gr/ft3). Atmospheric-dust con-centrations that may be expected in various types of locations areshown in Table 17-8 and are generally below 12 mg/m3 (5 gr/1000 ft3).
The most frequent application of air filters is in cleaning atmos-pheric air for building ventilation, which usually requires only moder-ately high collection-efficiency levels. However, a variety of industrialoperations developed mostly since the 1940s require air of extremecleanliness, sometimes for pressurizing enclosures such as cleanrooms and sometimes for use in a process itself. Examples of applica-tions include the manufacture of antibiotics and other pharmaceuti-cals, the production of photographic film, and the manufacture andassembly of semiconductors and other electronic devices. Air cleaningat the necessary efficiency levels is accomplished by the use of high-efficiency fibrous filters that have been developed since the 1940s.
Air filters are also used to protect internal-combustion engines andgas turbines by cleaning the intake air. In some locations and applica-tions, the atmospheric-dust concentrations encountered are muchhigher than those normally encountered in air-conditioning service.
High-efficiency air filters are sometimes used for emission controlwhen particulate contaminants are low in concentration but presentspecial hazards; cleaning of ventilation air and other gas streamsexhausted from nuclear plant operations is an example.
Air-Filtration Theory Current high-efficiency air- and gas-filtration methods and equipment have resulted largely from thedevelopment of filtration theory since about 1930 and particularlysince the 1940s. Much of the theoretical advance was originallyencouraged by the requirements of the military and atomic energyprograms. The fibrous filter has served both as a practical device andas a model for theoretical and experimental investigation. Extensivereviews and new treatments of air-filtration theory and experiencehave been presented by Chen [Chem. Rev., 55, 595 (1955)], Dorman(“Filtration,” in Davies, Aerosol Science, Academic, New York, 1966),Pich (Theory of Aerosol Filtration by Fibrous and Membrane Filters,in ibid.), Davies (Air Filtration, Academic, New York, 1973), andKirsch and Stechkina (“The Theory of Aerosol Filtration with FibrousFilters,” in Shaw, Fundamentals of Aerosol Science, Wiley, New York,1978). The theoretical treatment of filtration starts with the processesof dust-particle deposition on collecting bodies, as outlined in Fig. 17-35 and Table 17-2. All the mechanisms shown in Table 17-2 may comeinto play, but inertial deposition, flow-line interception, and diffu-sional deposition are usually dominant. Electrostatic precipitationmay become a major mechanism if the collecting body, the dust parti-cle, or both, are charged. Gravitational settling is a minor influence forparticles in the size range of usual interest. Thermal precipitation is nilin the absence of significant temperature gradients. Sieving is a possi-ble mechanism only when the pores in the filter medium are smallerthan or approximately equal to the particle size and will not beencountered in fibrous filters unless they are loaded sufficiently for asurface dust layer to form.
The theoretical prediction of the efficiency of collection of dust par-ticles by a fibrous filter consists of three steps (Chen, op. cit.):
1. Calculation of the target efficiency ηo of an isolated fiber in anair stream having a superficial velocity the same as that in the filter
2. Determining the difference between the target efficiency of theisolated fiber and that of an individual fiber in the filter array η t
3. Determining the collection efficiency of the filter η from the tar-get efficiency of the individual fibers
The results of computations of ηo for an isolated fiber are illustratedin Figs. 17-62 and 17-63. The target efficiency ηt of an individual fiberin a filter differs from ηo for two main reasons (Pich, op. cit.): (1) theaverage gas velocity is higher in the filter, and (2) the velocity fieldaround the individual fibers is influenced by the proximity of neigh-boring fibers. The interference effect is difficult to determine on apurely theoretical basis and is usually evaluated experimentally. Chen(op. cit.) expressed the effect with an empirical equation:
ηt = ηo[1 + Kα(1 − εv)] (17-14)
This indicates that the target efficiency of the fiber is increased by theproximity of other fibers. The value of Kα averaged 4.5 for values ofthe void fraction εv, ranging from 0.90 to 0.99. Extending use of theequation to values of εv lower than 0.90 may result in large errors.
17-52 GAS-SOLID OPERATIONS AND EQUIPMENT
FIG. 17-61 Electrically augmented granular-bed filter. (Combustion PowerCompany.)
TABLE 17-8 Average Atmospheric-Dust Concentrations*
1 gr/1000 ft3 = 2.3 mg/m3
Dust concentration,Location gr/1000 ft3
Rural and suburban districts 0.02–0.2Metropolitan districts 0.04–0.4Industrial districts 0.1–2.0Ordinary factories or workrooms 0.2–4.0Excessive dusty factories or mines 4.0–400
*Heating Ventilating Air Conditioning Guide, American Society of Heating,Refrigerating and Air-Conditioning Engineers, New York, 1960, p. 77.
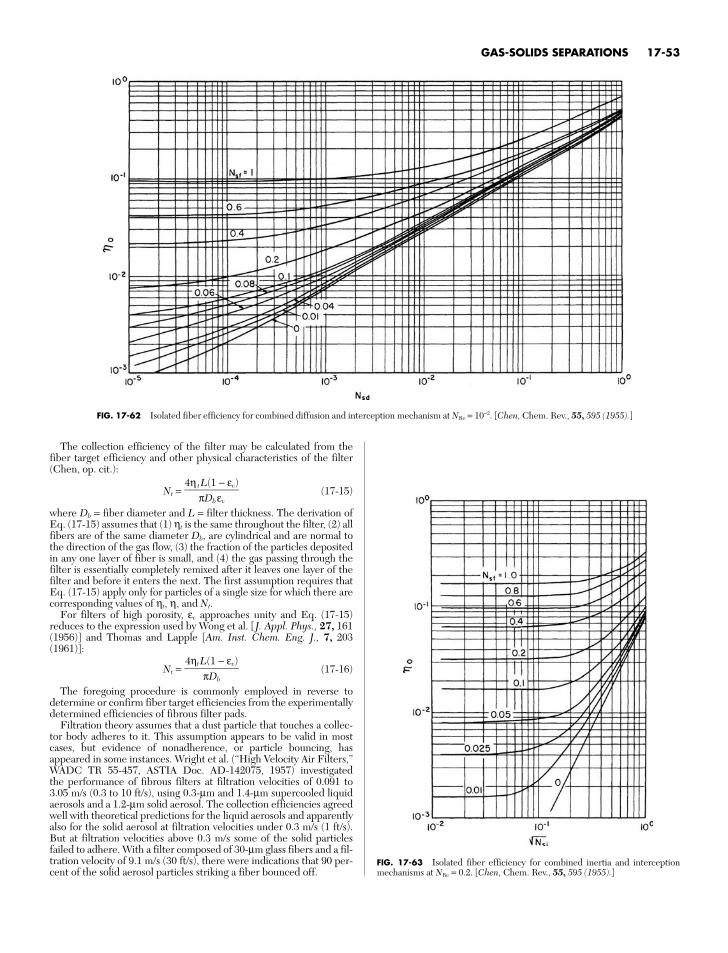
The collection efficiency of the filter may be calculated from thefiber target efficiency and other physical characteristics of the filter(Chen, op. cit.):
Nt = (17-15)
where Db = fiber diameter and L = filter thickness. The derivation ofEq. (17-15) assumes that (1) ηt is the same throughout the filter, (2) allfibers are of the same diameter Db, are cylindrical and are normal tothe direction of the gas flow, (3) the fraction of the particles depositedin any one layer of fiber is small, and (4) the gas passing through thefilter is essentially completely remixed after it leaves one layer of thefilter and before it enters the next. The first assumption requires thatEq. (17-15) apply only for particles of a single size for which there arecorresponding values of ηt, η, and Nt.
For filters of high porosity, εv approaches unity and Eq. (17-15)reduces to the expression used by Wong et al. [J. Appl. Phys., 27, 161(1956)] and Thomas and Lapple [Am. Inst. Chem. Eng. J., 7, 203(1961)]:
Nt = (17-16)
The foregoing procedure is commonly employed in reverse todetermine or confirm fiber target efficiencies from the experimentallydetermined efficiencies of fibrous filter pads.
Filtration theory assumes that a dust particle that touches a collec-tor body adheres to it. This assumption appears to be valid in mostcases, but evidence of nonadherence, or particle bouncing, hasappeared in some instances. Wright et al. (“High Velocity Air Filters,”WADC TR 55-457, ASTIA Doc. AD-142075, 1957) investigated the performance of fibrous filters at filtration velocities of 0.091 to 3.05 m/s (0.3 to 10 ft/s), using 0.3-µm and 1.4-µm supercooled liquidaerosols and a 1.2-µm solid aerosol. The collection efficiencies agreedwell with theoretical predictions for the liquid aerosols and apparentlyalso for the solid aerosol at filtration velocities under 0.3 m/s (1 ft/s).But at filtration velocities above 0.3 m/s some of the solid particlesfailed to adhere. With a filter composed of 30-µm glass fibers and a fil-tration velocity of 9.1 m/s (30 ft/s), there were indications that 90 per-cent of the solid aerosol particles striking a fiber bounced off.
4ηtL(1 − εv)
πDb
4η tL(1 − εv)
πDbεv
GAS-SOLIDS SEPARATIONS 17-53
FIG. 17-62 Isolated fiber efficiency for combined diffusion and interception mechanism at NRe = 10−2. [Chen, Chem. Rev., 55, 595 (1955).]
FIG. 17-63 Isolated fiber efficiency for combined inertia and interceptionmechanisms at NRe = 0.2. [Chen, Chem. Rev., 55, 595 (1955).]
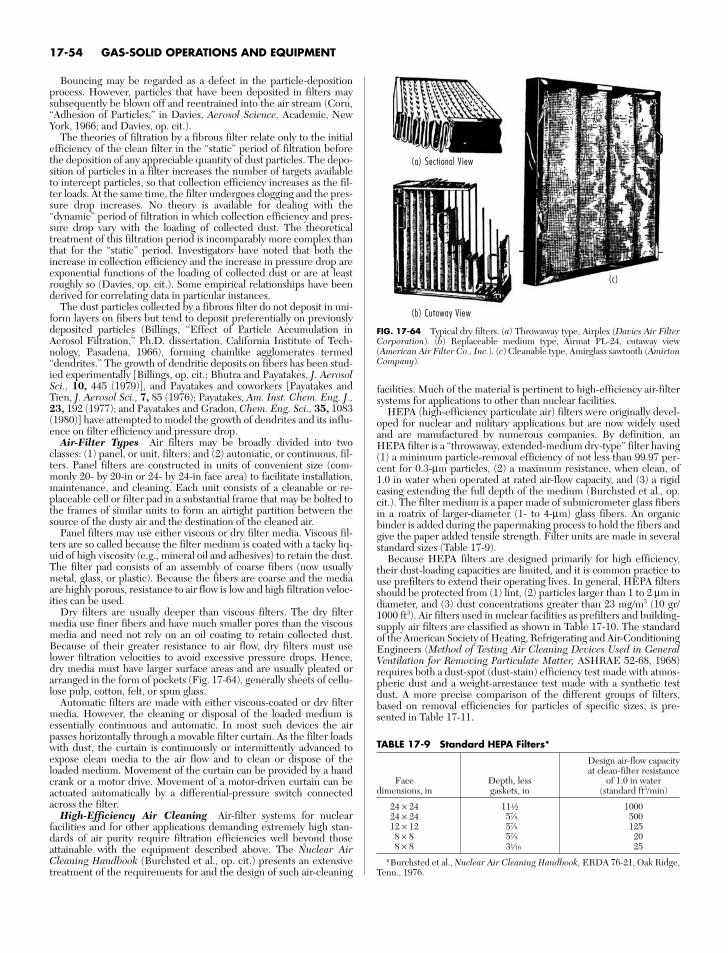
Bouncing may be regarded as a defect in the particle-depositionprocess. However, particles that have been deposited in filters maysubsequently be blown off and reentrained into the air stream (Corn,“Adhesion of Particles,” in Davies, Aerosol Science, Academic, NewYork, 1966; and Davies, op. cit.).
The theories of filtration by a fibrous filter relate only to the initialefficiency of the clean filter in the “static” period of filtration beforethe deposition of any appreciable quantity of dust particles. The depo-sition of particles in a filter increases the number of targets availableto intercept particles, so that collection efficiency increases as the fil-ter loads. At the same time, the filter undergoes clogging and the pres-sure drop increases. No theory is available for dealing with the“dynamic” period of filtration in which collection efficiency and pres-sure drop vary with the loading of collected dust. The theoreticaltreatment of this filtration period is incomparably more complex thanthat for the “static” period. Investigators have noted that both theincrease in collection efficiency and the increase in pressure drop areexponential functions of the loading of collected dust or are at leastroughly so (Davies, op. cit.). Some empirical relationships have beenderived for correlating data in particular instances.
The dust particles collected by a fibrous filter do not deposit in uni-form layers on fibers but tend to deposit preferentially on previouslydeposited particles (Billings, “Effect of Particle Accumulation inAerosol Filtration,” Ph.D. dissertation, California Institute of Tech-nology, Pasadena, 1966), forming chainlike agglomerates termed“dendrites.” The growth of dendritic deposits on fibers has been stud-ied experimentally [Billings, op. cit.; Bhutra and Payatakes, J. AerosolSci., 10, 445 (1979)], and Payatakes and coworkers [Payatakes andTien, J. Aerosol Sci., 7, 85 (1976); Payatakes, Am. Inst. Chem. Eng. J.,23, 192 (1977); and Payatakes and Gradon, Chem. Eng. Sci., 35, 1083(1980)] have attempted to model the growth of dendrites and its influ-ence on filter efficiency and pressure drop.
Air-Filter Types Air filters may be broadly divided into twoclasses: (1) panel, or unit, filters; and (2) automatic, or continuous, fil-ters. Panel filters are constructed in units of convenient size (com-monly 20- by 20-in or 24- by 24-in face area) to facilitate installation,maintenance, and cleaning. Each unit consists of a cleanable or re-placeable cell or filter pad in a substantial frame that may be bolted tothe frames of similar units to form an airtight partition between thesource of the dusty air and the destination of the cleaned air.
Panel filters may use either viscous or dry filter media. Viscous fil-ters are so called because the filter medium is coated with a tacky liq-uid of high viscosity (e.g., mineral oil and adhesives) to retain the dust.The filter pad consists of an assembly of coarse fibers (now usuallymetal, glass, or plastic). Because the fibers are coarse and the mediaare highly porous, resistance to air flow is low and high filtration veloc-ities can be used.
Dry filters are usually deeper than viscous filters. The dry filtermedia use finer fibers and have much smaller pores than the viscousmedia and need not rely on an oil coating to retain collected dust.Because of their greater resistance to air flow, dry filters must uselower filtration velocities to avoid excessive pressure drops. Hence,dry media must have larger surface areas and are usually pleated orarranged in the form of pockets (Fig. 17-64), generally sheets of cellu-lose pulp, cotton, felt, or spun glass.
Automatic filters are made with either viscous-coated or dry filtermedia. However, the cleaning or disposal of the loaded medium isessentially continuous and automatic. In most such devices the airpasses horizontally through a movable filter curtain. As the filter loadswith dust, the curtain is continuously or intermittently advanced toexpose clean media to the air flow and to clean or dispose of theloaded medium. Movement of the curtain can be provided by a handcrank or a motor drive. Movement of a motor-driven curtain can beactuated automatically by a differential-pressure switch connectedacross the filter.
High-Efficiency Air Cleaning Air-filter systems for nuclearfacilities and for other applications demanding extremely high stan-dards of air purity require filtration efficiencies well beyond thoseattainable with the equipment described above. The Nuclear AirCleaning Handbook (Burchsted et al., op. cit.) presents an extensivetreatment of the requirements for and the design of such air-cleaning
facilities. Much of the material is pertinent to high-efficiency air-filtersystems for applications to other than nuclear facilities.
HEPA (high-efficiency particulate air) filters were originally devel-oped for nuclear and military applications but are now widely usedand are manufactured by numerous companies. By definition, anHEPA filter is a “throwaway, extended-medium dry-type” filter having(1) a minimum particle-removal efficiency of not less than 99.97 per-cent for 0.3-µm particles, (2) a maximum resistance, when clean, of1.0 in water when operated at rated air-flow capacity, and (3) a rigidcasing extending the full depth of the medium (Burchsted et al., op.cit.). The filter medium is a paper made of submicrometer glass fibersin a matrix of larger-diameter (1- to 4-µm) glass fibers. An organicbinder is added during the papermaking process to hold the fibers andgive the paper added tensile strength. Filter units are made in severalstandard sizes (Table 17-9).
Because HEPA filters are designed primarily for high efficiency,their dust-loading capacities are limited, and it is common practice touse prefilters to extend their operating lives. In general, HEPA filtersshould be protected from (1) lint, (2) particles larger than 1 to 2 µm indiameter, and (3) dust concentrations greater than 23 mg/m3 (10 gr/1000 ft3). Air filters used in nuclear facilities as prefilters and building-supply air filters are classified as shown in Table 17-10. The standardof the American Society of Heating, Refrigerating and Air-ConditioningEngineers (Method of Testing Air Cleaning Devices Used in GeneralVentilation for Removing Particulate Matter, ASHRAE 52-68, 1968)requires both a dust-spot (dust-stain) efficiency test made with atmos-pheric dust and a weight-arrestance test made with a synthetic testdust. A more precise comparison of the different groups of filters,based on removal efficiencies for particles of specific sizes, is pre-sented in Table 17-11.
17-54 GAS-SOLID OPERATIONS AND EQUIPMENT
FIG. 17-64 Typical dry filters. (a) Throwaway type, Airplex (Davies Air FilterCorporation). (b) Replaceable medium type, Airmat PL-24, cutaway view(American Air Filter Co., Inc.). (c) Cleanable type, Amirglass sawtooth (AmirtonCompany).
TABLE 17-9 Standard HEPA Filters*
Design air-flow capacityat clean-filter resistance
Face Depth, less of 1.0 in waterdimensions, in gaskets, in (standard ft3/min)
24 × 24 11a 100024 × 24 57⁄8 50012 × 12 57⁄8 1258 × 8 57⁄8 208 × 8 3g 25
*Burchsted et al., Nuclear Air Cleaning Handbook, ERDA 76-21, Oak Ridge,Tenn., 1976.
(b) Cutaway View
(a) Sectional View
(c)
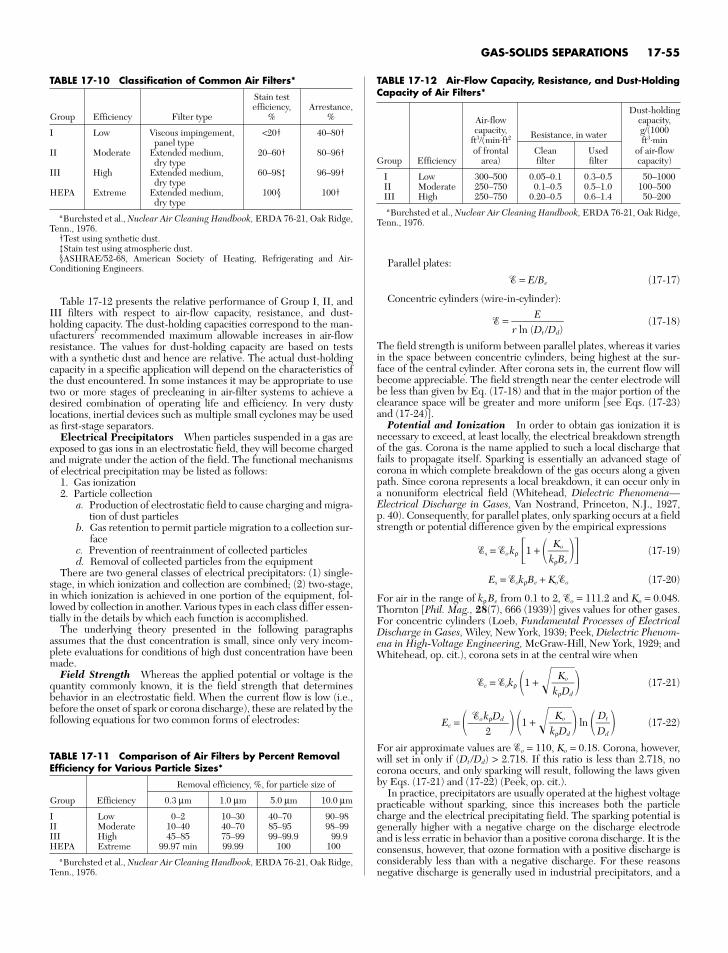
Table 17-12 presents the relative performance of Group I, II, andIII filters with respect to air-flow capacity, resistance, and dust-holding capacity. The dust-holding capacities correspond to the man-ufacturers’ recommended maximum allowable increases in air-flowresistance. The values for dust-holding capacity are based on testswith a synthetic dust and hence are relative. The actual dust-holdingcapacity in a specific application will depend on the characteristics ofthe dust encountered. In some instances it may be appropriate to usetwo or more stages of precleaning in air-filter systems to achieve adesired combination of operating life and efficiency. In very dustylocations, inertial devices such as multiple small cyclones may be usedas first-stage separators.
Electrical Precipitators When particles suspended in a gas areexposed to gas ions in an electrostatic field, they will become chargedand migrate under the action of the field. The functional mechanismsof electrical precipitation may be listed as follows:
1. Gas ionization2. Particle collection
a. Production of electrostatic field to cause charging and migra-tion of dust particles
b. Gas retention to permit particle migration to a collection sur-face
c. Prevention of reentrainment of collected particlesd. Removal of collected particles from the equipment
There are two general classes of electrical precipitators: (1) single-stage, in which ionization and collection are combined; (2) two-stage,in which ionization is achieved in one portion of the equipment, fol-lowed by collection in another. Various types in each class differ essen-tially in the details by which each function is accomplished.
The underlying theory presented in the following paragraphsassumes that the dust concentration is small, since only very incom-plete evaluations for conditions of high dust concentration have beenmade.
Field Strength Whereas the applied potential or voltage is thequantity commonly known, it is the field strength that determinesbehavior in an electrostatic field. When the current flow is low (i.e.,before the onset of spark or corona discharge), these are related by thefollowing equations for two common forms of electrodes:
Parallel plates:
= E/Be (17-17)
Concentric cylinders (wire-in-cylinder):
= (17-18)
The field strength is uniform between parallel plates, whereas it variesin the space between concentric cylinders, being highest at the sur-face of the central cylinder. After corona sets in, the current flow willbecome appreciable. The field strength near the center electrode willbe less than given by Eq. (17-18) and that in the major portion of theclearance space will be greater and more uniform [see Eqs. (17-23)and (17-24)].
Potential and Ionization In order to obtain gas ionization it isnecessary to exceed, at least locally, the electrical breakdown strengthof the gas. Corona is the name applied to such a local discharge thatfails to propagate itself. Sparking is essentially an advanced stage ofcorona in which complete breakdown of the gas occurs along a givenpath. Since corona represents a local breakdown, it can occur only ina nonuniform electrical field (Whitehead, Dielectric Phenomena—Electrical Discharge in Gases, Van Nostrand, Princeton, N.J., 1927, p. 40). Consequently, for parallel plates, only sparking occurs at a fieldstrength or potential difference given by the empirical expressions
s = o kρ 1 + (17-19)
Es = okρBe + Koo (17-20)
For air in the range of kρBe from 0.1 to 2, o = 111.2 and Ko = 0.048.Thornton [Phil. Mag., 28(7), 666 (1939)] gives values for other gases.For concentric cylinders (Loeb, Fundamental Processes of ElectricalDischarge in Gases, Wiley, New York, 1939; Peek, Dielectric Phenom-ena in High-Voltage Engineering, McGraw-Hill, New York, 1929; andWhitehead, op. cit.), corona sets in at the central wire when
c = okρ 1 + (17-21)
Ec = 1 + ln (17-22)
For air approximate values are o = 110, Ko = 0.18. Corona, however,will set in only if (Dt /Dd) > 2.718. If this ratio is less than 2.718, nocorona occurs, and only sparking will result, following the laws givenby Eqs. (17-21) and (17-22) (Peek, op. cit.).
In practice, precipitators are usually operated at the highest voltagepracticable without sparking, since this increases both the particlecharge and the electrical precipitating field. The sparking potential isgenerally higher with a negative charge on the discharge electrodeand is less erratic in behavior than a positive corona discharge. It is theconsensus, however, that ozone formation with a positive discharge isconsiderably less than with a negative discharge. For these reasonsnegative discharge is generally used in industrial precipitators, and a
DtDd
KokρDd
o kρDd
2
KokρDd
KokρBe
Er ln (Dt /Dd)
GAS-SOLIDS SEPARATIONS 17-55
TABLE 17-10 Classification of Common Air Filters*
Stain testefficiency, Arrestance,
Group Efficiency Filter type % %
I Low Viscous impingement, <20† 40–80†panel type
II Moderate Extended medium, 20–60† 80–96†dry type
III High Extended medium, 60–98‡ 96–99†dry type
HEPA Extreme Extended medium, 100§ 100†dry type
*Burchsted et al., Nuclear Air Cleaning Handbook, ERDA 76-21, Oak Ridge,Tenn., 1976.
†Test using synthetic dust.‡Stain test using atmospheric dust.§ASHRAE/52-68, American Society of Heating, Refrigerating and Air-
Conditioning Engineers.
TABLE 17-11 Comparison of Air Filters by Percent RemovalEfficiency for Various Particle Sizes*
Removal efficiency, %, for particle size of
Group Efficiency 0.3 µm 1.0 µm 5.0 µm 10.0 µm
I Low 0–2 10–30 40–70 90–98II Moderate 10–40 40–70 85–95 98–99III High 45–85 75–99 99–99.9 99.9HEPA Extreme 99.97 min 99.99 100 100
*Burchsted et al., Nuclear Air Cleaning Handbook, ERDA 76-21, Oak Ridge,Tenn., 1976.
TABLE 17-12 Air-Flow Capacity, Resistance, and Dust-HoldingCapacity of Air Filters*
Dust-holdingAir-flow capacity,capacity, g/(1000
ft3/(min⋅ft2 Resistance, in water ft3⋅minof frontal Clean Used of air-flow
Group Efficiency area) filter filter capacity)
I Low 300–500 0.05–0.1 0.3–0.5 50–1000II Moderate 250–750 0.1–0.5 0.5–1.0 100–500III High 250–750 0.20–0.5 0.6–1.4 50–200
*Burchsted et al., Nuclear Air Cleaning Handbook, ERDA 76-21, Oak Ridge,Tenn., 1976.
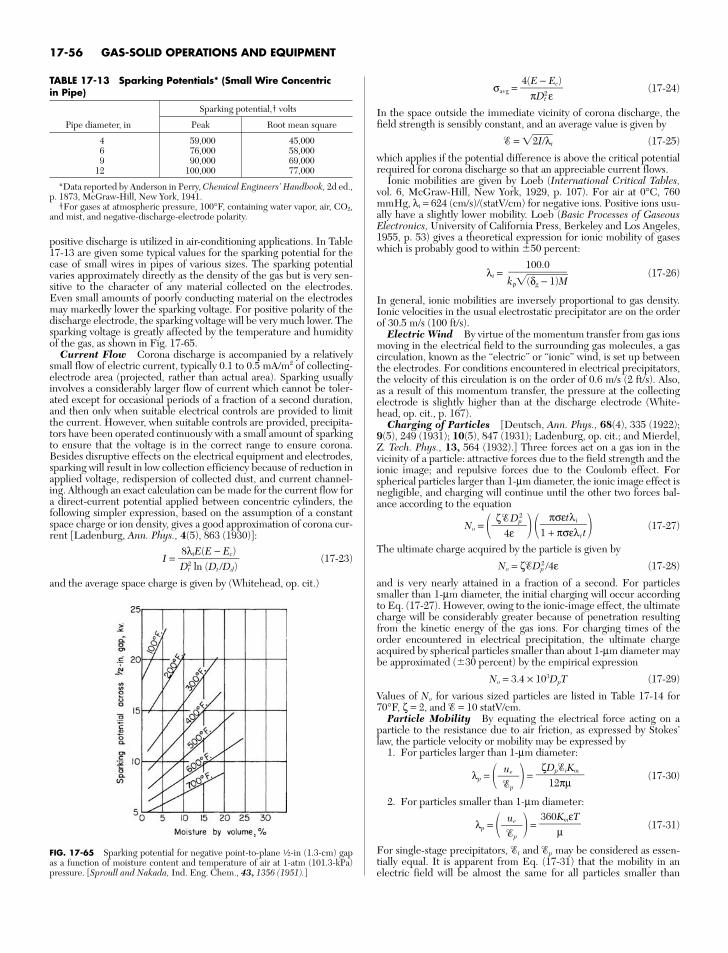
positive discharge is utilized in air-conditioning applications. In Table17-13 are given some typical values for the sparking potential for thecase of small wires in pipes of various sizes. The sparking potentialvaries approximately directly as the density of the gas but is very sen-sitive to the character of any material collected on the electrodes.Even small amounts of poorly conducting material on the electrodesmay markedly lower the sparking voltage. For positive polarity of thedischarge electrode, the sparking voltage will be very much lower. Thesparking voltage is greatly affected by the temperature and humidityof the gas, as shown in Fig. 17-65.
Current Flow Corona discharge is accompanied by a relativelysmall flow of electric current, typically 0.1 to 0.5 mA/m2 of collecting-electrode area (projected, rather than actual area). Sparking usuallyinvolves a considerably larger flow of current which cannot be toler-ated except for occasional periods of a fraction of a second duration,and then only when suitable electrical controls are provided to limitthe current. However, when suitable controls are provided, precipita-tors have been operated continuously with a small amount of sparkingto ensure that the voltage is in the correct range to ensure corona.Besides disruptive effects on the electrical equipment and electrodes,sparking will result in low collection efficiency because of reduction inapplied voltage, redispersion of collected dust, and current channel-ing. Although an exact calculation can be made for the current flow fora direct-current potential applied between concentric cylinders, thefollowing simpler expression, based on the assumption of a constantspace charge or ion density, gives a good approximation of corona cur-rent [Ladenburg, Ann. Phys., 4(5), 863 (1930)]:
I = (17-23)
and the average space charge is given by (Whitehead, op. cit.)
8λiE(E − Ec)Dt
2 ln (Dt /Dd)
σavg = (17-24)
In the space outside the immediate vicinity of corona discharge, thefield strength is sensibly constant, and an average value is given by
= 2I/λi (17-25)
which applies if the potential difference is above the critical potentialrequired for corona discharge so that an appreciable current flows.
Ionic mobilities are given by Loeb (International Critical Tables,vol. 6, McGraw-Hill, New York, 1929, p. 107). For air at 0°C, 760mmHg, λi = 624 (cm/s)/(statV/cm) for negative ions. Positive ions usu-ally have a slightly lower mobility. Loeb (Basic Processes of GaseousElectronics, University of California Press, Berkeley and Los Angeles,1955, p. 53) gives a theoretical expression for ionic mobility of gaseswhich is probably good to within 50 percent:
λi = (17-26)
In general, ionic mobilities are inversely proportional to gas density.Ionic velocities in the usual electrostatic precipitator are on the orderof 30.5 m/s (100 ft/s).
Electric Wind By virtue of the momentum transfer from gas ionsmoving in the electrical field to the surrounding gas molecules, a gascirculation, known as the “electric” or “ionic” wind, is set up betweenthe electrodes. For conditions encountered in electrical precipitators,the velocity of this circulation is on the order of 0.6 m/s (2 ft/s). Also,as a result of this momentum transfer, the pressure at the collectingelectrode is slightly higher than at the discharge electrode (White-head, op. cit., p. 167).
Charging of Particles [Deutsch, Ann. Phys., 68(4), 335 (1922);9(5), 249 (1931); 10(5), 847 (1931); Ladenburg, op. cit.; and Mierdel,Z. Tech. Phys., 13, 564 (1932).] Three forces act on a gas ion in thevicinity of a particle: attractive forces due to the field strength and theionic image; and repulsive forces due to the Coulomb effect. Forspherical particles larger than 1-µm diameter, the ionic image effect isnegligible, and charging will continue until the other two forces bal-ance according to the equation
No = (17-27)
The ultimate charge acquired by the particle is given by
No = ζDp2 /4ε (17-28)
and is very nearly attained in a fraction of a second. For particlessmaller than 1-µm diameter, the initial charging will occur accordingto Eq. (17-27). However, owing to the ionic-image effect, the ultimatecharge will be considerably greater because of penetration resultingfrom the kinetic energy of the gas ions. For charging times of theorder encountered in electrical precipitation, the ultimate chargeacquired by spherical particles smaller than about 1-µm diameter maybe approximated (30 percent) by the empirical expression
No = 3.4 × 10³DpT (17-29)
Values of No for various sized particles are listed in Table 17-14 for70°F, ζ = 2, and = 10 statV/cm.
Particle Mobility By equating the electrical force acting on aparticle to the resistance due to air friction, as expressed by Stokes’law, the particle velocity or mobility may be expressed by
1. For particles larger than 1-µm diameter:
λp = = (17-30)
2. For particles smaller than 1-µm diameter:
λp = = (17-31)
For single-stage precipitators, i and p may be considered as essen-tially equal. It is apparent from Eq. (17-31) that the mobility in anelectric field will be almost the same for all particles smaller than
360KmεT
µue
p
ζDpiKm
12πµue
p
πσεtλi1 + πσελi t
ζDp2
4ε
100.0kρ(δg− 1)M
4(E − Ec)πDt
2ε
17-56 GAS-SOLID OPERATIONS AND EQUIPMENT
TABLE 17-13 Sparking Potentials* (Small Wire Concentric in Pipe)
Sparking potential,† volts
Pipe diameter, in Peak Root mean square
4 59,000 45,0006 76,000 58,0009 90,000 69,000
12 100,000 77,000
*Data reported by Anderson in Perry, Chemical Engineers’ Handbook, 2d ed.,p. 1873, McGraw-Hill, New York, 1941.
†For gases at atmospheric pressure, 100°F, containing water vapor, air, CO2,and mist, and negative-discharge-electrode polarity.
FIG. 17-65 Sparking potential for negative point-to-plane a-in (1.3-cm) gapas a function of moisture content and temperature of air at 1-atm (101.3-kPa)pressure. [Sproull and Nakada, Ind. Eng. Chem., 43, 1356 (1951).]
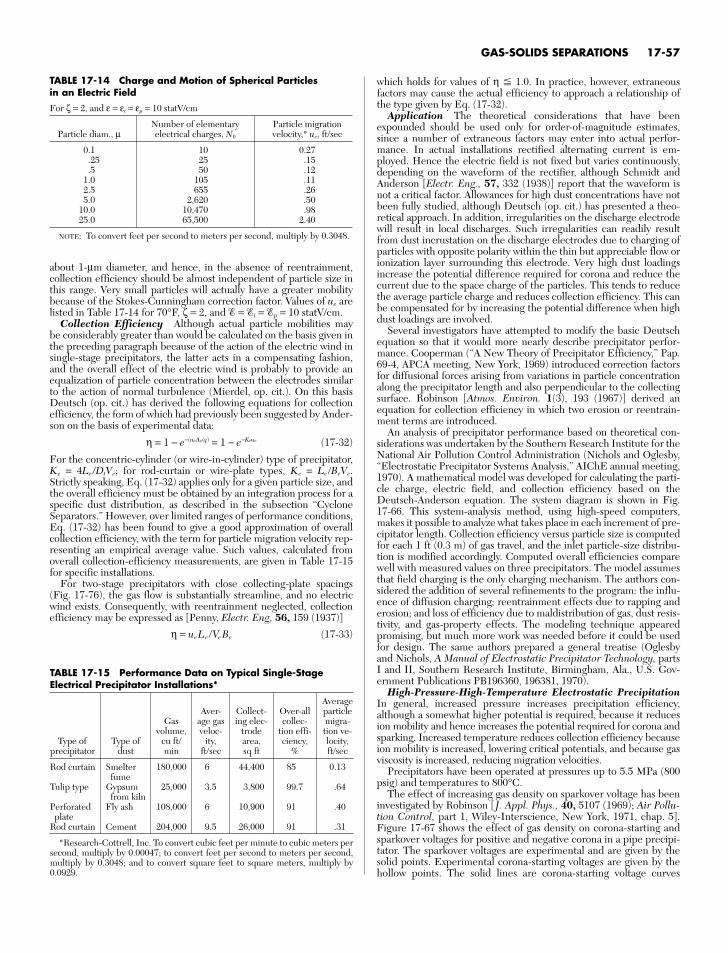
about 1-µm diameter, and hence, in the absence of reentrainment,collection efficiency should be almost independent of particle size inthis range. Very small particles will actually have a greater mobilitybecause of the Stokes-Cunningham correction factor. Values of ue arelisted in Table 17-14 for 70°F, ζ = 2, and = i = p = 10 statV/cm.
Collection Efficiency Although actual particle mobilities maybe considerably greater than would be calculated on the basis given inthe preceding paragraph because of the action of the electric wind insingle-stage precipitators, the latter acts in a compensating fashion,and the overall effect of the electric wind is probably to provide anequalization of particle concentration between the electrodes similarto the action of normal turbulence (Mierdel, op. cit.). On this basisDeutsch (op. cit.) has derived the following equations for collectionefficiency, the form of which had previously been suggested by Ander-son on the basis of experimental data:
η = 1 − e−(ueAe/q) = 1 − e−Keue (17-32)
For the concentric-cylinder (or wire-in-cylinder) type of precipitator,Ke = 4Le /DtVe; for rod-curtain or wire-plate types, K e = Le /BeVe.Strictly speaking, Eq. (17-32) applies only for a given particle size, andthe overall efficiency must be obtained by an integration process for aspecific dust distribution, as described in the subsection “CycloneSeparators.” However, over limited ranges of performance conditions,Eq. (17-32) has been found to give a good approximation of overallcollection efficiency, with the term for particle migration velocity rep-resenting an empirical average value. Such values, calculated fromoverall collection-efficiency measurements, are given in Table 17-15for specific installations.
For two-stage precipitators with close collecting-plate spacings(Fig. 17-76), the gas flow is substantially streamline, and no electricwind exists. Consequently, with reentrainment neglected, collectionefficiency may be expressed as [Penny, Electr. Eng, 56, 159 (1937)]
η = ueLe /VeBe (17-33)
which holds for values of η $ 1.0. In practice, however, extraneousfactors may cause the actual efficiency to approach a relationship ofthe type given by Eq. (17-32).
Application The theoretical considerations that have beenexpounded should be used only for order-of-magnitude estimates,since a number of extraneous factors may enter into actual perfor-mance. In actual installations rectified alternating current is em-ployed. Hence the electric field is not fixed but varies continuously,depending on the waveform of the rectifier, although Schmidt andAnderson [Electr. Eng., 57, 332 (1938)] report that the waveform isnot a critical factor. Allowances for high dust concentrations have notbeen fully studied, although Deutsch (op. cit.) has presented a theo-retical approach. In addition, irregularities on the discharge electrodewill result in local discharges. Such irregularities can readily resultfrom dust incrustation on the discharge electrodes due to charging ofparticles with opposite polarity within the thin but appreciable flow orionization layer surrounding this electrode. Very high dust loadingsincrease the potential difference required for corona and reduce thecurrent due to the space charge of the particles. This tends to reducethe average particle charge and reduces collection efficiency. This canbe compensated for by increasing the potential difference when highdust loadings are involved.
Several investigators have attempted to modify the basic Deutschequation so that it would more nearly describe precipitator perfor-mance. Cooperman (“A New Theory of Precipitator Efficiency,” Pap.69-4, APCA meeting, New York, 1969) introduced correction factorsfor diffusional forces arising from variations in particle concentrationalong the precipitator length and also perpendicular to the collectingsurface. Robinson [Atmos. Environ. 1(3), 193 (1967)] derived anequation for collection efficiency in which two erosion or reentrain-ment terms are introduced.
An analysis of precipitator performance based on theoretical con-siderations was undertaken by the Southern Research Institute for theNational Air Pollution Control Administration (Nichols and Oglesby,“Electrostatic Precipitator Systems Analysis,” AIChE annual meeting,1970). A mathematical model was developed for calculating the parti-cle charge, electric field, and collection efficiency based on theDeutsch-Anderson equation. The system diagram is shown in Fig. 17-66. This system-analysis method, using high-speed computers,makes it possible to analyze what takes place in each increment of pre-cipitator length. Collection efficiency versus particle size is computedfor each 1 ft (0.3 m) of gas travel, and the inlet particle-size distribu-tion is modified accordingly. Computed overall efficiencies comparewell with measured values on three precipitators. The model assumesthat field charging is the only charging mechanism. The authors con-sidered the addition of several refinements to the program: the influ-ence of diffusion charging; reentrainment effects due to rapping anderosion; and loss of efficiency due to maldistribution of gas, dust resis-tivity, and gas-property effects. The modeling technique appearedpromising, but much more work was needed before it could be usedfor design. The same authors prepared a general treatise (Oglesby and Nichols, A Manual of Electrostatic Precipitator Technology, partsI and II, Southern Research Institute, Birmingham, Ala., U.S. Gov-ernment Publications PB196360, 196381, 1970).
High-Pressure-High-Temperature Electrostatic PrecipitationIn general, increased pressure increases precipitation efficiency,although a somewhat higher potential is required, because it reducesion mobility and hence increases the potential required for corona andsparking. Increased temperature reduces collection efficiency becauseion mobility is increased, lowering critical potentials, and because gasviscosity is increased, reducing migration velocities.
Precipitators have been operated at pressures up to 5.5 MPa (800psig) and temperatures to 800°C.
The effect of increasing gas density on sparkover voltage has beeninvestigated by Robinson [J. Appl. Phys., 40, 5107 (1969); Air Pollu-tion Control, part 1, Wiley-Interscience, New York, 1971, chap. 5].Figure 17-67 shows the effect of gas density on corona-starting andsparkover voltages for positive and negative corona in a pipe precipi-tator. The sparkover voltages are experimental and are given by thesolid points. Experimental corona-starting voltages are given by thehollow points. The solid lines are corona-starting voltage curves
GAS-SOLIDS SEPARATIONS 17-57
TABLE 17-14 Charge and Motion of Spherical Particles in an Electric Field
For ζ = 2, and ε = εi = εp = 10 statV/cm
Number of elementary Particle migrationParticle diam., µ electrical charges, N0 velocity,* ue, ft/sec
0.1 10 0.27.25 25 .15.5 50 .12
1.0 105 .112.5 655 .265.0 2,620 .50
10.0 10,470 .9825.0 65,500 2.40
NOTE: To convert feet per second to meters per second, multiply by 0.3048.
TABLE 17-15 Performance Data on Typical Single-StageElectrical Precipitator Installations*
AverageAver- Collect- Over-all particle
Gas age gas ing elec- collec- migra-volume, veloc- trode tion effi- tion ve-
Type of Type of cu ft/ ity, area, ciency, locity,precipitator dust min ft/sec sq ft % ft/sec
Rod curtain Smelter 180,000 6 44,400 85 0.13fume
Tulip type Gypsum 25,000 3.5 3,800 99.7 .64from kiln
Perforated Fly ash 108,000 6 10,900 91 .40plate
Rod curtain Cement 204,000 9.5 26,000 91 .31
*Research-Cottrell, Inc. To convert cubic feet per minute to cubic meters persecond, multiply by 0.00047; to convert feet per second to meters per second,multiply by 0.3048; and to convert square feet to square meters, multiply by0.0929.
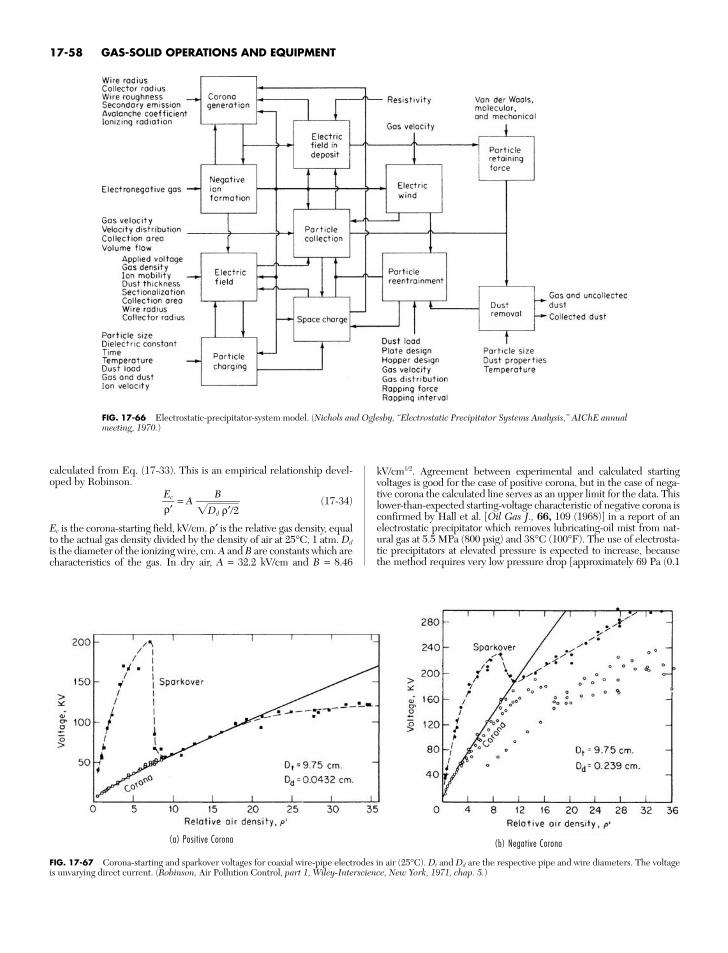
calculated from Eq. (17-33). This is an empirical relationship devel-oped by Robinson.
= A (17-34)
Ec is the corona-starting field, kV/cm. ρ′ is the relative gas density, equalto the actual gas density divided by the density of air at 25°C, 1 atm. Dd
is the diameter of the ionizing wire, cm. A and B are constants which arecharacteristics of the gas. In dry air, A = 32.2 kV/cm and B = 8.46
BDdρ′/2
Ecρ′
kV/cm1/2. Agreement between experimental and calculated startingvoltages is good for the case of positive corona, but in the case of nega-tive corona the calculated line serves as an upper limit for the data. Thislower-than-expected starting-voltage characteristic of negative corona isconfirmed by Hall et al. [Oil Gas J., 66, 109 (1968)] in a report of anelectrostatic precipitator which removes lubricating-oil mist from nat-ural gas at 5.5 MPa (800 psig) and 38°C (100°F). The use of electrosta-tic precipitators at elevated pressure is expected to increase, becausethe method requires very low pressure drop [approximately 69 Pa (0.1
17-58 GAS-SOLID OPERATIONS AND EQUIPMENT
FIG. 17-66 Electrostatic-precipitator-system model. (Nichols and Oglesby, “Electrostatic Precipitator Systems Analysis,” AIChE annualmeeting, 1970.)
FIG. 17-67 Corona-starting and sparkover voltages for coaxial wire-pipe electrodes in air (25°C). Dt and Dd are the respective pipe and wire diameters. The voltageis unvarying direct current. (Robinson, Air Pollution Control, part 1, Wiley-Interscience, New York, 1971, chap. 5.)
(a) Positive Corona (b) Negative Corona
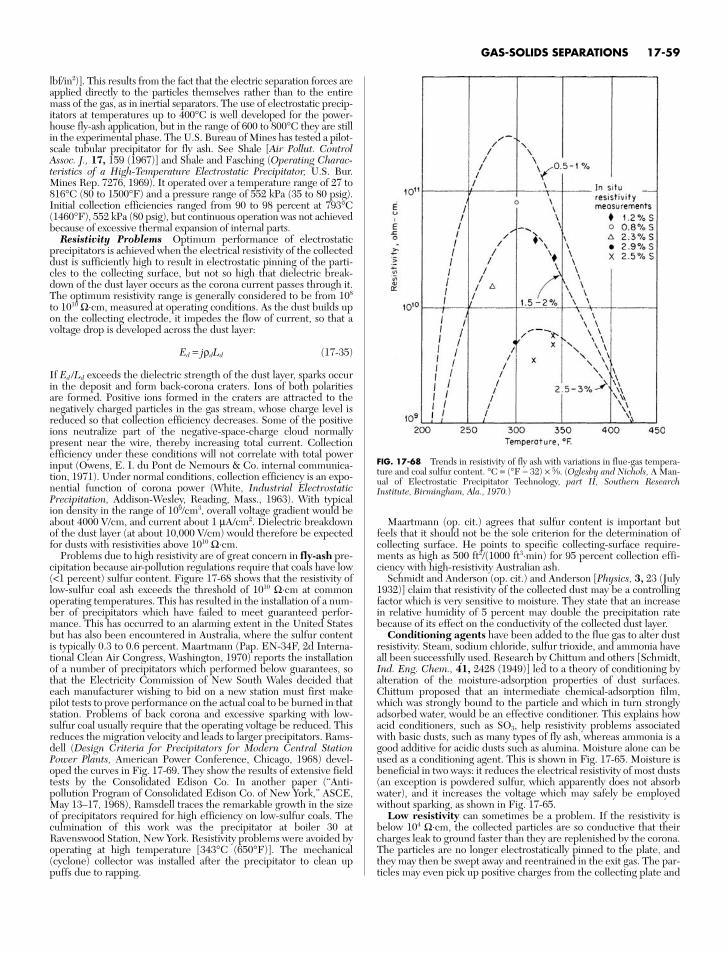
lbf/in2)]. This results from the fact that the electric separation forces areapplied directly to the particles themselves rather than to the entiremass of the gas, as in inertial separators. The use of electrostatic precip-itators at temperatures up to 400°C is well developed for the power-house fly-ash application, but in the range of 600 to 800°C they are stillin the experimental phase. The U.S. Bureau of Mines has tested a pilot-scale tubular precipitator for fly ash. See Shale [Air Pollut. ControlAssoc. J., 17, 159 (1967)] and Shale and Fasching (Operating Charac-teristics of a High-Temperature Electrostatic Precipitator, U.S. Bur.Mines Rep. 7276, 1969). It operated over a temperature range of 27 to816°C (80 to 1500°F) and a pressure range of 552 kPa (35 to 80 psig).Initial collection efficiencies ranged from 90 to 98 percent at 793°C(1460°F), 552 kPa (80 psig), but continuous operation was not achievedbecause of excessive thermal expansion of internal parts.
Resistivity Problems Optimum performance of electrostaticprecipitators is achieved when the electrical resistivity of the collecteddust is sufficiently high to result in electrostatic pinning of the parti-cles to the collecting surface, but not so high that dielectric break-down of the dust layer occurs as the corona current passes through it.The optimum resistivity range is generally considered to be from 108
to 1010 Ω⋅cm, measured at operating conditions. As the dust builds upon the collecting electrode, it impedes the flow of current, so that avoltage drop is developed across the dust layer:
Ed = jρdLd (17-35)
If Ed /Ld exceeds the dielectric strength of the dust layer, sparks occurin the deposit and form back-corona craters. Ions of both polaritiesare formed. Positive ions formed in the craters are attracted to thenegatively charged particles in the gas stream, whose charge level isreduced so that collection efficiency decreases. Some of the positiveions neutralize part of the negative-space-charge cloud normallypresent near the wire, thereby increasing total current. Collectionefficiency under these conditions will not correlate with total powerinput (Owens, E. I. du Pont de Nemours & Co. internal communica-tion, 1971). Under normal conditions, collection efficiency is an expo-nential function of corona power (White, Industrial ElectrostaticPrecipitation, Addison-Wesley, Reading, Mass., 1963). With typicalion density in the range of 109/cm3, overall voltage gradient would beabout 4000 V/cm, and current about 1 µA/cm2. Dielectric breakdownof the dust layer (at about 10,000 V/cm) would therefore be expectedfor dusts with resistivities above 1010 Ω⋅cm.
Problems due to high resistivity are of great concern in fly-ash pre-cipitation because air-pollution regulations require that coals have low(<1 percent) sulfur content. Figure 17-68 shows that the resistivity oflow-sulfur coal ash exceeds the threshold of 1010 Ω⋅cm at commonoperating temperatures. This has resulted in the installation of a num-ber of precipitators which have failed to meet guaranteed perfor-mance. This has occurred to an alarming extent in the United Statesbut has also been encountered in Australia, where the sulfur contentis typically 0.3 to 0.6 percent. Maartmann (Pap. EN-34F, 2d Interna-tional Clean Air Congress, Washington, 1970) reports the installationof a number of precipitators which performed below guarantees, sothat the Electricity Commission of New South Wales decided thateach manufacturer wishing to bid on a new station must first makepilot tests to prove performance on the actual coal to be burned in thatstation. Problems of back corona and excessive sparking with low-sulfur coal usually require that the operating voltage be reduced. Thisreduces the migration velocity and leads to larger precipitators. Rams-dell (Design Criteria for Precipitators for Modern Central StationPower Plants, American Power Conference, Chicago, 1968) devel-oped the curves in Fig. 17-69. They show the results of extensive fieldtests by the Consolidated Edison Co. In another paper (“Anti-pollution Program of Consolidated Edison Co. of New York,” ASCE,May 13–17, 1968), Ramsdell traces the remarkable growth in the sizeof precipitators required for high efficiency on low-sulfur coals. Theculmination of this work was the precipitator at boiler 30 atRavenswood Station, New York. Resistivity problems were avoided byoperating at high temperature [343°C (650°F)]. The mechanical(cyclone) collector was installed after the precipitator to clean uppuffs due to rapping.
Maartmann (op. cit.) agrees that sulfur content is important butfeels that it should not be the sole criterion for the determination ofcollecting surface. He points to specific collecting-surface require-ments as high as 500 ft2/(1000 ft3⋅min) for 95 percent collection effi-ciency with high-resistivity Australian ash.
Schmidt and Anderson (op. cit.) and Anderson [Physics, 3, 23 (July1932)] claim that resistivity of the collected dust may be a controllingfactor which is very sensitive to moisture. They state that an increasein relative humidity of 5 percent may double the precipitation ratebecause of its effect on the conductivity of the collected dust layer.
Conditioning agents have been added to the flue gas to alter dustresistivity. Steam, sodium chloride, sulfur trioxide, and ammonia haveall been successfully used. Research by Chittum and others [Schmidt,Ind. Eng. Chem., 41, 2428 (1949)] led to a theory of conditioning byalteration of the moisture-adsorption properties of dust surfaces.Chittum proposed that an intermediate chemical-adsorption film,which was strongly bound to the particle and which in turn stronglyadsorbed water, would be an effective conditioner. This explains howacid conditioners, such as SO3, help resistivity problems associatedwith basic dusts, such as many types of fly ash, whereas ammonia is agood additive for acidic dusts such as alumina. Moisture alone can beused as a conditioning agent. This is shown in Fig. 17-65. Moisture isbeneficial in two ways: it reduces the electrical resistivity of most dusts(an exception is powdered sulfur, which apparently does not absorbwater), and it increases the voltage which may safely be employedwithout sparking, as shown in Fig. 17-65.
Low resistivity can sometimes be a problem. If the resistivity isbelow 104 Ω⋅cm, the collected particles are so conductive that theircharges leak to ground faster than they are replenished by the corona.The particles are no longer electrostatically pinned to the plate, andthey may then be swept away and reentrained in the exit gas. The par-ticles may even pick up positive charges from the collecting plate and
GAS-SOLIDS SEPARATIONS 17-59
FIG. 17-68 Trends in resistivity of fly ash with variations in flue-gas tempera-ture and coal sulfur content. °C = (°F − 32) × 5⁄9. (Oglesby and Nichols, A Man-ual of Electrostatic Precipitator Technology, part II, Southern ResearchInstitute, Birmingham, Ala., 1970.)
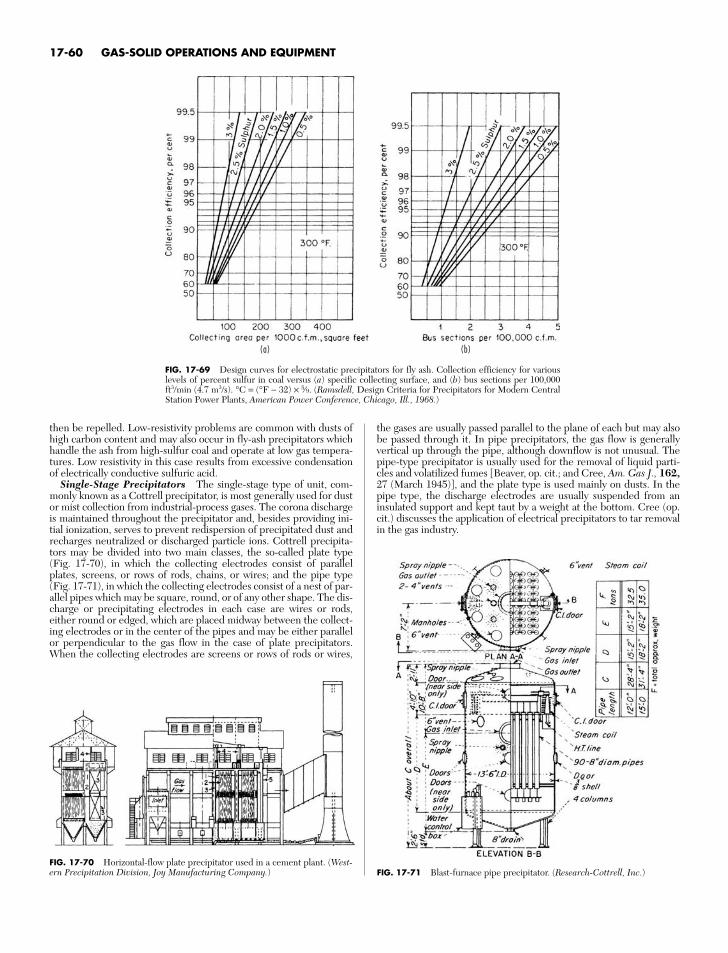
then be repelled. Low-resistivity problems are common with dusts ofhigh carbon content and may also occur in fly-ash precipitators whichhandle the ash from high-sulfur coal and operate at low gas tempera-tures. Low resistivity in this case results from excessive condensationof electrically conductive sulfuric acid.
Single-Stage Precipitators The single-stage type of unit, com-monly known as a Cottrell precipitator, is most generally used for dustor mist collection from industrial-process gases. The corona dischargeis maintained throughout the precipitator and, besides providing ini-tial ionization, serves to prevent redispersion of precipitated dust andrecharges neutralized or discharged particle ions. Cottrell precipita-tors may be divided into two main classes, the so-called plate type(Fig. 17-70), in which the collecting electrodes consist of parallelplates, screens, or rows of rods, chains, or wires; and the pipe type(Fig. 17-71), in which the collecting electrodes consist of a nest of par-allel pipes which may be square, round, or of any other shape. The dis-charge or precipitating electrodes in each case are wires or rods,either round or edged, which are placed midway between the collect-ing electrodes or in the center of the pipes and may be either parallelor perpendicular to the gas flow in the case of plate precipitators.When the collecting electrodes are screens or rows of rods or wires,
the gases are usually passed parallel to the plane of each but may alsobe passed through it. In pipe precipitators, the gas flow is generallyvertical up through the pipe, although downflow is not unusual. Thepipe-type precipitator is usually used for the removal of liquid parti-cles and volatilized fumes [Beaver, op. cit.; and Cree, Am. Gas J., 162,27 (March 1945)], and the plate type is used mainly on dusts. In thepipe type, the discharge electrodes are usually suspended from aninsulated support and kept taut by a weight at the bottom. Cree (op.cit.) discusses the application of electrical precipitators to tar removalin the gas industry.
17-60 GAS-SOLID OPERATIONS AND EQUIPMENT
FIG. 17-69 Design curves for electrostatic precipitators for fly ash. Collection efficiency for variouslevels of percent sulfur in coal versus (a) specific collecting surface, and (b) bus sections per 100,000ft3/min (4.7 m3/s). °C = (°F − 32) × 5⁄9. (Ramsdell, Design Criteria for Precipitators for Modern CentralStation Power Plants, American Power Conference, Chicago, Ill., 1968.)
FIG. 17-70 Horizontal-flow plate precipitator used in a cement plant. (West-ern Precipitation Division, Joy Manufacturing Company.) FIG. 17-71 Blast-furnace pipe precipitator. (Research-Cottrell, Inc.)
(a) (b)
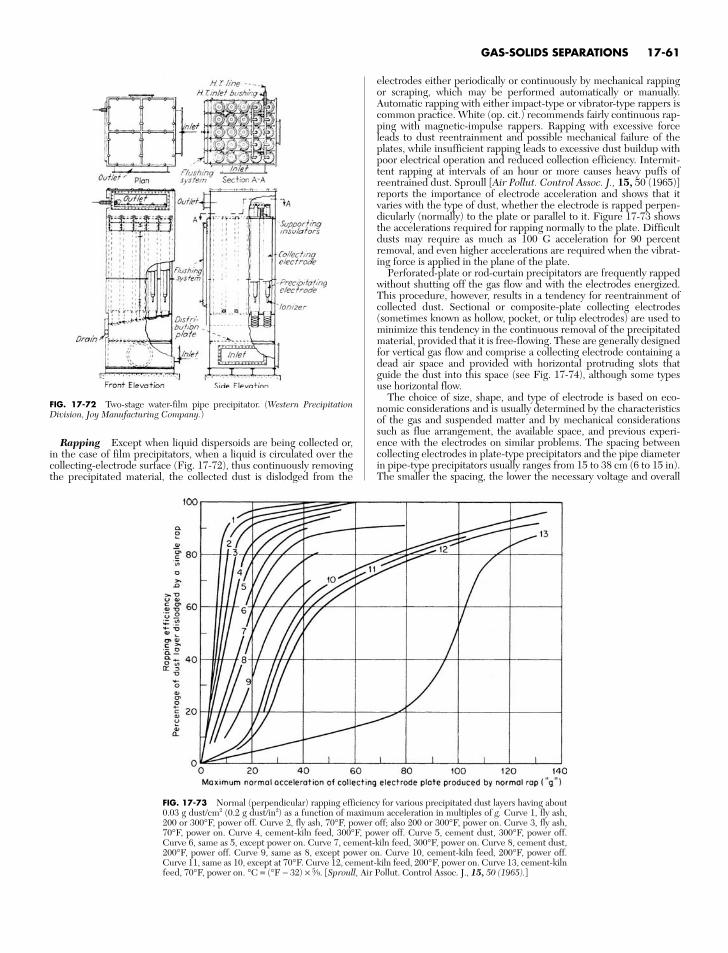
Rapping Except when liquid dispersoids are being collected or,in the case of film precipitators, when a liquid is circulated over thecollecting-electrode surface (Fig. 17-72), thus continuously removingthe precipitated material, the collected dust is dislodged from the
electrodes either periodically or continuously by mechanical rappingor scraping, which may be performed automatically or manually.Automatic rapping with either impact-type or vibrator-type rappers iscommon practice. White (op. cit.) recommends fairly continuous rap-ping with magnetic-impulse rappers. Rapping with excessive forceleads to dust reentrainment and possible mechanical failure of theplates, while insufficient rapping leads to excessive dust buildup withpoor electrical operation and reduced collection efficiency. Intermit-tent rapping at intervals of an hour or more causes heavy puffs ofreentrained dust. Sproull [Air Pollut. Control Assoc. J., 15, 50 (1965)]reports the importance of electrode acceleration and shows that itvaries with the type of dust, whether the electrode is rapped perpen-dicularly (normally) to the plate or parallel to it. Figure 17-73 showsthe accelerations required for rapping normally to the plate. Difficultdusts may require as much as 100 G acceleration for 90 percentremoval, and even higher accelerations are required when the vibrat-ing force is applied in the plane of the plate.
Perforated-plate or rod-curtain precipitators are frequently rappedwithout shutting off the gas flow and with the electrodes energized.This procedure, however, results in a tendency for reentrainment ofcollected dust. Sectional or composite-plate collecting electrodes(sometimes known as hollow, pocket, or tulip electrodes) are used tominimize this tendency in the continuous removal of the precipitatedmaterial, provided that it is free-flowing. These are generally designedfor vertical gas flow and comprise a collecting electrode containing adead air space and provided with horizontal protruding slots thatguide the dust into this space (see Fig. 17-74), although some typesuse horizontal flow.
The choice of size, shape, and type of electrode is based on eco-nomic considerations and is usually determined by the characteristicsof the gas and suspended matter and by mechanical considerationssuch as flue arrangement, the available space, and previous experi-ence with the electrodes on similar problems. The spacing betweencollecting electrodes in plate-type precipitators and the pipe diameterin pipe-type precipitators usually ranges from 15 to 38 cm (6 to 15 in).The smaller the spacing, the lower the necessary voltage and overall
GAS-SOLIDS SEPARATIONS 17-61
FIG. 17-72 Two-stage water-film pipe precipitator. (Western PrecipitationDivision, Joy Manufacturing Company.)
FIG. 17-73 Normal (perpendicular) rapping efficiency for various precipitated dust layers having about0.03 g dust/cm2 (0.2 g dust/in2) as a function of maximum acceleration in multiples of g. Curve 1, fly ash,200 or 300°F, power off. Curve 2, fly ash, 70°F, power off; also 200 or 300°F, power on. Curve 3, fly ash,70°F, power on. Curve 4, cement-kiln feed, 300°F, power off. Curve 5, cement dust, 300°F, power off.Curve 6, same as 5, except power on. Curve 7, cement-kiln feed, 300°F, power on. Curve 8, cement dust,200°F, power off. Curve 9, same as 8, except power on. Curve 10, cement-kiln feed, 200°F, power off.Curve 11, same as 10, except at 70°F. Curve 12, cement-kiln feed, 200°F, power on. Curve 13, cement-kilnfeed, 70°F, power on. °C = (°F − 32) × 5⁄9. [Sproull, Air Pollut. Control Assoc. J., 15, 50 (1965).]
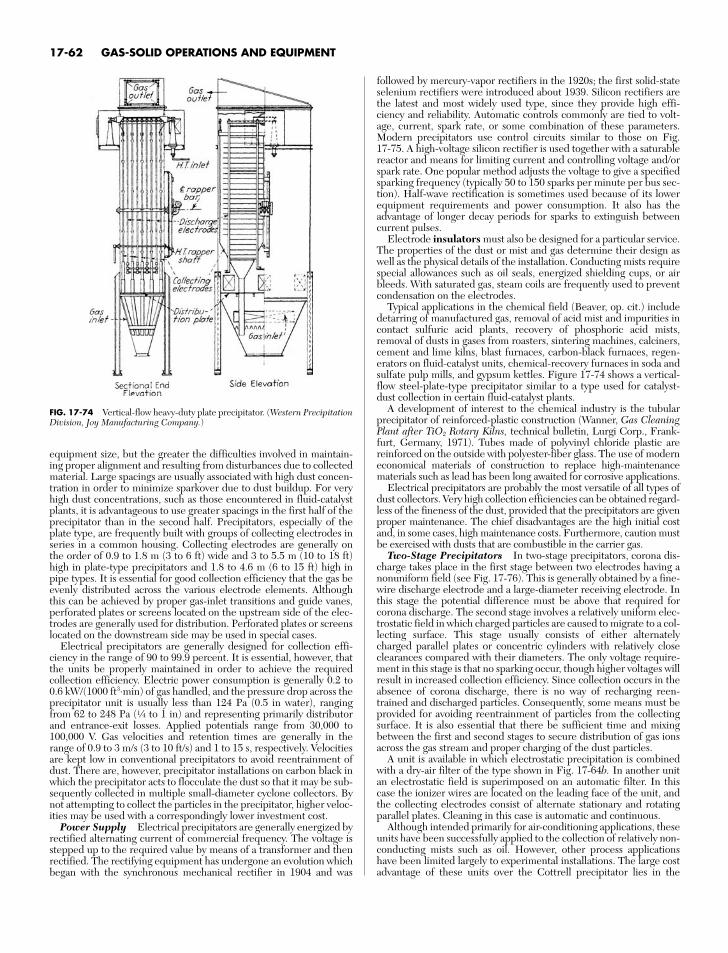
equipment size, but the greater the difficulties involved in maintain-ing proper alignment and resulting from disturbances due to collectedmaterial. Large spacings are usually associated with high dust concen-tration in order to minimize sparkover due to dust buildup. For veryhigh dust concentrations, such as those encountered in fluid-catalystplants, it is advantageous to use greater spacings in the first half of theprecipitator than in the second half. Precipitators, especially of theplate type, are frequently built with groups of collecting electrodes inseries in a common housing. Collecting electrodes are generally onthe order of 0.9 to 1.8 m (3 to 6 ft) wide and 3 to 5.5 m (10 to 18 ft)high in plate-type precipitators and 1.8 to 4.6 m (6 to 15 ft) high inpipe types. It is essential for good collection efficiency that the gas beevenly distributed across the various electrode elements. Althoughthis can be achieved by proper gas-inlet transitions and guide vanes,perforated plates or screens located on the upstream side of the elec-trodes are generally used for distribution. Perforated plates or screenslocated on the downstream side may be used in special cases.
Electrical precipitators are generally designed for collection effi-ciency in the range of 90 to 99.9 percent. It is essential, however, thatthe units be properly maintained in order to achieve the required collection efficiency. Electric power consumption is generally 0.2 to0.6 kW/(1000 ft3⋅min) of gas handled, and the pressure drop across theprecipitator unit is usually less than 124 Pa (0.5 in water), rangingfrom 62 to 248 Pa (d to 1 in) and representing primarily distributorand entrance-exit losses. Applied potentials range from 30,000 to100,000 V. Gas velocities and retention times are generally in therange of 0.9 to 3 m/s (3 to 10 ft/s) and 1 to 15 s, respectively. Velocitiesare kept low in conventional precipitators to avoid reentrainment ofdust. There are, however, precipitator installations on carbon black inwhich the precipitator acts to flocculate the dust so that it may be sub-sequently collected in multiple small-diameter cyclone collectors. Bynot attempting to collect the particles in the precipitator, higher veloc-ities may be used with a correspondingly lower investment cost.
Power Supply Electrical precipitators are generally energized byrectified alternating current of commercial frequency. The voltage isstepped up to the required value by means of a transformer and thenrectified. The rectifying equipment has undergone an evolution whichbegan with the synchronous mechanical rectifier in 1904 and was
followed by mercury-vapor rectifiers in the 1920s; the first solid-stateselenium rectifiers were introduced about 1939. Silicon rectifiers arethe latest and most widely used type, since they provide high effi-ciency and reliability. Automatic controls commonly are tied to volt-age, current, spark rate, or some combination of these parameters.Modern precipitators use control circuits similar to those on Fig. 17-75. A high-voltage silicon rectifier is used together with a saturablereactor and means for limiting current and controlling voltage and/orspark rate. One popular method adjusts the voltage to give a specifiedsparking frequency (typically 50 to 150 sparks per minute per bus sec-tion). Half-wave rectification is sometimes used because of its lowerequipment requirements and power consumption. It also has theadvantage of longer decay periods for sparks to extinguish betweencurrent pulses.
Electrode insulators must also be designed for a particular service.The properties of the dust or mist and gas determine their design aswell as the physical details of the installation. Conducting mists requirespecial allowances such as oil seals, energized shielding cups, or airbleeds. With saturated gas, steam coils are frequently used to preventcondensation on the electrodes.
Typical applications in the chemical field (Beaver, op. cit.) includedetarring of manufactured gas, removal of acid mist and impurities incontact sulfuric acid plants, recovery of phosphoric acid mists,removal of dusts in gases from roasters, sintering machines, calciners,cement and lime kilns, blast furnaces, carbon-black furnaces, regen-erators on fluid-catalyst units, chemical-recovery furnaces in soda andsulfate pulp mills, and gypsum kettles. Figure 17-74 shows a vertical-flow steel-plate-type precipitator similar to a type used for catalyst-dust collection in certain fluid-catalyst plants.
A development of interest to the chemical industry is the tubularprecipitator of reinforced-plastic construction (Wanner, Gas CleaningPlant after TiO2 Rotary Kilns, technical bulletin, Lurgi Corp., Frank-furt, Germany, 1971). Tubes made of polyvinyl chloride plastic arereinforced on the outside with polyester-fiber glass. The use of moderneconomical materials of construction to replace high-maintenancematerials such as lead has been long awaited for corrosive applications.
Electrical precipitators are probably the most versatile of all types ofdust collectors. Very high collection efficiencies can be obtained regard-less of the fineness of the dust, provided that the precipitators are givenproper maintenance. The chief disadvantages are the high initial costand, in some cases, high maintenance costs. Furthermore, caution mustbe exercised with dusts that are combustible in the carrier gas.
Two-Stage Precipitators In two-stage precipitators, corona dis-charge takes place in the first stage between two electrodes having anonuniform field (see Fig. 17-76). This is generally obtained by a fine-wire discharge electrode and a large-diameter receiving electrode. Inthis stage the potential difference must be above that required forcorona discharge. The second stage involves a relatively uniform elec-trostatic field in which charged particles are caused to migrate to a col-lecting surface. This stage usually consists of either alternatelycharged parallel plates or concentric cylinders with relatively closeclearances compared with their diameters. The only voltage require-ment in this stage is that no sparking occur, though higher voltages willresult in increased collection efficiency. Since collection occurs in theabsence of corona discharge, there is no way of recharging reen-trained and discharged particles. Consequently, some means must beprovided for avoiding reentrainment of particles from the collectingsurface. It is also essential that there be sufficient time and mixingbetween the first and second stages to secure distribution of gas ionsacross the gas stream and proper charging of the dust particles.
A unit is available in which electrostatic precipitation is combinedwith a dry-air filter of the type shown in Fig. 17-64b. In another unitan electrostatic field is superimposed on an automatic filter. In thiscase the ionizer wires are located on the leading face of the unit, andthe collecting electrodes consist of alternate stationary and rotatingparallel plates. Cleaning in this case is automatic and continuous.
Although intended primarily for air-conditioning applications, theseunits have been successfully applied to the collection of relatively non-conducting mists such as oil. However, other process applicationshave been limited largely to experimental installations. The large costadvantage of these units over the Cottrell precipitator lies in the
17-62 GAS-SOLID OPERATIONS AND EQUIPMENT
FIG. 17-74 Vertical-flow heavy-duty plate precipitator. (Western PrecipitationDivision, Joy Manufacturing Company.)
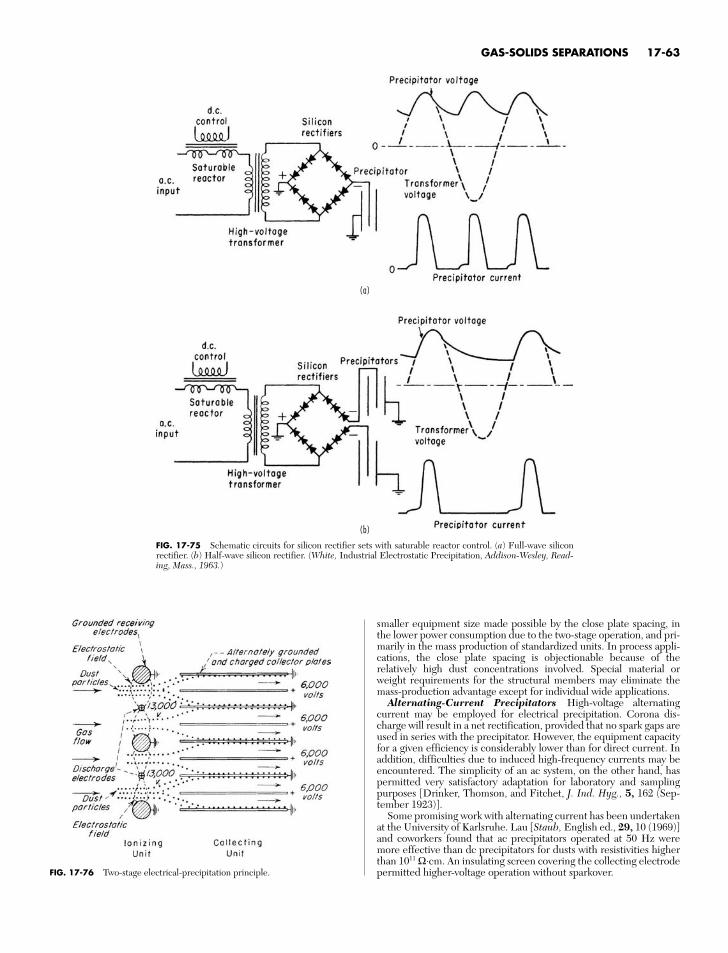
smaller equipment size made possible by the close plate spacing, inthe lower power consumption due to the two-stage operation, and pri-marily in the mass production of standardized units. In process appli-cations, the close plate spacing is objectionable because of therelatively high dust concentrations involved. Special material orweight requirements for the structural members may eliminate themass-production advantage except for individual wide applications.
Alternating-Current Precipitators High-voltage alternatingcurrent may be employed for electrical precipitation. Corona dis-charge will result in a net rectification, provided that no spark gaps areused in series with the precipitator. However, the equipment capacityfor a given efficiency is considerably lower than for direct current. Inaddition, difficulties due to induced high-frequency currents may beencountered. The simplicity of an ac system, on the other hand, haspermitted very satisfactory adaptation for laboratory and samplingpurposes [Drinker, Thomson, and Fitchet, J. Ind. Hyg., 5, 162 (Sep-tember 1923)].
Some promising work with alternating current has been undertakenat the University of Karlsruhe. Lau [Staub, English ed., 29, 10 (1969)]and coworkers found that ac precipitators operated at 50 Hz weremore effective than dc precipitators for dusts with resistivities higherthan 1011 Ω⋅cm. An insulating screen covering the collecting electrodepermitted higher-voltage operation without sparkover.
GAS-SOLIDS SEPARATIONS 17-63
FIG. 17-75 Schematic circuits for silicon rectifier sets with saturable reactor control. (a) Full-wave siliconrectifier. (b) Half-wave silicon rectifier. (White, Industrial Electrostatic Precipitation, Addison-Wesley, Read-ing, Mass., 1963.)
FIG. 17-76 Two-stage electrical-precipitation principle.
(b)
(a)

This page intentionally left blank