Embed Size (px)
Citation preview

32THE MALE GENITILIA
AND URETHRA
DAVID SUTTON

DAVID SUTTON PICTURES
DR. Muhammad Bin Zulfiqar PGR-FCPS III SIMS/SHL

• Fig. 32.1 Urethrogram demonstrating short post inflammatory stricture at the junction of the bulbar and penile urethra.

• Fig. 32.2 Descending urethrogram in a male. The entire length of the urethra is demonstrated as the bladder empties. The prostatic urethra is a little distended in this example due to a short stricture at the junction of the membranous urethra and the bulbar urethra following a traumatic urethroscopy.

• Fig. 32.3 Multiple short tight anterior urethral strictures following attempted self-catheterisation with a knitting needle and resultant gross urethritis.

• Fig. 32.4 Micturating cystogram following extensive posterior urethral trauma showing gross urethral disruption at the level of the urogenital diaphragm and florid extravasation into the perineum.

• Fig. 32.5 Ascending urethrogram following a classical straddle injury showing marked extravasation of contrast from a partial anterior urethral tear.

• Fig. 32.6 Transverse post-gadolinium TI -weighted image showing invasion of the penile bulb and muscles of the right side of the pelvic floor by urethral carcinoma.

• Fig. 32.7 (A) Postmicturition film from an IVU series showing a urethral calculus and gross detrusor hypertrophy due to secondary bladder outflow obstruction. (B) Urethrogram (different patient) showing a filling defect due to a urethral calculus within the prostatic urethra.

• Fig. 32.8 Cystourethrogram showing a substantial sinus from the posterior aspect of the urethra following rectal surgery.

• Fig. 32.9 Coronal T2 -weighted MR image showing a sinus from the base of the penile urethra down into the scrotum.

• Fig. 32.10 Sagittal T,-weighted (A) and T.-weighted (B) MR images in a patient with Nunan's syndrome showing male external genitalia and a uterus .
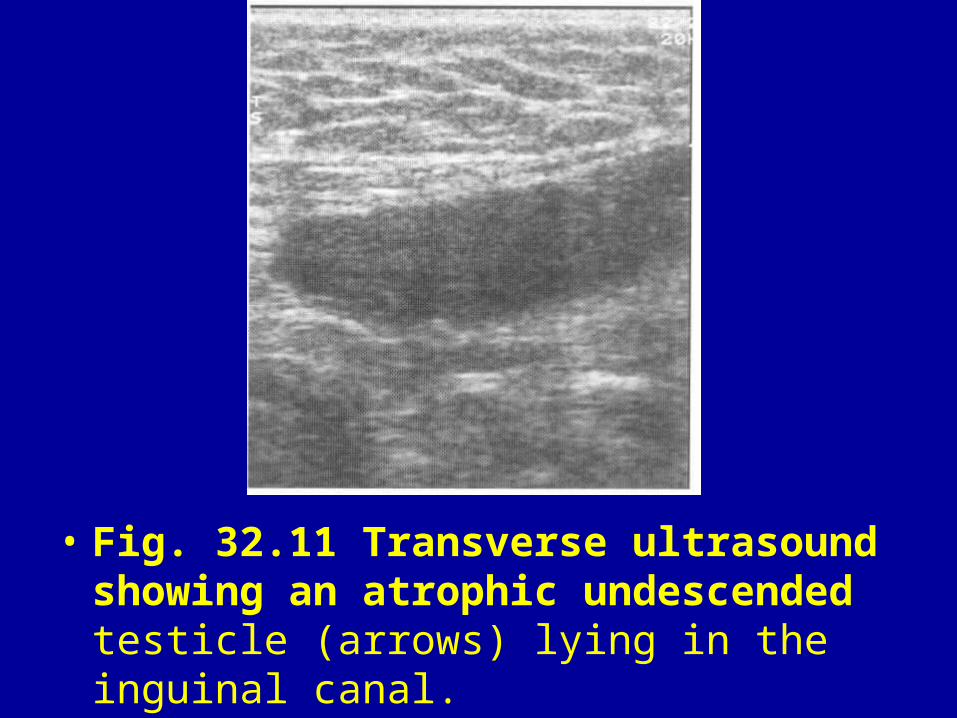
• Fig. 32.11 Transverse ultrasound showing an atrophic undescended testicle (arrows) lying in the inguinal canal.

• Fig. 32.12 Transverse STIR images from MRI examinations of patients with undescended testicles (arrow) in the proximal end of the inguinal canal (A), suprapubic pouch (B) and pelvis (C).
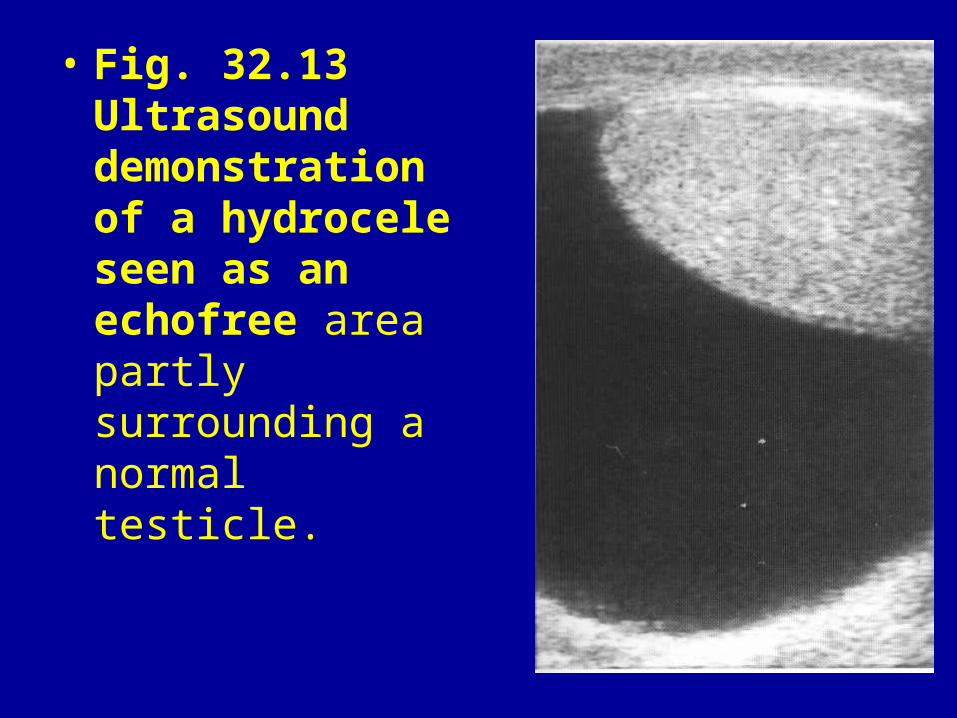
• Fig. 32.13 Ultrasound demonstration of a hydrocele seen as an echofree area partly surrounding a normal testicle.

• Fig. 32.14 Ultrasound showing an infected, partly septated echogenic hydrocele.

• Fig. 32.15 Ultrasound (A) showing dense peripheral calcification around the exterior of a chronic inflammatory hydrocele. This is also visible on the plain film (B).

• Fig. 32.16 Ultrasound showing (A) a classical echo-free well-defined thin-walled solitary epididymal cyst and (B) a cluster of simple cysts.

• Fig. 32.17 Ultrasound of infected epididymal cyst showing debris and fluid level.

• Fig. 32.18 Ultrasound of well-defined spermatocele with slightly echopoor contents.

• Fig. 32.19 Ultrasound of varicocele seen as echo-free serpiginous structures.

• Fig. 32.20 Testicular phlebography and percutaneous embolisation of varicocele. The testicular vein in this patient has a wide termination unprotected by a valve and at least one small accessory connection to the renal vein (A). The catheter is manipulated into the distal testicular vein (B) to commence deploying the coils (C).

• Fig. 32.20 Testicular phlebography and percutaneous embolisation of varicocele. The testicular vein in this patient has a wide termination unprotected by a valve and at least one small accessory connection to the renal vein (A). The catheter is manipulated into the distal testicular vein (B) to commence deploying the coils (C).

• Fig. 32.21 : Ultrasound showing typical postvasectomy echopoor epididymus.

• Fig. 32.22 Ultrasound of aggressive epididymitis showing a heterogeneous mass with areas of reduced and increased echogenicity adjacent to the lower pole of the testicle.

• Fig. 32.23 Ultrasound of severe orchitis. The bulk of the testicle shows diffuse reduction in echogenicity. The heterogeneous area in the lower pole represents a developing abscess.

• Fig. 32.24 Ultrasound of an infarcting testicle. There are extensive areas of reduced echogenicity within the substance of the testicle. The adjacent epididymis is also markedly diseased and swollen.

• Fig. 32.25 Ultrasound showing a classical highly echogenic scrotolith with marked distal acoustic shadowing and small hydrocele.


• Fig. 32.27 Ultrasound of a small (A) and a large (B) testicular cyst, both showing an echo-free area without any significant solid elements.

• Fig. 32.28 Ultrasound of a small echo-free tunica albuginea cyst.

• Fig. 32.29 Ultrasound showing multiple tiny echo-free areas at the testicular hilum (dilated rete testis).

• Fig. 32.30 Ultrasound of epidermoid cyst seen as a well-defined echo-poor nodule.
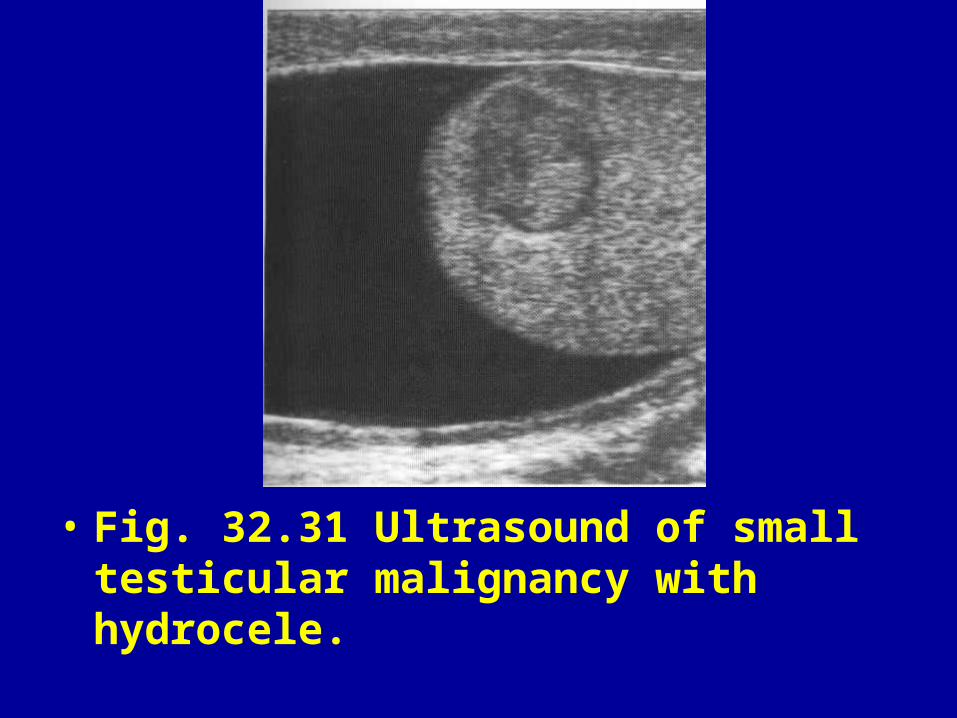
• Fig. 32.31 Ultrasound of small testicular malignancy with hydrocele.

• Fig. 32.33 Ultrasound of NSGCT which is echo-poor but relatively ill defined and containing at least one area of prominent calcification.

• Fig. 32.34 CT demonstrating para-aortic metastases from a left testicular malignancy. (A) At this level a small lymph node deposit is seen immediately lateral to the aorta and a larger one is visible anterior to the left psoas muscle. Higher up (B), just below the level of the renal hila, there is a large left-sided metastatic mass partly encasing the aorta.


• Fig. 32.36 Transverse T 1 - weighted MR images on two different patients. (A) In this case there is a solitary left para-aortic lymph node tumour deposit from a left-sided testicular primary. (B) In this case there is a more substantial right-sided deposit from a NSGCT showing considerable heterogeneity. It has encased and displaced the inferior vena cava.

• Fig. 32.37 Complex deposits of NSGCT in two different patients seen on MRI. (A) In the first case there are tumour deposits in the left retrocrural area, close to the left renal hilum, and a large mass invading into the mesentery. (B) In this case an undescended testicle is the site of grossly metastatic NSGCT which is seen throughout the pelvis on this T 2 - weighted image. It is interesting to note that the pattern of spread is similar to ovarian cancer because of the atypical site of the primary.

• Fig. 32.38 Post-treatment lymph node masses. (A) CT showing substantial mass with substantial cystic (low-density) areas. (B) Transverse T,-weighted MR scan showing a large predominantly cystic lymph node mass with extensive low-signal areas. These are seen on the transverse STiR squence (C, higher level) as intensely high-signal areas. Note the tumour has displaced the aorta anteriorly and is extending into the left renal hilum associated with some renal obstruction, as demonstrated by the perinephric high signal. (D) CT showing an ill-defined lymph node mass between the aorta and inferior vena cava (and inseparable from both) and a second mass to the left of the aorta showing dense areas of calcification.

• Fig. 32.38 Post-treatment lymph node masses. (A) CT showing substantial mass with substantial cystic (low-density) areas. (B) Transverse T,-weighted MR scan showing a large predominantly cystic lymph node mass with extensive low-signal areas. These are seen on the transverse STiR squence (C, higher level) as intensely high-signal areas. Note the tumour has displaced the aorta anteriorly and is extending into the left renal hilum associated with some renal obstruction, as demonstrated by the perinephric high signal. (D) CT showing an ill-defined lymph node mass between the aorta and inferior vena cava (and inseparable from both) and a second mass to the left of the aorta showing dense areas of calcification.

• Fig. 32.39 Testicular ultrasound showing a small echogenic area with distal acoustic enhancement. The patient presented with widespread abdominal and mediastinal lymphadenopathy and pulmonary metastases, histologically shown to be teratoma. The testicular lesion is presumed to be the site of a burnt-out primary.

• Fig. 32.40 Testicular ultrasound showing virtually complete replacement of normal testicular tissue by metastatic prostate cancer. An associated hydrocele is also demonstrated.

• Fig. 32.41 Ultrasound of testicular microlithiasis showing numerous tiny maximum calcific foci.

• Fig. 32.42 Testicular ultrasound showing microlithiasis and the development of a seminoma.

• Fig. 32.43 MR scan of extensive penile carcinoma. Transverse postgadolinium T,-weighted image (A) shows destruction of the normal anatomy of the glans and shaft by the irregular enhancing mass of tumour. This is seen on the transverse STIR sequence (B), which also demonstrates upstream dilatation of the urethra, a finding generally only seen with advanced tumours. The coronal post-gadolinium T1 -weighted image (C) demonstrates the presence of inguinal lymph nodes. These are not particularly enlarged but the node on the right (arrow) shows central necrosis characteristic of squamous cell carcinoma metastasis.

• Fig. 32.43 MR scan of extensive penile carcinoma. Transverse postgadolinium T,-weighted image (A) shows destruction of the normal anatomy of the glans and shaft by the irregular enhancing mass of tumour. This is seen on the transverse STIR sequence (B), which also demonstrates upstream dilatation of the urethra, a finding generally only seen with advanced tumours. The coronal post-gadolinium T1 -weighted image (C) demonstrates the presence of inguinal lymph nodes. These are not particularly enlarged but the node on the right (arrow) shows central necrosis characteristic of squamous cell carcinoma metastasis.

• Fig. 32.44 Longitudinal ultrasound of a penis in Peyronie's disease showing a small calcified echogenic plaque with distal acoustic shadowing.

Fig. 32.45 Acute epididymo-orchitis (two cases). Anterior 99mTc images obtained 1 min after injection showing diffusely increased uptake in the right testis of case A and the left testis of case B. Case A also shows diffusely increased activity along the spermatic cord on the affected side. A lead marker has been used to indicate the midline of the scrotum.
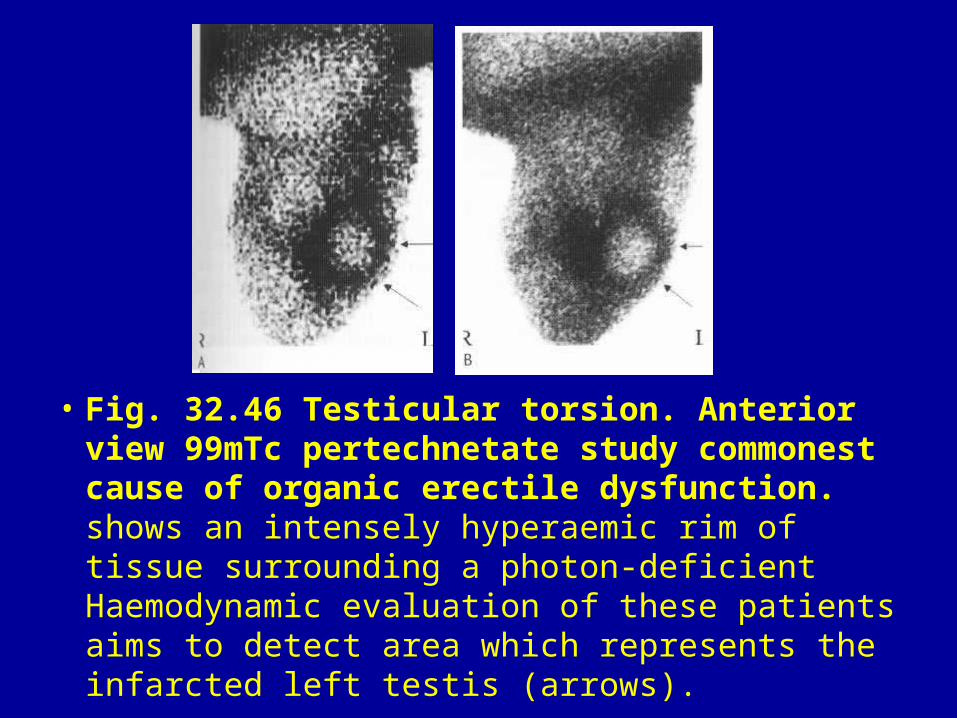
• Fig. 32.46 Testicular torsion. Anterior view 99mTc pertechnetate study commonest cause of organic erectile dysfunction. shows an intensely hyperaemic rim of tissue surrounding a photon-deficient Haemodynamic evaluation of these patients aims to detect area which represents the infarcted left testis (arrows).