Embed Size (px)
Citation preview

8. Sampling Methods & Sample size
Dr. Nguyen Quynh Mai

SAMPLING

3
The Nature of Sampling
• Sampling
• Population Element
• Population/ Census
• Sampling frame
4
Why Sample?
Greater
accuracy
Availability of
elements
Greater
speed
Sampling
provides
Lower cost
5
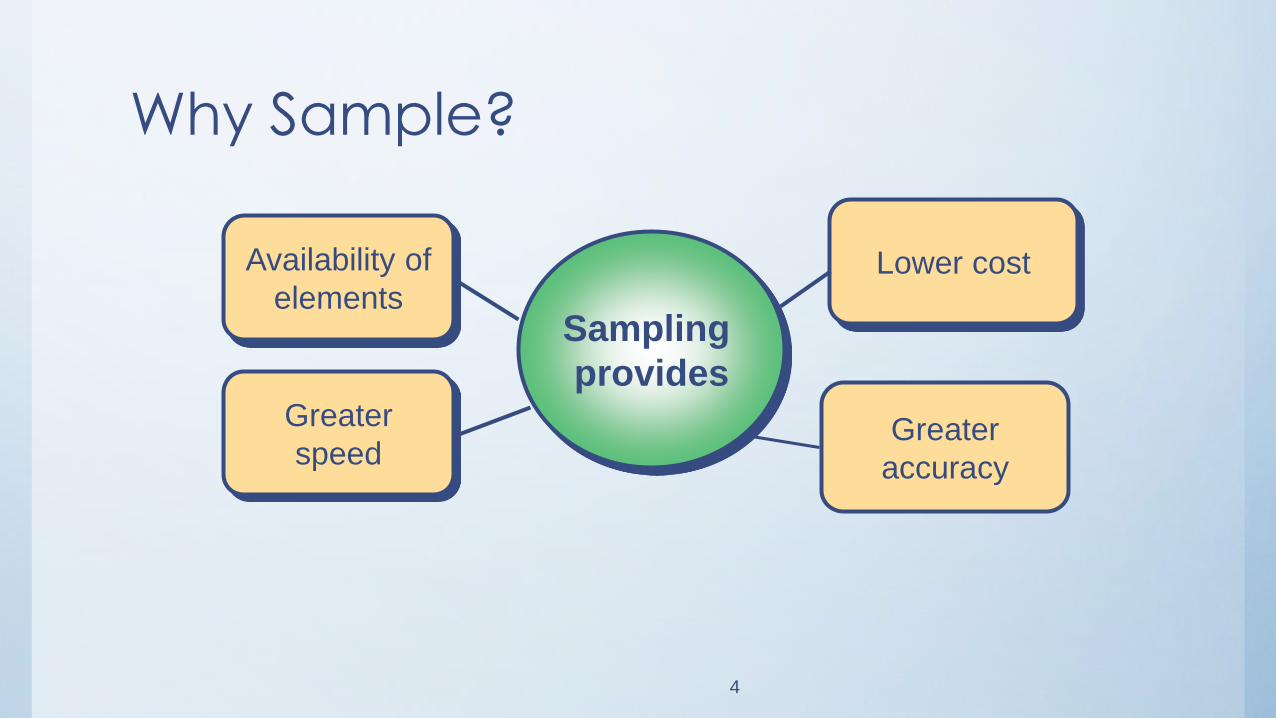
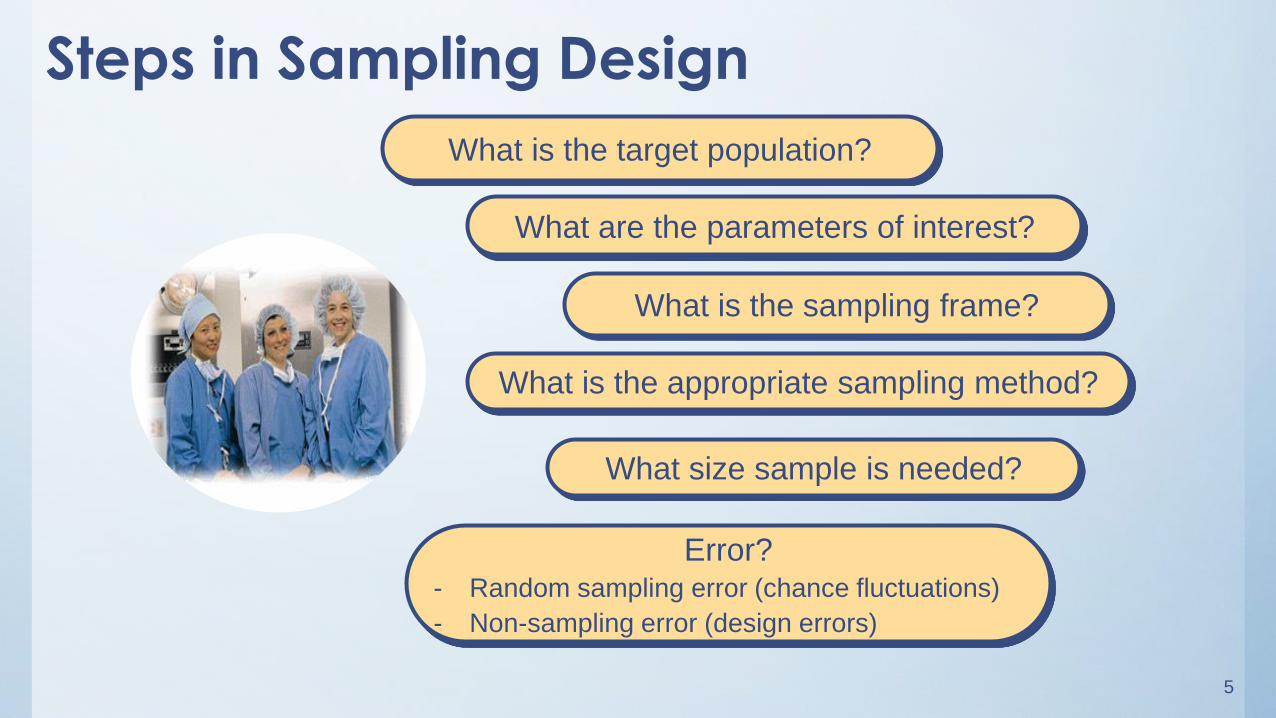
Steps in Sampling Design
What is the target population?
What are the parameters of interest?
What is the sampling frame?
What is the appropriate sampling method?
What size sample is needed?
Error?- Random sampling error (chance fluctuations)
- Non-sampling error (design errors)
Target Population (step 1)
• Who has the information/data you need?
• How do you define your target population?
- Geography
- Demographics
- Use
- Awareness
Sampling Frame (step 2)
• List of elements
• Sampling Frame error
– Error that occurs when certain sample elements are not listed or available and are not represented in the sampling frame
Probability or Nonprobability (step 3)
• Probability Sample:
– A sampling technique in which every member of the population will have a known, nonzero probability of being selected
• Non-Probability Sample:
– Units of the sample are chosen on the basis of personal judgment or convenience
– There are NO statistical techniques for measuring random sampling error in a non-probability sample. Therefore, generalizability is never statistically appropriate.
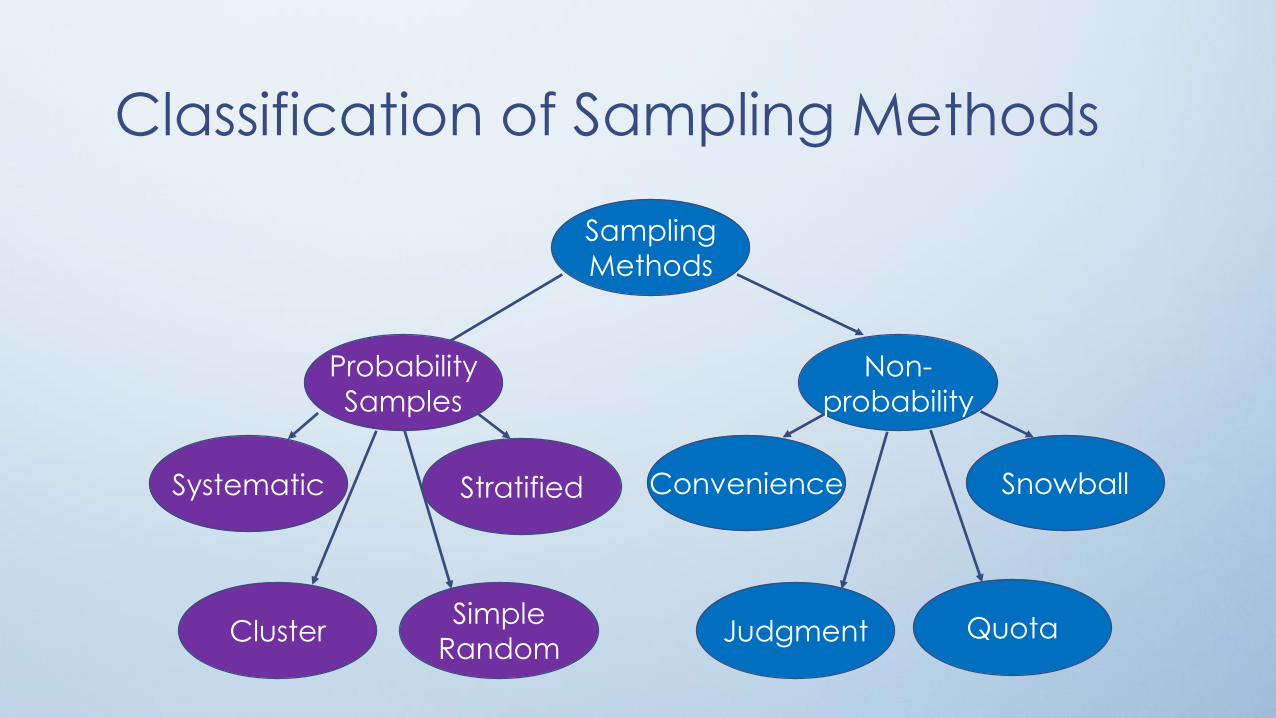
Classification of Sampling Methods
Sampling
Methods
Probability
Samples
Simple
RandomCluster
Systematic Stratified
Non-
probability
QuotaJudgment
Convenience Snowball
10
Probability Sampling
• Simple random
• Systematic
• Stratified
• Cluster
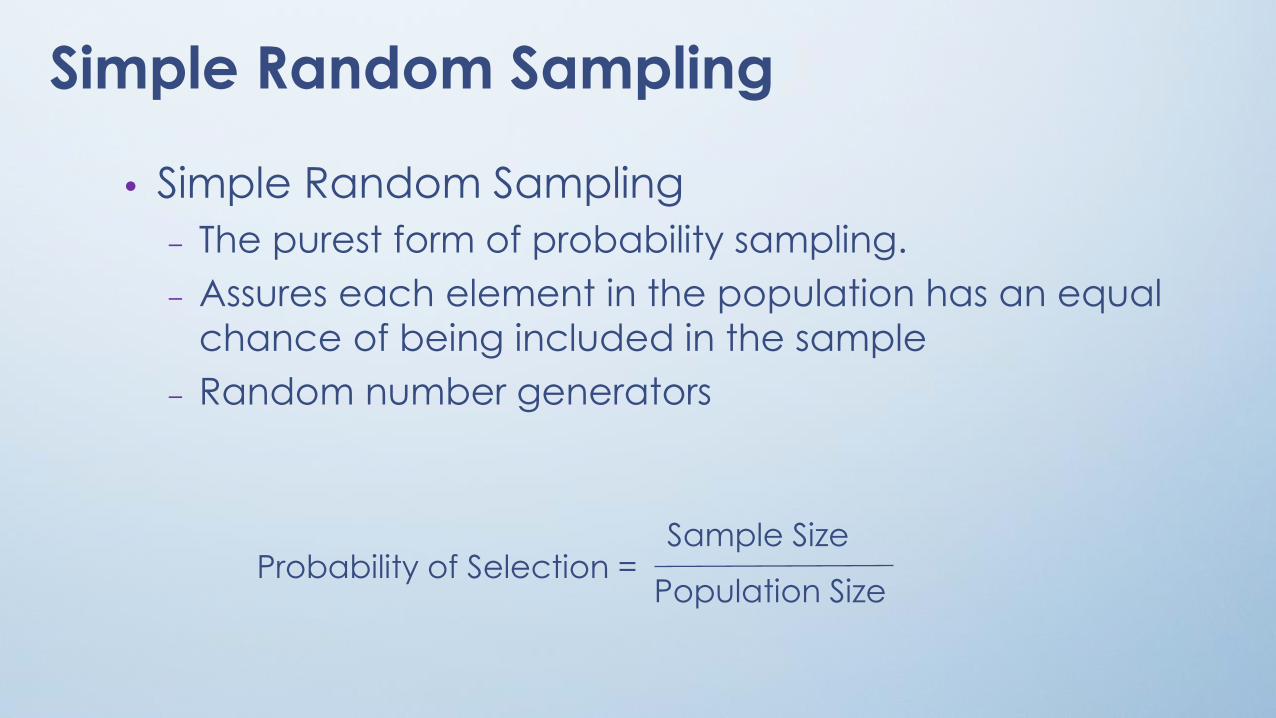
• Simple Random Sampling
– The purest form of probability sampling.
– Assures each element in the population has an equal
chance of being included in the sample
– Random number generators
Probability of Selection = Sample Size
Population Size
Simple Random Sampling
12
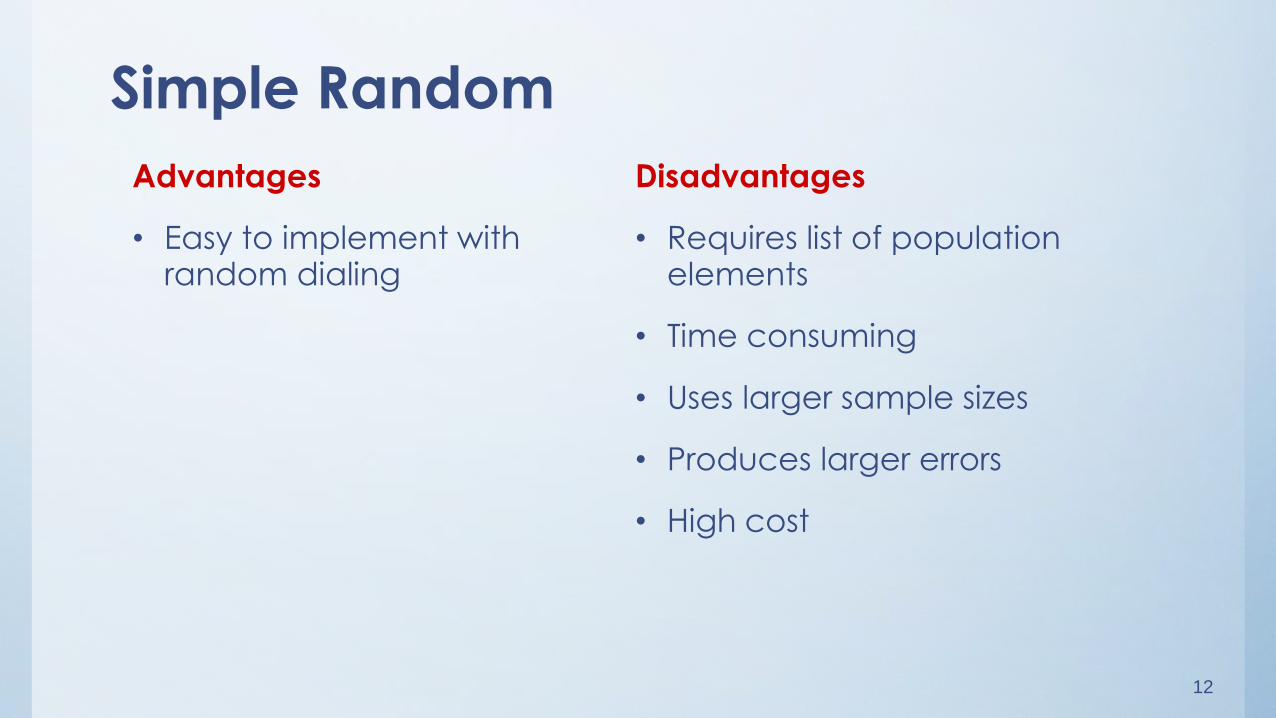
Simple Random
Advantages
• Easy to implement with random dialing
Disadvantages
• Requires list of population elements
• Time consuming
• Uses larger sample sizes
• Produces larger errors
• High cost
13
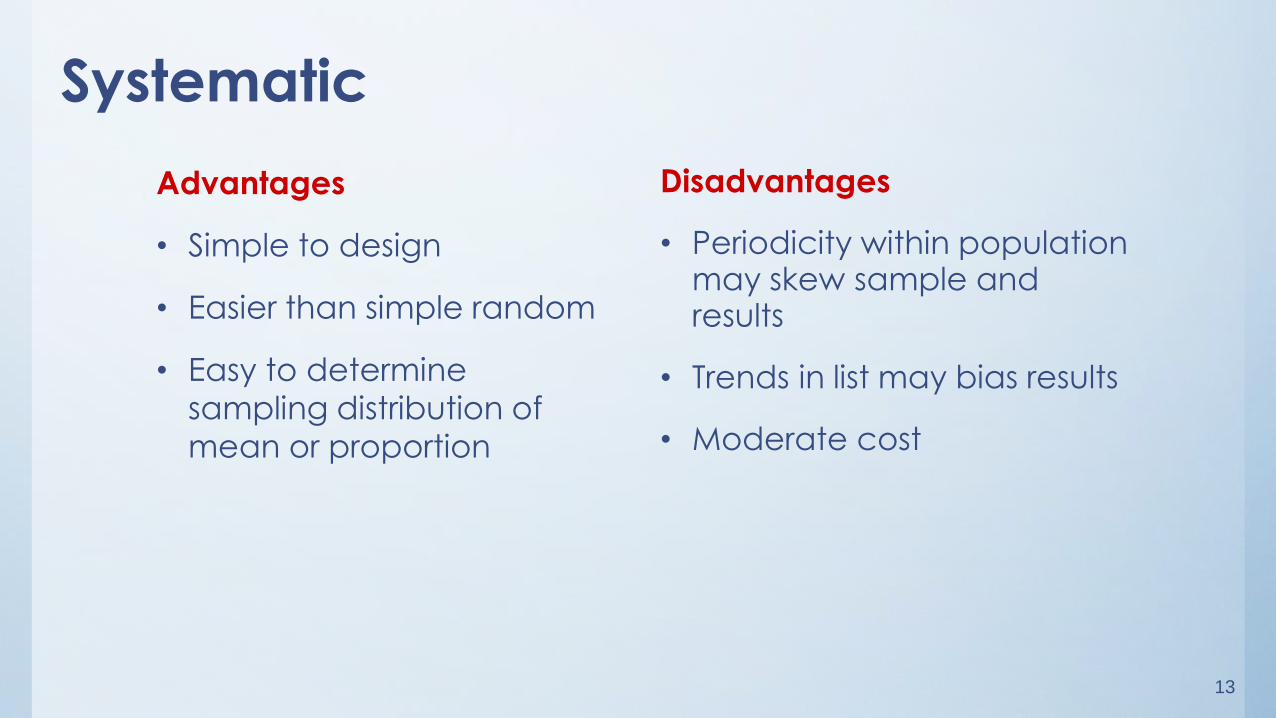
Systematic
Advantages
• Simple to design
• Easier than simple random
• Easy to determine
sampling distribution of
mean or proportion
Disadvantages
• Periodicity within population may skew sample and results
• Trends in list may bias results
• Moderate cost
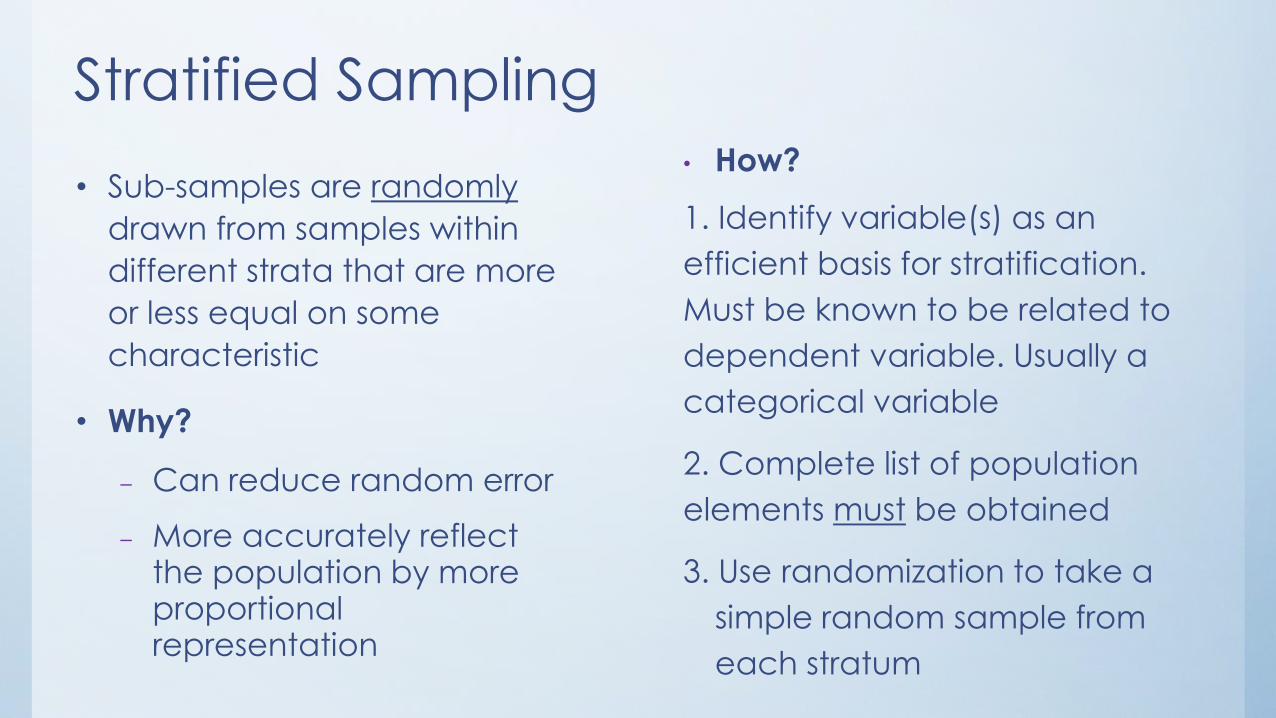
Stratified Sampling
• Sub-samples are randomly
drawn from samples within
different strata that are more
or less equal on some
characteristic
• Why?
– Can reduce random error
– More accurately reflect the population by more proportional representation
• How?
1. Identify variable(s) as an
efficient basis for stratification.
Must be known to be related to
dependent variable. Usually a
categorical variable
2. Complete list of population
elements must be obtained
3. Use randomization to take a
simple random sample from
each stratum
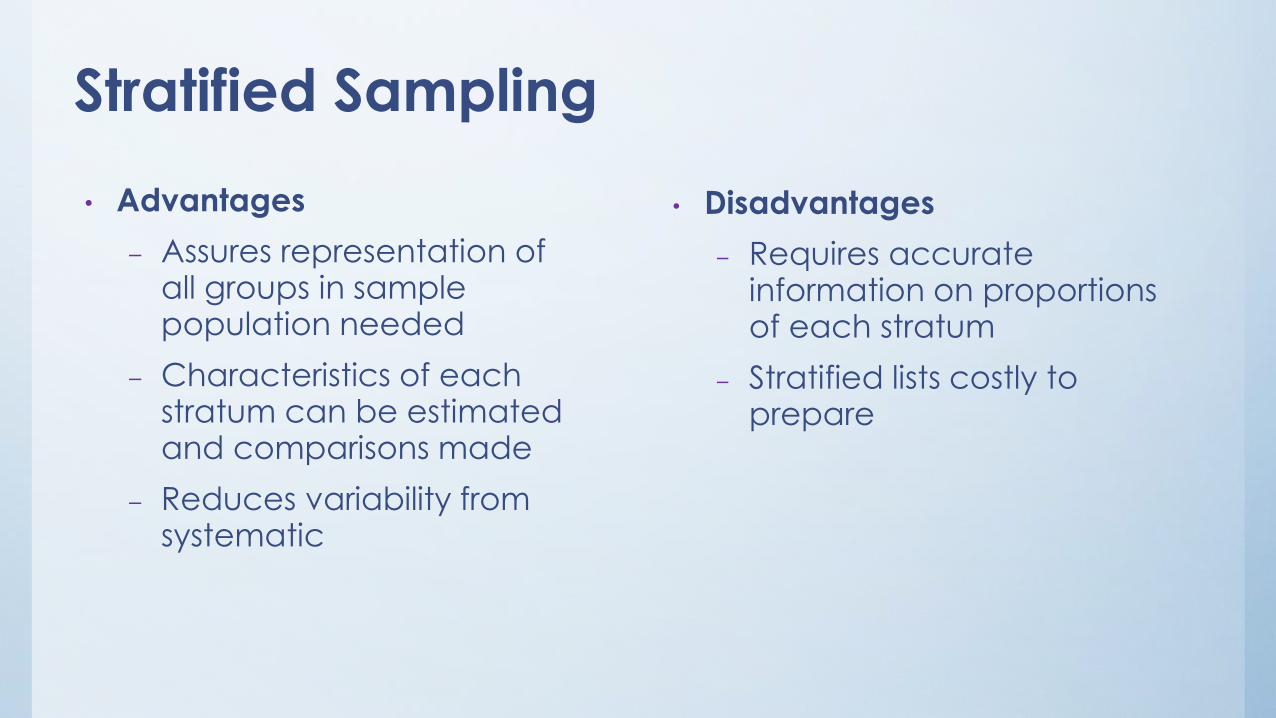
Stratified Sampling
• Advantages
– Assures representation of all groups in sample population needed
– Characteristics of each stratum can be estimated and comparisons made
– Reduces variability from systematic
• Disadvantages
– Requires accurate information on proportions of each stratum
– Stratified lists costly to prepare
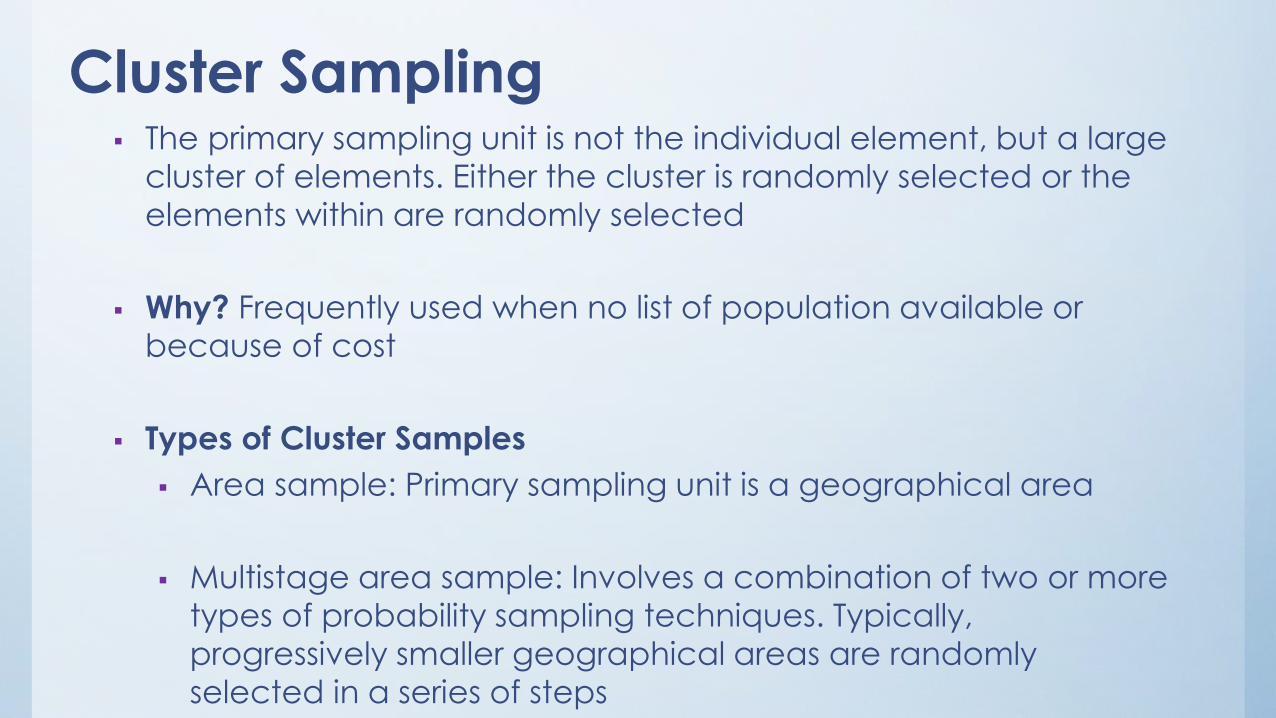
Cluster Sampling The primary sampling unit is not the individual element, but a large
cluster of elements. Either the cluster is randomly selected or the
elements within are randomly selected
Why? Frequently used when no list of population available or
because of cost
Types of Cluster Samples
Area sample: Primary sampling unit is a geographical area
Multistage area sample: Involves a combination of two or more
types of probability sampling techniques. Typically,
progressively smaller geographical areas are randomly
selected in a series of steps
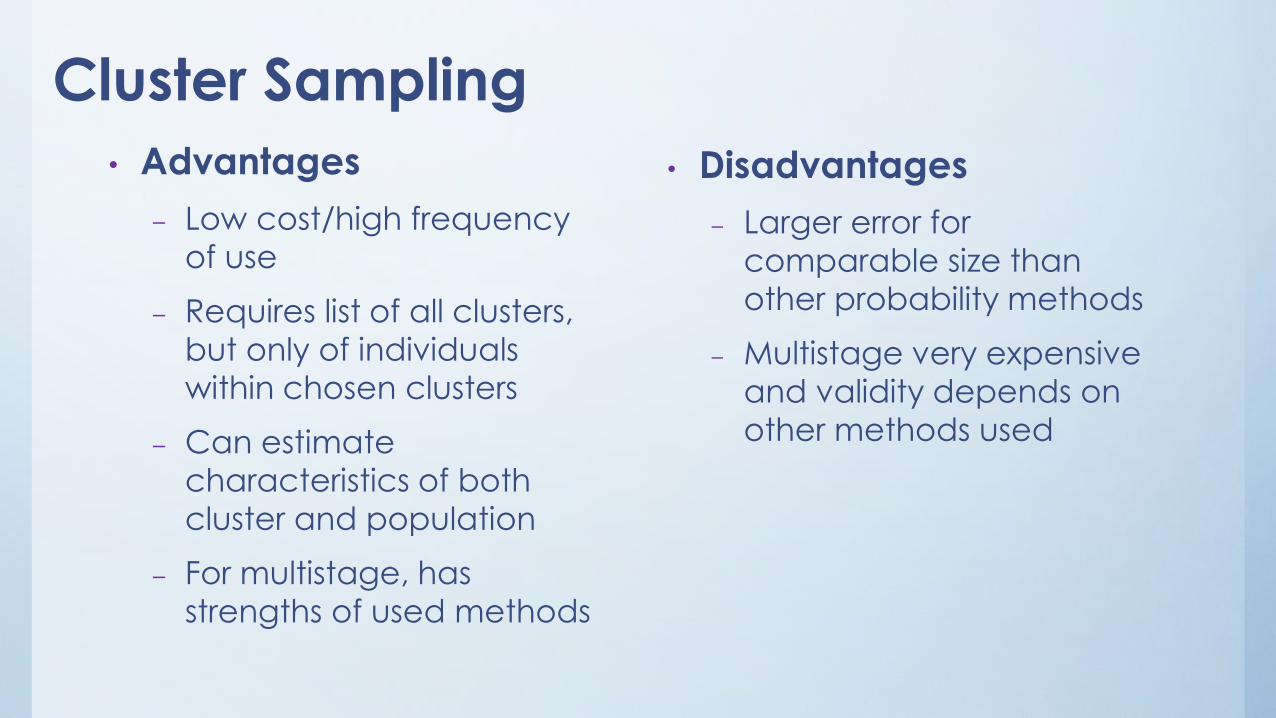
Cluster Sampling
• Advantages
– Low cost/high frequency
of use
– Requires list of all clusters,
but only of individuals
within chosen clusters
– Can estimate
characteristics of both
cluster and population
– For multistage, has
strengths of used methods
• Disadvantages
– Larger error for
comparable size than
other probability methods
– Multistage very expensive
and validity depends on
other methods used
18
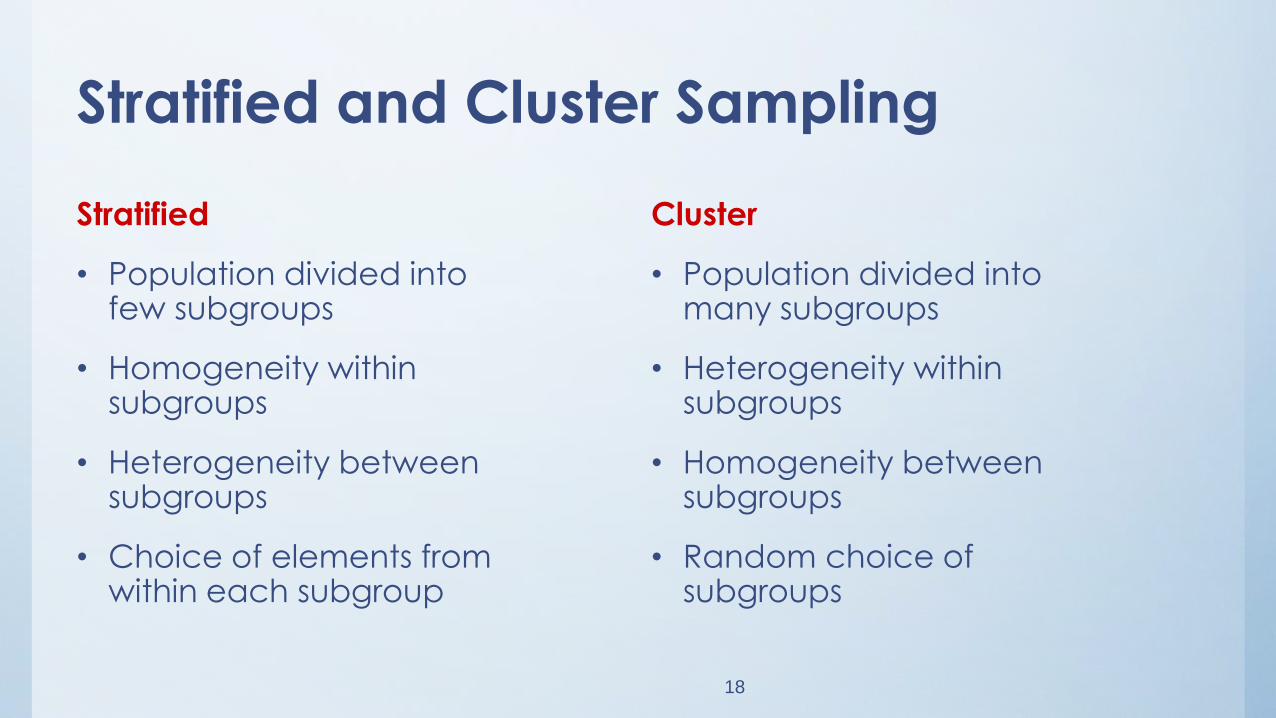
Stratified and Cluster Sampling
Stratified
• Population divided into few subgroups
• Homogeneity within subgroups
• Heterogeneity between subgroups
• Choice of elements from within each subgroup
Cluster
• Population divided into many subgroups
• Heterogeneity within subgroups
• Homogeneity between subgroups
• Random choice of subgroups
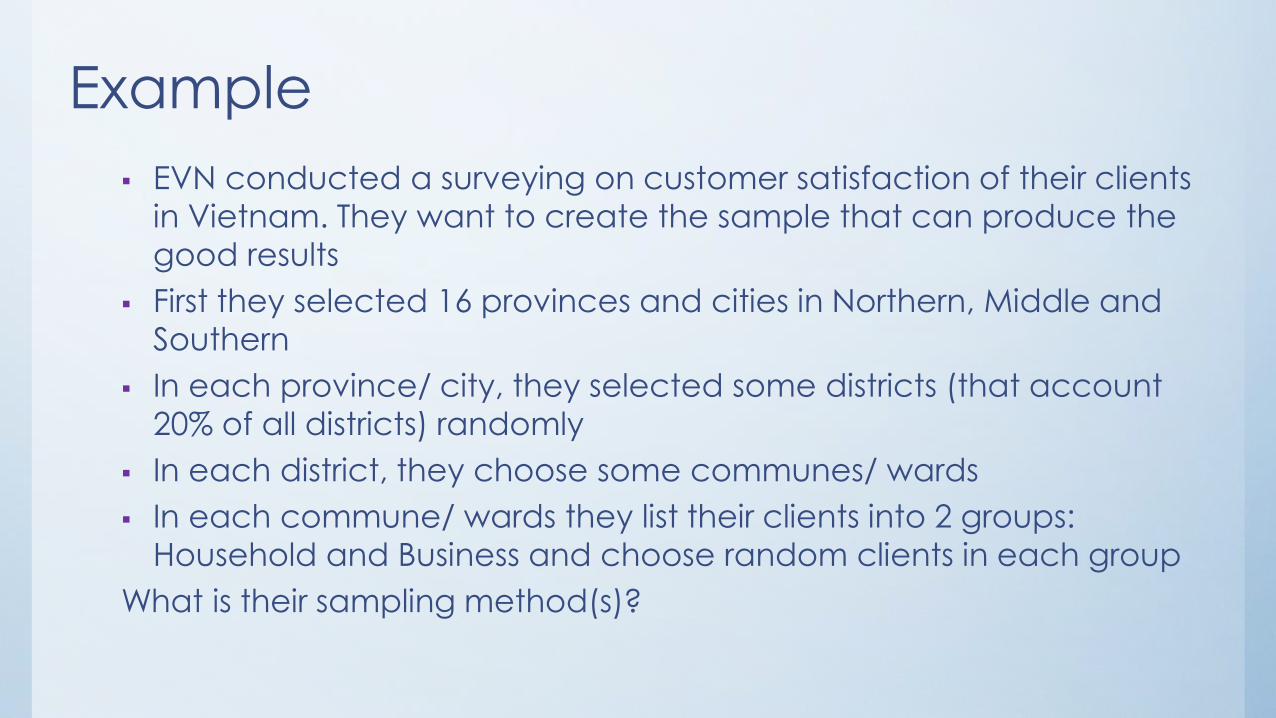
Example
EVN conducted a surveying on customer satisfaction of their clients
in Vietnam. They want to create the sample that can produce the
good results
First they selected 16 provinces and cities in Northern, Middle and
Southern
In each province/ city, they selected some districts (that account
20% of all districts) randomly
In each district, they choose some communes/ wards
In each commune/ wards they list their clients into 2 groups:
Household and Business and choose random clients in each group
What is their sampling method(s)?
20
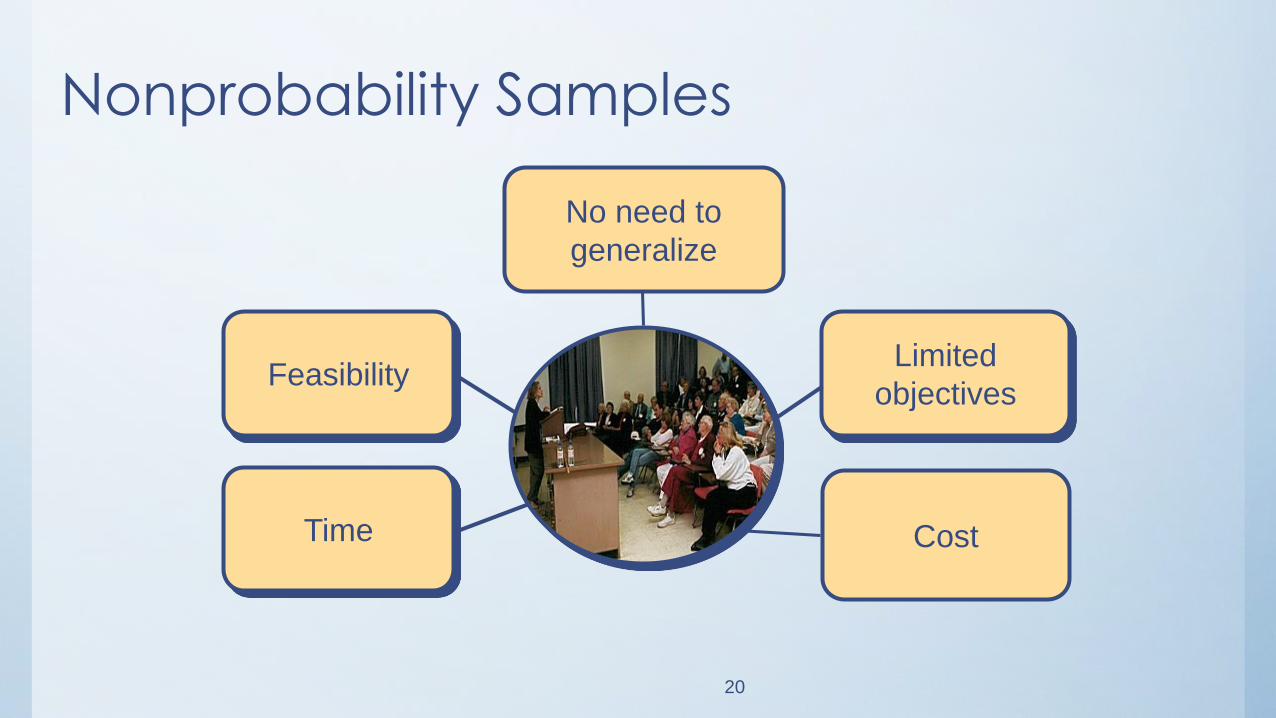
Nonprobability Samples
Cost
Feasibility
Time
No need to
generalize
Limited
objectives
21
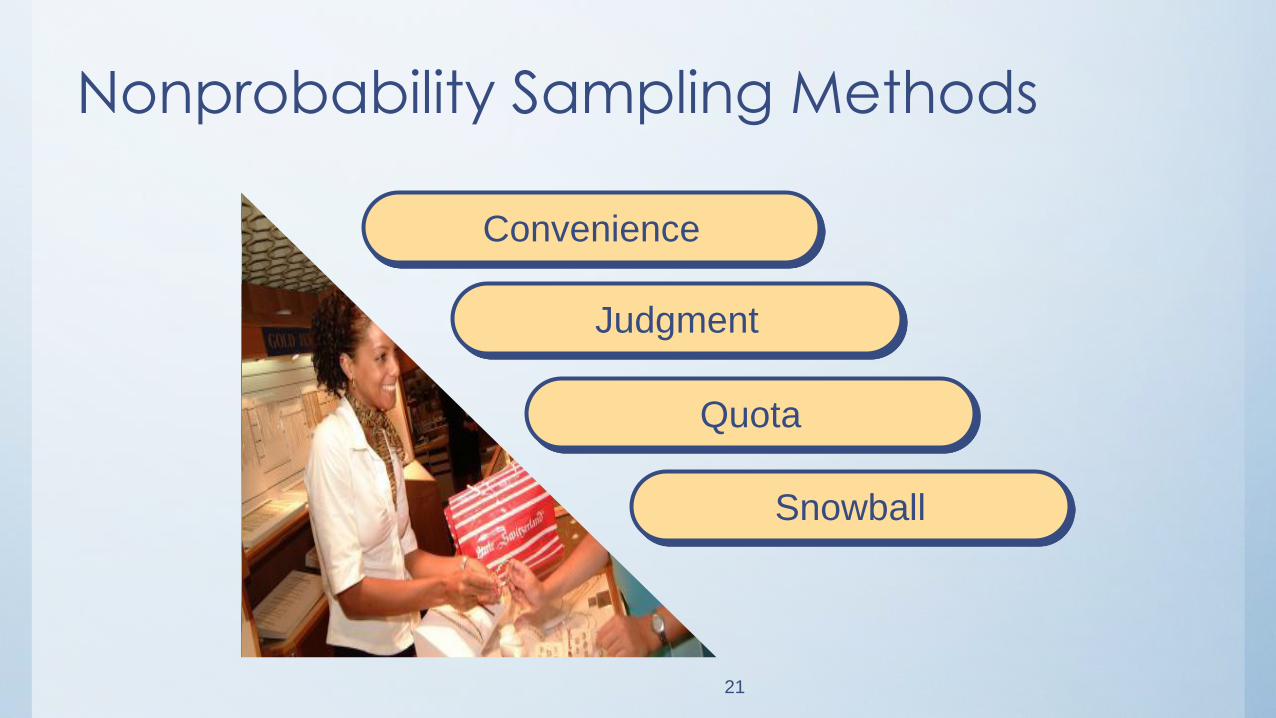
Nonprobability Sampling Methods
Convenience
Judgment
Quota
Snowball
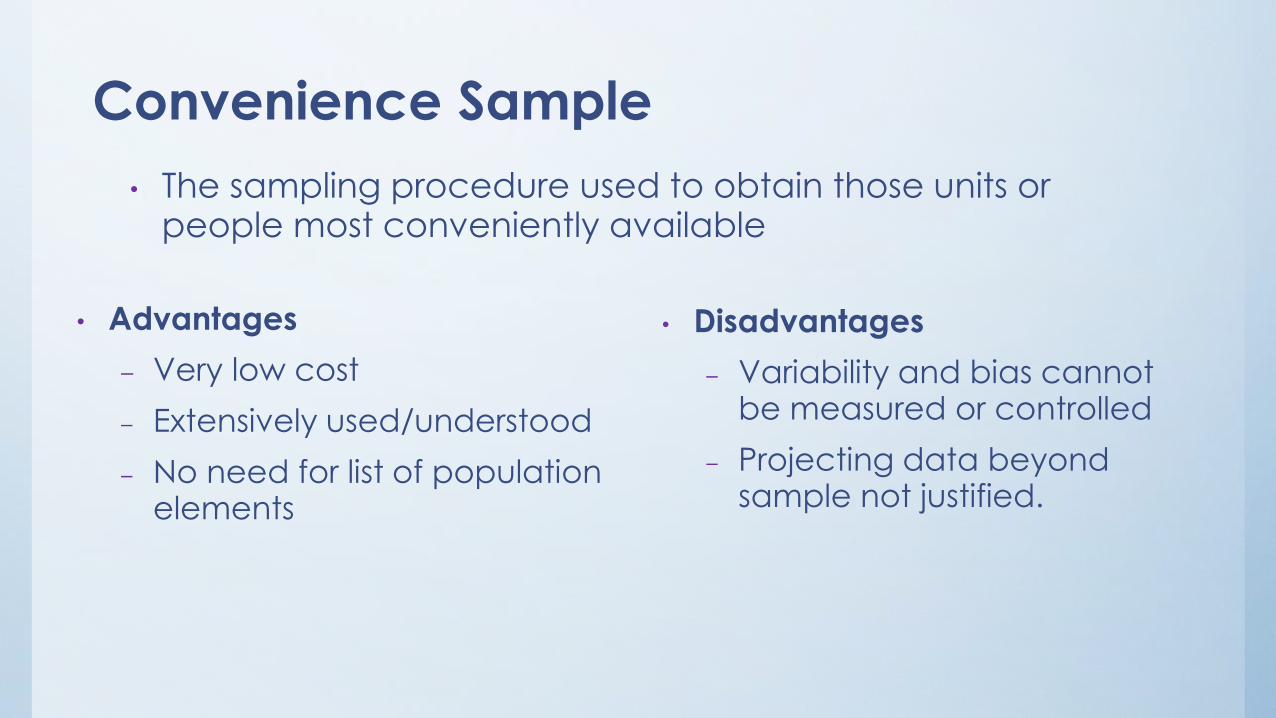
Convenience Sample
• The sampling procedure used to obtain those units or people most conveniently available
• Advantages
– Very low cost
– Extensively used/understood
– No need for list of population elements
• Disadvantages
– Variability and bias cannot be measured or controlled
– Projecting data beyond sample not justified.
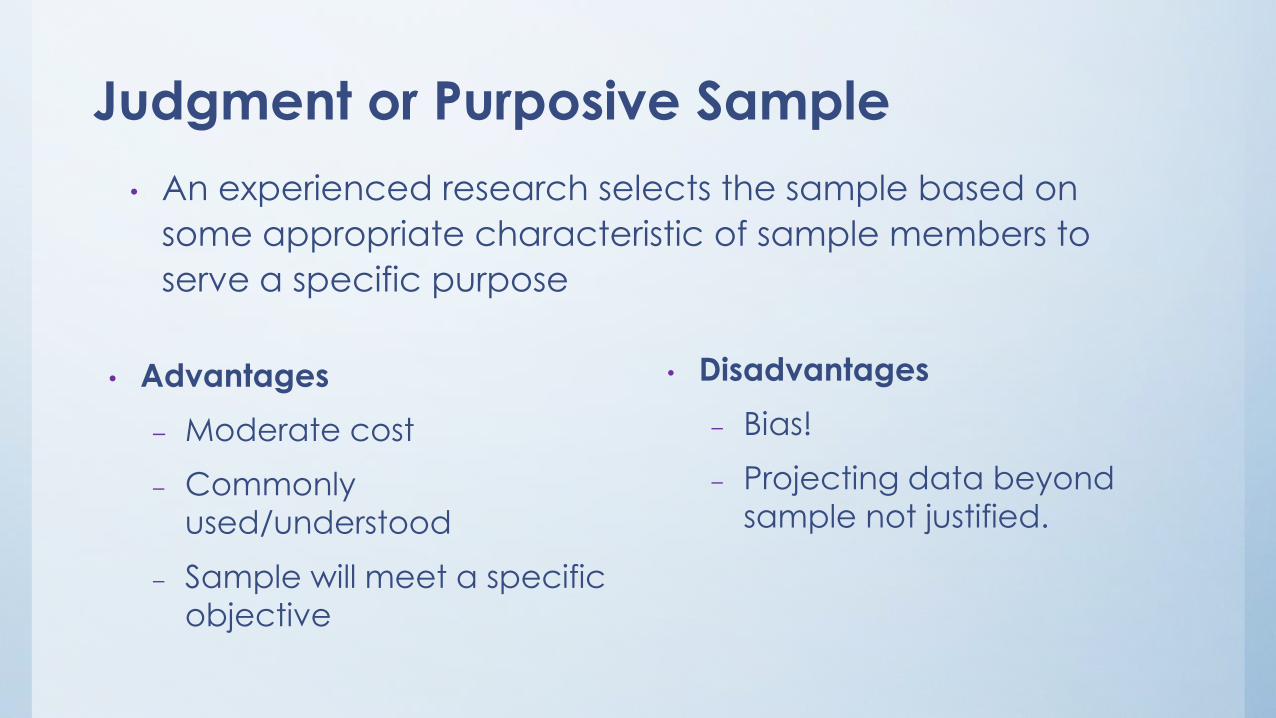
Judgment or Purposive Sample
• An experienced research selects the sample based on
some appropriate characteristic of sample members to
serve a specific purpose
• Advantages
– Moderate cost
– Commonly
used/understood
– Sample will meet a specific
objective
• Disadvantages
– Bias!
– Projecting data beyond
sample not justified.
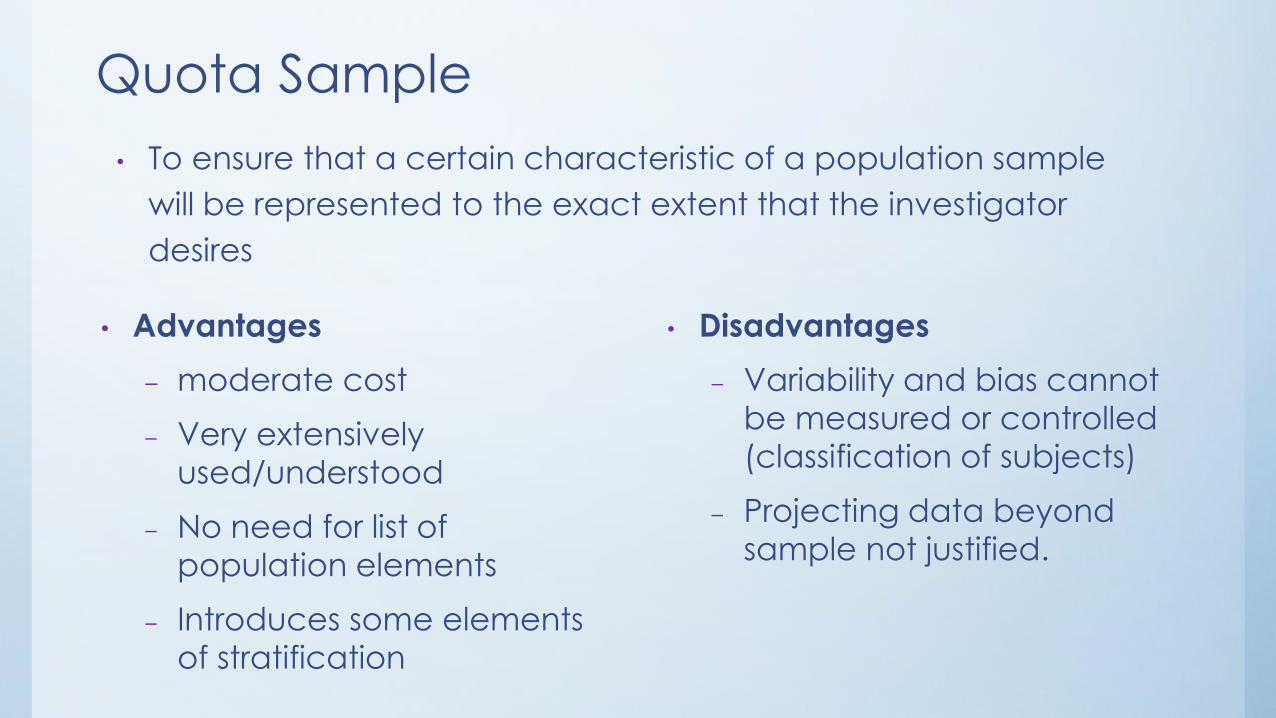
Quota Sample
• To ensure that a certain characteristic of a population sample
will be represented to the exact extent that the investigator
desires
• Advantages
– moderate cost
– Very extensively
used/understood
– No need for list of
population elements
– Introduces some elements
of stratification
• Disadvantages
– Variability and bias cannot
be measured or controlled
(classification of subjects)
– Projecting data beyond
sample not justified.
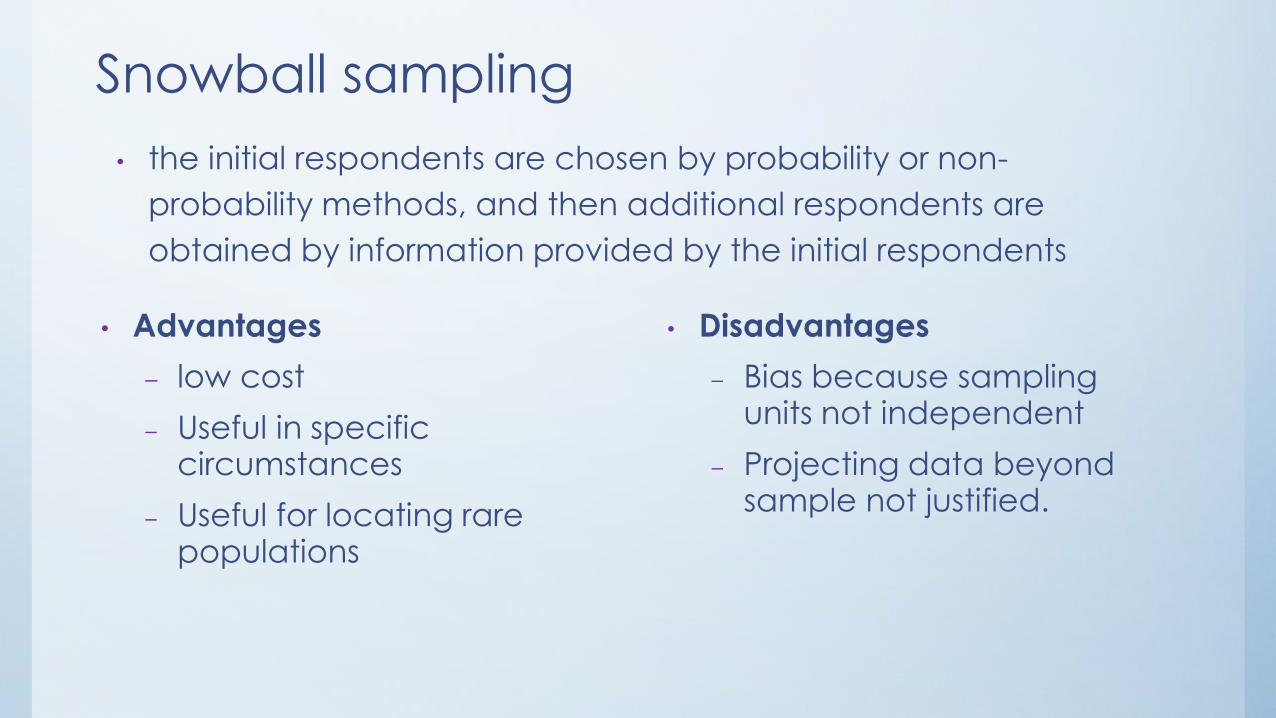
Snowball sampling
• the initial respondents are chosen by probability or non-
probability methods, and then additional respondents are
obtained by information provided by the initial respondents
• Advantages
– low cost
– Useful in specific circumstances
– Useful for locating rare populations
• Disadvantages
– Bias because sampling units not independent
– Projecting data beyond sample not justified.

Sample size
27
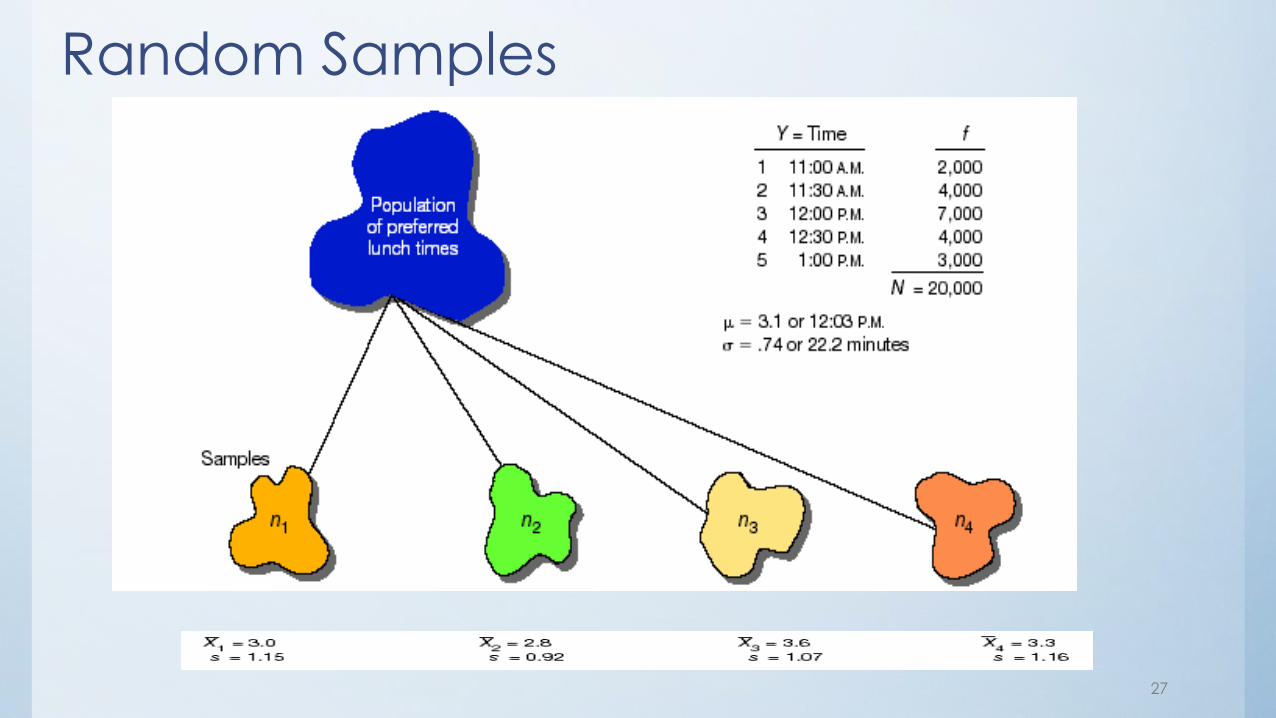
Random Samples
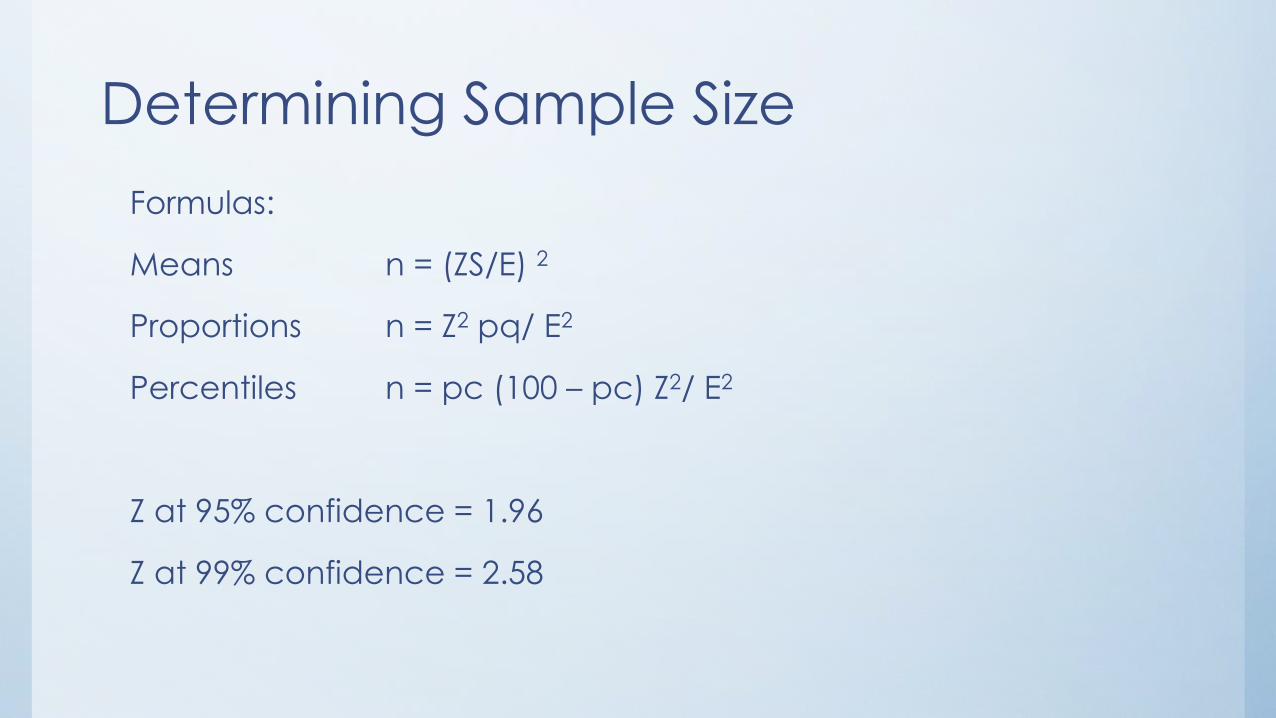
Determining Sample Size
Formulas:
Means n = (ZS/E) 2
Proportions n = Z2 pq/ E2
Percentiles n = pc (100 – pc) Z2/ E2
Z at 95% confidence = 1.96
Z at 99% confidence = 2.58

Organizational Research:
Determining Appropriate
Sample Size in Survey
Research
James E. Bartlett, IIJoe W. KotrlikChadwick C. Higgins
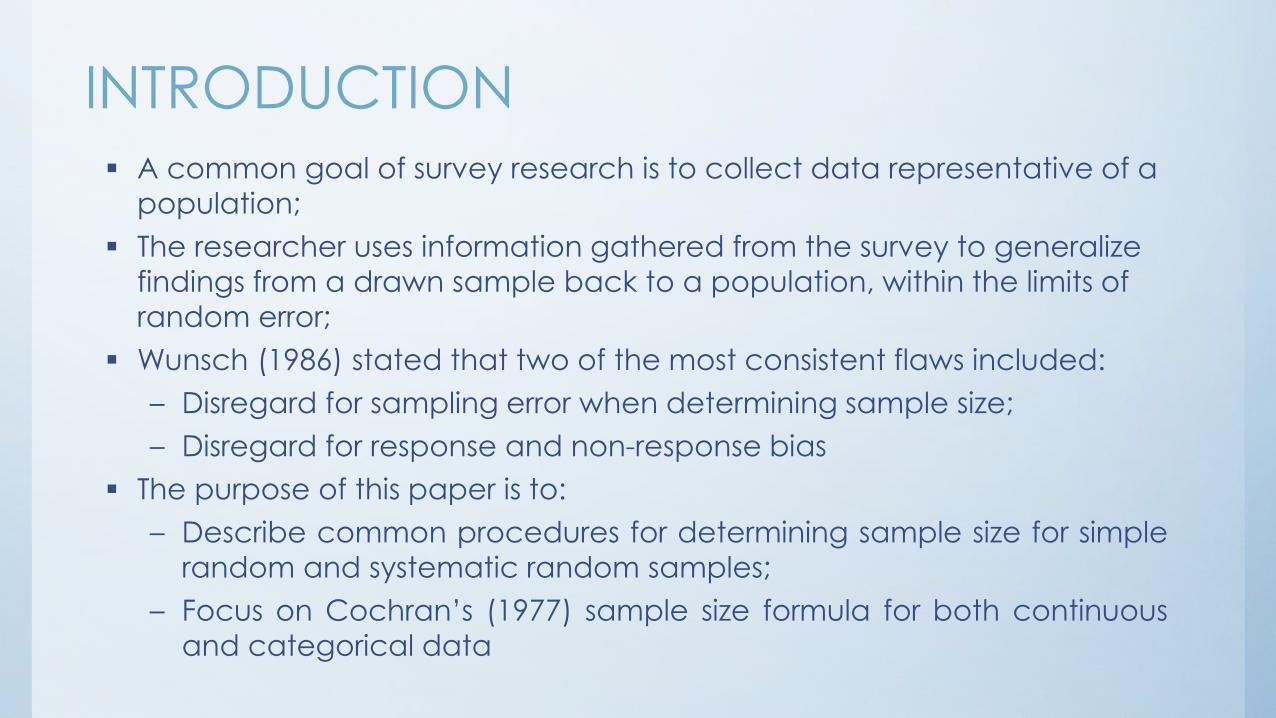
INTRODUCTION
A common goal of survey research is to collect data representative of a
population;
The researcher uses information gathered from the survey to generalize
findings from a drawn sample back to a population, within the limits of
random error;
Wunsch (1986) stated that two of the most consistent flaws included:
– Disregard for sampling error when determining sample size;
– Disregard for response and non-response bias
The purpose of this paper is to:
– Describe common procedures for determining sample size for simple
random and systematic random samples;
– Focus on Cochran’s (1977) sample size formula for both continuous
and categorical data
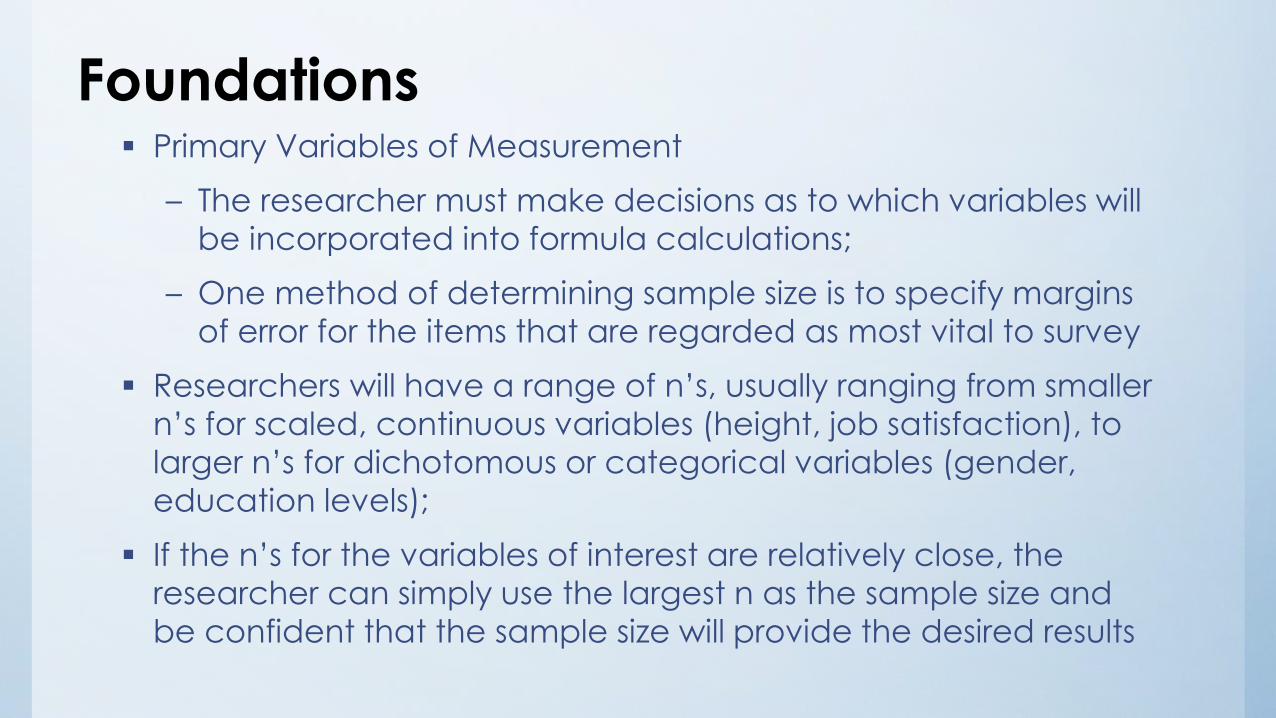
Foundations Primary Variables of Measurement
– The researcher must make decisions as to which variables will
be incorporated into formula calculations;
– One method of determining sample size is to specify margins
of error for the items that are regarded as most vital to survey
Researchers will have a range of n’s, usually ranging from smaller
n’s for scaled, continuous variables (height, job satisfaction), to
larger n’s for dichotomous or categorical variables (gender,
education levels);
If the n’s for the variables of interest are relatively close, the
researcher can simply use the largest n as the sample size and
be confident that the sample size will provide the desired results
Error Estimation
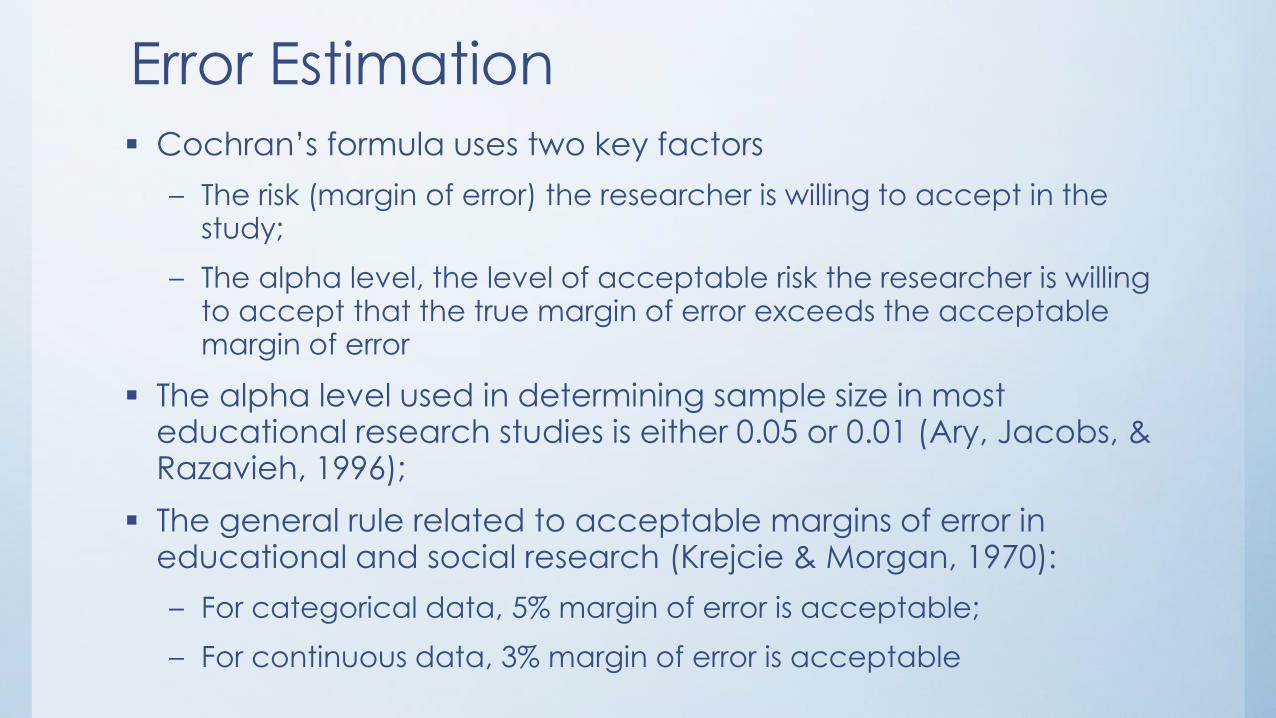
Cochran’s formula uses two key factors
– The risk (margin of error) the researcher is willing to accept in the study;
– The alpha level, the level of acceptable risk the researcher is willing to accept that the true margin of error exceeds the acceptable margin of error
The alpha level used in determining sample size in most educational research studies is either 0.05 or 0.01 (Ary, Jacobs, & Razavieh, 1996);
The general rule related to acceptable margins of error in educational and social research (Krejcie & Morgan, 1970):
– For categorical data, 5% margin of error is acceptable;
– For continuous data, 3% margin of error is acceptable
33
0.4
0.3
0.2
0.1
0.0x
F(x
)
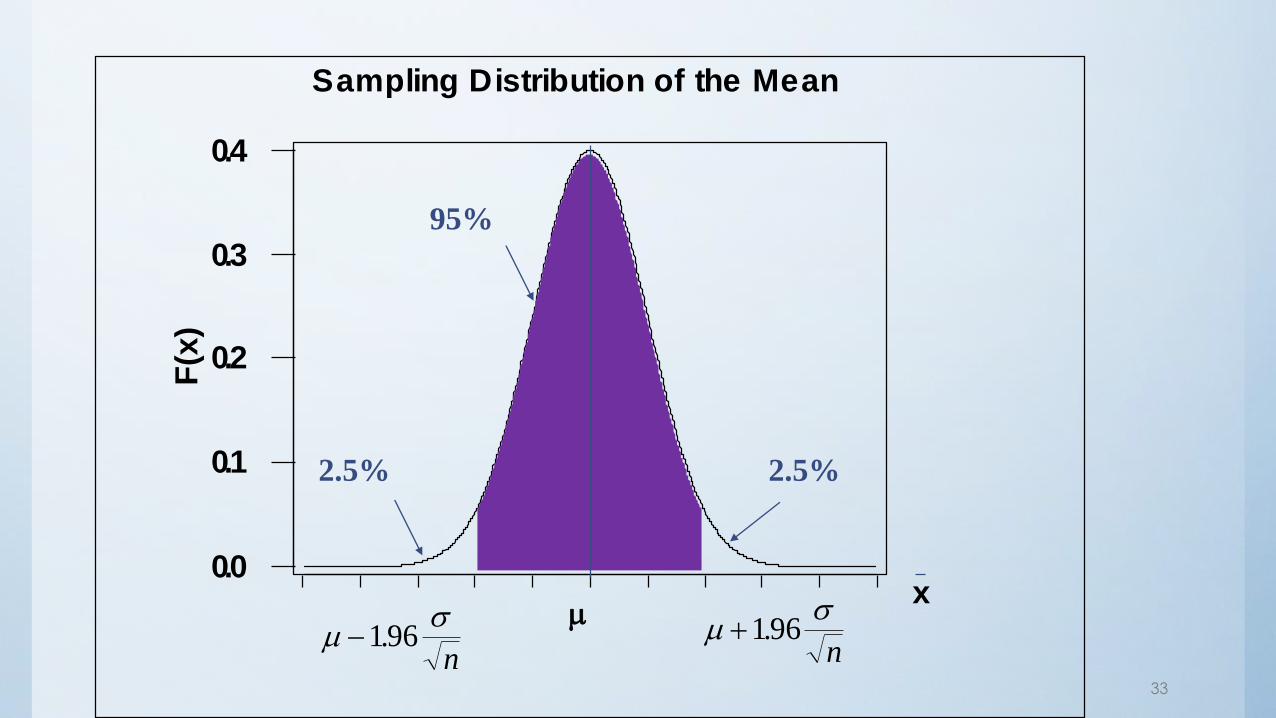
Sampling Distribution of the Mean
2.5%
95%
2.5%
196.n
196.n
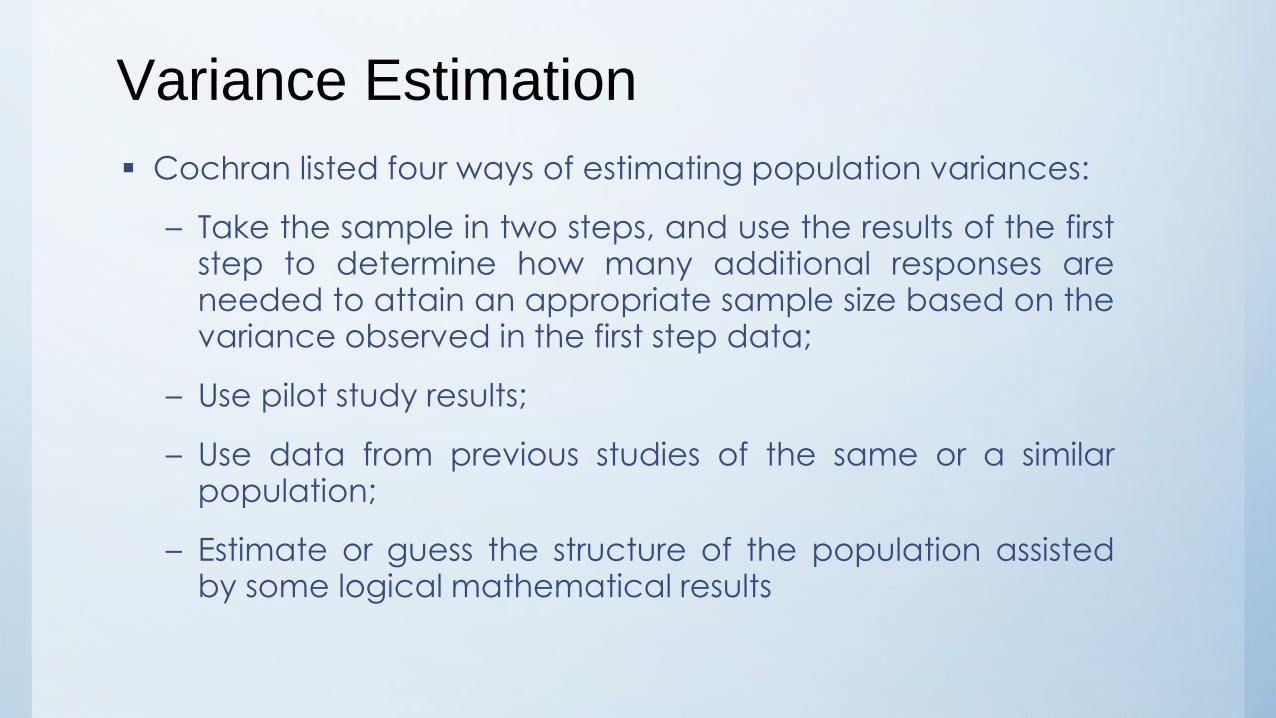
Variance Estimation
Cochran listed four ways of estimating population variances:
– Take the sample in two steps, and use the results of the firststep to determine how many additional responses areneeded to attain an appropriate sample size based on thevariance observed in the first step data;
– Use pilot study results;
– Use data from previous studies of the same or a similarpopulation;
– Estimate or guess the structure of the population assistedby some logical mathematical results
35
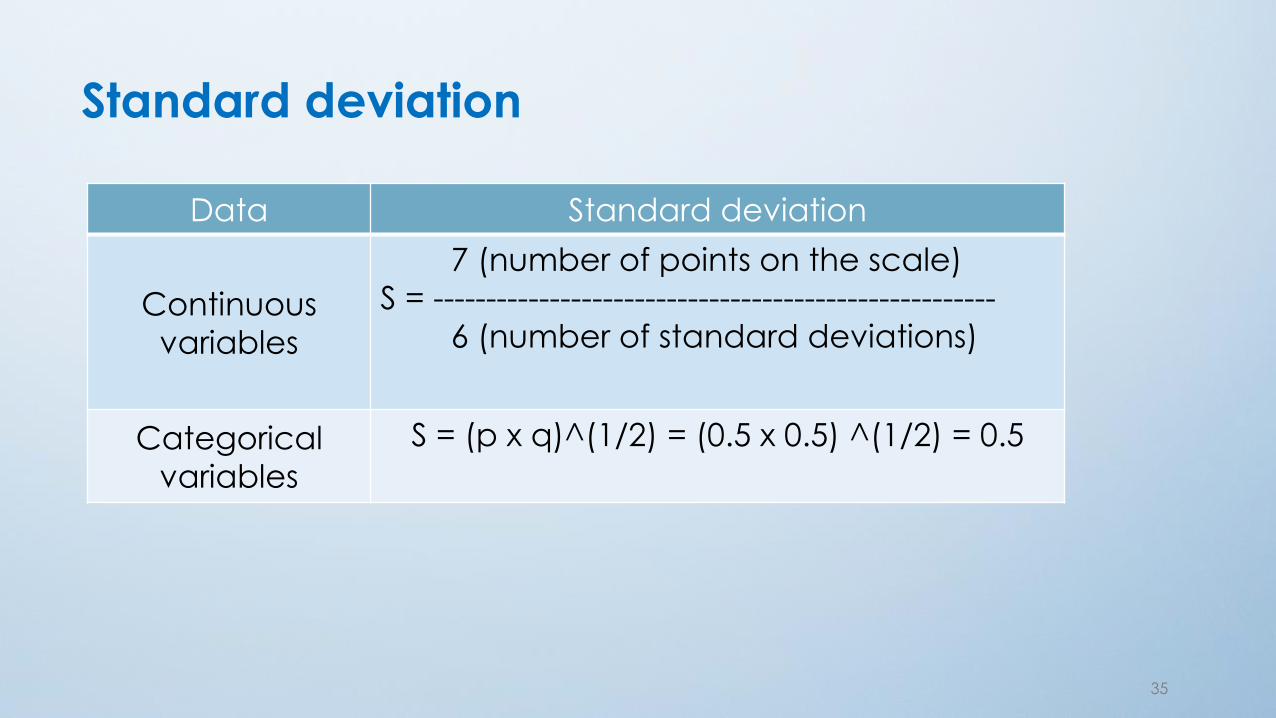
Standard deviation
Data Standard deviation
Continuous
variables
7 (number of points on the scale)
S = -----------------------------------------------------
6 (number of standard deviations)
Categorical
variables
S = (p x q)^(1/2) = (0.5 x 0.5) ^(1/2) = 0.5
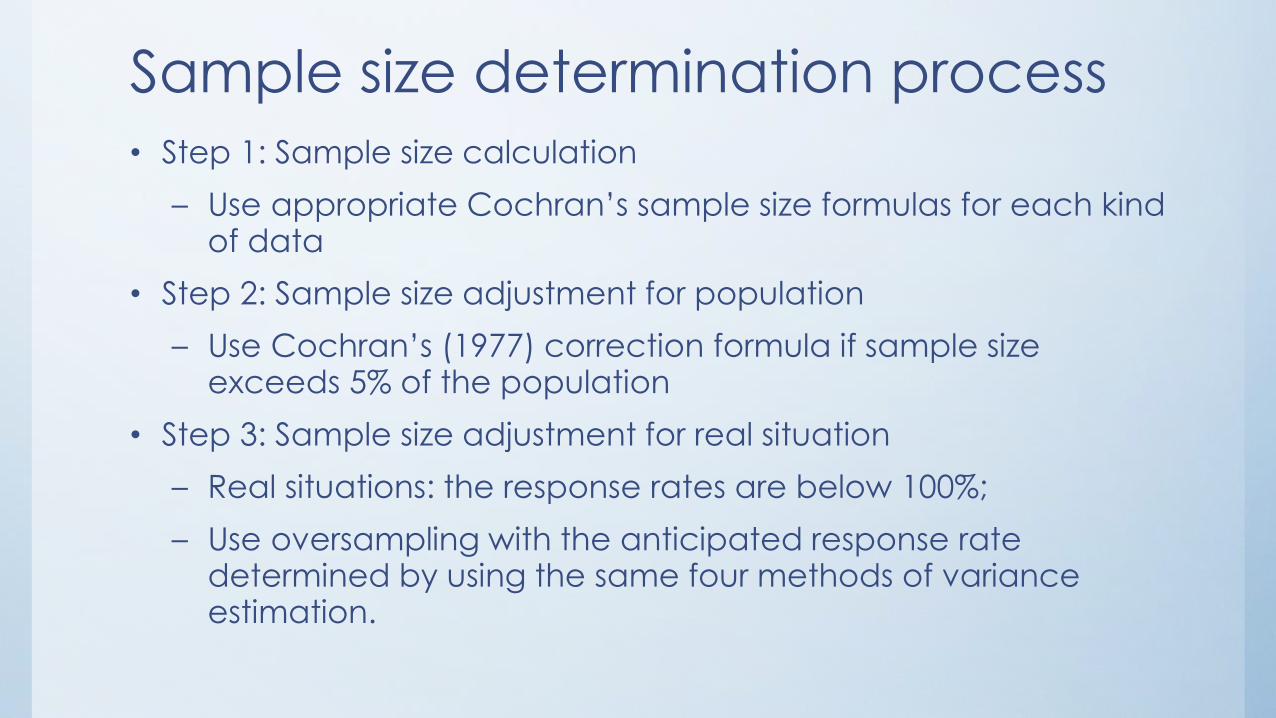
Sample size determination process
• Step 1: Sample size calculation
– Use appropriate Cochran’s sample size formulas for each kind of data
• Step 2: Sample size adjustment for population
– Use Cochran’s (1977) correction formula if sample size exceeds 5% of the population
• Step 3: Sample size adjustment for real situation
– Real situations: the response rates are below 100%;
– Use oversampling with the anticipated response rate determined by using the same four methods of variance estimation.
37
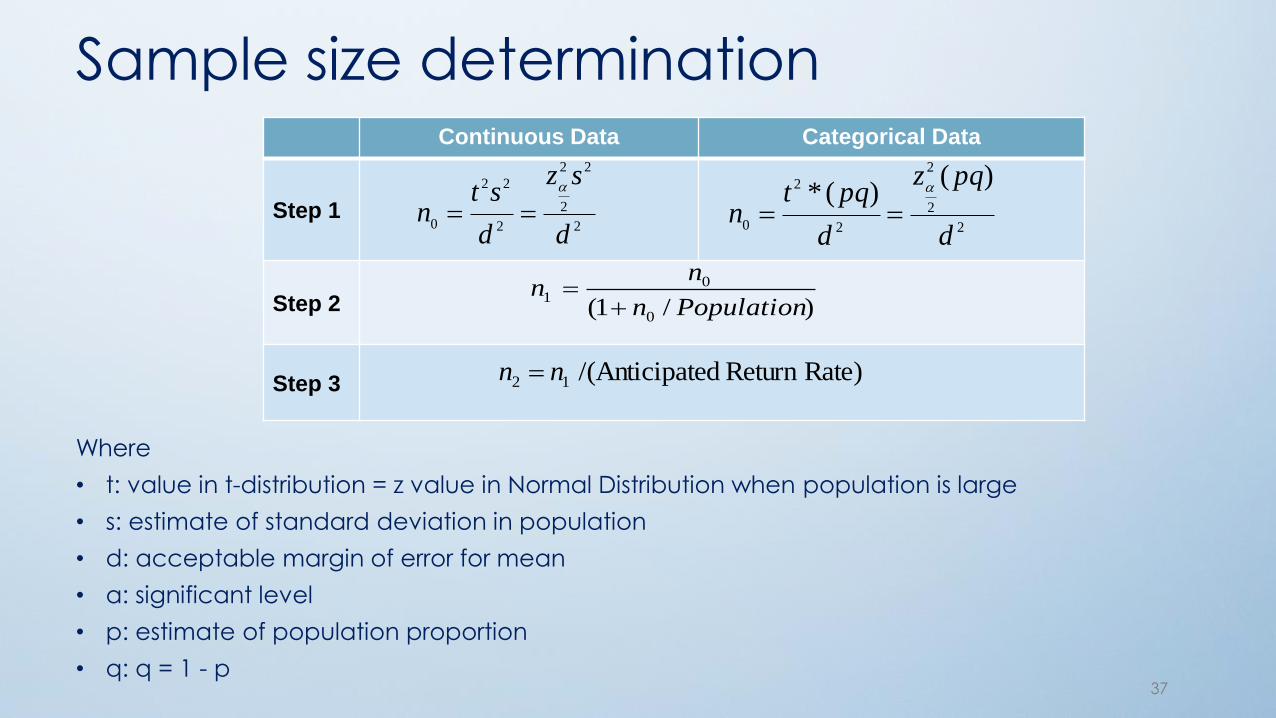
Where
• t: value in t-distribution = z value in Normal Distribution when population is large
• s: estimate of standard deviation in population
• d: acceptable margin of error for mean
• α: significant level
• p: estimate of population proportion
• q: q = 1 - p
Sample size determinationContinuous Data Categorical Data
Step 1
Step 2
Step 3
2
2
2
2
2
0
)()(*
d
pqz
d
pqtn
2
22
2
2
22
0d
sz
d
stn
)/1( 0
01
Populationn
nn
)RateReturn dAnticipate/(12 nn
38
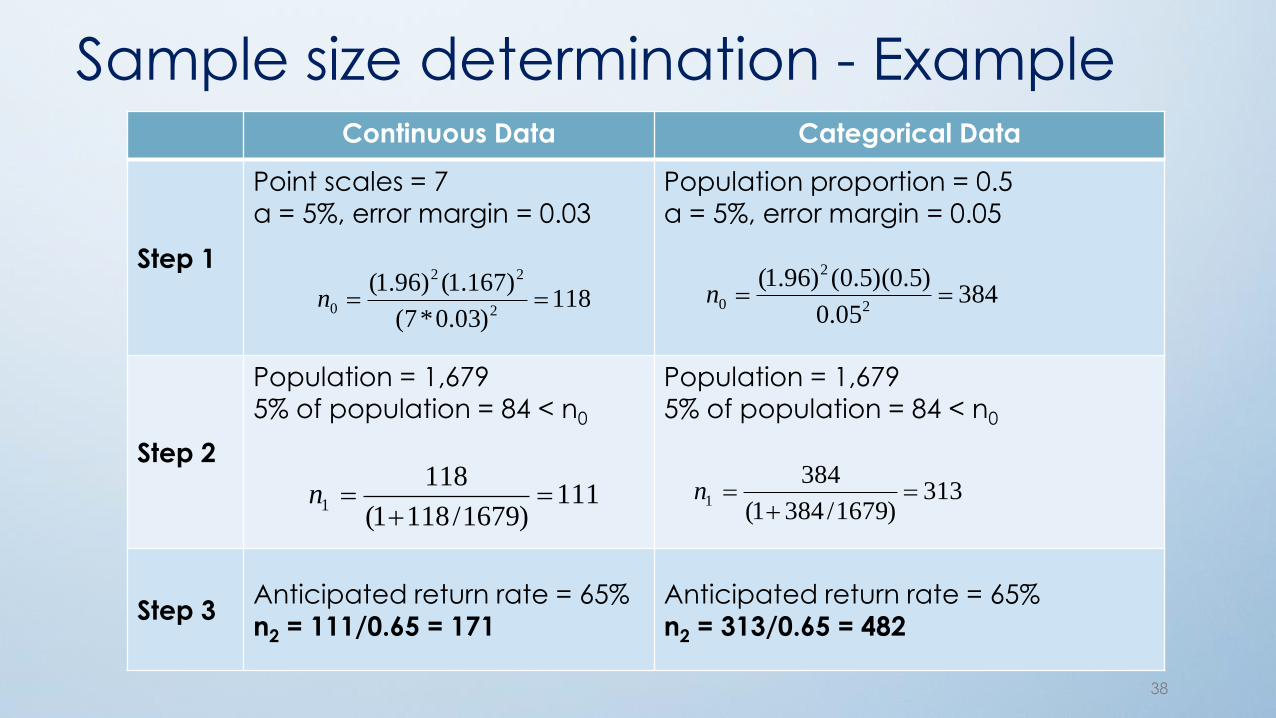
Continuous Data Categorical Data
Step 1
Point scales = 7
α = 5%, error margin = 0.03
Population proportion = 0.5
α = 5%, error margin = 0.05
Step 2
Population = 1,679
5% of population = 84 < n0
Population = 1,679
5% of population = 84 < n0
Step 3Anticipated return rate = 65%
n2 = 111/0.65 = 171
Anticipated return rate = 65%
n2 = 313/0.65 = 482
118)03.0*7(
)167.1()96.1(2
22
0 n 38405.0
)5.0)(5.0()96.1(2
2
0 n
313)1679/3841(
3841
n111
)1679/1181(
1181
n
Sample size determination - Example
39
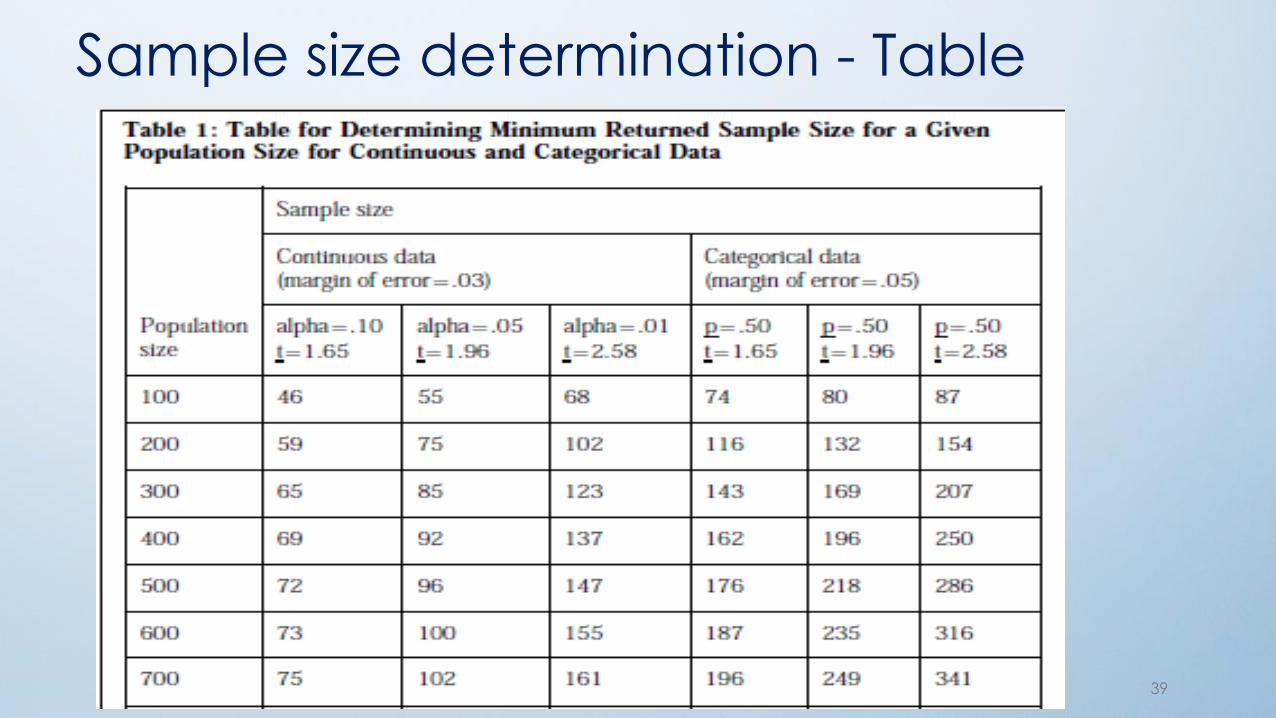
Sample size determination - Table
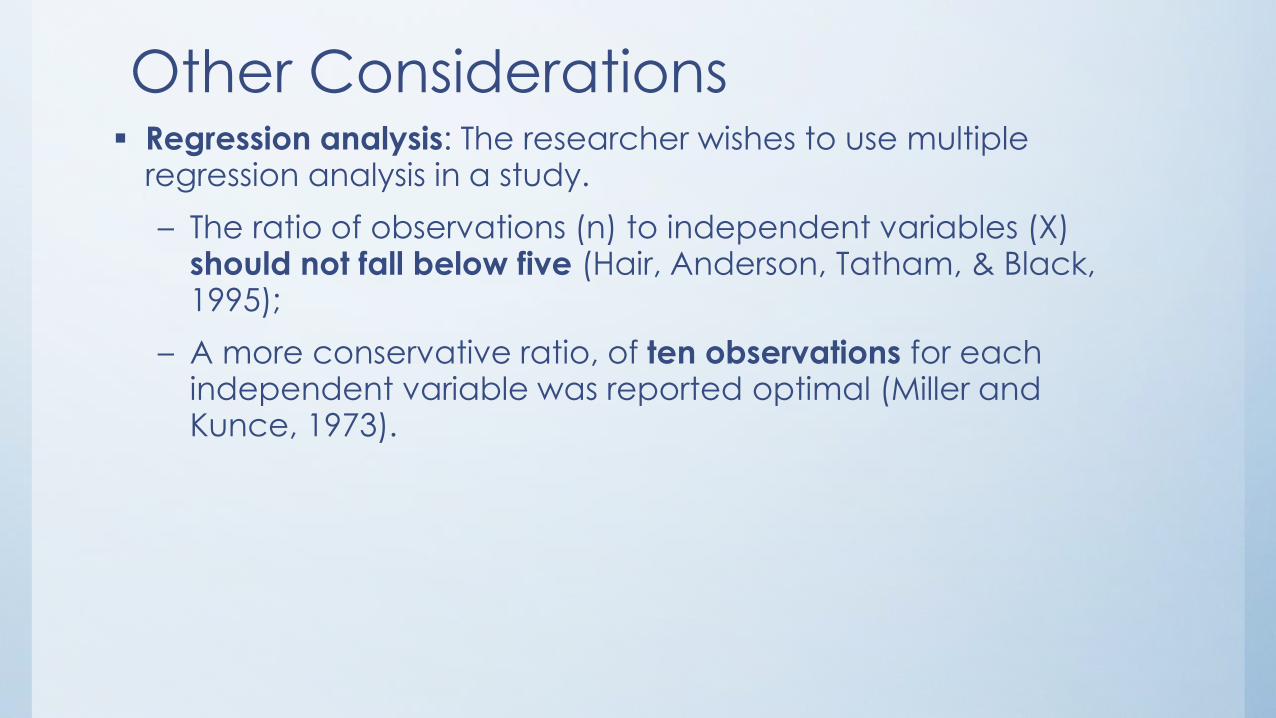
Other Considerations Regression analysis: The researcher wishes to use multiple
regression analysis in a study.
– The ratio of observations (n) to independent variables (X) should not fall below five (Hair, Anderson, Tatham, & Black, 1995);
– A more conservative ratio, of ten observations for each independent variable was reported optimal (Miller and Kunce, 1973).
Other Considerations
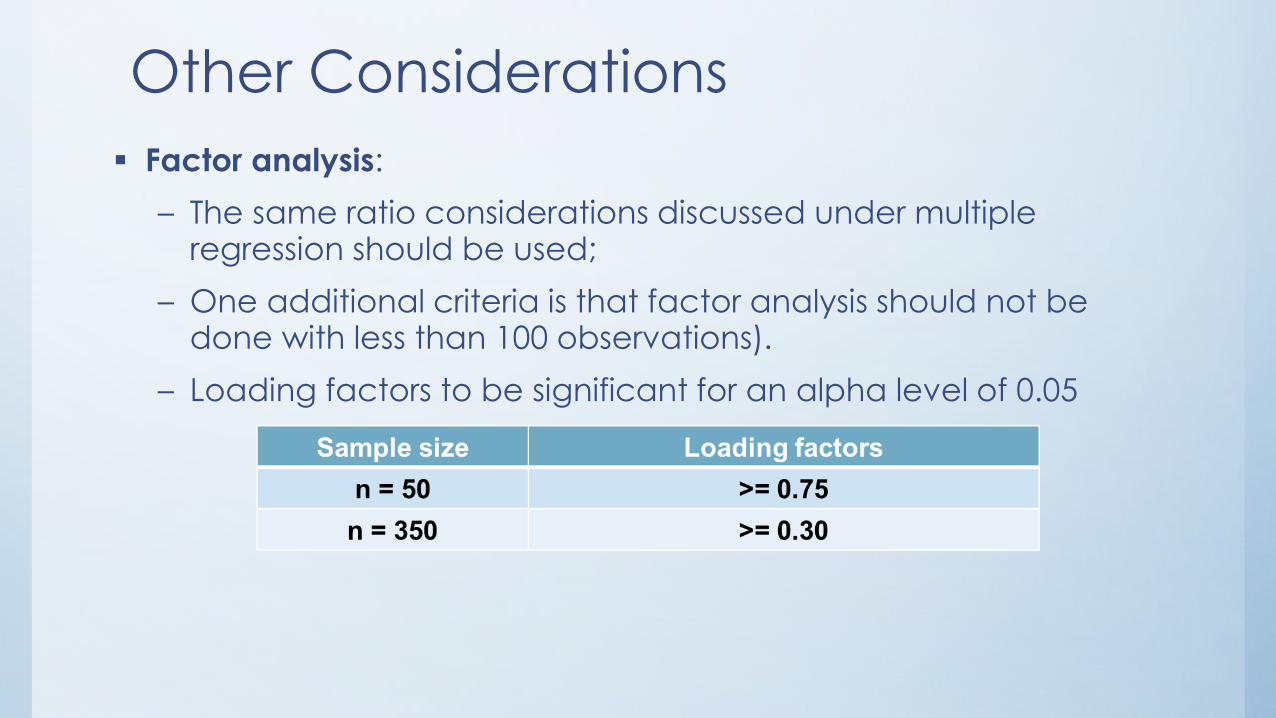
Factor analysis:
– The same ratio considerations discussed under multiple regression should be used;
– One additional criteria is that factor analysis should not be done with less than 100 observations).
– Loading factors to be significant for an alpha level of 0.05
42
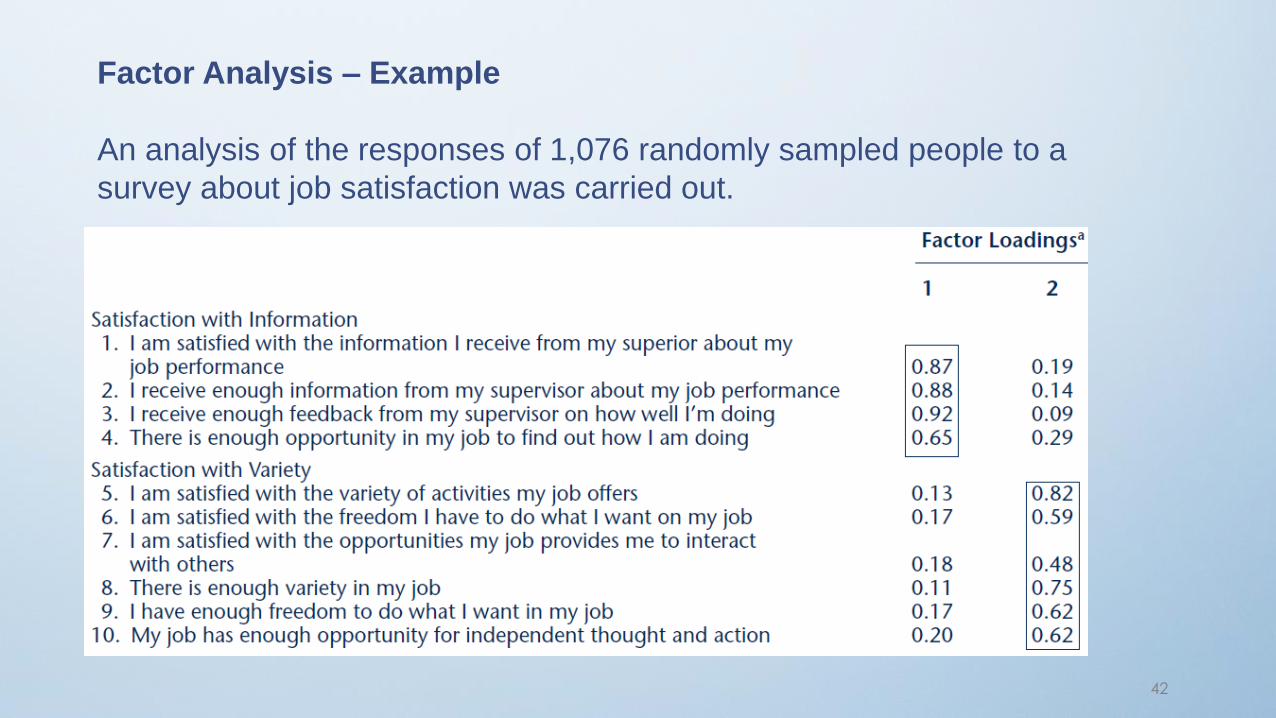
Factor Analysis – Example
An analysis of the responses of 1,076 randomly sampled people to a
survey about job satisfaction was carried out.
Other Considerations
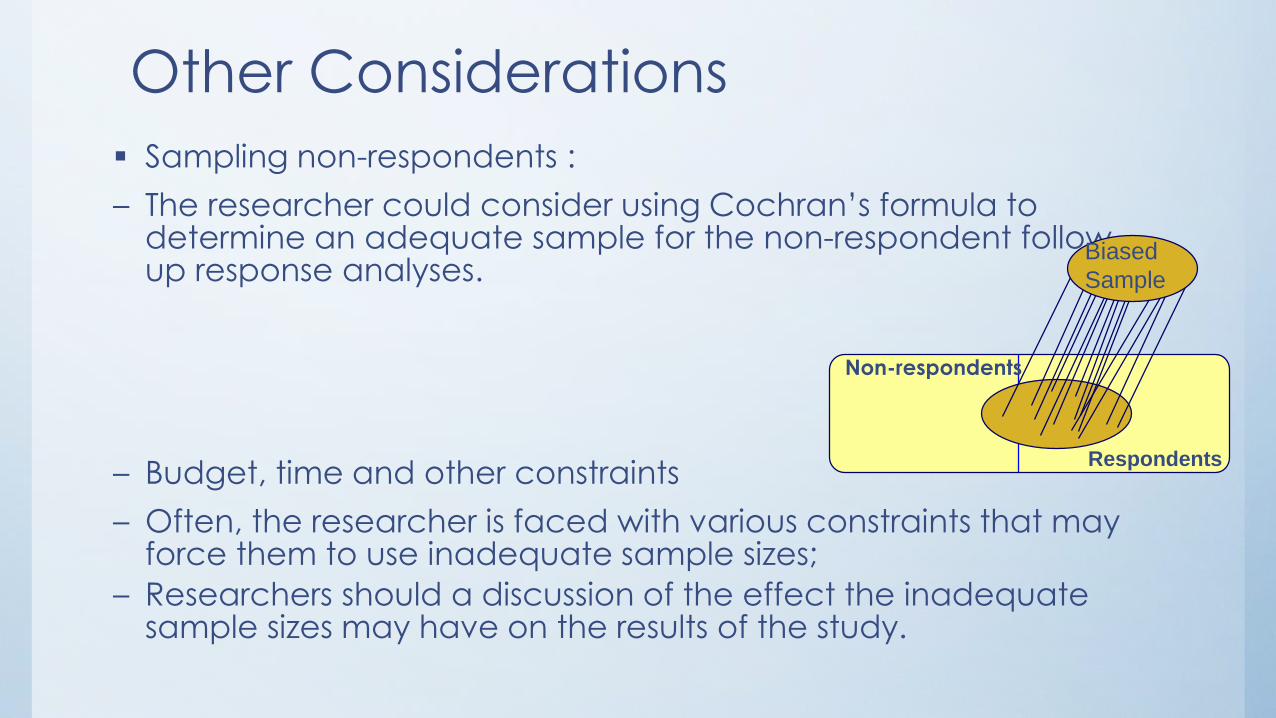
Sampling non-respondents :
– The researcher could consider using Cochran’s formula to determine an adequate sample for the non-respondent follow-up response analyses.
– Budget, time and other constraints
– Often, the researcher is faced with various constraints that may force them to use inadequate sample sizes;
– Researchers should a discussion of the effect the inadequate sample sizes may have on the results of the study.
Non-respondents
Respondents
Biased
Sample
44
Final thoughts
– In general, a researcher could use the standard factors
identified in this paper in the sample size determination
process;
– Using an adequate sample along with high quality data
collection efforts will result in more reliable, valid, and
generalizable results.