Embed Size (px)
Citation preview
1
Then and now: The Price of the american dream
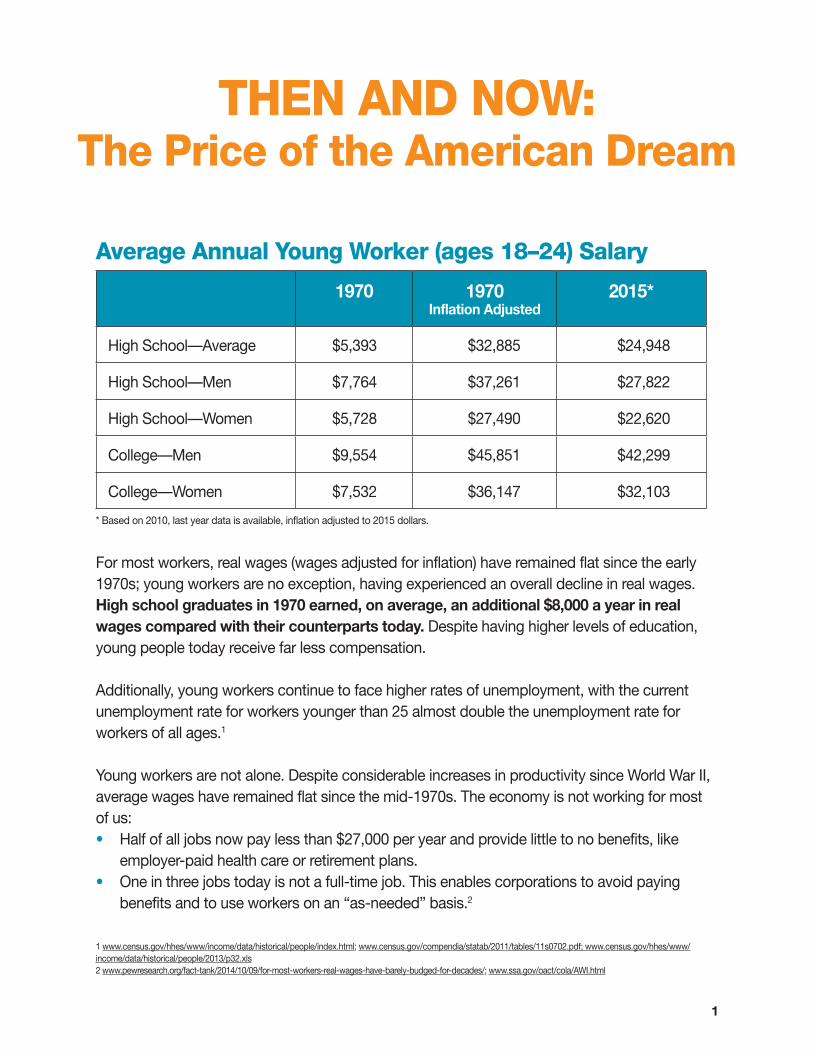
average annual Young worker (ages 18–24) Salary
1970 1970Inflation Adjusted
2015*
High School—Average $5,393 $32,885 $24,948
High School—Men $7,764 $37,261 $27,822
High School—Women $5,728 $27,490 $22,620
College—Men $9,554 $45,851 $42,299
College—Women $7,532 $36,147 $32,103
* Based on 2010, last year data is available, inflation adjusted to 2015 dollars.
For most workers, real wages (wages adjusted for inflation) have remained flat since the early 1970s; young workers are no exception, having experienced an overall decline in real wages. High school graduates in 1970 earned, on average, an additional $8,000 a year in real wages compared with their counterparts today. Despite having higher levels of education, young people today receive far less compensation.
Additionally, young workers continue to face higher rates of unemployment, with the current unemployment rate for workers younger than 25 almost double the unemployment rate for workers of all ages.1
Young workers are not alone. Despite considerable increases in productivity since World War II, average wages have remained flat since the mid-1970s. The economy is not working for most of us: • Half of all jobs now pay less than $27,000 per year and provide little to no benefits, like
employer-paid health care or retirement plans. • One in three jobs today is not a full-time job. This enables corporations to avoid paying
benefits and to use workers on an “as-needed” basis.2
1 www.census.gov/hhes/www/income/data/historical/people/index.html; www.census.gov/compendia/statab/2011/tables/11s0702.pdf; www.census.gov/hhes/www/income/data/historical/people/2013/p32.xls2 www.pewresearch.org/fact-tank/2014/10/09/for-most-workers-real-wages-have-barely-budged-for-decades/; www.ssa.gov/oact/cola/AWI.html
2
Federal Minimum Wage 1970 2015
$1.60/hr. ($9.76) $7.25/hr. The real value of the minimum wage peaked in 1968 at $10.88 an hour. The federal minimum wage has not been raised since 2009, and remains at $7.25 an hour. Communities across the country are taking action to fight for a living wage; 29 states and the District of Columbia, as well as dozens of cities, have passed increases in their minimum wage.
Many people think of minimum wage workers as teenagers entering the labor market with few skills. The profile of a minimum wage worker today is vastly different:• The average age of a minimum wage worker today is 35.• 36% of minimum wage workers are older than 40.
The majority of minimum wage workers today are women (56%) and work full time (55%); on average they earn half of their family’s total income.
Who would benefit from raising the minimum wage? • 35 million workers• 35% of African American workers• 38% of Latino workers• 17.5 million children who have at least one parent who would get a raise3
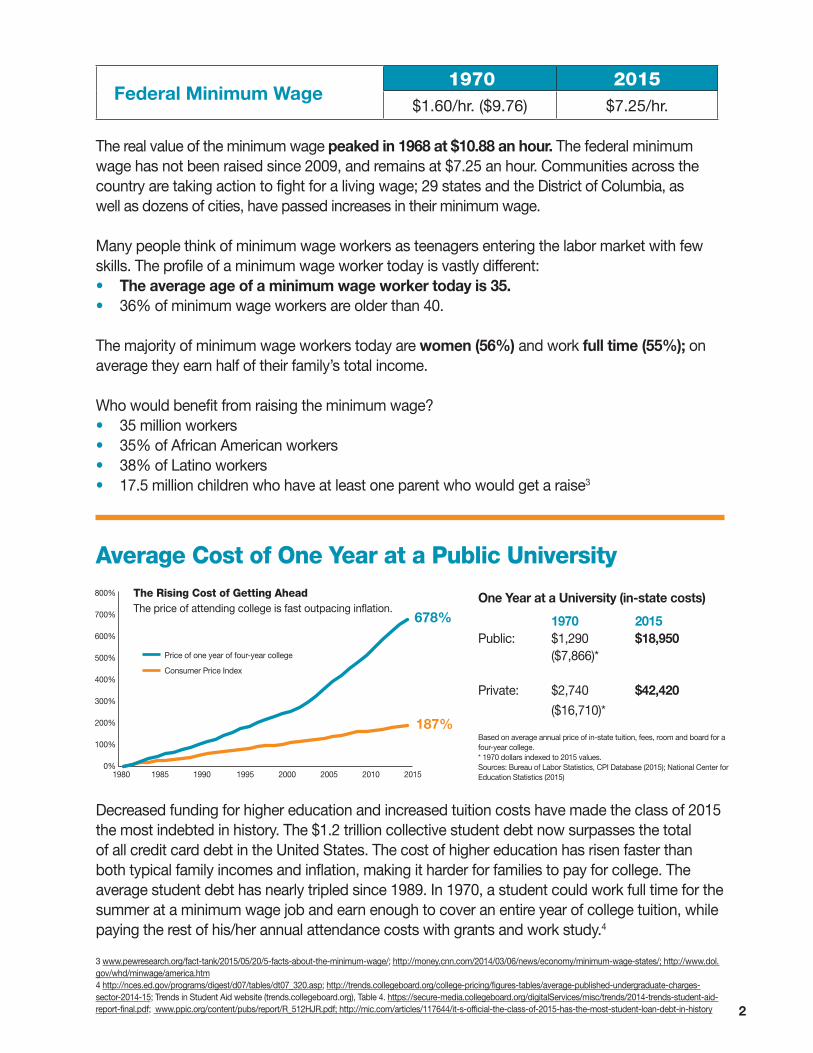
average Cost of one Year at a Public University
Decreased funding for higher education and increased tuition costs have made the class of 2015 the most indebted in history. The $1.2 trillion collective student debt now surpasses the total of all credit card debt in the United States. The cost of higher education has risen faster than both typical family incomes and inflation, making it harder for families to pay for college. The average student debt has nearly tripled since 1989. In 1970, a student could work full time for the summer at a minimum wage job and earn enough to cover an entire year of college tuition, while paying the rest of his/her annual attendance costs with grants and work study.4
3 www.pewresearch.org/fact-tank/2015/05/20/5-facts-about-the-minimum-wage/; http://money.cnn.com/2014/03/06/news/economy/minimum-wage-states/; http://www.dol.gov/whd/minwage/america.htm4 http://nces.ed.gov/programs/digest/d07/tables/dt07_320.asp; http://trends.collegeboard.org/college-pricing/figures-tables/average-published-undergraduate-charges-sector-2014-15; Trends in Student Aid website (trends.collegeboard.org), Table 4. https://secure-media.collegeboard.org/digitalServices/misc/trends/2014-trends-student-aid-report-final.pdf; www.ppic.org/content/pubs/report/R_512HJR.pdf; http://mic.com/articles/117644/it-s-official-the-class-of-2015-has-the-most-student-loan-debt-in-history
800%
700%
600%
500%
400%
300%
200%
100%
0%1980 1985 1990 1995 2000 2005 2010 2015
The Rising Cost of Getting aheadThe price of attending college is fast outpacing inflation.
Price of one year of four-year college
Consumer Price Index
678%
187%
One Year at a University (in-state costs)
1970 2015Public: $1,290 $18,950 ($7,866)*
Private: $2,740 $42,420
($16,710)*
Based on average annual price of in-state tuition, fees, room and board for a four-year college.* 1970 dollars indexed to 2015 values.Sources: Bureau of Labor Statistics, CPI Database (2015); National Center for Education Statistics (2015)
3
Cost of an average Car 1970 2015
* 1970 dollars indexed to 2015 values. $3,450 ($21,040)* $33,560
Global competition in the auto industry was minimal in 1970. The Big 3—Ford, GM and Chrysler—dominated the auto industry within the United States and worldwide. That changed as globalization increased and the rules of the economy changed. Free trade agreements, like NAFTA and CAFTA, were promoted with promises of job creation, economic growth, increased wages and increased competition that would drive down costs to consumers.
Despite the promises, the average cost of a car did not decline, but real wages did. The negative impact of free trade agreements like NAFTA and CAFTA are felt by working people worldwide. Workers across North America saw living wage jobs disappear as employers continue to push down wages and reduce or eliminate benefits like health care and retirement plans. Perhaps no sector is more emblematic of the negative impact of NAFTA on working people than the assembly factories in Mexico that now produce goods formerly manufactured in the United States; manufacturing work that had paid wages high enough to sustain a family on and provide economic stability for U.S. workers. The assembly plants in Mexico are notorious for paying low wages and requiring long work hours in hazardous conditions. Additionally, workers in these plants face severe challenges from employers when they attempt to organize and join unions in order to negotiate together to improve working conditions.5
Cost of a new house 1970 2015
* 1970 dollars indexed to 2015 values. $23,600 ($144,000)* $356,000
Housing expense as a percentage of overall personal income has been steadily rising. The idea of not spending more than 30% of your salary on housing is increasingly difficult, particularly in major metropolitan areas. Fueled by predatory lending (e.g., subprime mortgages), the rates of homeownership reached record levels in the first decade of the 21st century. The subsequent collapse of the housing market wiped out years of accumulated wealth for millions of working people, with the average family losing $21,077 in household wealth. Communities of color were particularly hard hit, losing on average $37,084 in household wealth.6
5 www.aflcio.org/content/download/121921/3393031/March2014_NAFTA20_nb.pdf; www.usatoday.com/story/money/cars/2015/05/04/new-car-transaction-price-3-kbb-kelley-blue-book/26690191/6 www.census.gov/construction/nrs/pdf/uspricemon.pdf (January 2015); www.census.gov/housing/hvs/data/charts/fig05.pdf; www.census.gov/content/dam/Census/programs-surveys/ahs/publications/Drowning_in_Debt.pdf; www.responsiblelending.org/mortgage-lending/research-analysis/collateral-damage.pdf
4
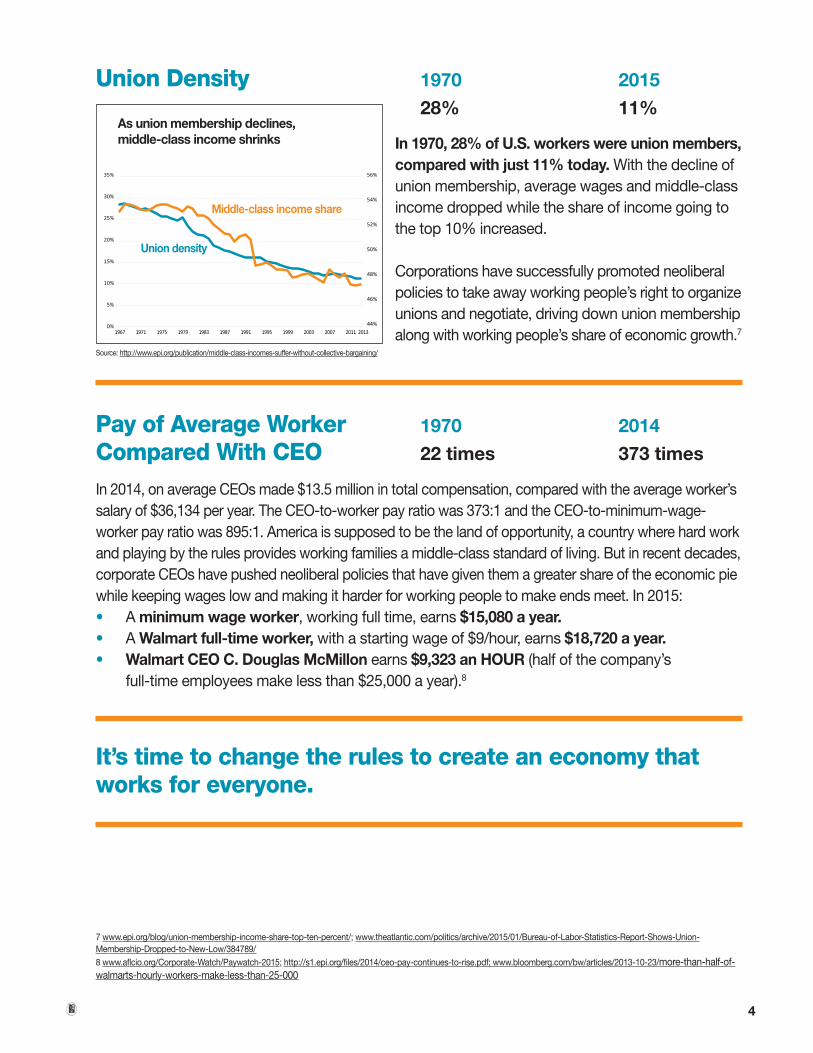
Union density 1970 2015
28% 11%
In 1970, 28% of U.S. workers were union members, compared with just 11% today. With the decline of union membership, average wages and middle-class income dropped while the share of income going to the top 10% increased.
Corporations have successfully promoted neoliberal policies to take away working people’s right to organize unions and negotiate, driving down union membership along with working people’s share of economic growth.7
Pay of average worker 1970 2014
Compared with Ceo 22 times 373 times
In 2014, on average CEOs made $13.5 million in total compensation, compared with the average worker’s salary of $36,134 per year. The CEO-to-worker pay ratio was 373:1 and the CEO-to-minimum-wage-worker pay ratio was 895:1. America is supposed to be the land of opportunity, a country where hard work and playing by the rules provides working families a middle-class standard of living. But in recent decades, corporate CEOs have pushed neoliberal policies that have given them a greater share of the economic pie while keeping wages low and making it harder for working people to make ends meet. In 2015:• A minimum wage worker, working full time, earns $15,080 a year.• A Walmart full-time worker, with a starting wage of $9/hour, earns $18,720 a year.• Walmart CEO C. Douglas McMillon earns $9,323 an HOUR (half of the company’s
full-time employees make less than $25,000 a year).8
It’s time to change the rules to create an economy that works for everyone.
7 www.epi.org/blog/union-membership-income-share-top-ten-percent/; www.theatlantic.com/politics/archive/2015/01/Bureau-of-Labor-Statistics-Report-Shows-Union-Membership-Dropped-to-New-Low/384789/8 www.aflcio.org/Corporate-Watch/Paywatch-2015; http://s1.epi.org/files/2014/ceo-pay-continues-to-rise.pdf; www.bloomberg.com/bw/articles/2013-10-23/more-than-half-of-walmarts-hourly-workers-make-less-than-25-000
Source: http://www.epi.org/publication/middle-class-incomes-suffer-without-collective-bargaining/
As union membership declines, middle-class income shrinks
Union density
Middle-class income share