Embed Size (px)
Citation preview
Agricultural trade, and economic growth in Myanmar
CommentsMaximo Torero ([email protected])
Division Director
&
David Laborde
Senior Researcher and Theme Leader
Markets, Trade and Institutions Division - IFPRI
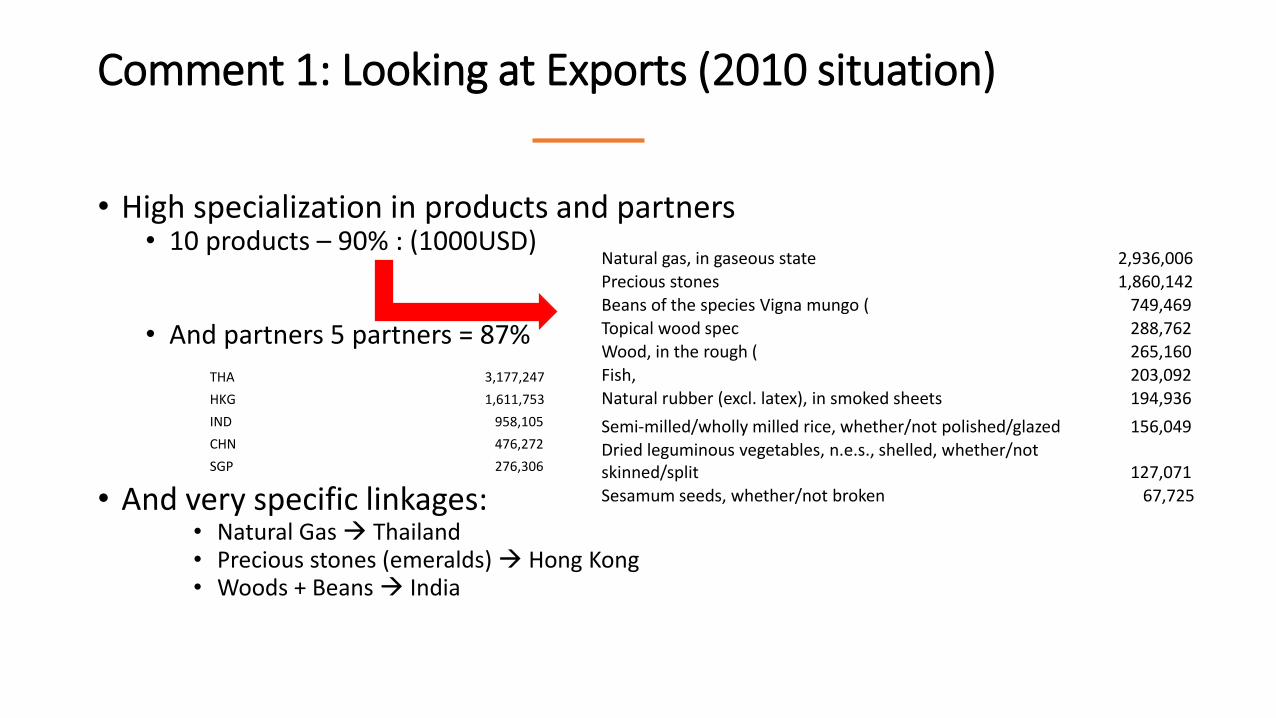
Comment 1: Looking at Exports (2010 situation)
• High specialization in products and partners• 10 products – 90% : (1000USD)
• And partners 5 partners = 87%
• And very specific linkages:• Natural Gas Thailand• Precious stones (emeralds) Hong Kong• Woods + Beans India
Natural gas, in gaseous state 2,936,006 Precious stones 1,860,142
Beans of the species Vigna mungo ( 749,469 Topical wood spec 288,762 Wood, in the rough ( 265,160 Fish, 203,092 Natural rubber (excl. latex), in smoked sheets 194,936
Semi-milled/wholly milled rice, whether/not polished/glazed 156,049
Dried leguminous vegetables, n.e.s., shelled, whether/not skinned/split 127,071
Sesamum seeds, whether/not broken 67,725
THA 3,177,247
HKG 1,611,753
IND 958,105
CHN 476,272
SGP 276,306
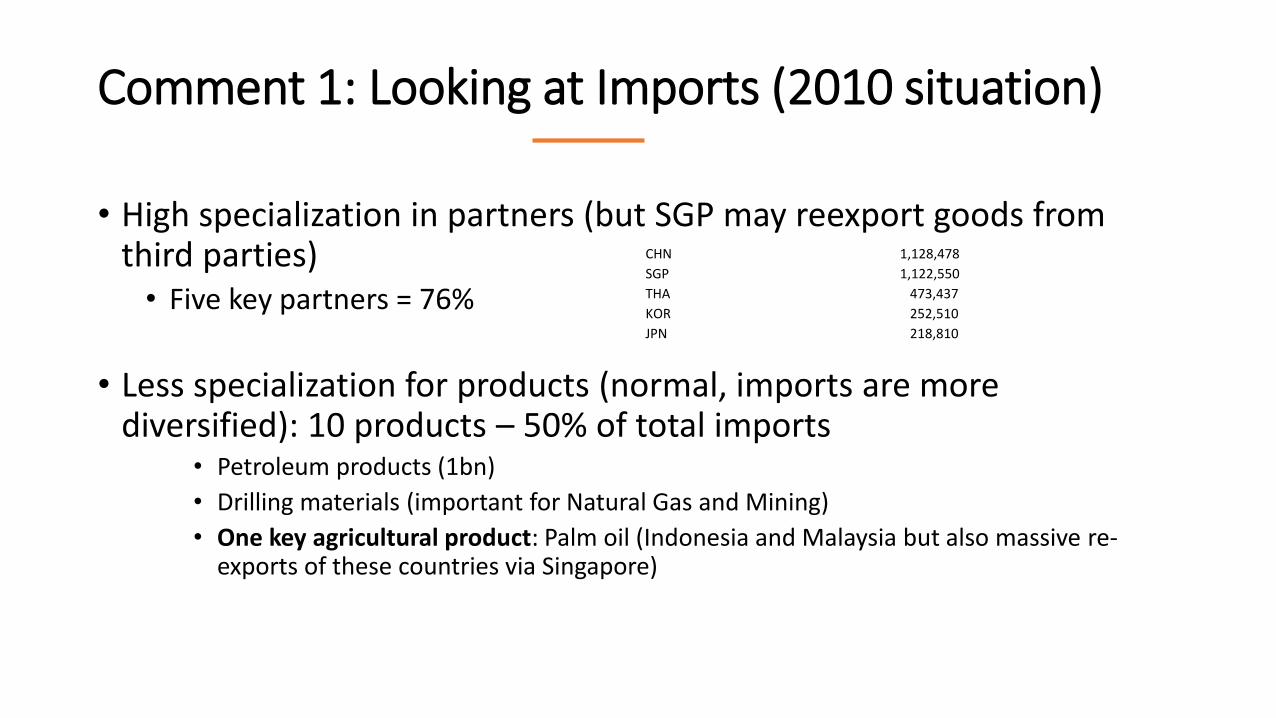
Comment 1: Looking at Imports (2010 situation)
• High specialization in partners (but SGP may reexport goods from third parties)• Five key partners = 76%
• Less specialization for products (normal, imports are more diversified): 10 products – 50% of total imports
• Petroleum products (1bn)
• Drilling materials (important for Natural Gas and Mining)
• One key agricultural product: Palm oil (Indonesia and Malaysia but also massive re-exports of these countries via Singapore)
CHN 1,128,478
SGP 1,122,550
THA 473,437
KOR 252,510
JPN 218,810
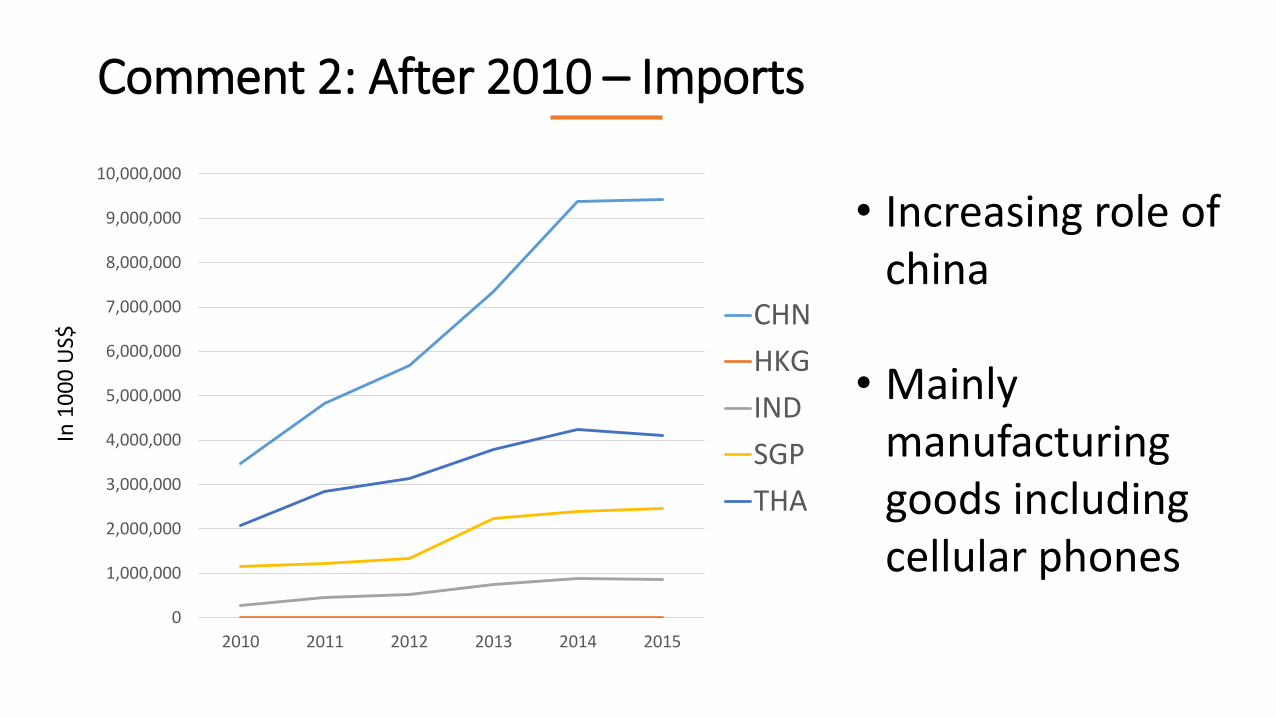
Comment 2: After 2010 – Imports
0
1,000,000
2,000,000
3,000,000
4,000,000
5,000,000
6,000,000
7,000,000
8,000,000
9,000,000
10,000,000
2010 2011 2012 2013 2014 2015
CHN
HKG
IND
SGP
THA
• Increasing role of china
• Mainly manufacturing goods including cellular phones
In 1
00
0 U
S$
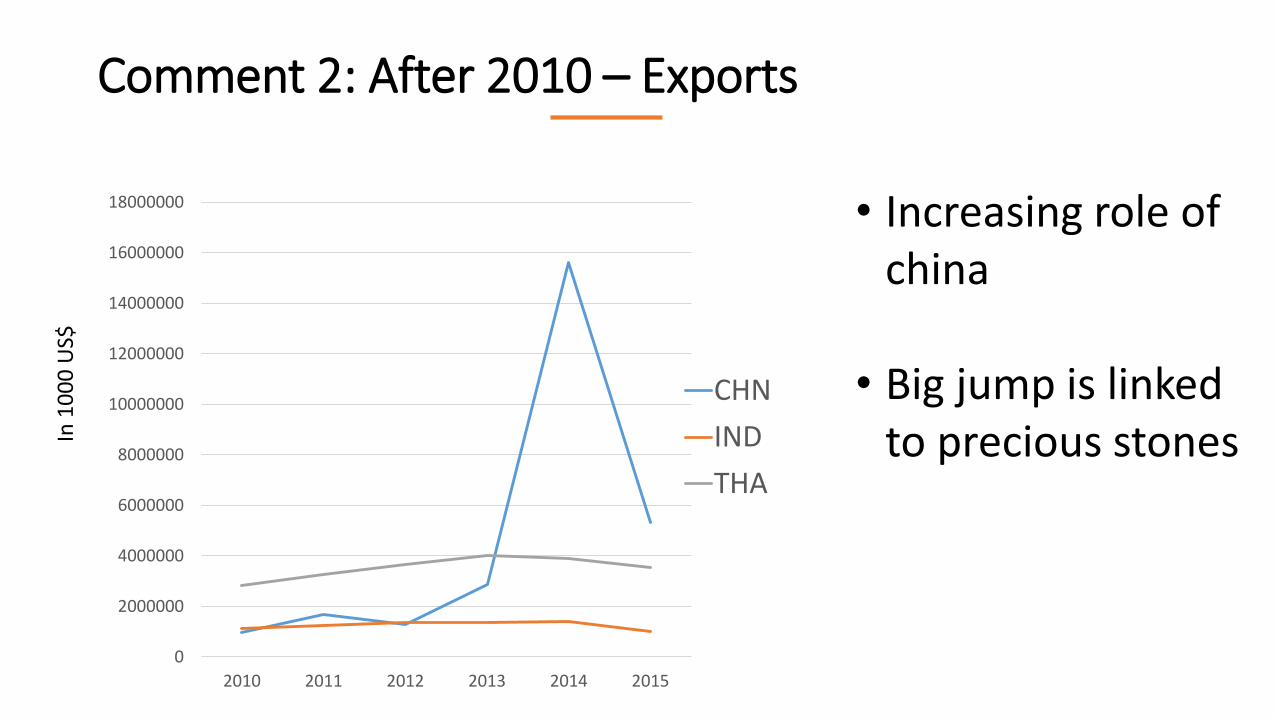
Comment 2: After 2010 – Exports
• Increasing role of china
• Big jump is linked to precious stonesIn
10
00
US$
0
2000000
4000000
6000000
8000000
10000000
12000000
14000000
16000000
18000000
2010 2011 2012 2013 2014 2015
CHN
IND
THA
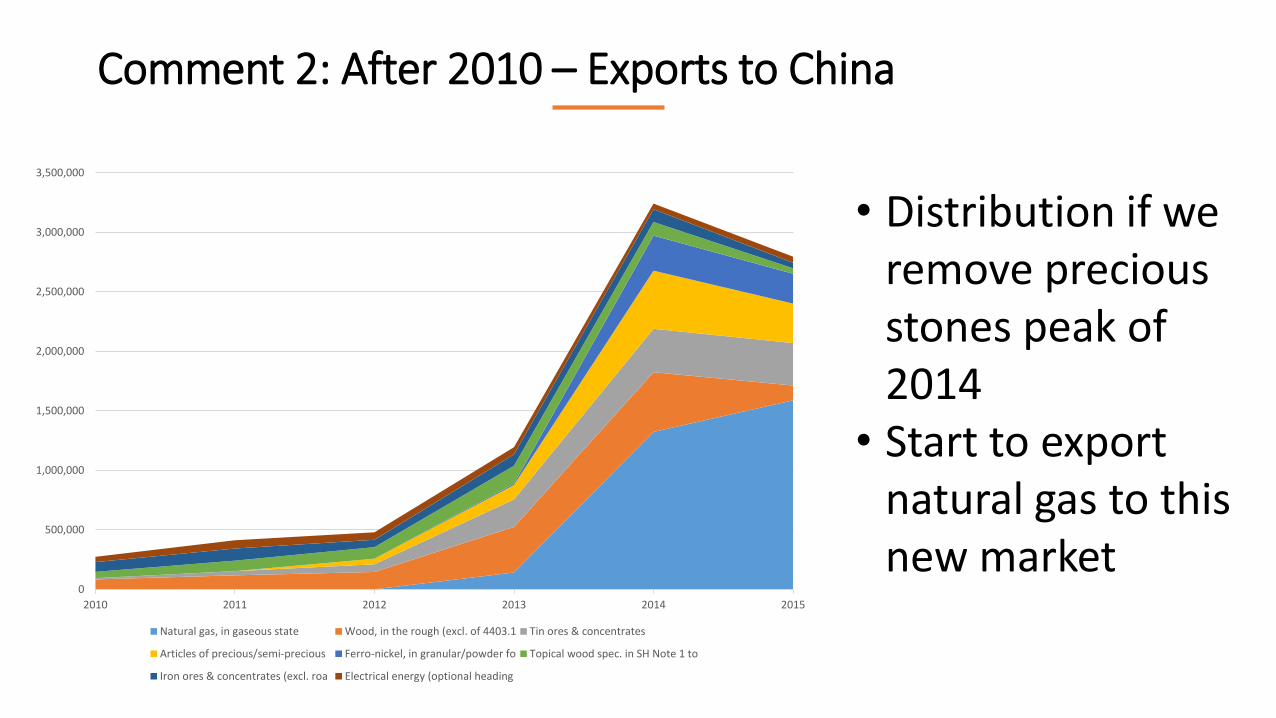
Comment 2: After 2010 – Exports to China
• Distribution if we remove precious stones peak of 2014
• Start to export natural gas to this new market
0
500,000
1,000,000
1,500,000
2,000,000
2,500,000
3,000,000
3,500,000
2010 2011 2012 2013 2014 2015
Natural gas, in gaseous state Wood, in the rough (excl. of 4403.1 Tin ores & concentrates
Articles of precious/semi-precious Ferro-nickel, in granular/powder fo Topical wood spec. in SH Note 1 to
Iron ores & concentrates (excl. roa Electrical energy (optional heading
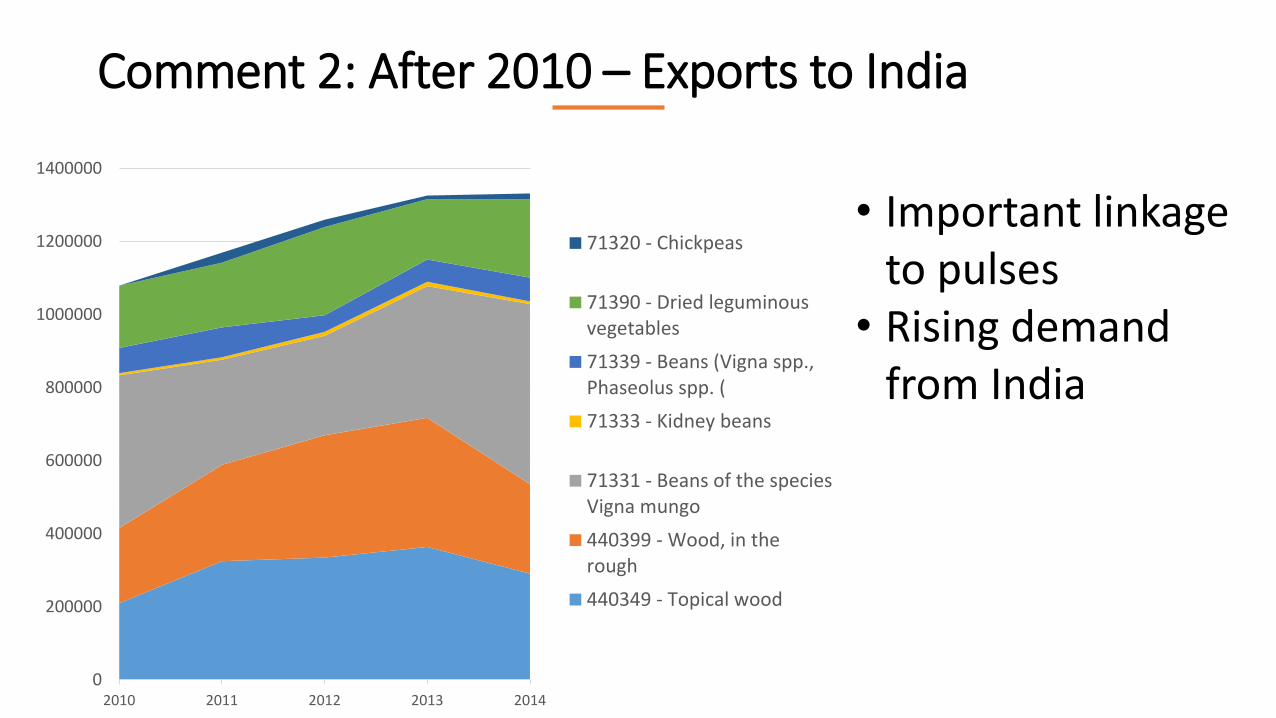
Comment 2: After 2010 – Exports to India
• Important linkage to pulses
• Rising demand from India
0
200000
400000
600000
800000
1000000
1200000
1400000
2010 2011 2012 2013 2014
71320 - Chickpeas
71390 - Dried leguminousvegetables
71339 - Beans (Vigna spp.,Phaseolus spp. (
71333 - Kidney beans
71331 - Beans of the speciesVigna mungo
440399 - Wood, in therough
440349 - Topical wood
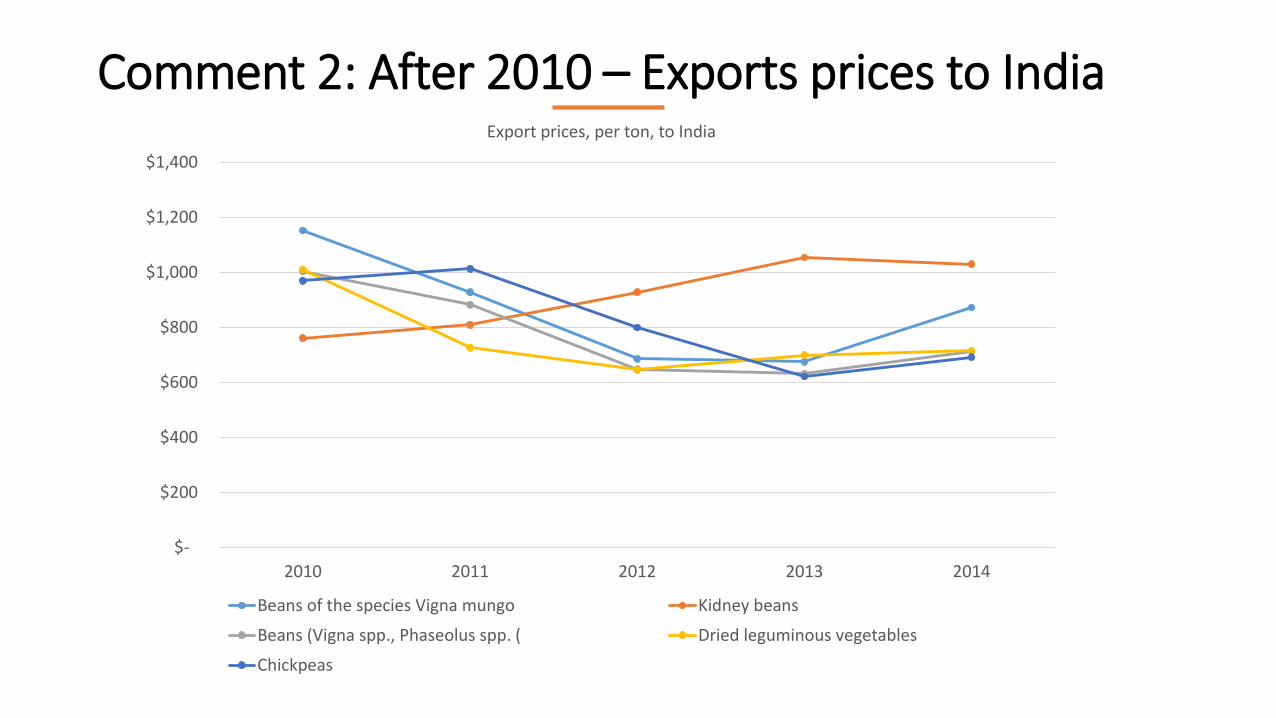
Comment 2: After 2010 – Exports prices to India
$-
$200
$400
$600
$800
$1,000
$1,200
$1,400
2010 2011 2012 2013 2014
Export prices, per ton, to India
Beans of the species Vigna mungo Kidney beans
Beans (Vigna spp., Phaseolus spp. ( Dried leguminous vegetables
Chickpeas
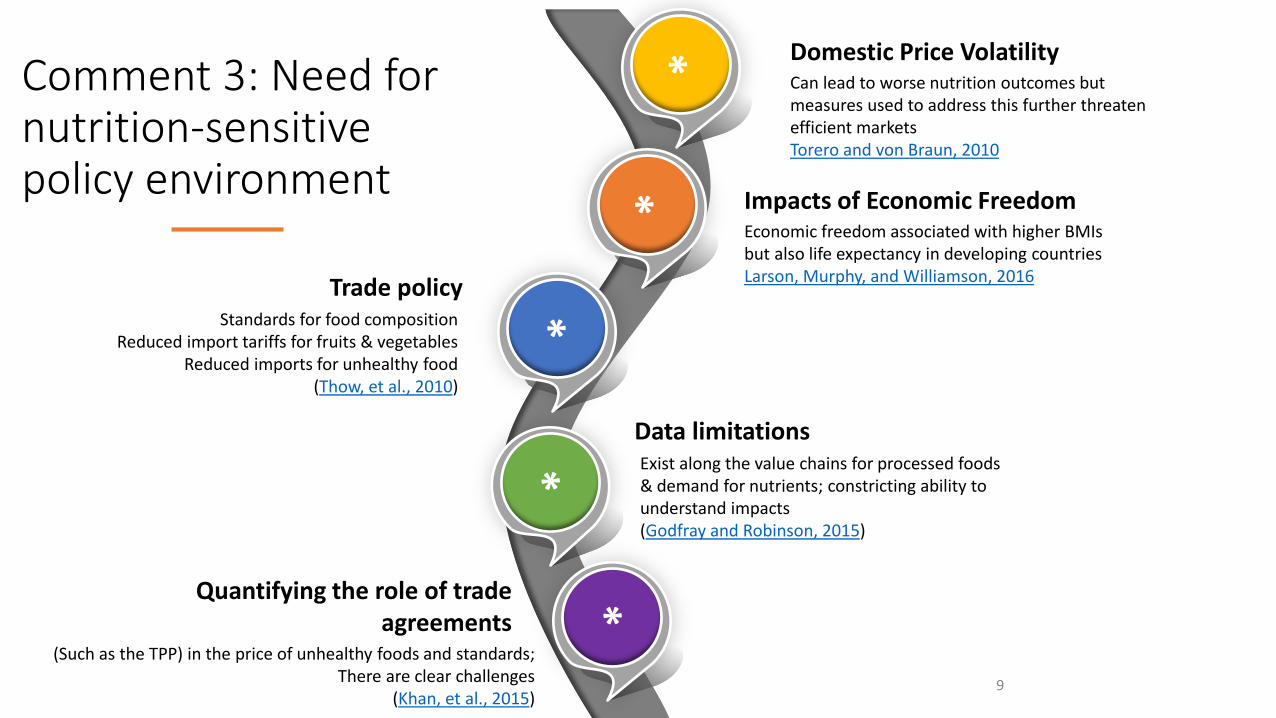
Comment 3: Need for nutrition-sensitive policy environment
9
Domestic Price VolatilityCan lead to worse nutrition outcomes but measures used to address this further threaten efficient marketsTorero and von Braun, 2010
Trade policy Standards for food composition
Reduced import tariffs for fruits & vegetablesReduced imports for unhealthy food
(Thow, et al., 2010)
Quantifying the role of trade agreements
(Such as the TPP) in the price of unhealthy foods and standards; There are clear challenges
(Khan, et al., 2015)
Impacts of Economic FreedomEconomic freedom associated with higher BMIs but also life expectancy in developing countries Larson, Murphy, and Williamson, 2016
Data limitationsExist along the value chains for processed foods & demand for nutrients; constricting ability to understand impacts (Godfray and Robinson, 2015)
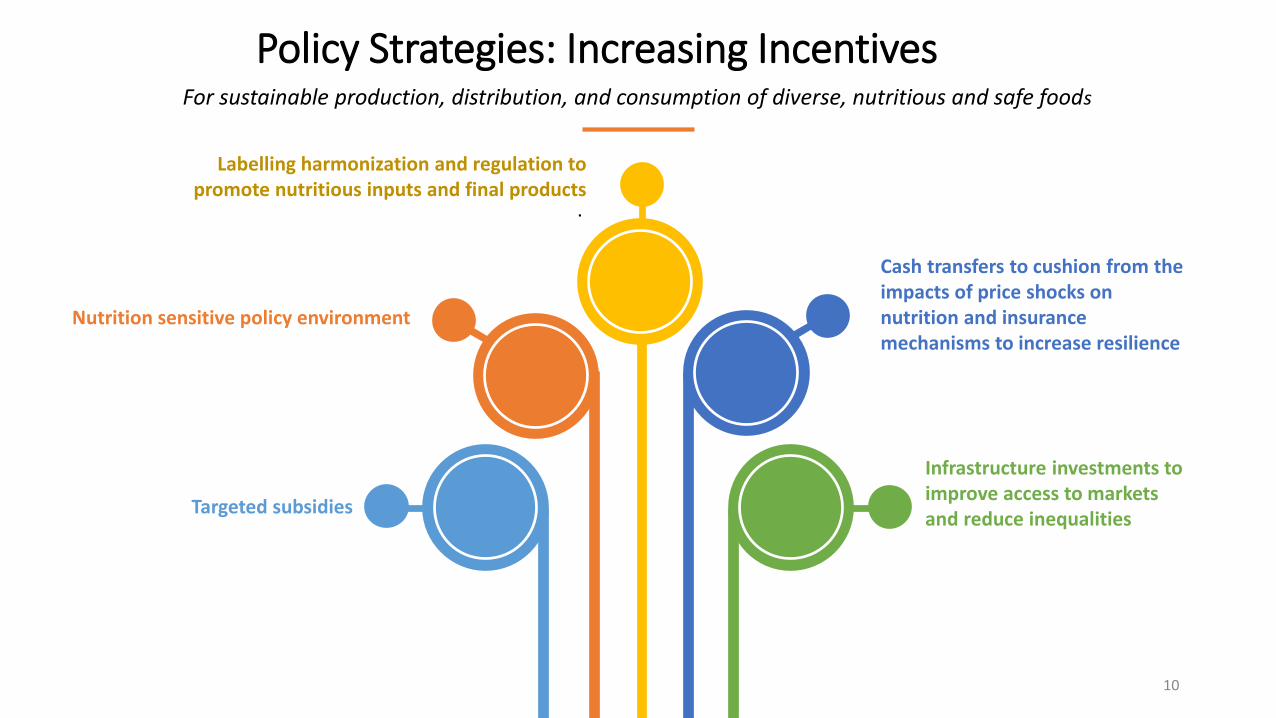
Policy Strategies: Increasing Incentives
10
For sustainable production, distribution, and consumption of diverse, nutritious and safe foods
Infrastructure investments to improve access to markets and reduce inequalities
Cash transfers to cushion from the impacts of price shocks on nutrition and insurance mechanisms to increase resilience
.
Labelling harmonization and regulation to promote nutritious inputs and final products
Nutrition sensitive policy environment
Targeted subsidies
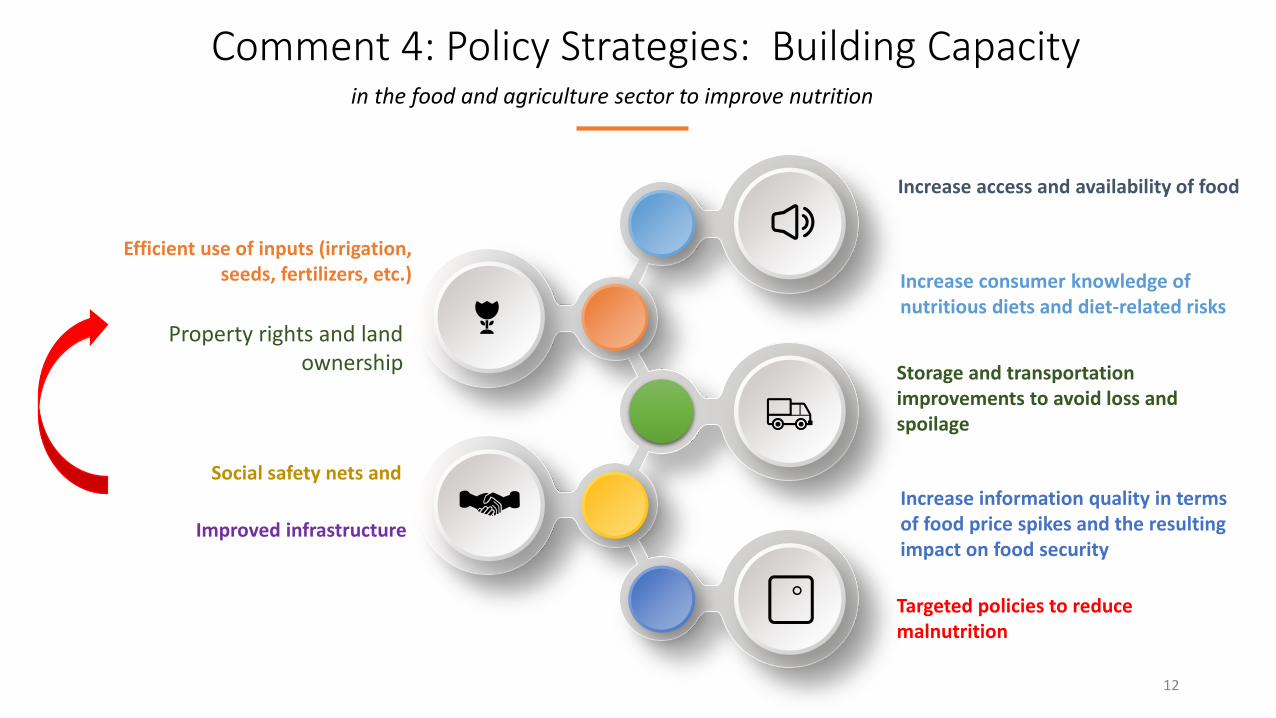
Comment 4: Policy Strategies: Building Capacity
12
in the food and agriculture sector to improve nutrition
Increase consumer knowledge of nutritious diets and diet-related risks
Storage and transportation improvements to avoid loss and spoilage
Increase information quality in terms of food price spikes and the resulting impact on food security
Social safety nets and
Efficient use of inputs (irrigation, seeds, fertilizers, etc.)
Targeted policies to reduce malnutrition
Property rights and land ownership
Improved infrastructure
Increase access and availability of food