Embed Size (px)
Citation preview
Community & Transportation Preferences Survey
Webinar: August 5, 2015
Hugh Morris, AICP, LEED
Realtor.org
1
Jennifer Dill, Ph.D.
trec.pdx.edu
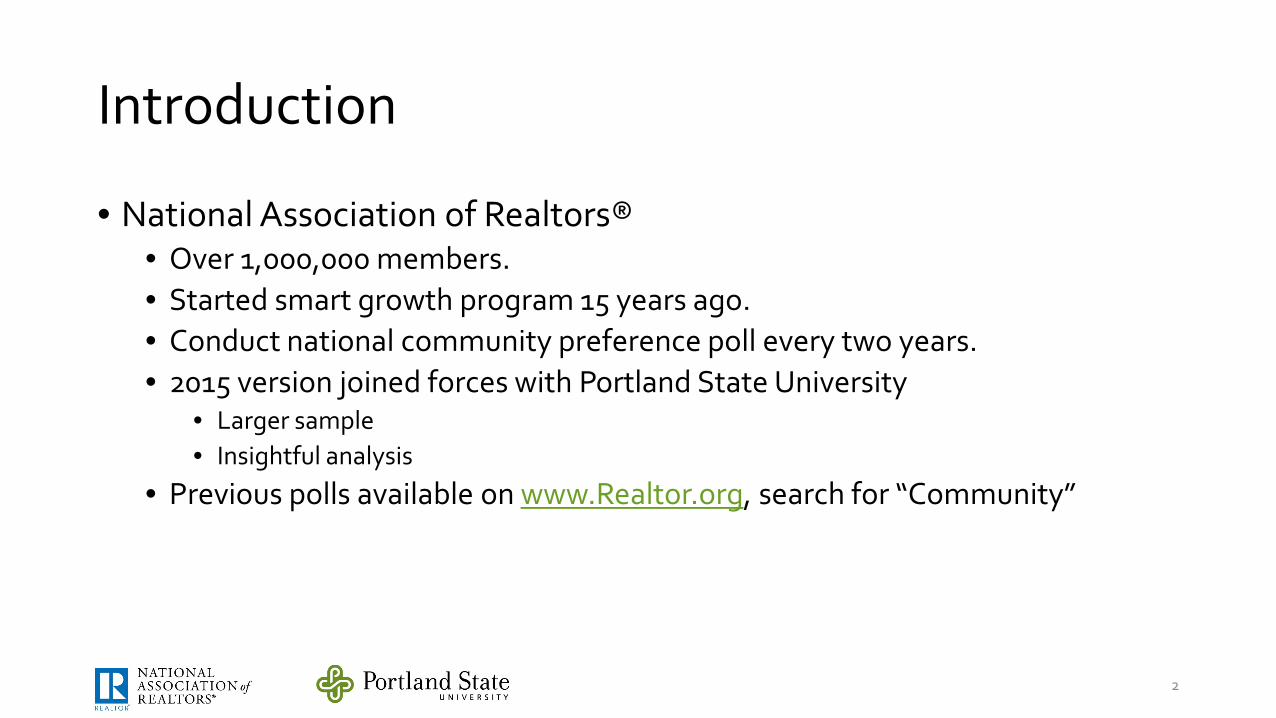
Introduction
• National Association of Realtors®• Over 1,000,000 members.• Started smart growth program 15 years ago.• Conduct national community preference poll every two years.• 2015 version joined forces with Portland State University
• Larger sample• Insightful analysis
• Previous polls available on www.Realtor.org, search for “Community”
2

Methodology: Summary• The sample included adults living in the 50 largest metropolitan
statistical areas (MSAs) in the U.S.• The survey was conducted May 13-19, 2015.• 1,000 respondents were interviewed by phone by American
Strategies (679 by landline and 322 by wireless phone). Margin of error 3.1%
• 2,000 respondents were surveyed on-line by YouGov. Margin of error 2.2%
• Responses were weighted to better match demographics according to the American Community Survey and the two samples were combined.
3

Methodology: Metro Areas Sampled
4

Our Sample vs. ACS (Census) dataThe survey sample is pretty similar to the population
5
50 largest MSAs
Survey sample
HH Income (2013 3yr ACS)
Less Than $15,000 11.7% 11.2%$15,000 to less than $50,000 31.7% 38.2%$50,000 to less than $75,000 17.5% 18.9%$75,000 to less than $100,000 12.2% 12.2%$100,000 to less than $150,000 14.4% 10.6%$150,000 or more 12.6% 8.9%
Gender (2013 ACS 5yr)Male 49.0% 47.6%Female 51.0% 52.4%
Age (2013 ACS 5yr)
18 to 24 years 12.6% 10.9%25 to 34 years 18.7% 17.0%35 to 44 years 18.2% 17.3%45 to 54 years 19.1% 17.9%55 to 64 years 15.2% 19.3%65 to 74 years 8.8% 11.1%75 or older 7.3% 6.5%
Education - 25 years and over (2013 ACS 5yr)
Did not complete high school 13.6% 6.3%High school graduate (includes equivalency)
25.0% 29.1%
Some college or Associates 28.0% 30.0%Bachelor's degree 20.7% 21.3%Graduate or professional degree 12.7% 11.9%

Findings: Everyday travel How often are people walking, bicycling, and taking transit?
What do they think about these travel modes?
Why do they walk/bike/take transit and why not?
6

0%
20%
40%
60%
80%
100%
taki
ng tr
ansi
t
driv
ing
wal
king
ridin
g a
bike
taki
ng tr
ansi
t
driv
ing
wal
king
ridin
g a
bike
taki
ng tr
ansi
t
driv
ing
wal
king
ridin
g a
bike
taki
ng tr
ansi
t
driv
ing
wal
king
ridin
g a
bike
Millennial Gen X Baby Boomers Silent/ Greatest
Strongly agree Somewhat agree
+2%-11%
+8%
“I like walking” Attitudes are an important determinant of people’s travel behavior.
Of all four modes, walking was liked the most. But, while everyone likes walking, Millennials like it 12 percentage points higher than driving (83% agree that they like walking vs. 71% like driving). This is the largest gap of any generation.
+12%
7
Q27-32. Now, I’d like to ask about your preferences regarding your daily travel. For each statement, please tell me if you strongly disagree, somewhat disagree, somewhat agree, or strongly agree. I like…

Walkingin the past 30 daysMillennials walked an average of 13.3 days in the past 30 days, the highest of any generation (though not significantly higher than Gen X).
Walking frequency increases with income and education.
11%11%
20%26%
14%17%
10%18%
18%16%
12%
21%15%
11%
16%17%
16%17%
16%19%17%
15%13%13%
17%
48%46%
42%37%
47%42%
46%44%
41%45%
50%
36%45%
52%
46%37%
42%40%
42%41%41%
47%46%
48%44%
0% 20% 40% 60% 80% 100%
Millennial (Born 1981 or later)Gen X (Born 1965 to 1980)
Baby Boomers (Born 1945 to 1964)Silent/Greatest Generation (Born 1944…
MaleFemale
Kids in HHNo kids in HH
Less than $50k$50k to <$100k
$100k and above
HS grad or lessNon-college post H.S. & Some college
College grad (incl. grad school)
White (non-Hispanic)African American, Black
AsianHispanic/Mexican
Los AngelesMiddle America
North EastWest Coast
New York CitySouth
South West
Never Once a week or less 2-3 days a week 4 or more days a week8
Q51. In the past 30 days, how many days did you take a walk outside for more than 10 minutes including walking the dog and walks for exercise?0=Never; 1-4=Once a week or less; 5-15=2-3 days a week; 16+ = 4 or more days a week

Millennials are most likely to walk for transportationOver 30% of Millennials reported walking to or from work/school in the past 30 days, compared to less then 20% of Gen Xers or Baby Boomers. Over 60% of Millennials reported walking for errands, shopping or eating out.
Gen Xers and Baby Boomers were more likely than Millennials to walk for exercise.
32% 32%
18%
62%
75%
19%23% 20%
54%
86%
13%17%
6%
53%
83%
3%8%
2%
39%
72%
To/from work orschool
To/from publictransportation
Escorting childrento/from school
Running errands,shopping, or eating
out
Just for exercise,including walking the
dog
Millennial (Born 1981 or later)
Gen X (Born 1965 to 1980)
Baby Boomers (Born 1945 to 1964)
Silent/ Greatest Generation (Born 1944 or before)
9
Q52-56. Were any of these walks you took…

Reasons for not walking more: Neighborhood design is importantNot having places within walking distance is a major barrier for everyone, but a little less so for Millennials.
Millennials were more likely to cite safety from crime as a reason for not walking more.
While health is a major motivation for walking, it is also a barrier, particularly for the oldest generation.
65%
54%
43%
31%
18%
25%29%
69%
59%
42%
32%
17%
27%
22%
70%
53%
39%
26%29%
22% 21%
72%
40%38%
18%
43%
19% 18%
The places I need togo are too far to
walk
Need vehicle forwork/school/other
reasons
Poor/unpredictableweather
Too few sidewalksor trails
My health I do not feel safebecause of traffic
I do not feel safebecause of crime
Millennial (Born 1981 or later) Gen X (Born 1965 to 1980)
Baby Boomers (Born 1945 to 1964) Silent/ Greatest Generation (Born 1944 or before)
% saying “yes” this is a
reason I do not walk
more.
10
Q63-69. Now I’d like you to think about things that may keep you from doing more walking. Please tell me if any of the following keep you from doing more walking? Would you say it’s because…

Biking in the past 30 days72% stated they were physically able to ride a bicycle and knew how. Of those, 24% rode a bicycle in the past 30 days. Most of those people only rode for exercise, and not to go to work, errands, or other transportation purposes.
Gen Xers were the most likely generation to ride, though Millennials were the most likely to have ridden for transportation.
People with kids were more likely to ride only for exercise.
10%
13%10%
8%3%
12%7%
10%9%
13%7%8%
11%8%
9%
7%11%
13%17%
20%7%7%
12%13%
8%8%
15%
13%18%
13%11%
17%12%
21%12%
12%15%
19%
13%15%
16%
15%13%
11%13%
10%16%
14%12%
14%17%
15%
0% 5% 10% 15% 20% 25% 30% 35%
Overall
Millennial (Born 1981 or later)Gen X (Born 1965 to 1980)
Baby Boomers (Born 1945 to 1964)Silent/Greatest Generation (Born 1944 or before)
MaleFemale
Kids in HHNo kids in HH
Less than $50k$50k to <$100k
$100k and above
HS grad or lessNon-college post H.S. & Some college
College grad (incl. grad school)
White (non-Hispanic)African American, Black
AsianHispanic/Mexican
Los AngelesMiddle America
North EastWest Coast
New York CitySouth
South West
Biked in the past 30 days (of those physically able to)
Biked for transportation Biked only for exercise11
Q72. In the past 30 days, about how many days did you ride a bicycle outside including bicycling for exercise? (Asked if able to ride bicycle and know how in bike or if physical limitation was a temporary condition)Note: People who biked for transportation (red in the graph) may also have biked for exercise.
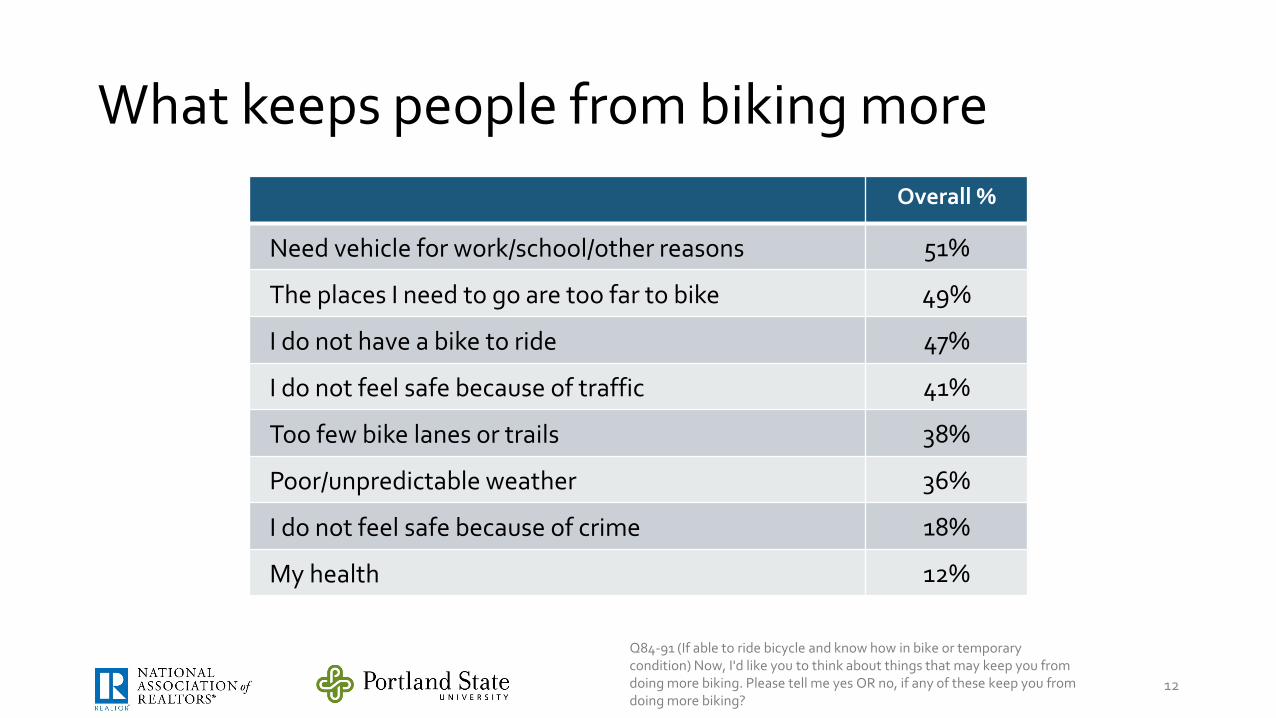
What keeps people from biking more
12
Overall %
Need vehicle for work/school/other reasons 51%
The places I need to go are too far to bike 49%
I do not have a bike to ride 47%
I do not feel safe because of traffic 41%
Too few bike lanes or trails 38%
Poor/unpredictable weather 36%
I do not feel safe because of crime 18%
My health 12%
Q84-91 (If able to ride bicycle and know how in bike or temporary condition) Now, I'd like you to think about things that may keep you from doing more biking. Please tell me yes OR no, if any of these keep you from doing more biking?

Reason for not biking: Places are too far awayAbout half of the adults say that the places they need to get to are too far away to bicycle. This is generally true for all the demographic groups, pointing to people’s complex travel needs and current land use patterns that separate many destinations.
49%
49%48%
50%48%
46%52%
50%49%
49%52%
50%
50%45%
52%
52%44%
54%47%
45%50%
48%49%
37%54%
52%
Overall
Millennial (Born 1981 or later)Gen X (Born 1965 to 1980)
Baby Boomers (Born 1945 to 1964)Silent/Greatest Generation (Born 1944…
MaleFemale
Kids in HHNo kids in HH
Less than $50k$50k to <$100k
$100k and above
HS grad or lessNon-college post H.S. & Some college
College grad (incl. grad school)
White (non-Hispanic)African American, Black
AsianHispanic/Mexican
Los AngelesMiddle America
North EastWest Coast
New York CitySouth
South West
The places I need to go are too far to bike
13
Q84 (If able to ride bicycle and know how in bike or temporary condition) Now, I'd like you to think about things that may keep you from doing more biking. Please tell me yes OR no, if any of these keep you from doing more biking?

Reason for not biking: Don’t have a bikeJust under half (47%) of the adults who are physically able to ride a bicycle cite not having a bike as a reason for not riding.
This is a barrier particularly for people with lower incomes and for women.
47%
50%
44%
46%
55%
43%
51%
41%
50%
54%
44%
37%
52%
47%
43%
46%
52%
50%
49%
Overall
Millennial (Born 1981 or later)
Gen X (Born 1965 to 1980)
Baby Boomers (Born 1945 to 1964)
Silent/Greatest Generation (Born 1944…
Male
Female
Kids in HH
No kids in HH
Less than $50k
$50k to <$100k
$100k and above
HS grad or less
Non-college post H.S. & Some college
College grad (incl. grad school)
White (non-Hispanic)
African American, Black
Asian
Hispanic/Mexican
I do not have a bike to ride
14
Q91 (If able to ride bicycle and know how in bike or temporary condition) Now, I'd like you to think about things that may keep you from doing more biking. Please tell me yes OR no, if any of these keep you from doing more biking?

Reason for not biking: Traffic and lack of bike lanesNot feeling safe because of traffic was generally a bigger reason for not biking than the lack of bike lanes or trails. The responses were not always consistent for these two barriers within demographic groups, indicating that for some people bike lanes/trails may not address their concerns about traffic.
15
Q85, 89 (If able to ride bicycle and know how in bike or temporary condition) Now, I'd like you to think about things that may keep you from doing more biking. Please tell me yes OR no, if any of these keep you from doing more biking?
41%
39%
41%
44%
37%
34%
48%
38%
42%
42%
41%
39%
36%
40%
46%
41%
40%
51%
40%
0% 10% 20% 30% 40% 50% 60%
I do not feel safe because of traffic
38%
40%
40%
37%
27%
34%
42%
41%
37%
40%
37%
35%
37%
37%
40%
36%
42%
44%
41%
0% 10% 20% 30% 40% 50% 60%
Overall
Millennial (Born 1981 or later)
Gen X (Born 1965 to 1980)
Baby Boomers (Born 1945 to 1964)
Silent/Greatest Generation (Born 1944 or…
Male
Female
Kids in HH
No kids in HH
Less than $50k
$50k to <$100k
$100k and above
HS grad or less
Non-college post H.S. & Some college
College grad (incl. grad school)
White (non-Hispanic)
African American, Black
Asian
Hispanic/Mexican
Too few bike lanes or trails

Findings: Transportation Policy PrioritiesWhat are respondents’ transportation priorities for the government?
16
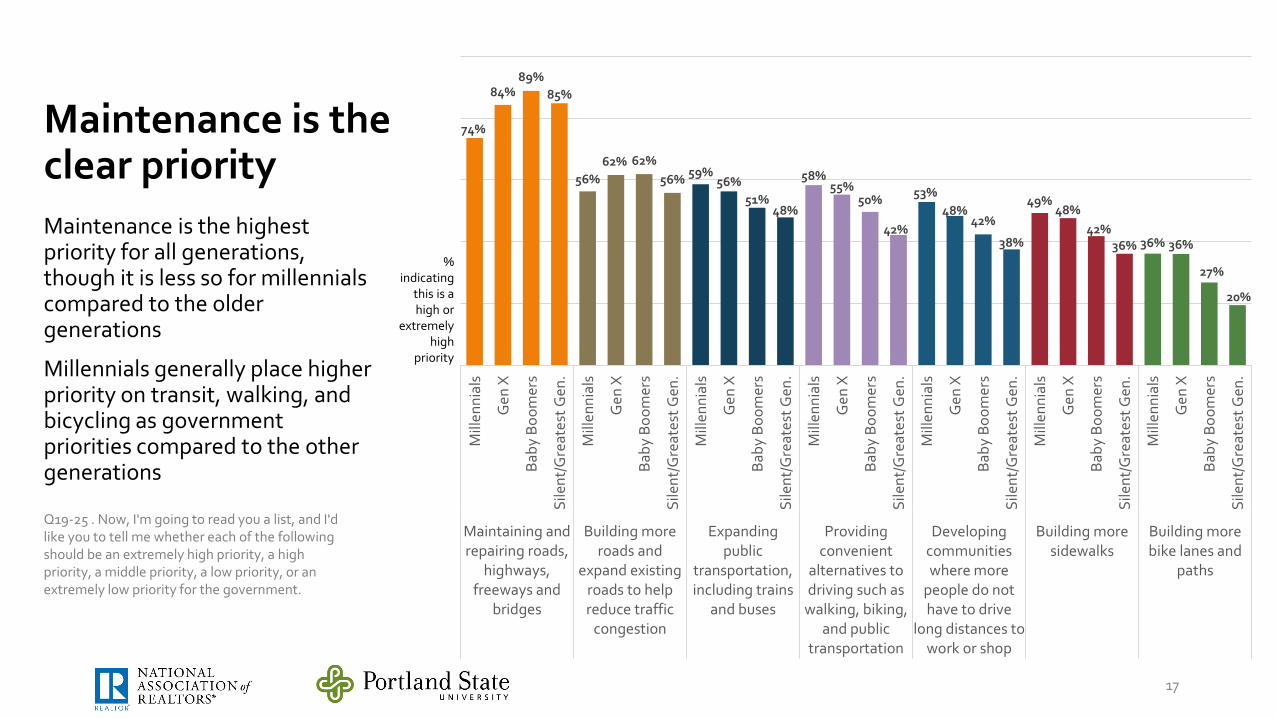
Maintenance is the highest priority for all generations, though it is less so for millennials compared to the older generations
Millennials generally place higher priority on transit, walking, and bicycling as government priorities compared to the other generations
74%
84%89%
85%
56%62% 62%
56% 59%56%
51%48%
58%55%
50%
42%
53%48%
42%
38%
49%48%
42%36% 36% 36%
27%
20%
Mill
enni
als
Gen
X
Baby
Boo
mer
s
Sile
nt/G
reat
est G
en.
Mill
enni
als
Gen
X
Baby
Boo
mer
s
Sile
nt/G
reat
est G
en.
Mill
enni
als
Gen
X
Baby
Boo
mer
s
Sile
nt/G
reat
est G
en.
Mill
enni
als
Gen
X
Baby
Boo
mer
s
Sile
nt/G
reat
est G
en.
Mill
enni
als
Gen
X
Baby
Boo
mer
s
Sile
nt/G
reat
est G
en.
Mill
enni
als
Gen
X
Baby
Boo
mer
s
Sile
nt/G
reat
est G
en.
Mill
enni
als
Gen
X
Baby
Boo
mer
s
Sile
nt/G
reat
est G
en.
Maintaining andrepairing roads,
highways,freeways and
bridges
Building moreroads and
expand existingroads to helpreduce traffic
congestion
Expandingpublic
transportation,including trains
and buses
Providingconvenient
alternatives todriving such as
walking, biking,and public
transportation
Developingcommunitieswhere more
people do nothave to drive
long distances towork or shop
Building moresidewalks
Building morebike lanes and
paths
% indicating
this is a high or
extremely high
priority
17
Q19-25 . Now, I'm going to read you a list, and I'd like you to tell me whether each of the following should be an extremely high priority, a high priority, a middle priority, a low priority, or an extremely low priority for the government.
Maintenance is the clear priority
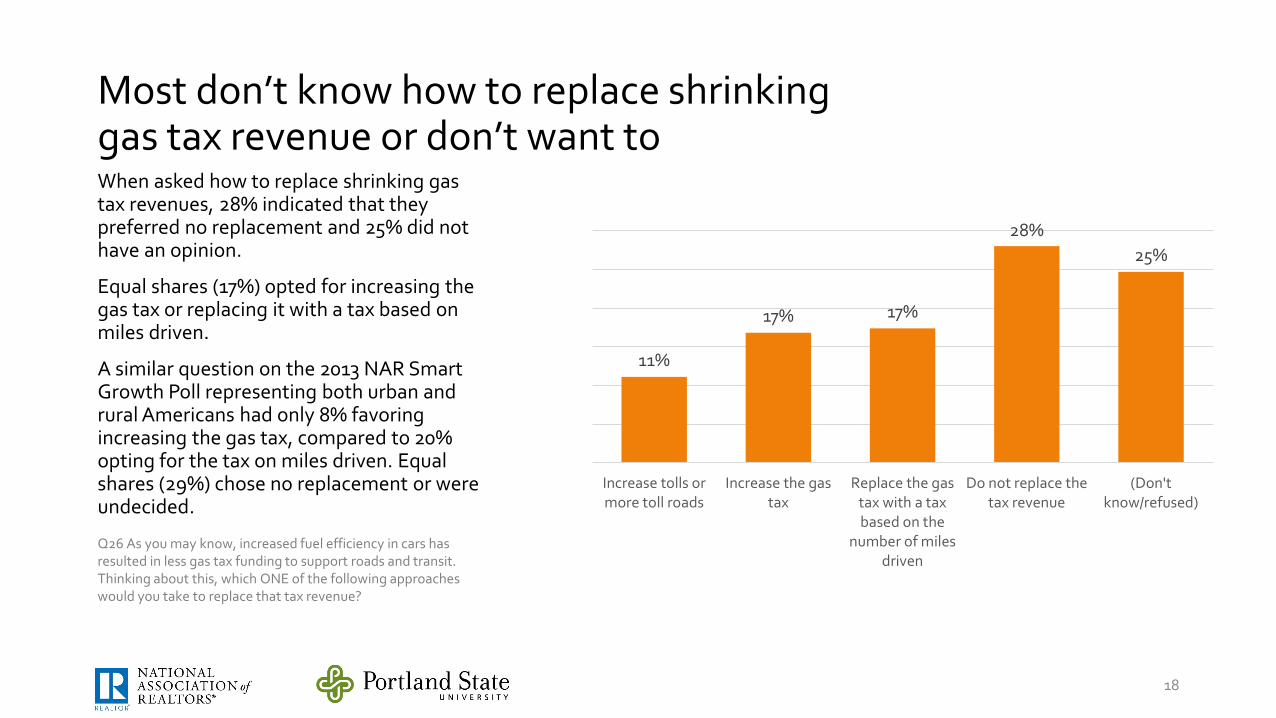
Most don’t know how to replace shrinking gas tax revenue or don’t want toWhen asked how to replace shrinking gas tax revenues, 28% indicated that they preferred no replacement and 25% did not have an opinion.
Equal shares (17%) opted for increasing the gas tax or replacing it with a tax based on miles driven.
A similar question on the 2013 NAR Smart Growth Poll representing both urban and rural Americans had only 8% favoring increasing the gas tax, compared to 20% opting for the tax on miles driven. Equal shares (29%) chose no replacement or were undecided.
18
11%
17% 17%
28%25%
Increase tolls ormore toll roads
Increase the gastax
Replace the gastax with a taxbased on the
number of milesdriven
Do not replace thetax revenue
(Don'tknow/refused)
Q26 As you may know, increased fuel efficiency in cars has resulted in less gas tax funding to support roads and transit. Thinking about this, which ONE of the following approaches would you take to replace that tax revenue?

Findings: Housing PreferencesWhat transportation features are important in deciding where to live?
Do people prefer more walkable neighborhoods?
19
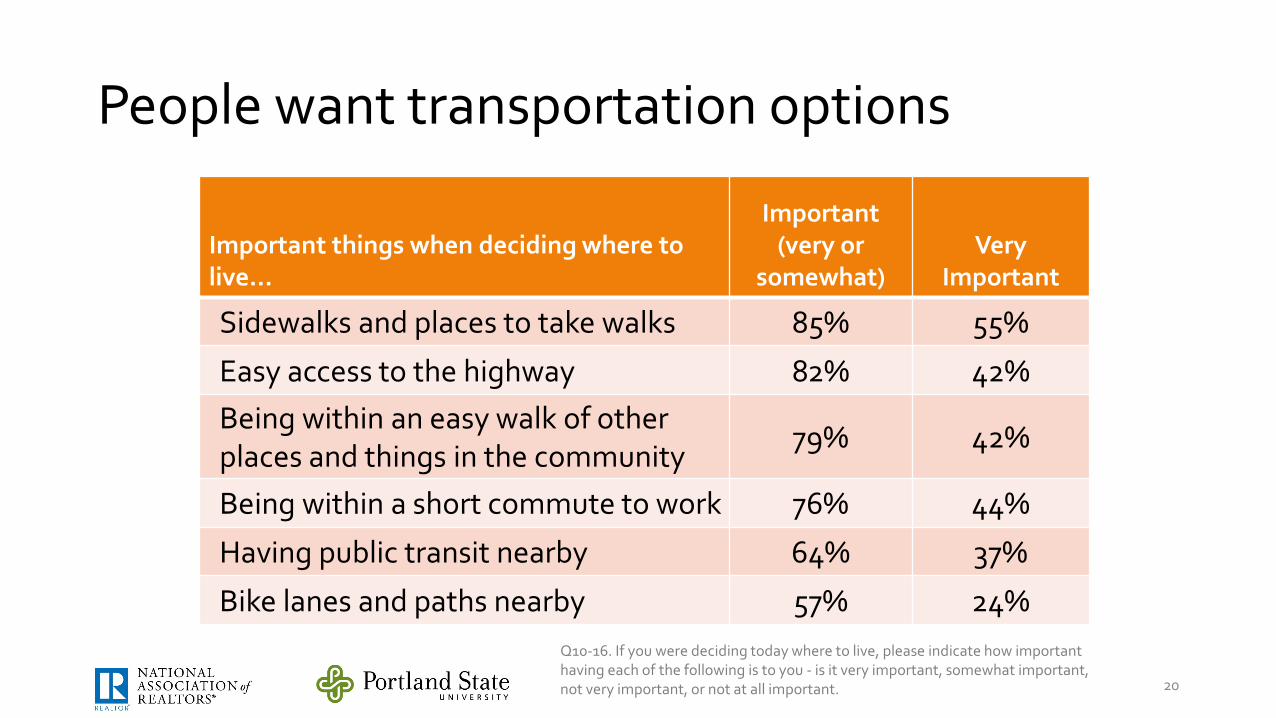
People want transportation options
20
Important things when deciding where to live…
Important(very or
somewhat)Very
Important
Sidewalks and places to take walks 85% 55%
Easy access to the highway 82% 42%Being within an easy walk of other places and things in the community
79% 42%
Being within a short commute to work 76% 44%
Having public transit nearby 64% 37%
Bike lanes and paths nearby 57% 24%Q10-16. If you were deciding today where to live, please indicate how important having each of the following is to you - is it very important, somewhat important, not very important, or not at all important.

Trends over time
21
Important things when deciding where to live…
Important(very or
somewhat) NAR 2011
Sidewalks and places to take walks 85% 77%
Easy access to the highway 82% 72%Being within an easy walk of other places and things in the community
79% 66%
Being within a short commute to work 76% --
Having public transit nearby 64% --
Bike lanes and paths nearby 57% --Q10-16. If you were deciding today where to live, please indicate how important having each of the following is to you - is it very important, somewhat important, not very important, or not at all important.

Some preferences vary by generationMillennials are more interested in being within easy walking distance of places and having public transit nearby.
Both Millennials and Gen Xers are more interested in sidewalks and bike lanes and paths
57%
50%
40%
50%
41%
24%
58%
51%
45%43%
38%
28%
53%
38%41%
38%
33%
21%
50%
22%
43%
30%32%
15%
Sidewalks andplaces to take
walks
Being within ashort
commute towork
Easy access tothe highway
Being withinan easy walk of
other placesand things in
thecommunity
Having publictransit nearby
Bike lanes andpaths nearby
Millennial (Born 1981 or later)
Gen X (Born 1965 to 1980)
Baby Boomers (Born 1945 to 1964)
Silent/ Greatest Generation (Born 1944 or before)
% indicating “very
important” in deciding
where to live
22
Q10-16. If you were deciding today where to live, please indicate how important having each of the following is to you - is it very important, somewhat important, not very important, or not at all important.

Women value walkability more than men doA large majority (61%) of women indicated it was very important to have sidewalks and places to take walks when deciding where to live.
46% of women said it was very important to be within easy walking distance of places in the community.
Having public transit nearby was also more important to women.
% indicating “very
important” in deciding where
to live
49%
37%42% 41%
33%
22%
61%
46% 45% 43%40%
25%
Sidewalks andplaces to take
walks
Being within aneasy walk of
other places andthings in thecommunity
Being within ashort commute
to work
Easy access tothe highway
Having publictransit nearby
Bike lanes andpaths nearby
Men Women
23
Q10-16. If you were deciding today where to live, please indicate how important having each of the following is to you - is it very important, somewhat important, not very important, or not at all important.

Americans Split on Preference Between Walkable, Mixed-Use Community and Conventional Suburban Community
48%
7%
45%
Community B:(walkable community) Houses with small yards and it is easy to walk to the places you need to go.
Community A:(conventional suburb) Houses with large yards and you have to drive to the places you need to go.
Don’t Know/Neither
Preferred Community
24
Q17. Imagine for a moment that you are moving to another community. These questions are about the kind of community where you would like to live. Please select the community where you would prefer to live.

Millennials and Baby Boomers prefer smaller yards in walkable neighborhoods
Community B:(walkable community) Houses with small yards and it is easy to walk to the places you need to go.
Community A:(conventional suburb) Houses with large yards and you have to drive to the places you need to go.
Millennial (Born 1981 or later)
Gen X (Born 1965 to 1980)
Baby Boomers (Born 1945 to 1964)
Silent/ Greatest Generation (Born 1944 or before)
42%
50%
44%
43%
51%
43%
51%
48%
25
Q17. Imagine for a moment that you are moving to another community. These questions are about the kind of community where you would like to live. Please select the community where you would prefer to live.

Americans split between attached homes in walkable neighborhoods and detached homes in conventional
neighborhoods
48%
7%
45%
Home B:(detached, conventional) Own/rent detached, single-family house, and you have to drive to shops, restaurants, & have a longer commute
Home A:(attached, walkable) Own/rent an apartment/townhouse, and you have an easy walk to shops/restaurants & have a shorter commute
Don’t Know/Neither
Preferred Community
26
Q18. Imagine for a moment that you are moving to another community. These questions are about the kind of community where you would like to live. Please select the community where you would prefer to live.

Millennials prefer attached homes in walkable neighborhoods
Millennial (Born 1981 or later)
Gen X (Born 1965 to 1980)
Baby Boomers (Born 1945 to 1964)
Silent/ Greatest Generation (Born 1944 or before)
51%
44%
43%
41%
43%
50%
51%
47%
27
Q18. Imagine for a moment that you are moving to another community. These questions are about the kind of community where you would like to live. Please select the community where you would prefer to live.
Home B:(detached, conventional) Own/rent detached, single-family house, and you have to drive to shops, restaurants, & have a longer commute
Home A:(attached, walkable) Own/rent an apartment/townhouse, and you have an easy walk to shops/restaurants & have a shorter commute

What about households with kids?For Millennials with kids in the household, there was no significant difference in the share that chose the attached home in a walkable location (vs. the detached home that required more driving). Over half chose that option.
For Gen Xers with kids, there is a difference. Only 40% of the Gen Xers with kids preferred the attached walkable option, compared to 49% of the Gen Xers without kids.
The difference for Baby Boomers with and without kids is not statistically significant.
28
51%
40% 38%
52% 49%43%
Community A: Attachedwalkable
Community A: Attachedwalkable
Community A: Attachedwalkable
Millennial (Born 1981 or later) Gen X (Born 1965 to 1980) Baby Boomers (Born 1945 to1964)
Kids in HH No kids

Findings: Current home and neighborhoodWhat is the transportation environment where people currently live?
How well does that match their preferences?
29

Most people live in detached homes60% of the adults surveyed in the metro areas live in detached, single-family homes.
3060%
49%
59%
68%
66%
65%
58%
45%
70%
81%
67%
44%
59%
52%
50%
67%
55%
61%
45%
61%
67%
10%
11%
11%
9%
9%
13%
9%
12%
9%
9%
9%
13%
10%
15%
15%
10%
16%
7%
8%
11%
8%
24%
33%
24%
18%
17%
18%
27%
36%
17%
9%
19%
37%
30%
25%
27%
19%
23%
24%
44%
22%
19%
Total
Millennial (Born 1981 or later)
Gen X (Born 1965 to 1980)
Baby Boomers (Born 1945 to 1964)
Silent/ Greatest Generation (Born 1944 or before)
Kids in HH
No kids in HH
Less than $50k
$50k to <$100k
$100k and above
White (non-Hispanic)
African American, Black
Asian
Hispanic/Mexican
Los Angeles
Middle America
North East
West Coast
New York City
South
South West
A building with 2 or more apartments or condos
Single family attached house, such as a townhouse or row house.
Single family detached house
Q9. Do you live in a…

But, 25% live in detached homes and would prefer an attached home in a walkable neighborhood
Lives in Prefers %
MismatchedDetached home
Apartment/townhouse in walkable neighborhood
25%
Attached homeDetached home in
conventional neighborhood 13%
MatchedAttached home
Apartment/townhouse in walkable neighborhood
24%
Detached homeDetached home in
conventional neighborhood 38%
n=2,655; Excludes people living in mobile homes and other housing types
31

Mismatch differs some by incomePeople in the highest income level ($100k and above) are the most likely to be living in detached homes and prefer to live in an attached home in a walkable neighborhood.
On the other hand, 17% of people in the lowest income group live in an attached home and would prefer a detached home in a conventional neighborhood.
23%
25%
31%
17%
10%
7%
0% 50% 100%
Less than $50k (n=1,098)
$50k to <$100k (n=742)
$100k and above (n=471)
Mismatch: Live in detached, prefers attached
Mismatch: Live in attached, prefers detached
Match: lives/prefers attached
Match: lives/prefers detached
32
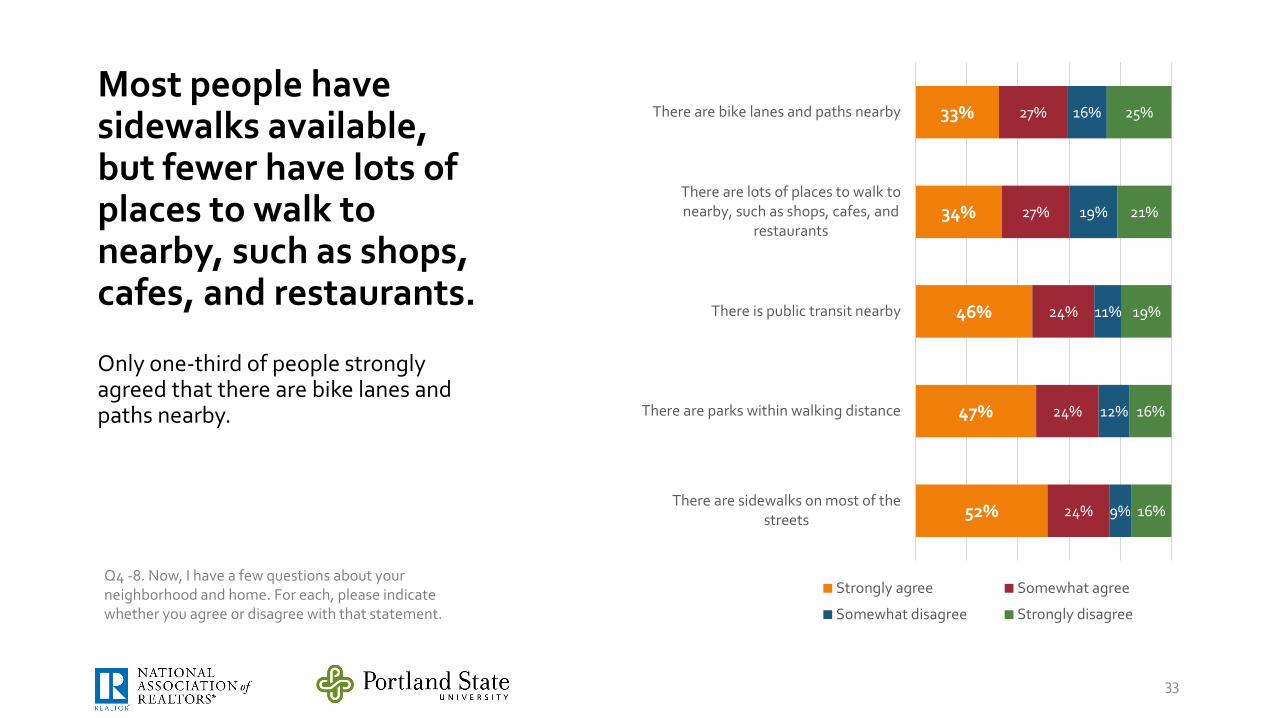
Most people have sidewalks available, but fewer have lots of places to walk to nearby, such as shops, cafes, and restaurants.
Only one-third of people strongly agreed that there are bike lanes and paths nearby.
52%
47%
46%
34%
33%
24%
24%
24%
27%
27%
9%
12%
11%
19%
16%
16%
16%
19%
21%
25%
There are sidewalks on most of thestreets
There are parks within walking distance
There is public transit nearby
There are lots of places to walk tonearby, such as shops, cafes, and
restaurants
There are bike lanes and paths nearby
Strongly agree Somewhat agree
Somewhat disagree Strongly disagree
33
Q4 -8. Now, I have a few questions about your neighborhood and home. For each, please indicate whether you agree or disagree with that statement.
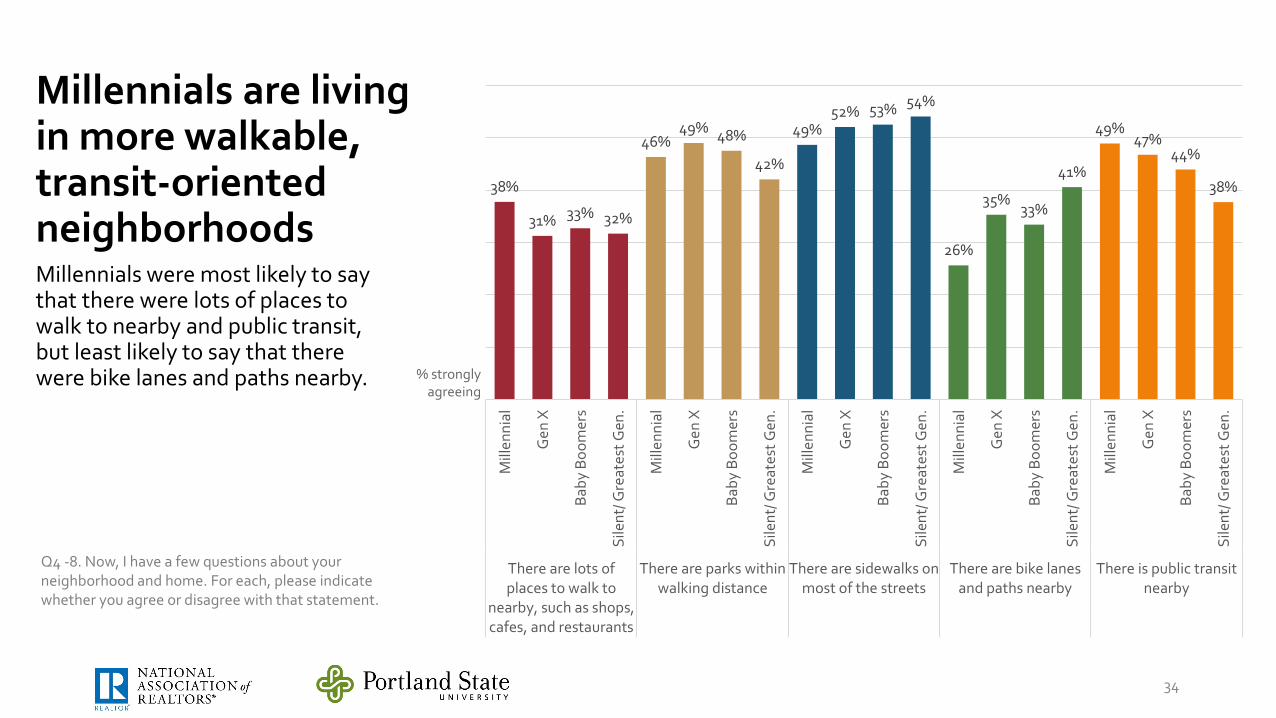
Millennials are living in more walkable, transit-oriented neighborhoodsMillennials were most likely to say that there were lots of places to walk to nearby and public transit, but least likely to say that there were bike lanes and paths nearby.
38%
31% 33% 32%
46%49% 48%
42%
49%52% 53% 54%
26%
35%33%
41%
49%47%
44%
38%
Mill
enni
al
Gen
X
Baby
Boo
mer
s
Sile
nt/ G
reat
est G
en.
Mill
enni
al
Gen
X
Baby
Boo
mer
s
Sile
nt/ G
reat
est G
en.
Mill
enni
al
Gen
X
Baby
Boo
mer
s
Sile
nt/ G
reat
est G
en.
Mill
enni
al
Gen
X
Baby
Boo
mer
s
Sile
nt/ G
reat
est G
en.
Mill
enni
al
Gen
X
Baby
Boo
mer
s
Sile
nt/ G
reat
est G
en.
There are lots ofplaces to walk to
nearby, such as shops,cafes, and restaurants
There are parks withinwalking distance
There are sidewalks onmost of the streets
There are bike lanesand paths nearby
There is public transitnearby
% strongly agreeing
34
Q4 -8. Now, I have a few questions about your neighborhood and home. For each, please indicate whether you agree or disagree with that statement.
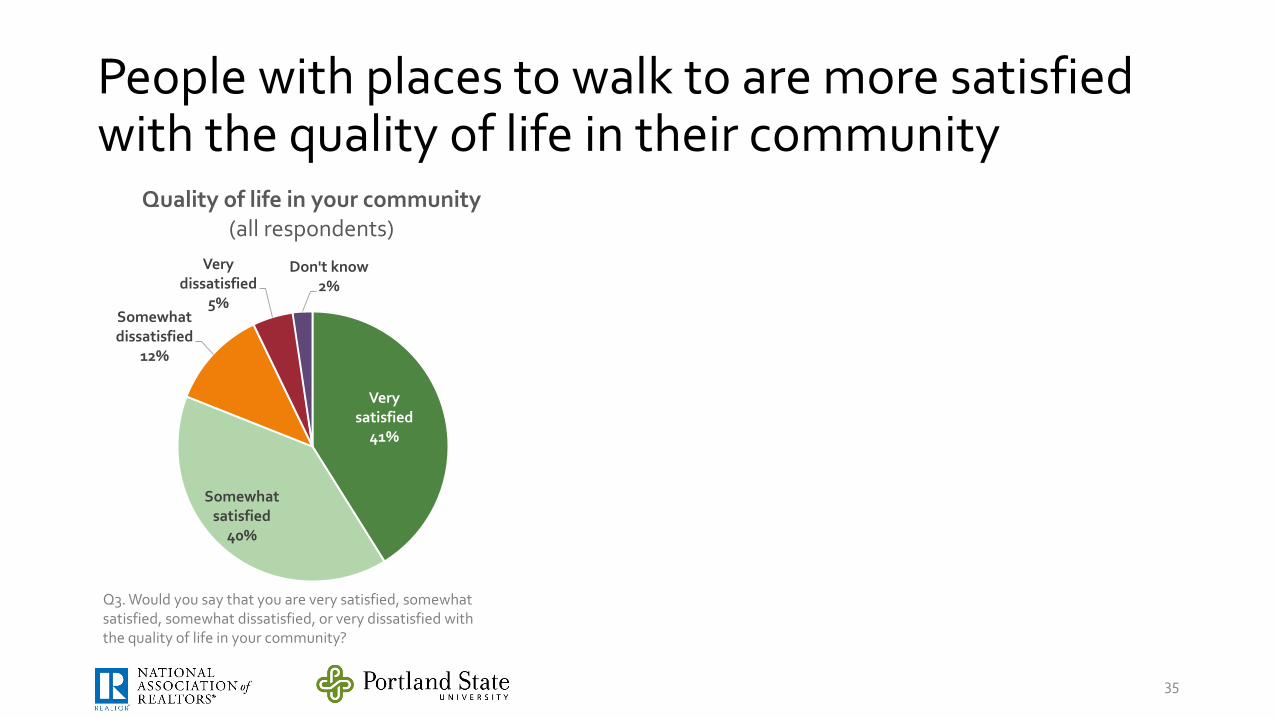
People with places to walk to are more satisfied with the quality of life in their community
Very satisfied
41%
Somewhat satisfied
40%
Somewhat dissatisfied
12%
Very dissatisfied
5%
Don't know2%
Quality of life in your community (all respondents)
35
Q3. Would you say that you are very satisfied, somewhat satisfied, somewhat dissatisfied, or very dissatisfied with the quality of life in your community?

People with places to walk to are more satisfied with the quality of life in their community
54%
32% 35% 38%
33%
49% 43% 37%
0%
20%
40%
60%
80%
100%
Strongly agree Somewhat agree Somewhat disagree Strongly disagree
There are lots of places to walk nearby, such as shops, cafes, and restaurants
Very satisfied Somewhat satisfied
Very satisfied
41%
Somewhat satisfied
40%
Somewhat dissatisfied
12%
Very dissatisfied
5%
Don't know2%
Quality of life in your community (all respondents)
36
Q3. Would you say that you are very satisfied, somewhat satisfied, somewhat dissatisfied, or very dissatisfied with the quality of life in your community?
Satisfaction with quality of
life in community

Questions?• These are just our initial “big picture” findings. Stay tuned for more!• Acknowledgements
• The research was conducted by the National Association of Realtors® and Portland State University, with additional funding from the National Institute for Transportation and Communities (a US DOT University Transportation Center).
• Project team:Jennifer Dill and Nathan McNeil, Portland State UniversityJoe Molinaro and Hugh Morris, National Association of Realtors®Joe Goode, American Strategies
37

Bonus slides
38

Transit use in the past 30 daysMillennials are more likely to have taken transit in the past month than nearly any other demographic category.
Overall: 26%
40%28%
19%8%
28%24%
26%26%
29%23%24%
26%23%
28%
19%42%
37%33%
27%18%
26%29%
56%20%20%
Millennial (Born 1981 or later)Gen X (Born 1965 to 1980)
Baby Boomers (Born 1945 to 1964)Silent/Greatest Generation (Born 1944 or…
MaleFemale
Kids in HHNo kids in HH
Less than $50k$50k to <$100k
$100k and above
HS grad or lessNon-college post H.S. & Some college
College grad (incl. grad school)
White (non-Hispanic)African American, Black
AsianHispanic/Mexican
Los AngelesMiddle America
North EastWest Coast
New York CitySouth
South West
Used transit in the past 30 days
39
Q35. In the past 30 days, about how many days did you use public transportation such as buses, subways, light rail, or commuter trains?
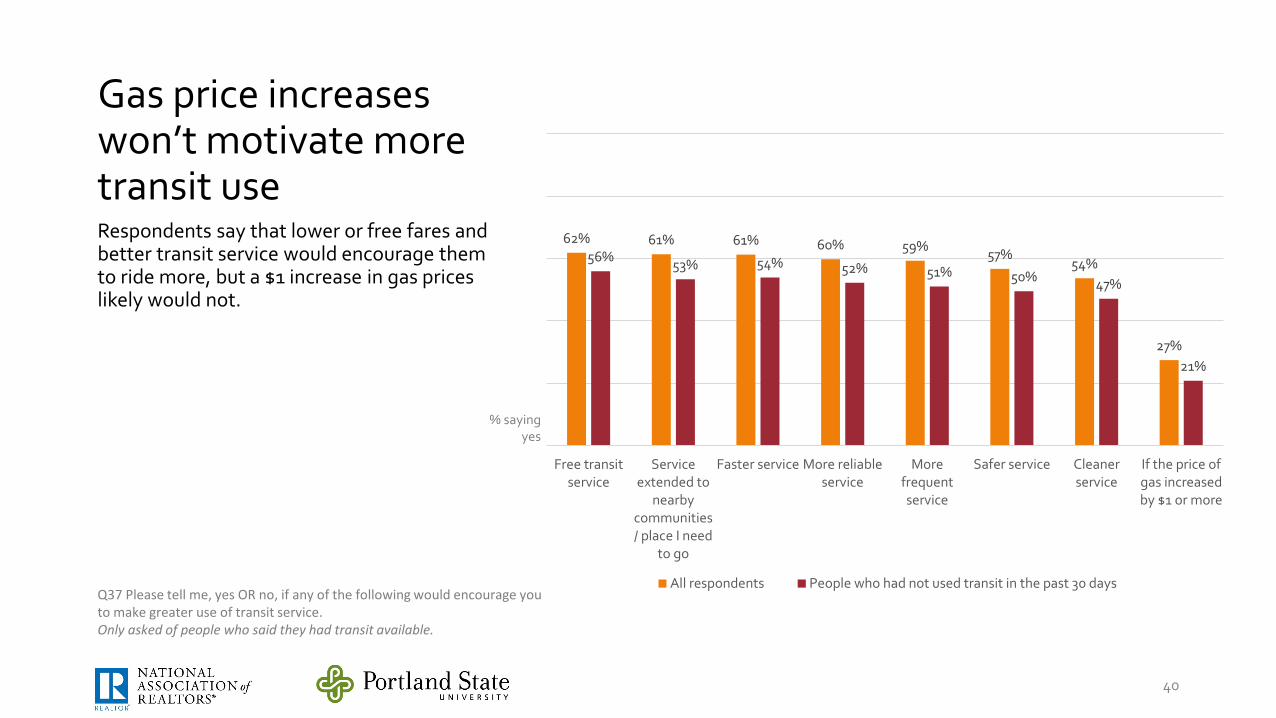
Gas price increases won’t motivate more transit useRespondents say that lower or free fares and better transit service would encourage them to ride more, but a $1 increase in gas prices likely would not.
40
62% 61% 61% 60% 59% 57%54%
27%
56% 53% 54% 52% 51% 50% 47%
21%
Free transitservice
Serviceextended to
nearbycommunities/ place I need
to go
Faster service More reliableservice
Morefrequentservice
Safer service Cleanerservice
If the price ofgas increasedby $1 or more
All respondents People who had not used transit in the past 30 daysQ37 Please tell me, yes OR no, if any of the following would encourage you to make greater use of transit service. Only asked of people who said they had transit available.
% saying yes
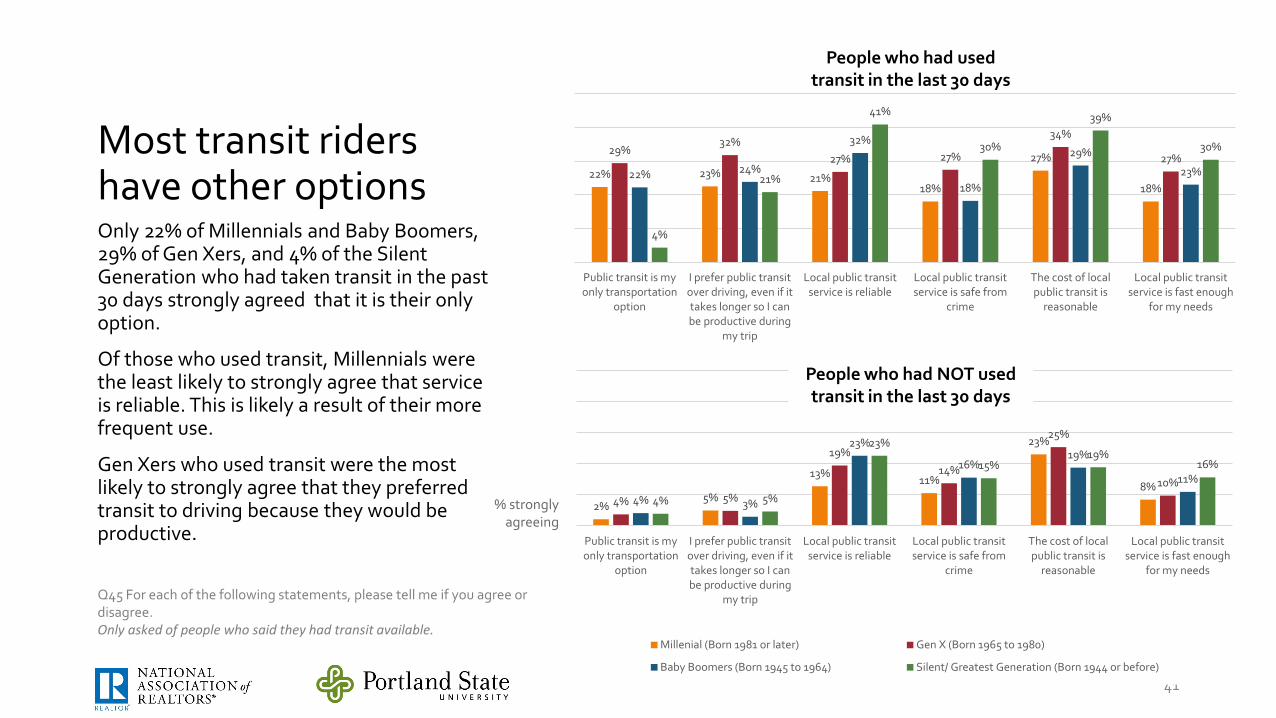
Most transit riders have other optionsOnly 22% of Millennials and Baby Boomers, 29% of Gen Xers, and 4% of the Silent Generation who had taken transit in the past 30 days strongly agreed that it is their only option.
Of those who used transit, Millennials were the least likely to strongly agree that service is reliable. This is likely a result of their more frequent use.
Gen Xers who used transit were the most likely to strongly agree that they preferred transit to driving because they would be productive.
41
22% 23% 21%18%
27%
18%
29%32%
27% 27%
34%
27%22% 24%
32%
18%
29%
23%
4%
21%
41%
30%
39%
30%
Public transit is myonly transportation
option
I prefer public transitover driving, even if ittakes longer so I canbe productive during
my trip
Local public transitservice is reliable
Local public transitservice is safe from
crime
The cost of localpublic transit is
reasonable
Local public transitservice is fast enough
for my needs
2%5%
13% 11%
23%
8%4% 5%
19%14%
25%
10%4% 3%
23%
16%19%
11%
4% 5%
23%
15%19%
16%
Public transit is myonly transportation
option
I prefer public transitover driving, even if ittakes longer so I canbe productive during
my trip
Local public transitservice is reliable
Local public transitservice is safe from
crime
The cost of localpublic transit is
reasonable
Local public transitservice is fast enough
for my needs
Millenial (Born 1981 or later) Gen X (Born 1965 to 1980)
Baby Boomers (Born 1945 to 1964) Silent/ Greatest Generation (Born 1944 or before)
Q45 For each of the following statements, please tell me if you agree or disagree. Only asked of people who said they had transit available.
People who had used transit in the last 30 days
People who had NOT used transit in the last 30 days
% strongly agreeing

Health and being outside are the main reasons for biking and walkingHowever, some motivations vary by age. While a majority of all adults indicate that health and exercise benefits are a main motivation for walking, Millennials were less likely to give this reason.
19% of Millennials indicated that saving money was a main reason for walking.
The environment is more of a motivation for bicycling than for walking.
% indicating
this is a main
reason for walking
53%
8%
56%
19%13% 12%
66%
7%
56%
14% 13% 11%
68%
3%
58%
8% 9% 6%
65%
4%
55%
5% 5% 2%
For health/exercisebenefits
Faster than driving To enjoy beingoutside
To save money ongas and travel costs
To reduce impacton environment/air
quality
To avoid having topark my car
Millennial (Born 1981 or later) Gen X (Born 1965 to 1980)Baby Boomers (Born 1945 to 1964) Silent/ Greatest Generation (Born 1944 or before)
42
Q57-62. Why do you choose to walk? Is this a main reason, somewhat of a reason, or not a reason at all?
73%
9%
57%
22% 22%
13%
72%
11%
67%
20% 19%13%
82%
4%
70%
10%13%
6%
63%
7%
59%
4%
19%
7%
For health/exercisebenefits
Faster than driving To enjoy beingoutside
To save money on gasand travel costs
To reduce impact onenvironment/air
quality
To avoid having topark my car
Main reasons for biking
% indicating
this is a main
reason for biking
Main reasons for walking
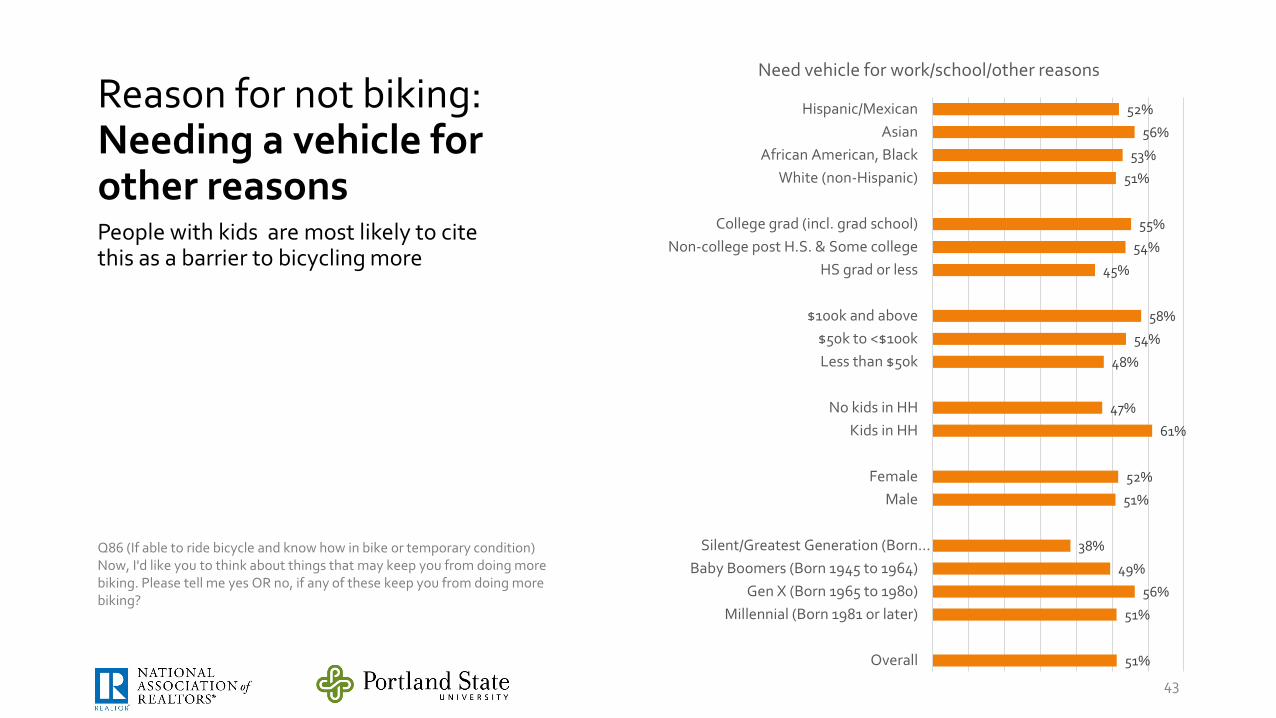
Reason for not biking: Needing a vehicle for other reasonsPeople with kids are most likely to cite this as a barrier to bicycling more
51%
51%
56%
49%
38%
51%
52%
61%
47%
48%
54%
58%
45%
54%
55%
51%
53%
56%
52%
Overall
Millennial (Born 1981 or later)Gen X (Born 1965 to 1980)
Baby Boomers (Born 1945 to 1964)Silent/Greatest Generation (Born…
MaleFemale
Kids in HHNo kids in HH
Less than $50k$50k to <$100k
$100k and above
HS grad or lessNon-college post H.S. & Some college
College grad (incl. grad school)
White (non-Hispanic)African American, Black
AsianHispanic/Mexican
Need vehicle for work/school/other reasons
43
Q86 (If able to ride bicycle and know how in bike or temporary condition) Now, I'd like you to think about things that may keep you from doing more biking. Please tell me yes OR no, if any of these keep you from doing more biking?

Comfort level biking in different environmentsMost people feel very comfortable riding a bike on a separate path or trail. But only 13% feel very comfortable riding on a busy urban street with only a striped bike lane – the most common type of bike infrastructure in most cities. Adding more protection from traffic, such as with a curb, planters, or parked cars, increased comfort. 31% said they would feel very comfortable riding in such a lane.
Women and older adults feel least comfortable.
Q84. Only includes people who can physically ride a bicycle and know how. Now, I'm going to read you a list of places you could ride a bike. For each, please tell me whether you would be comfortable or uncomfortable biking there.• path or trail separate from the street • major urban or suburban street with four lanes, on-street parking, traffic speeds of 30-35
miles per hour, and a striped bike lane • major urban or suburban street with four lanes, on-street parking, traffic speeds of 30-35
miles per hour, and wide bike lane physically separated from traffic by a raised curb, planters, or parked cars
% indicating they would feel very comfortable biking there
44
13%
13%
15%
12%
11%
16%
10%
14%
14%
12%
14%
13%
12%
31%
36%
32%
27%
25%
36%
26%
31%
30%
35%
28%
33%
33%
55%
56%
58%
54%
46%
62%
47%
51%
57%
65%
48%
53%
63%
Overall
Millennial
Gen X
Baby Boomers
Silent/Greatest Generation
Male
Female
Less than $50k
$50k to <$100k
$100k and above
HS grad or less
Non-college post H.S. & Some college
College grad (incl. grad school)
Separate path Major street with protected bike lane
Major street with striped bike lane

Maintenance is the clear priority83% indicated that maintaining and repairing roads and bridges is a high priority, with over half of those saying it is an extremely high priority
This far exceeded the next priority: expanding roads to help reduce congestion (60% high or extremely high)
Over half indicated that expanding public transit and providing convenient alternatives to driving, such as walking, biking and transit were high priorities.
11%
16%
19%
23%
25%
25%
44%
21%
29%
28%
30%
29%
35%
38%
31%
31%
30%
28%
26%
27%
13%
37%
24%
23%
19%
20%
14%
4%
Building more bike lanes and paths
Building more sidewalks
Developing communities where morepeople do not have to drive long
distances to work or shop
Providing convenient alternatives todriving such as walking, biking, and
public transportation
Expanding public transportation,including trains and buses
Building more roads and expandexisting roads to help reduce traffic
congestion
Maintaining and repairing roads,highways, freeways and bridges
Extremely High High priority
Middle priority Low priority45
Q19-25 . Now, I'm going to read you a list, and I'd like you to tell me whether each of the following should be an extremely high priority, a high priority, a middle priority, a low priority, or an extremely low priority for the government.
Don’t know responses not included (<5%).