Embed Size (px)
Citation preview
Arizona’s Economic Imperative: Leading the Nation in Latino Student Success
A community conversation
Michael M. Crow
April 30, 2015 / Grand Ballroom, Arizona Biltmore
Massachusetts Constitution 1780
“Wisdom and knowledge, as well as virtue,
diffused generally among the body of the people
being necessary for their preservation of their
rights and liberties; and as these depend on
spreading of opportunities and advantages of
education in various parts of the country, and
among the different orders of the people…”
“…it shall be the duty of the legislators and
magistrates in all future periods of this
commonwealth to cherish the interests of the
literature and the sciences, and all seminaries of
them…”
Massachusetts Constitution 1780
“…especially at the university at Cambridge…”
Massachusetts Constitution 1780
CH. 5, SEC. 2
The American Dream
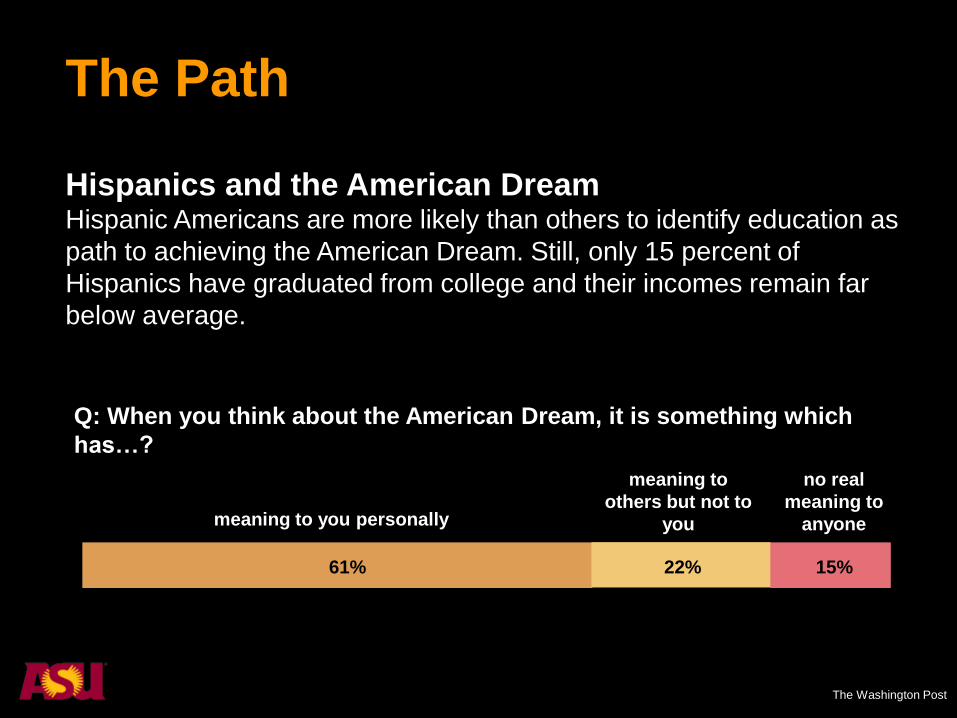
The Path
Hispanics and the American Dream Hispanic Americans are more likely than others to identify education as
path to achieving the American Dream. Still, only 15 percent of
Hispanics have graduated from college and their incomes remain far
below average.
Q: When you think about the American Dream, it is something which
has…?
meaning to you personally
meaning to
others but not to
you
no real
meaning to
anyone
61% 22% 15%
The Washington Post
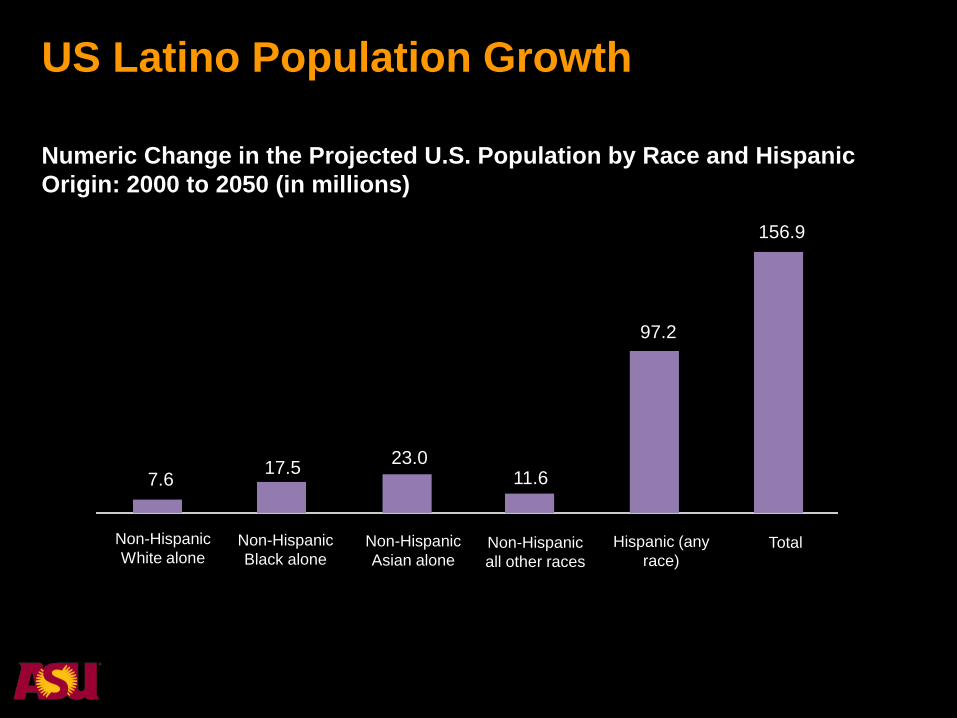
US Latino Population Growth
Numeric Change in the Projected U.S. Population by Race and Hispanic
Origin: 2000 to 2050 (in millions)
7.6 17.5
23.0 11.6
97.2
156.9
Non-Hispanic
White alone Non-Hispanic
Black alone Non-Hispanic
Asian alone Non-Hispanic
all other races
Hispanic (any
race) Total
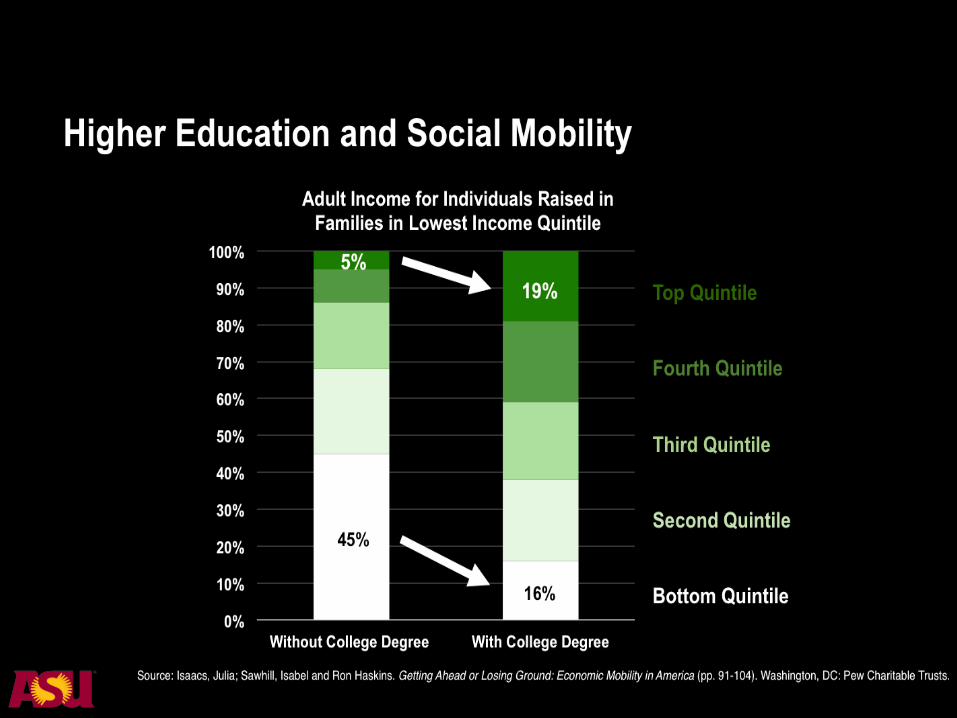
Educational attainment is key to
social mobility.
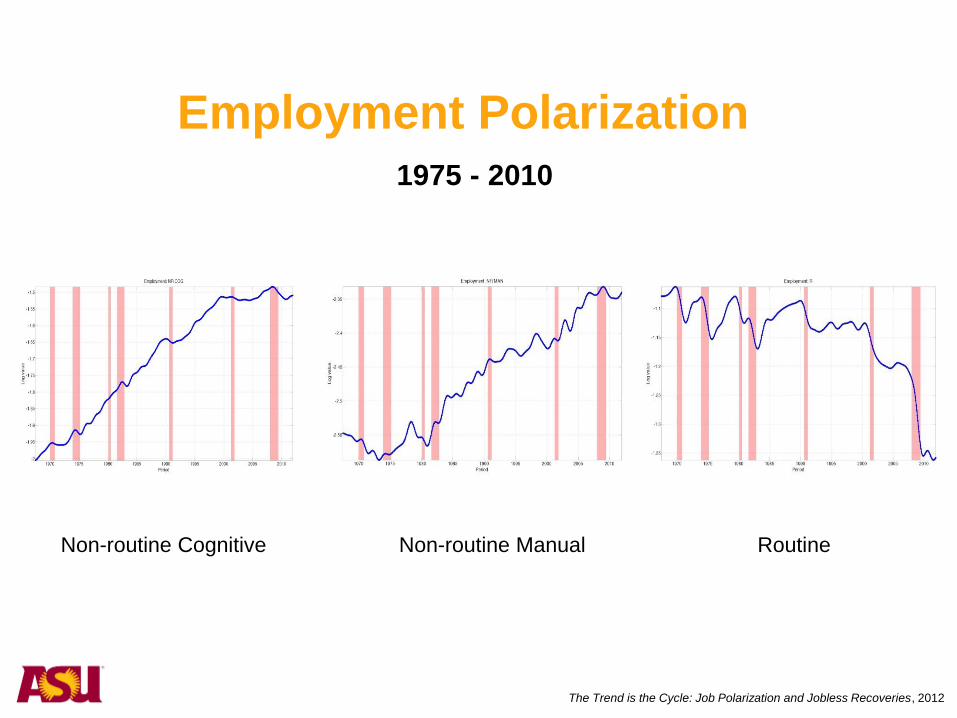
Employment Polarization
Non-routine Cognitive Non-routine Manual Routine
1975 - 2010
The Trend is the Cycle: Job Polarization and Jobless Recoveries, 2012
Value to the Individual
The internal rate of return for a
degree substantially exceeds the
cost of attending college.
Economists put the rate of return of
a degree in 2012 at 15%, far
above the return on stocks and
bonds.
This is true even for so-called
“underemployed” college graduates.
Age
57 53 49 45 41 37 33 29 25 61
$160,000
$140,000
$120,000
$100,000
$80,000
$60,000
$40,000
$20,000
0
$180,000
Earn
ings
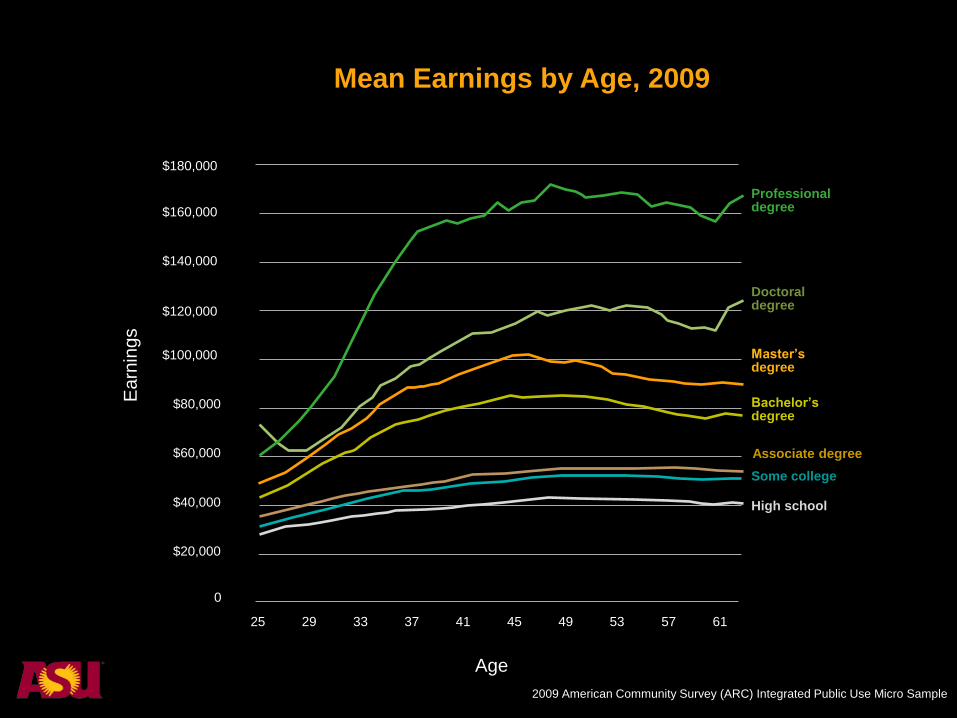
Professional degree
Doctoral degree
Master’s degree
Bachelor’s degree
Associate degree
Some college
High school
Mean Earnings by Age, 2009
2009 American Community Survey (ARC) Integrated Public Use Micro Sample
People who “learn to learn”
continue to earn over their lifetime
and earn more. Those who do not
see their wages remain flat as
they age.
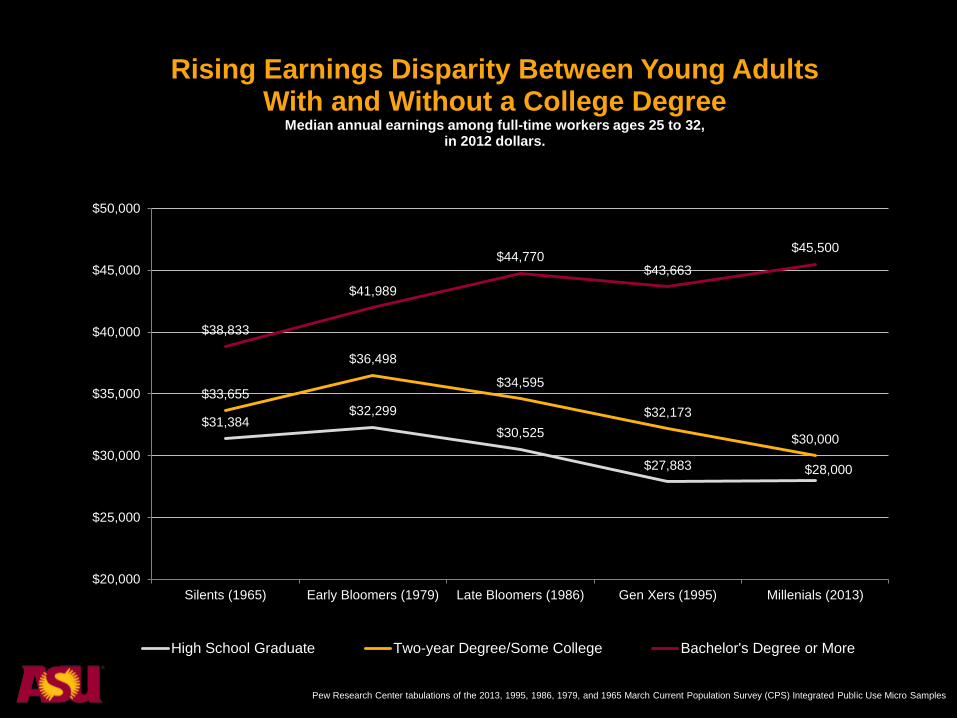
$31,384 $32,299
$30,525
$27,883 $28,000
$33,655
$36,498
$34,595
$32,173
$30,000
$38,833
$41,989
$44,770 $43,663
$45,500
$20,000
$25,000
$30,000
$35,000
$40,000
$45,000
$50,000
Silents (1965) Early Bloomers (1979) Late Bloomers (1986) Gen Xers (1995) Millenials (2013)
Rising Earnings Disparity Between Young Adults With and Without a College Degree
Median annual earnings among full-time workers ages 25 to 32, in 2012 dollars.
High School Graduate Two-year Degree/Some College Bachelor's Degree or More
Pew Research Center tabulations of the 2013, 1995, 1986, 1979, and 1965 March Current Population Survey (CPS) Integrated Public Use Micro Samples

Value to Society
10%
5%
0%
-5%
-10%
-15%
-20%
15%
0%
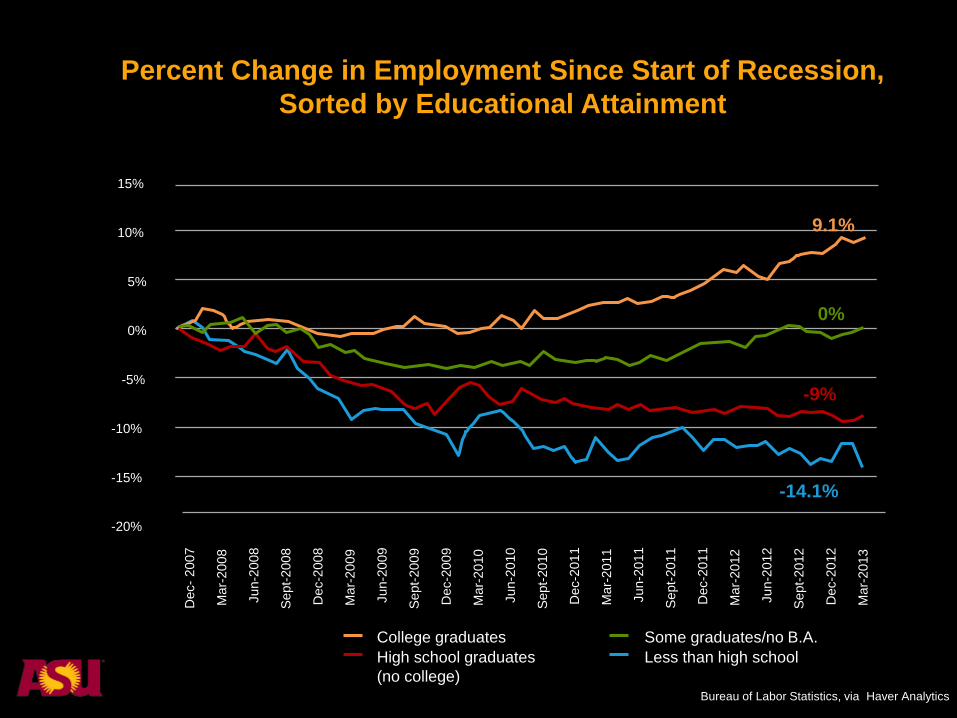
9.1%
-9%
-14.1%
Mar-
2013
Dec-
2007
Dec-2
012
Mar-
2008
Sept-
2012
Jun-2
012
Mar-
2012
Dec-2
011
Jun-2
008
Sept-
2008
Dec-2
008
Mar-
2009
Jun-2
00
9
Sept-
2009
Dec-2
009
Sept-
2011
Jun-2
011
Mar-
2011
Dec-2
011
Sept-
2010
Jun-2
010
Mar-
2010
Some graduates/no B.A.
High school graduates
(no college)
College graduates
Less than high school
Percent Change in Employment Since Start of Recession,
Sorted by Educational Attainment
Bureau of Labor Statistics, via Haver Analytics
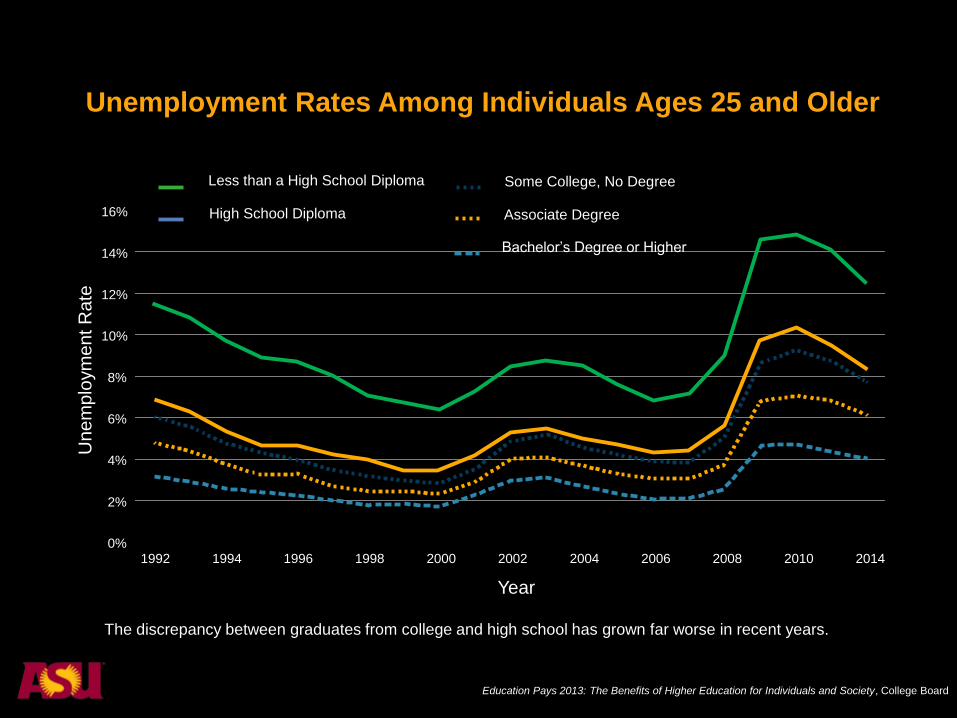
The discrepancy between graduates from college and high school has grown far worse in recent years.
2010 2008 2006 2004 2002 2000 1998 1996 1994 1992
14%
12%
10%
8%
6%
4%
2%
0%
16%
2014
Year
Un
em
plo
ym
en
t R
ate
Less than a High School Diploma
Bachelor’s Degree or Higher
High School Diploma
Some College, No Degree
Associate Degree
Unemployment Rates Among Individuals Ages 25 and Older
Education Pays 2013: The Benefits of Higher Education for Individuals and Society, College Board
Recovery from the Great Recession
has not occurred for workers
without a college degree.
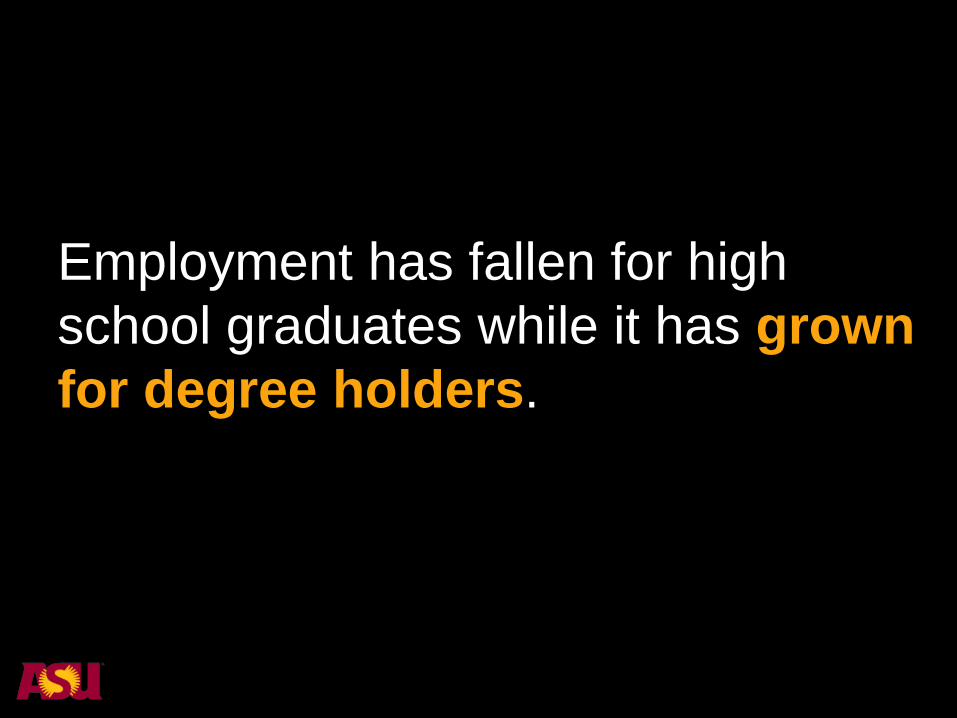
Employment has fallen for high
school graduates while it has grown
for degree holders.
ASU Analysis: Economic impact of ASU graduates in Arizona
Approx. 207,000 ASU
graduates worked in AZ in
2012.
Their aggregate earnings were
an estimated $11.4 billion.
ASU Analysis: Economic impact of ASU graduates in Arizona
They directly contribute an
estimated $819 million in state
taxes.
ASU Analysis: Economic impact of ASU graduates in Arizona
A two percentage point increase in the
share of university graduates in the
workplace would equal an estimated $1.2
billion gain in income and an additional
$87 million in state tax payments.
ASU Analysis: Economic impact of ASU graduates in Arizona
ASU Analysis: Economic impact of ASU graduates in Arizona
If ASU contributed to a 6 percentage point
increase – from 23.7% to 29.7% – of 25-to-34
year olds with a bachelor’s degree who are
absorbed into the AZ labor market, the projected
result would (in the steady state):
ASU Analysis: Economic impact of ASU graduates in Arizona
Raise AZ GSP by 3.5%
Generate a $623 million increase
in State taxes and fees combined
ASU Analysis: Economic impact of ASU graduates in Arizona
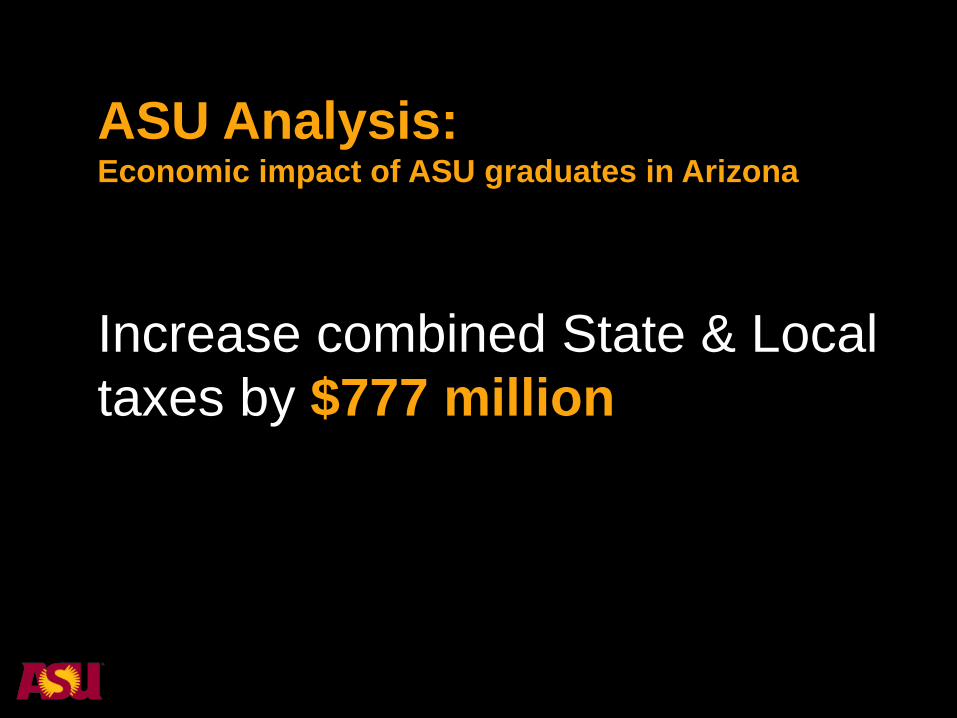
Increase combined State & Local
taxes by $777 million
ASU Analysis: Economic impact of ASU graduates in Arizona
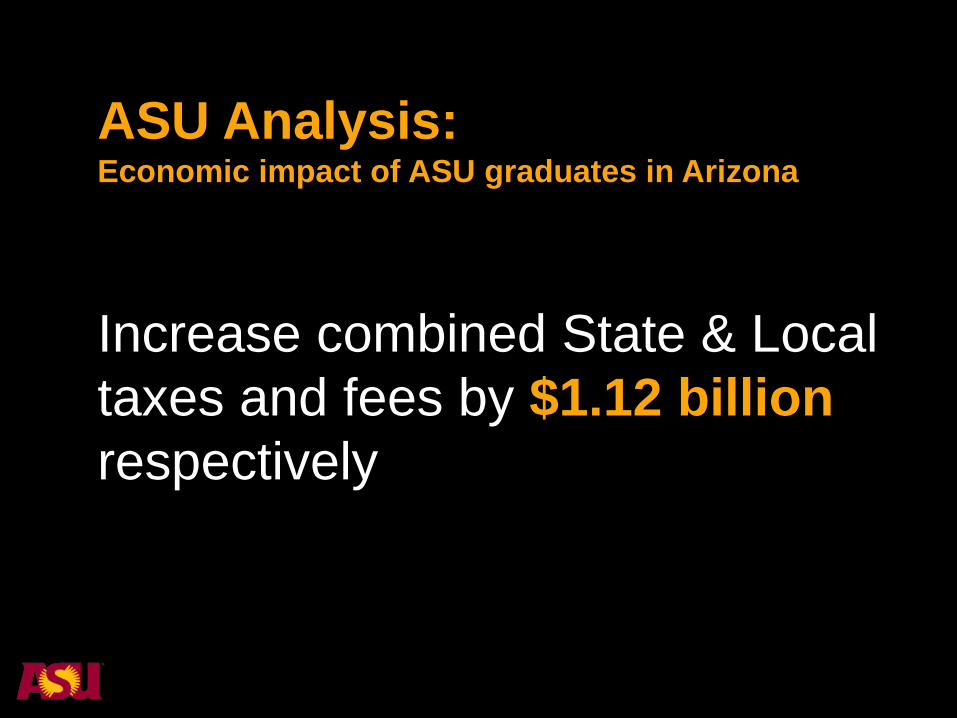
Increase combined State & Local
taxes and fees by $1.12 billion
respectively
ASU Analysis: Economic impact of ASU graduates in Arizona
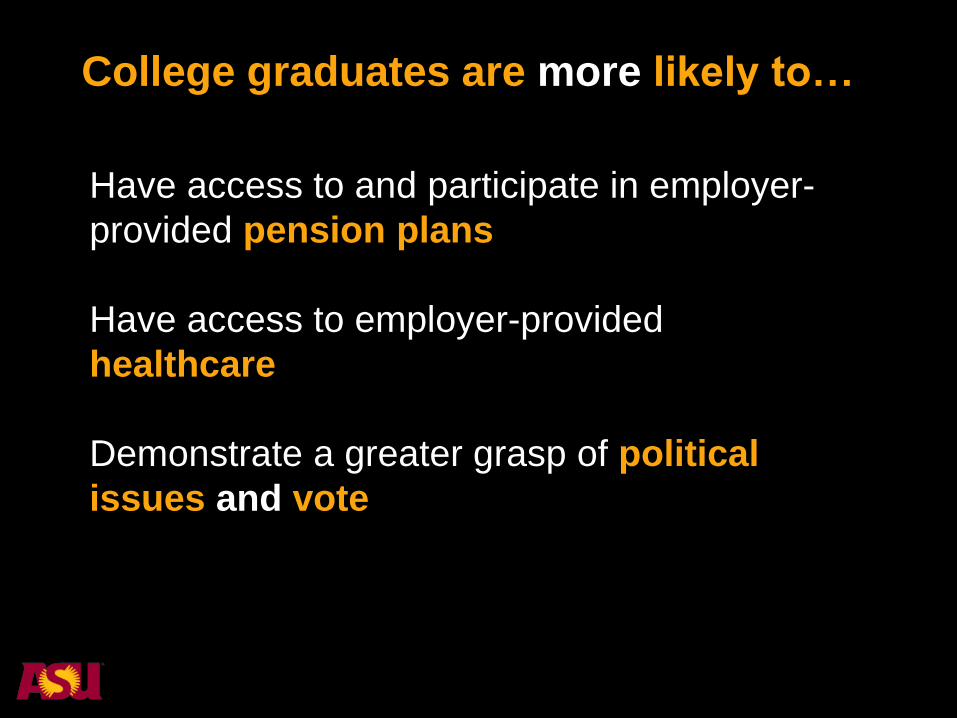
College graduates are more likely to…
Have access to and participate in employer-
provided pension plans
Have access to employer-provided
healthcare
Demonstrate a greater grasp of political
issues and vote
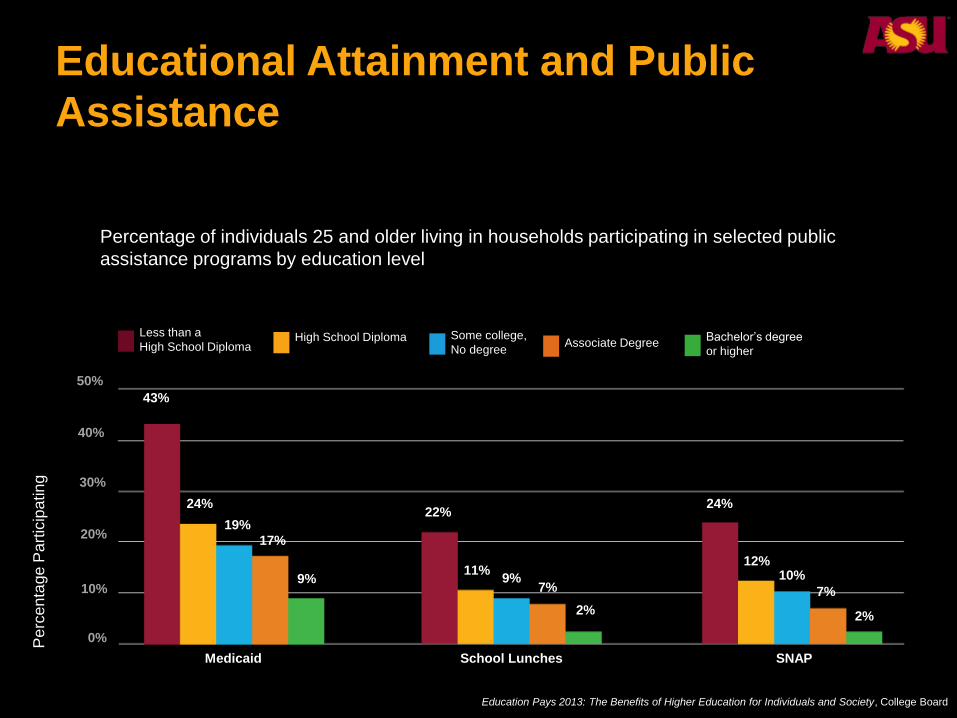
Educational Attainment and Public
Assistance
Pe
rcen
tage P
art
icip
atin
g
0%
10%
20%
30%
40%
50%
43%
24%
19%
17%
9%
22%
11% 9%
7%
2%
24%
12% 10%
7%
2%
Medicaid School Lunches SNAP
Less than a
High School Diploma High School Diploma Some college,
No degree Associate Degree
Bachelor’s degree
or higher
Percentage of individuals 25 and older living in households participating in selected public
assistance programs by education level
Education Pays 2013: The Benefits of Higher Education for Individuals and Society, College Board
The Challenge
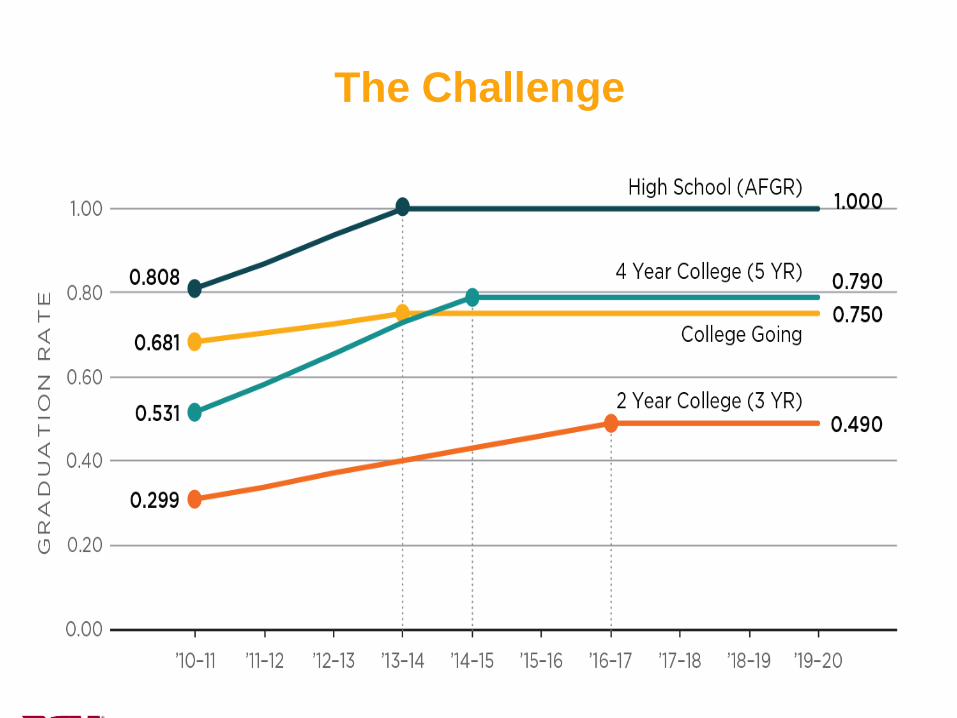
The Challenge
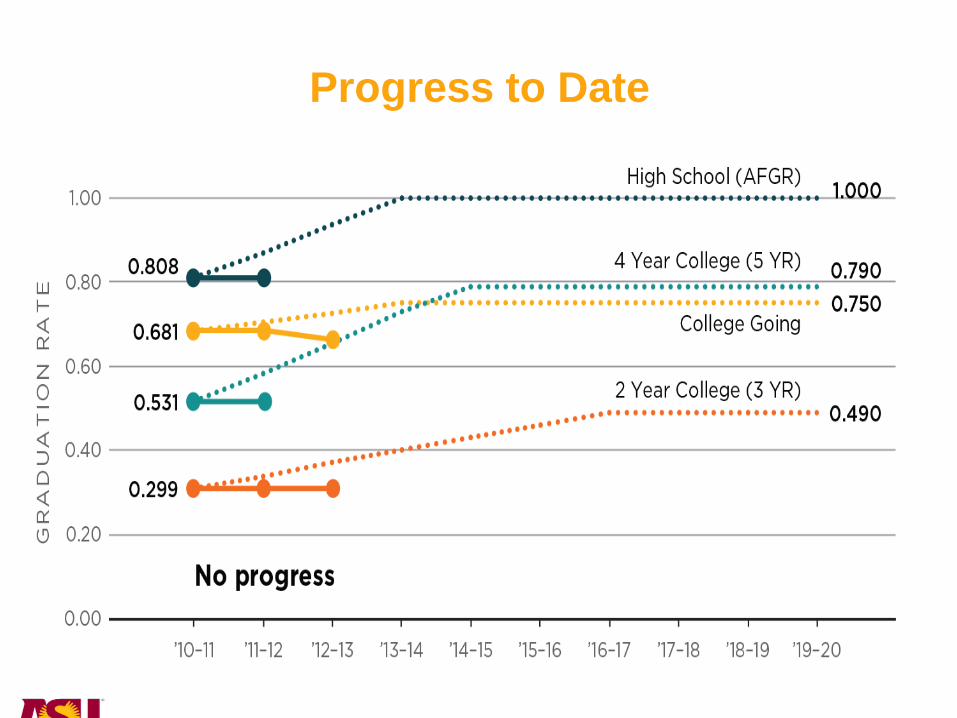
Progress to Date
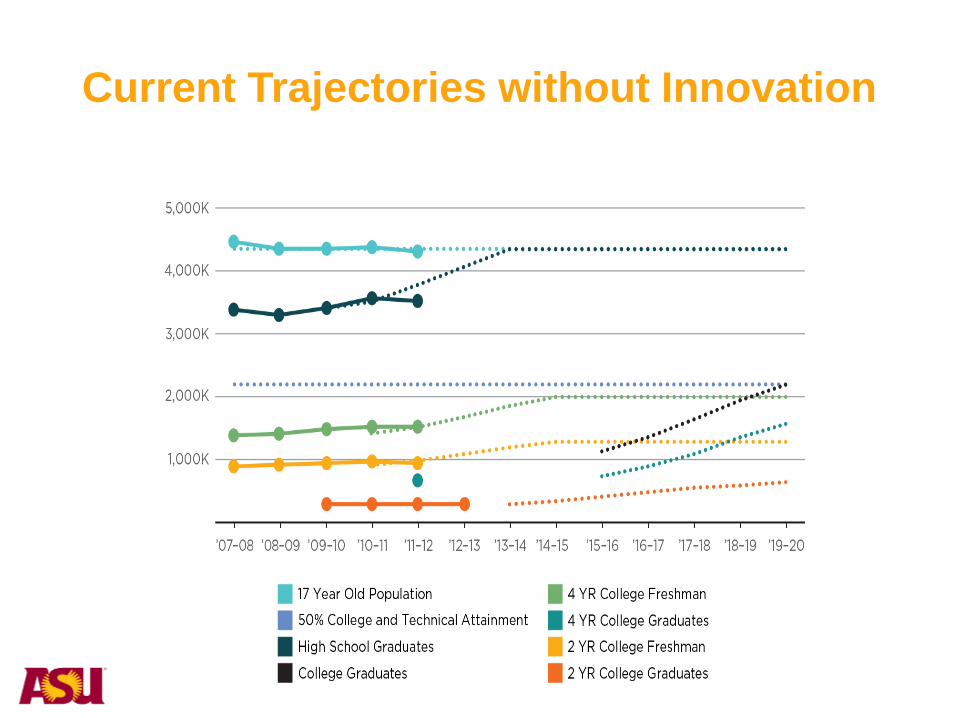
Current Trajectories without Innovation
What about Arizona?
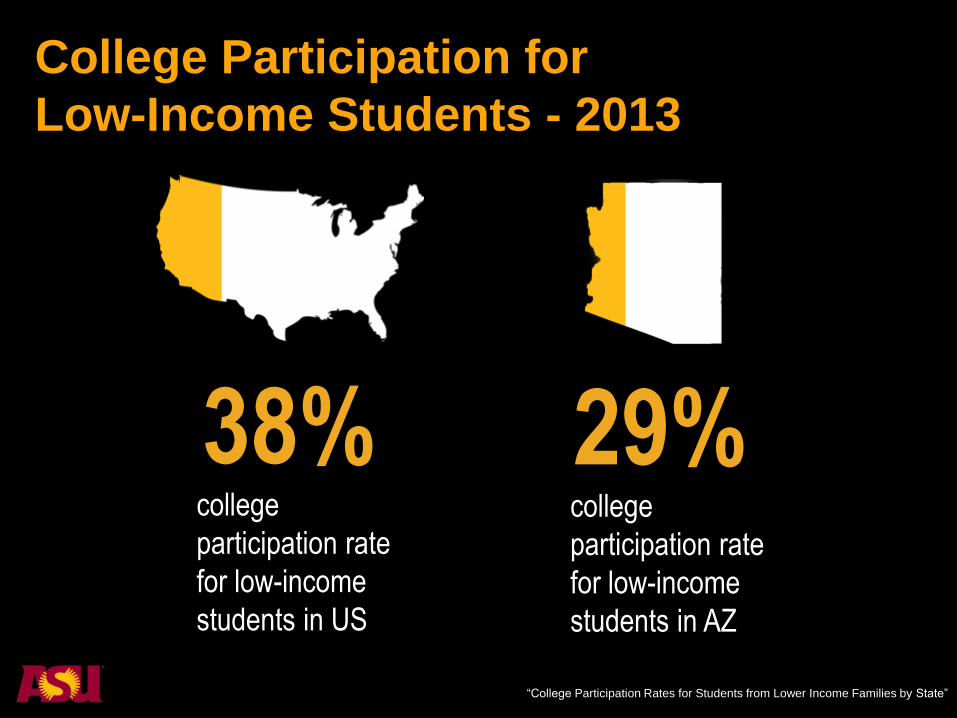
College Participation for
Low-Income Students - 2013
college
participation rate
for low-income
students in US
38% college
participation rate
for low-income
students in AZ
29%
“College Participation Rates for Students from Lower Income Families by State”
0
10
20
30
40
50
60
70
MA
SD
NJ
MN
ND
CT IA NE
NH
WI
PA
VA
NY
KS RI
MA
OH
MS
MO IN NC
AR
DE
US HI
CO
CA IL
TN
AL
MI
WV
GA
KY
NM
ME
WY
OK
SC
UT
VT
MT
TX
LA
FL ID
WA
AZ
OR
AK
DC
NV
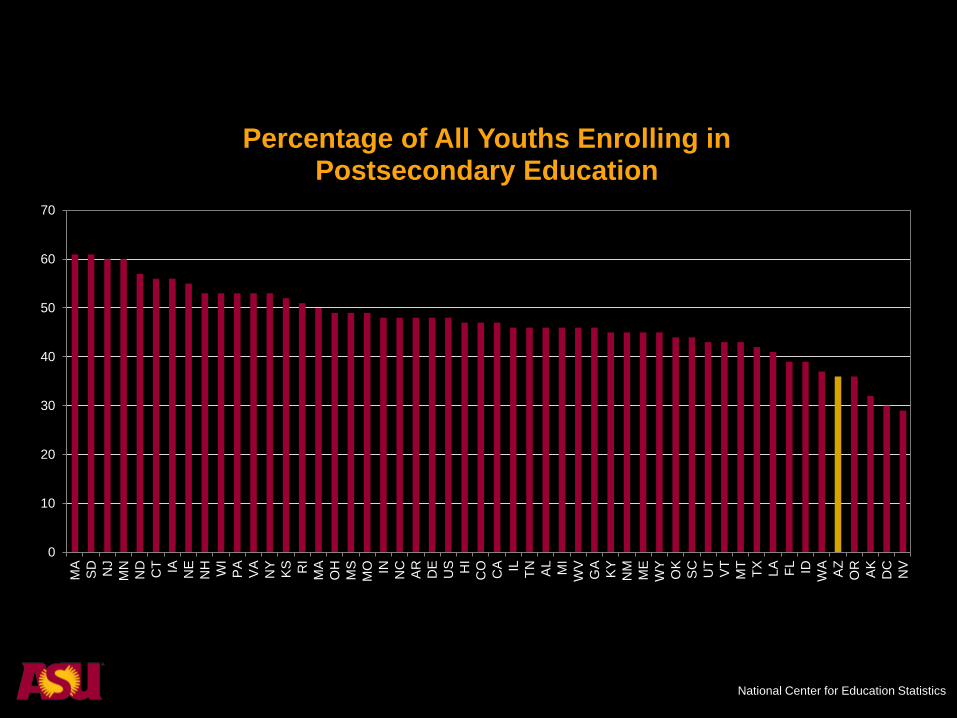
Percentage of All Youths Enrolling in Postsecondary Education
National Center for Education Statistics
Arizona is falling further behind.
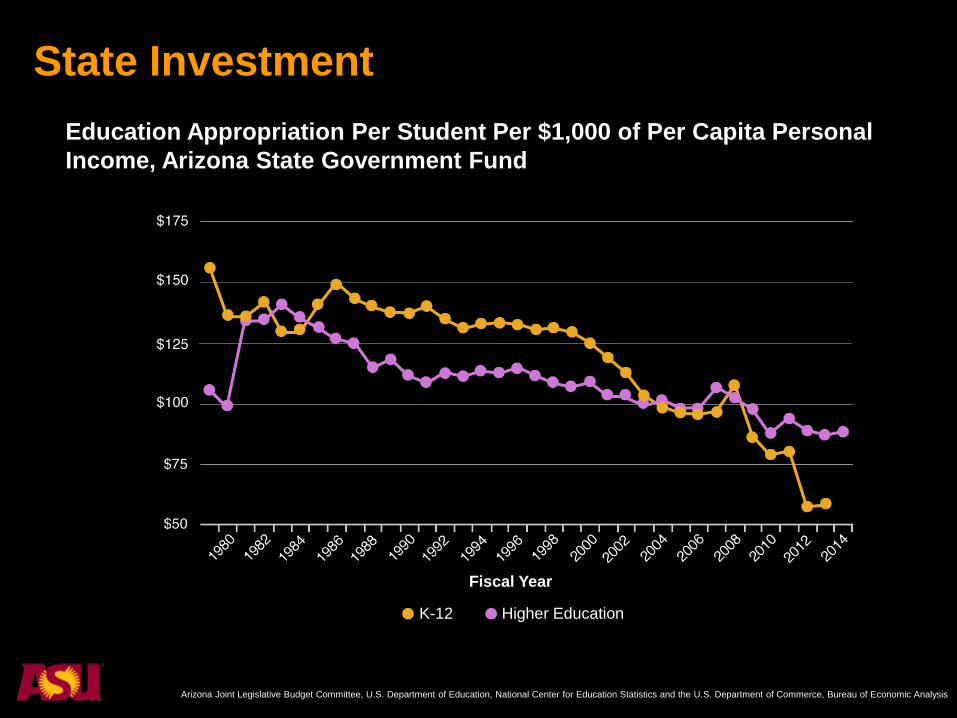
State Investment
Education Appropriation Per Student Per $1,000 of Per Capita Personal
Income, Arizona State Government Fund
K-12
Arizona Joint Legislative Budget Committee, U.S. Department of Education, National Center for Education Statistics and the U.S. Department of Commerce, Bureau of Economic Analysis
Higher Education
Fiscal Year
60%
70%
80%
90%
100%
110%
120%
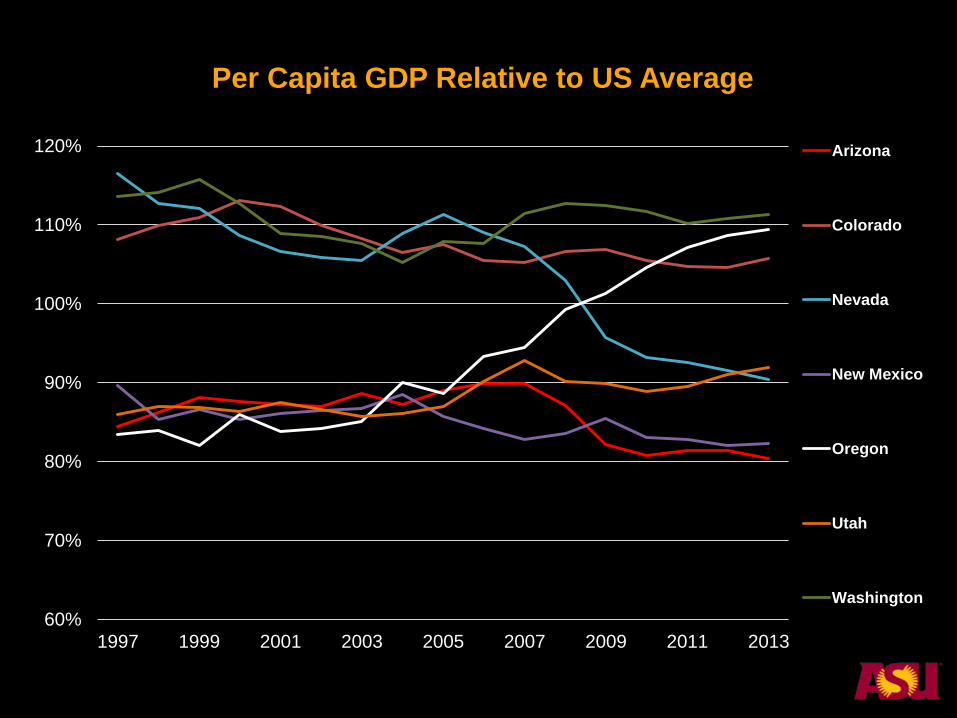
1997 1999 2001 2003 2005 2007 2009 2011 2013
Per Capita GDP Relative to US Average
Arizona
Colorado
Nevada
New Mexico
Oregon
Utah
Washington
-20%
-10%
0%
10%
20%
30%
40%
50%
4% 8% 12% 16% 20% 24% 28% 32%
Pe
rce
nt
Inc
rea
se
in
Pe
r
Ca
pit
a G
DP, 2
00
0-1
0
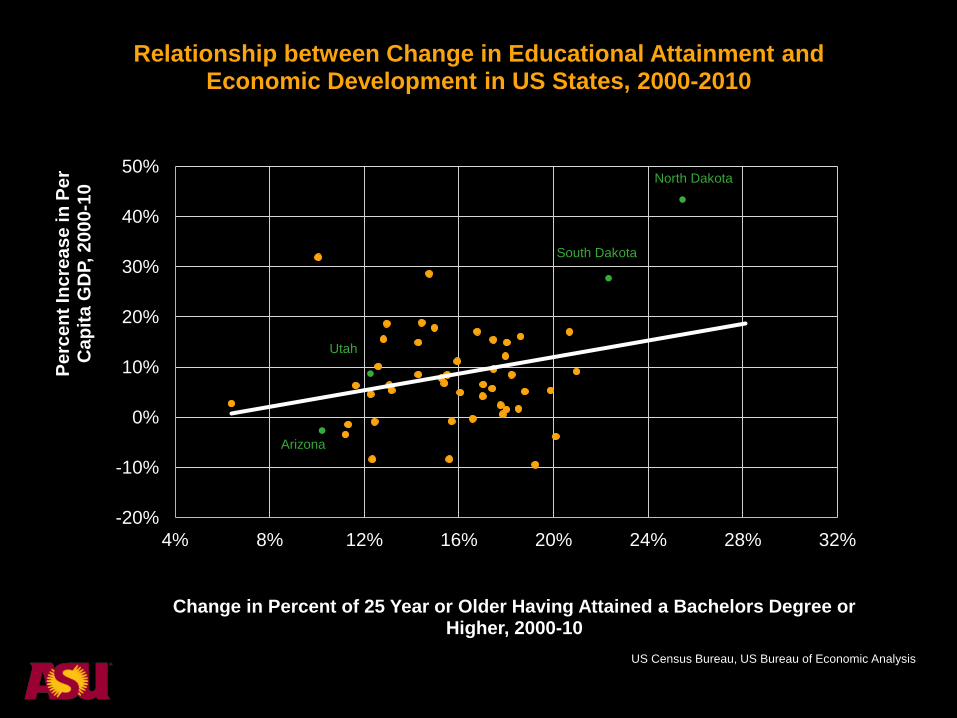
Change in Percent of 25 Year or Older Having Attained a Bachelors Degree or Higher, 2000-10
Relationship between Change in Educational Attainment and Economic Development in US States, 2000-2010
US Census Bureau, US Bureau of Economic Analysis
North Dakota
Arizona
Utah
South Dakota
$0
$20,000
$40,000
$60,000
$80,000
$100,000
$120,000
1000 1200 1400 1600 1800
Pe
r C
ap
ita
GD
P
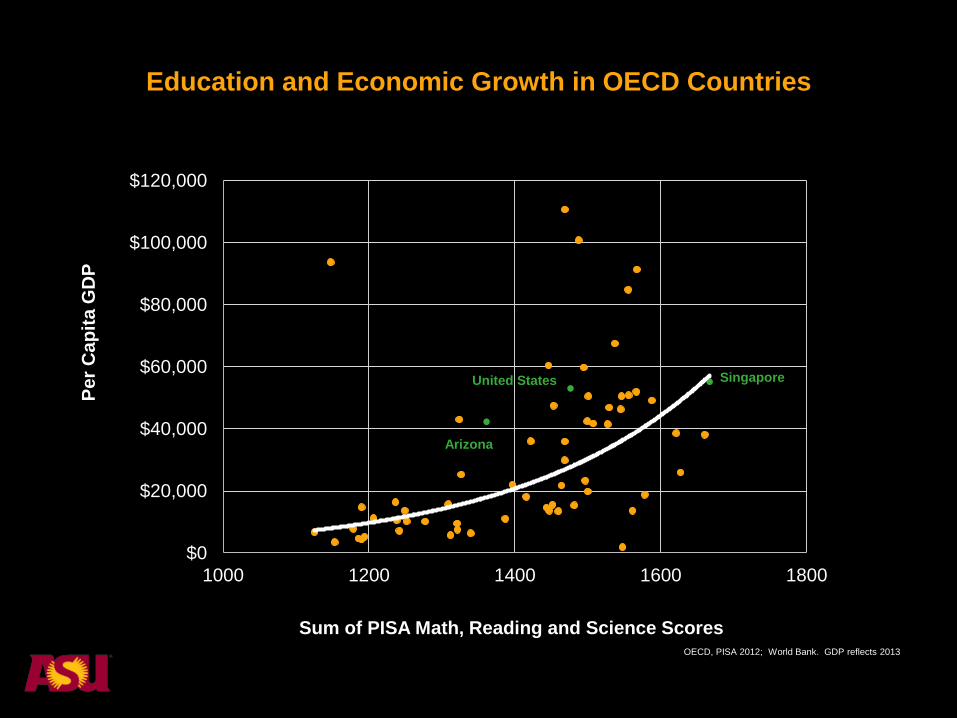
Sum of PISA Math, Reading and Science Scores
Education and Economic Growth in OECD Countries
OECD, PISA 2012; World Bank. GDP reflects 2013
Singapore
Arizona
United States
An estimated 68% of all jobs in Arizona
will require post-secondary education
by 2020.
Georgetown Public Policy Institute Center on Education and the Workforce Report
55,000 jobs open up every year
requiring training beyond high school.
Arizona sends 32,000 high school
graduates to college, and 25% of those
are not prepared for college-level work.
Arizona Ready Report “Necessary But Not Sufficient”
What about Latinos in
Arizona?
Between 2000-2010, Arizona
experienced a 25% increase in
population, the 6th largest increase
nationally.
U.S. Census Bureau
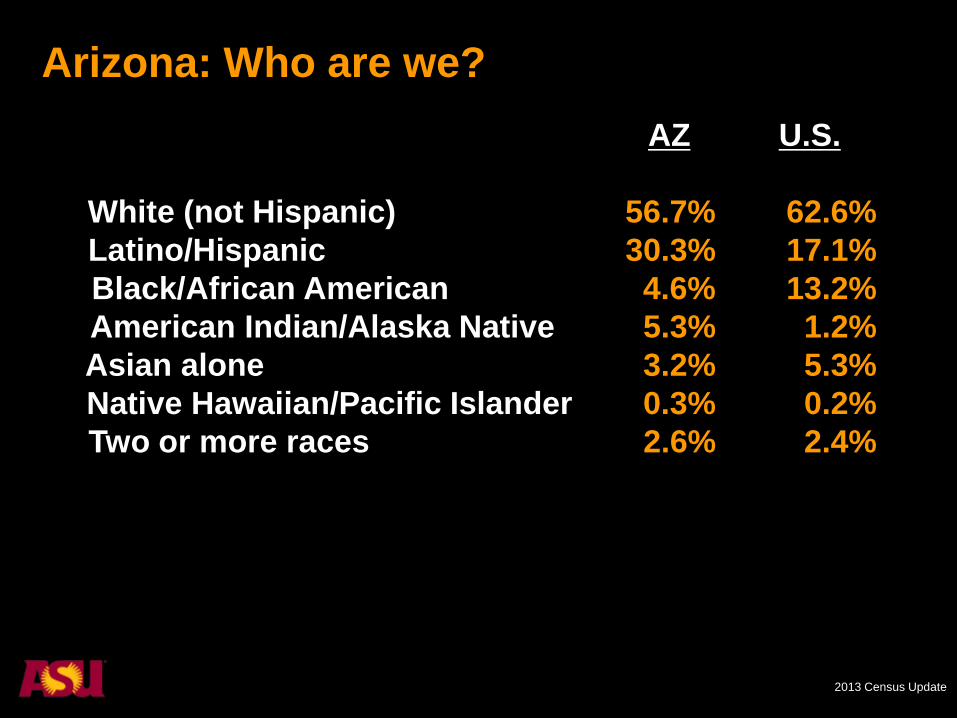
AZ U.S.
White (not Hispanic) 56.7% 62.6%
Latino/Hispanic 30.3% 17.1%
Black/African American 4.6% 13.2%
American Indian/Alaska Native 5.3% 1.2%
Asian alone 3.2% 5.3%
Native Hawaiian/Pacific Islander 0.3% 0.2%
Two or more races 2.6% 2.4%
Arizona: Who are we?
2013 Census Update
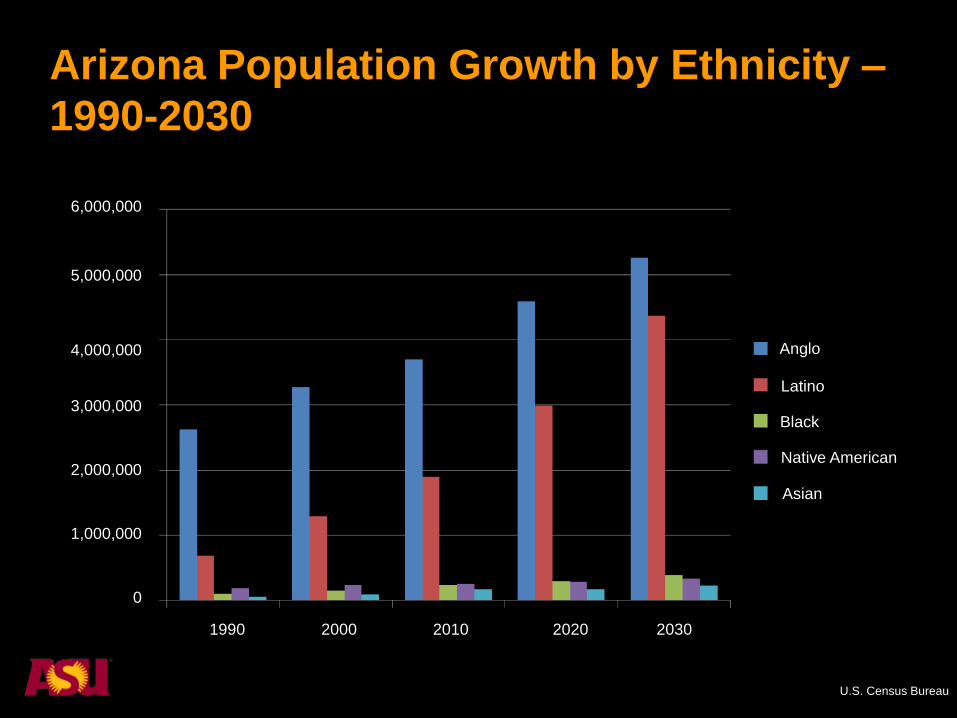
Arizona Population Growth by Ethnicity –
1990-2030
U.S. Census Bureau
Anglo
Latino
Black
Native American
Asian
0
1,000,000
2,000,000
3,000,000
4,000,000
5,000,000
6,000,000
1990 2000 2010 2020 2030
U.S. Census Bureau
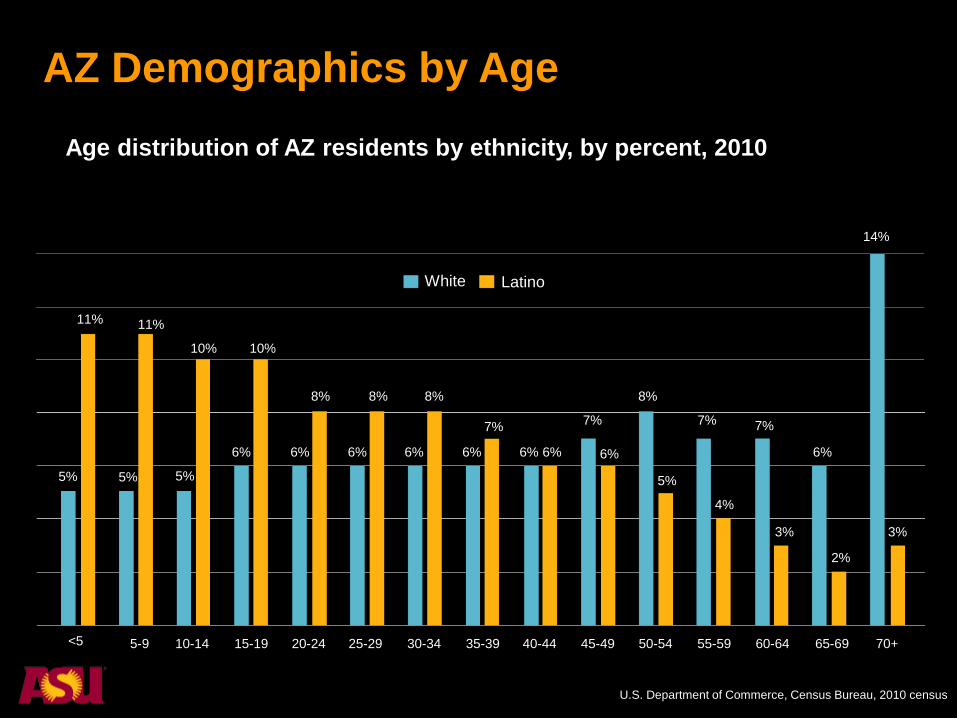
AZ Demographics by Age
Age distribution of AZ residents by ethnicity, by percent, 2010
White Latino
5%
11%
5% 5%
6% 6% 6% 6% 6% 6%
7%
8%
5%
7%
4%
7%
3%
6%
2%
14%
3%
11%
10% 10%
8% 8% 8%
7%
6% 6%
<5 5-9 10-14 15-19 20-24 25-29 30-34 35-39 40-44 45-49 50-54 55-59 60-64 65-69 70+
U.S. Department of Commerce, Census Bureau, 2010 census
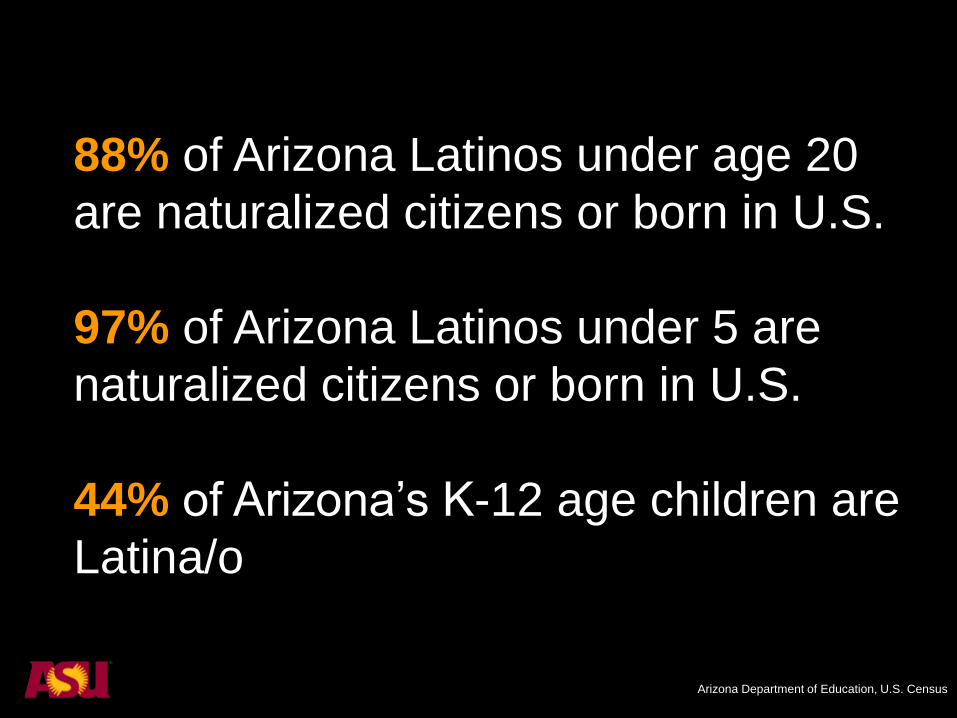
88% of Arizona Latinos under age 20
are naturalized citizens or born in U.S.
97% of Arizona Latinos under 5 are
naturalized citizens or born in U.S.
44% of Arizona’s K-12 age children are
Latina/o
Arizona Department of Education, U.S. Census
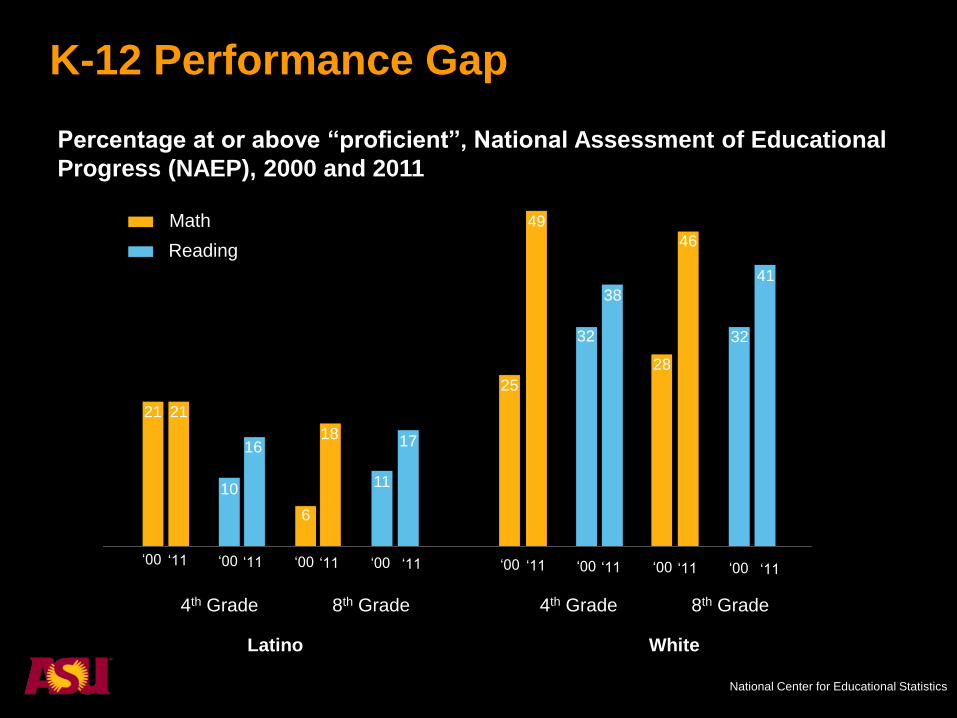
K-12 Performance Gap
Percentage at or above “proficient”, National Assessment of Educational
Progress (NAEP), 2000 and 2011
Latino White
Math
Reading
21 21
10
16
6
18
11
17
25
49
32
38
28
46
32
41
‘00 ‘11 ‘00 ‘11 ‘00 ‘11 ‘00 ‘11 ‘00 ‘11 ‘00 ‘11 ‘00 ‘11 ‘00 ‘11
4th Grade 8th Grade 4th Grade 8th Grade
National Center for Educational Statistics
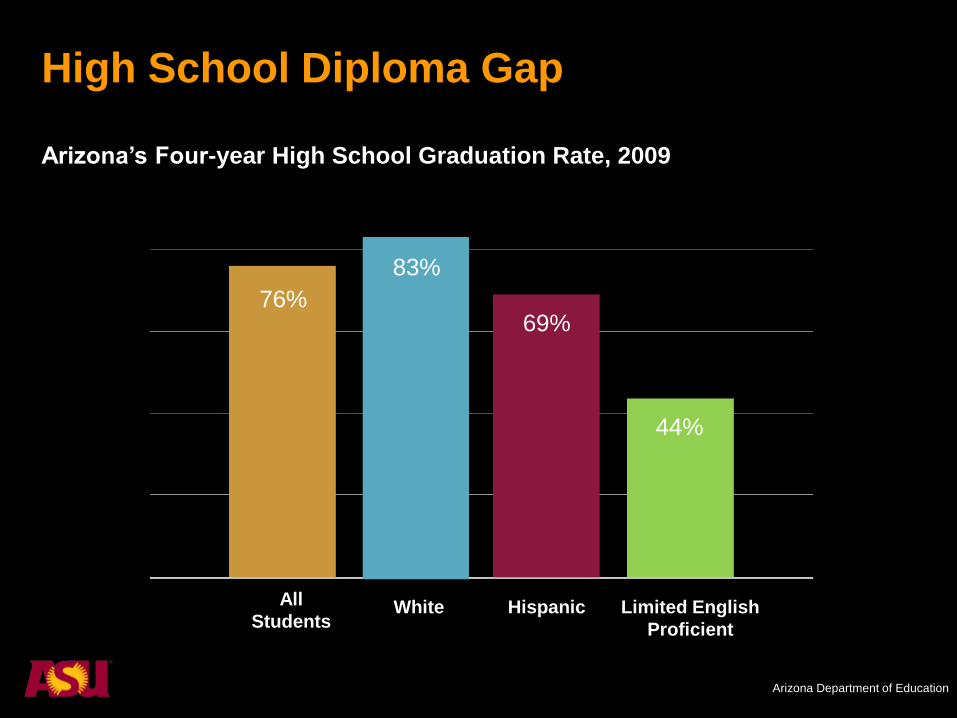
High School Diploma Gap
Arizona’s Four-year High School Graduation Rate, 2009
76%
83%
69%
44%
All
Students White Hispanic Limited English
Proficient
Arizona Department of Education
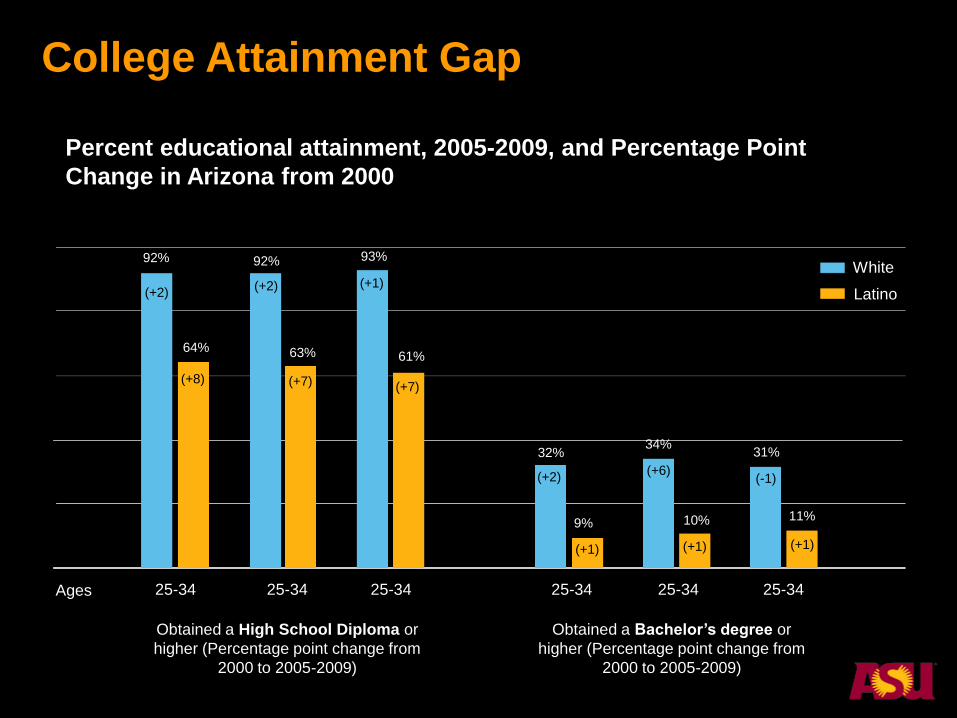
White
Latino
92%
64%
92%
63%
93%
61%
32%
9%
34%
10%
31%
11%
(+2)
(+8)
(+2)
(+7) (+7)
(+1)
(+2)
(+1)
(+6)
(+1)
(-1)
(+1)
25-34 25-34 25-34 25-34 25-34 25-34 Ages
College Attainment Gap
Percent educational attainment, 2005-2009, and Percentage Point
Change in Arizona from 2000
Obtained a High School Diploma or
higher (Percentage point change from
2000 to 2005-2009)
Obtained a Bachelor’s degree or
higher (Percentage point change from
2000 to 2005-2009)
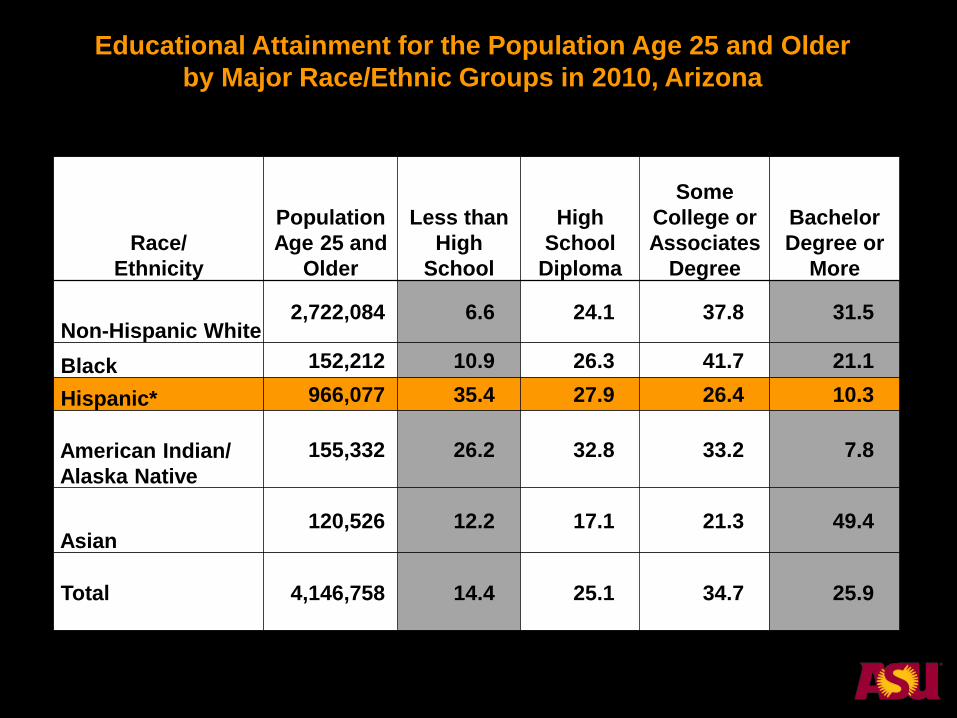
Educational Attainment for the Population Age 25 and Older
by Major Race/Ethnic Groups in 2010, Arizona
Race/
Ethnicity
Population
Age 25 and
Older
Less than
High
School
High
School
Diploma
Some
College or
Associates
Degree
Bachelor
Degree or
More
Non-Hispanic White 2,722,084 6.6 24.1 37.8 31.5
Black 152,212 10.9 26.3 41.7 21.1
Hispanic* 966,077 35.4 27.9 26.4 10.3
American Indian/
Alaska Native
155,332 26.2 32.8 33.2 7.8
Asian 120,526 12.2 17.1 21.3 49.4
Total
4,146,758
14.4
25.1
34.7
25.9

The Result
58% of Latinos in Arizona live in
poverty.
Poverty is a key determinant for
college readiness and attainment.
National Center for Children in Poverty
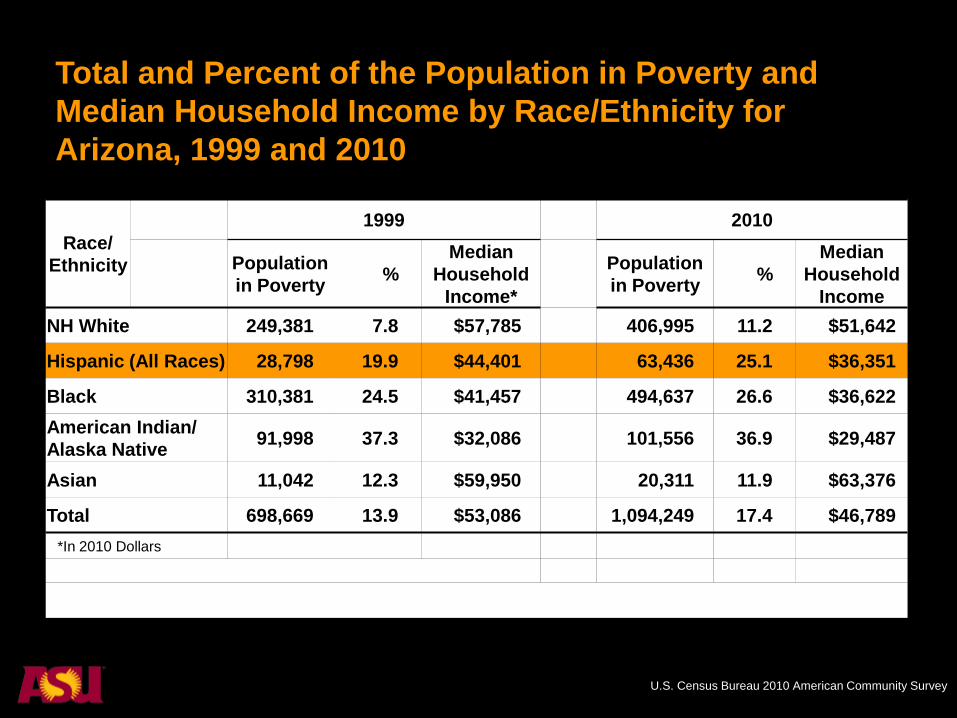
Total and Percent of the Population in Poverty and
Median Household Income by Race/Ethnicity for
Arizona, 1999 and 2010
Race/
Ethnicity
1999 2010
Population
in Poverty %
Median
Household
Income*
Population
in Poverty %
Median
Household
Income
NH White 249,381 7.8 $57,785 406,995 11.2 $51,642
Hispanic (All Races) 28,798 19.9 $44,401 63,436 25.1 $36,351
Black 310,381 24.5 $41,457 494,637 26.6 $36,622
American Indian/
Alaska Native 91,998 37.3 $32,086 101,556 36.9 $29,487
Asian 11,042 12.3 $59,950 20,311 11.9 $63,376
Total 698,669 13.9 $53,086 1,094,249 17.4 $46,789
*In 2010 Dollars
U.S. Census Bureau 2010 American Community Survey
Poverty in Arizona
Without game-changing progress in
educational attainment, it is projected
that 62% of Latinos will live in poverty
compared to 31% of Whites.
Dropped? Latino Education and Arizona’s Economic Future
A New Economy
Requires a New Kind of
University
ASU Charter
ASU is a comprehensive public research
university, measured not by whom it
excludes, but by whom it includes and how
they succeed; advancing research and
discovery of public value; and assuming
fundamental responsibility for the
economic, social, cultural, and overall
health of the communities it serves.
Demonstrate leadership in academic excellence and
accessibility
ASU Goals
Enhance our local impact and social embeddedness
Establish ASU as a global center for interdisciplinary
research, discovery and development by 2020
Establish ASU as a global center for interdisciplinary
research, discovery and development by 2020
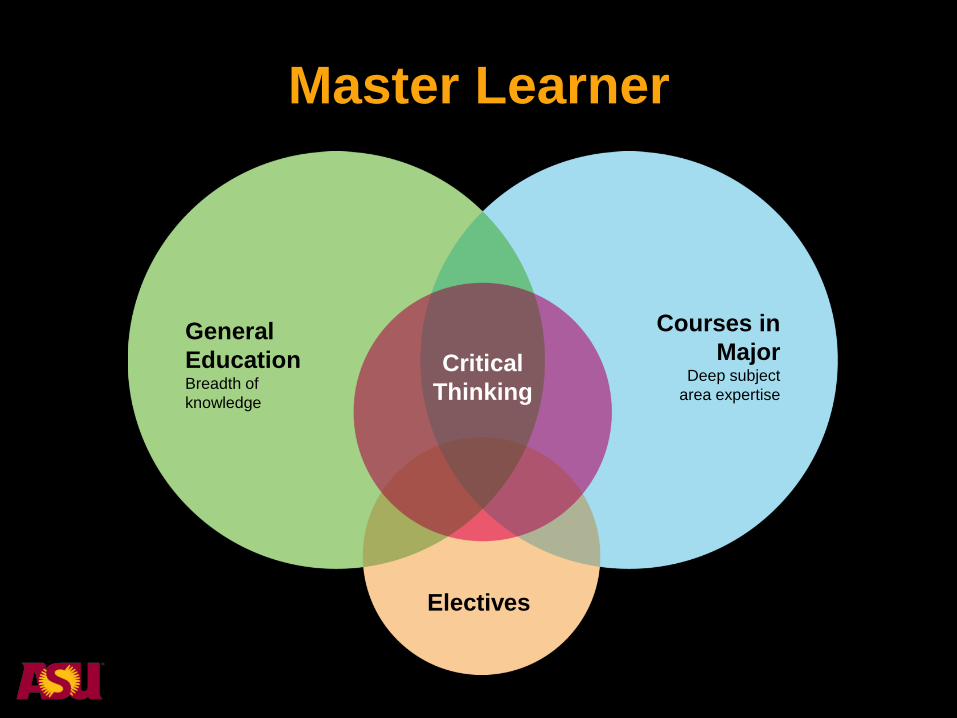
Master Learner
Critical
Thinking
General
Education Breadth of
knowledge
Courses in
Major Deep subject
area expertise
Electives
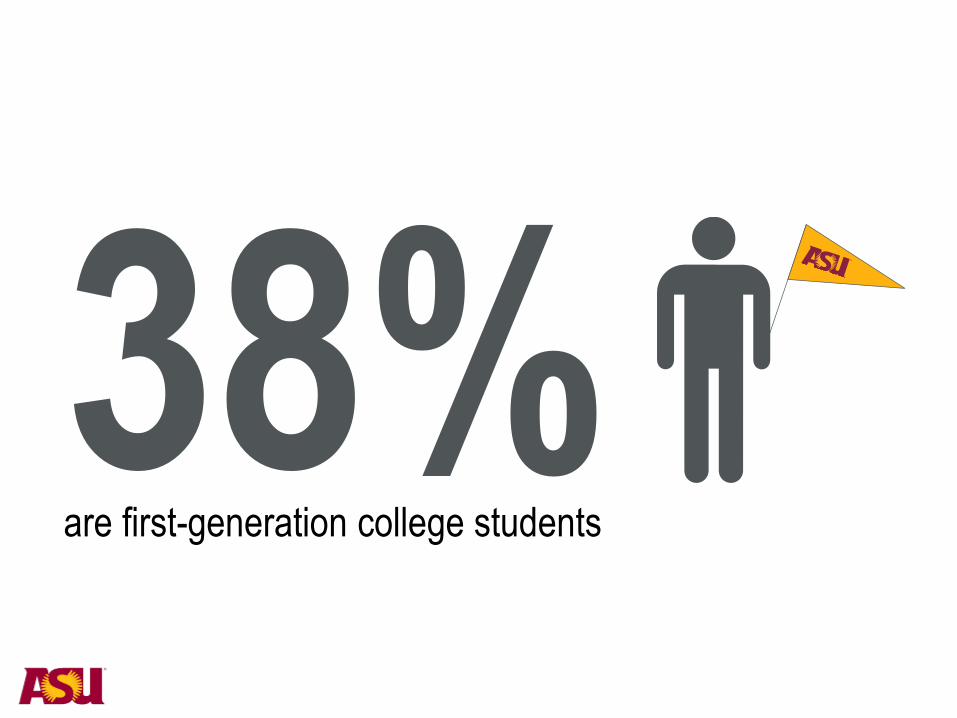
are first-generation college students
2013 ASU Census Data; ASU Fall 2013 Resident Undergraduate Enrollment
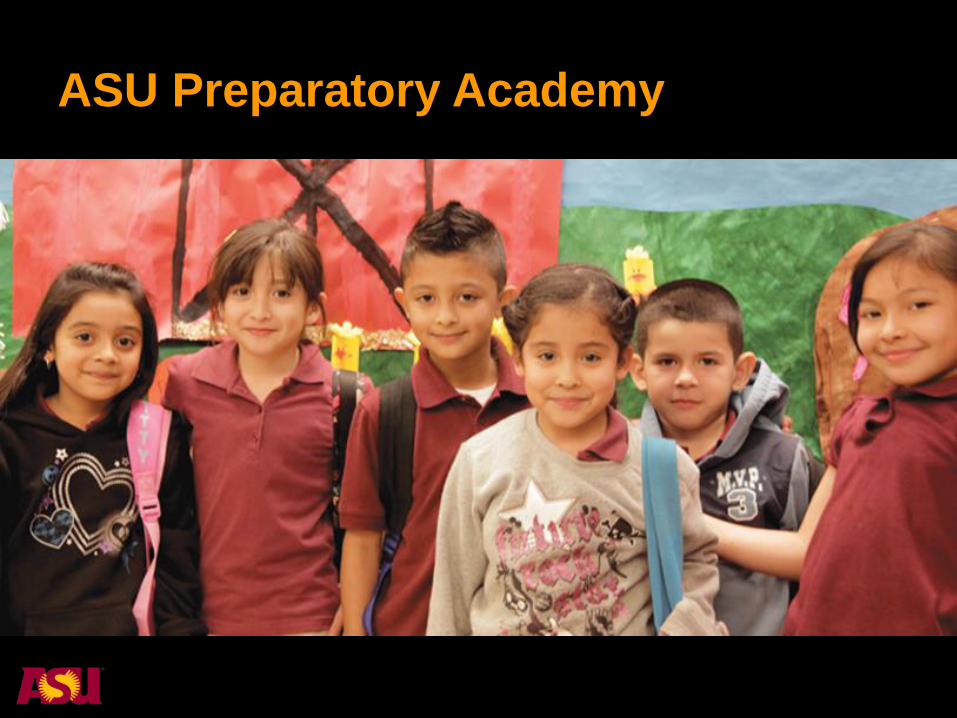
ASU Preparatory Academy
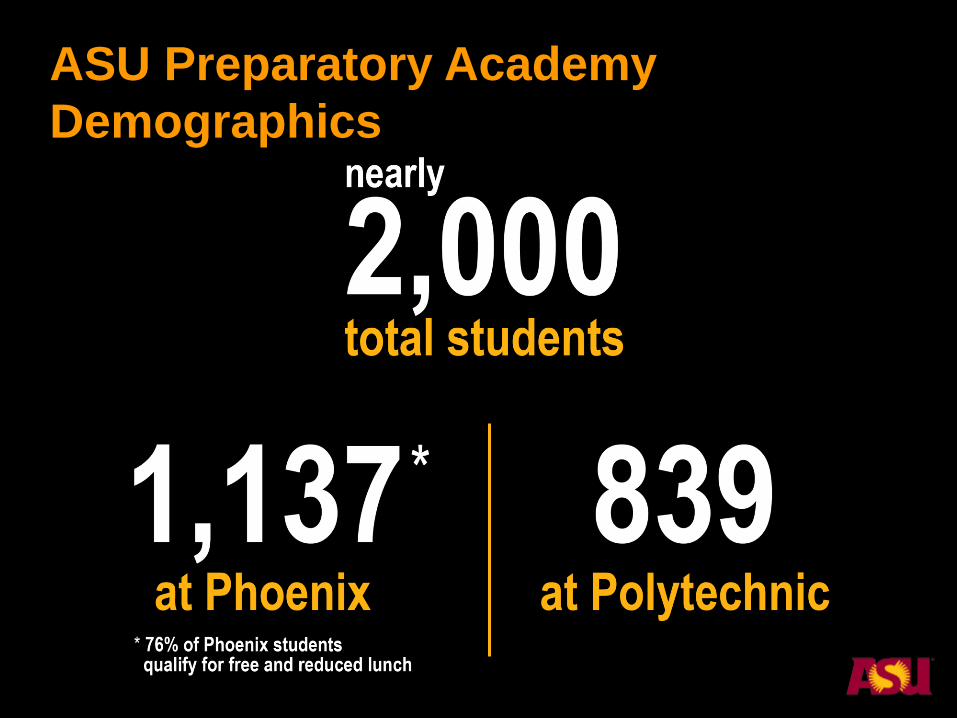
ASU Preparatory Academy
Demographics
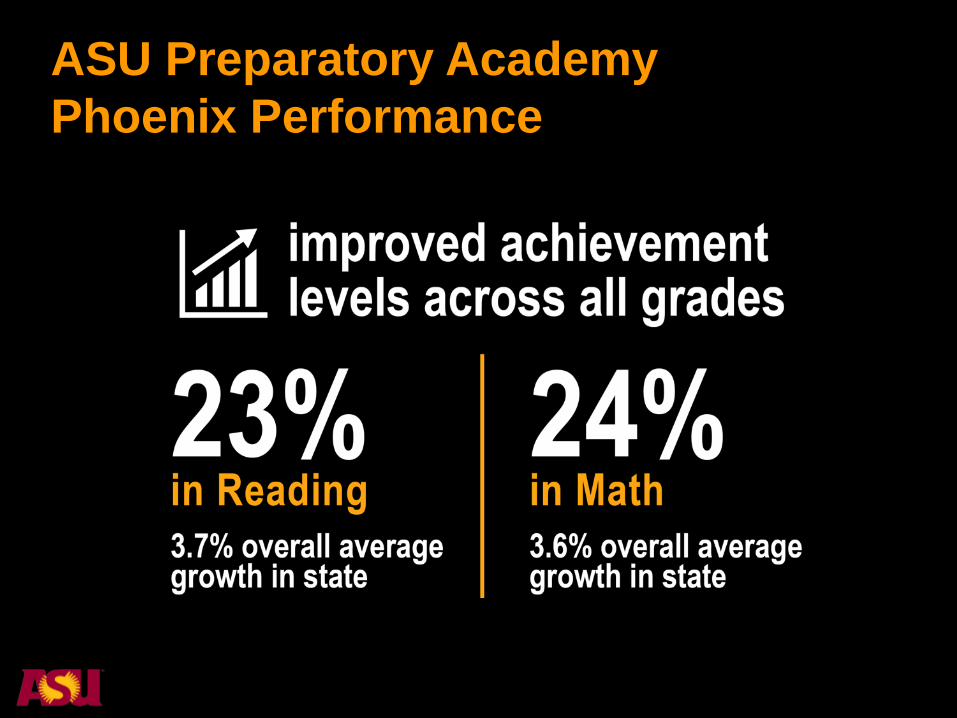
ASU Preparatory Academy
Phoenix Performance
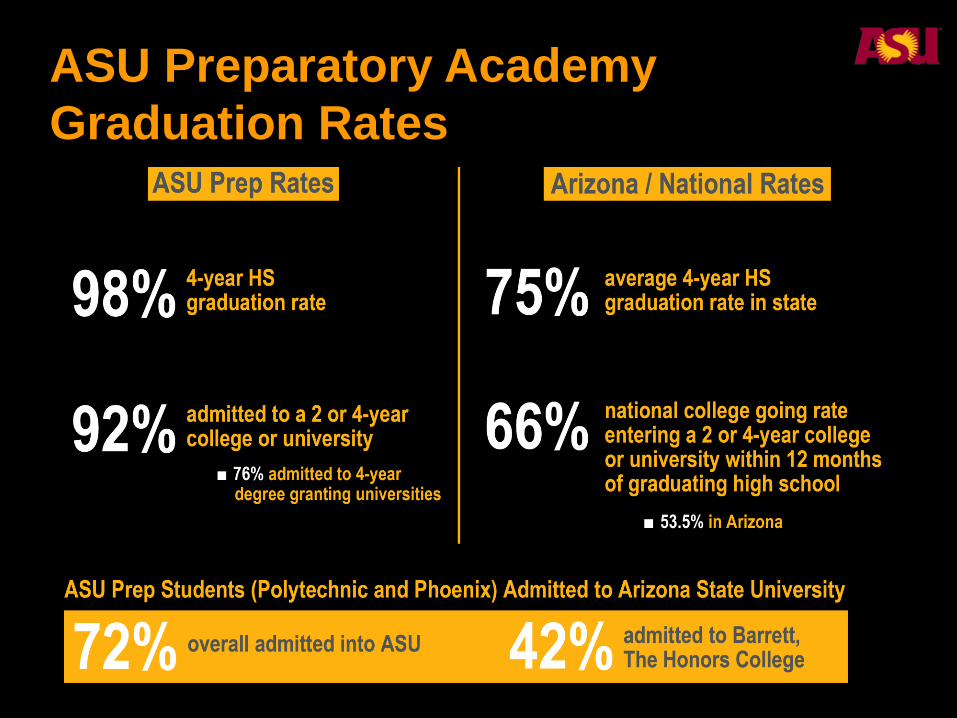
ASU Preparatory Academy
Graduation Rates
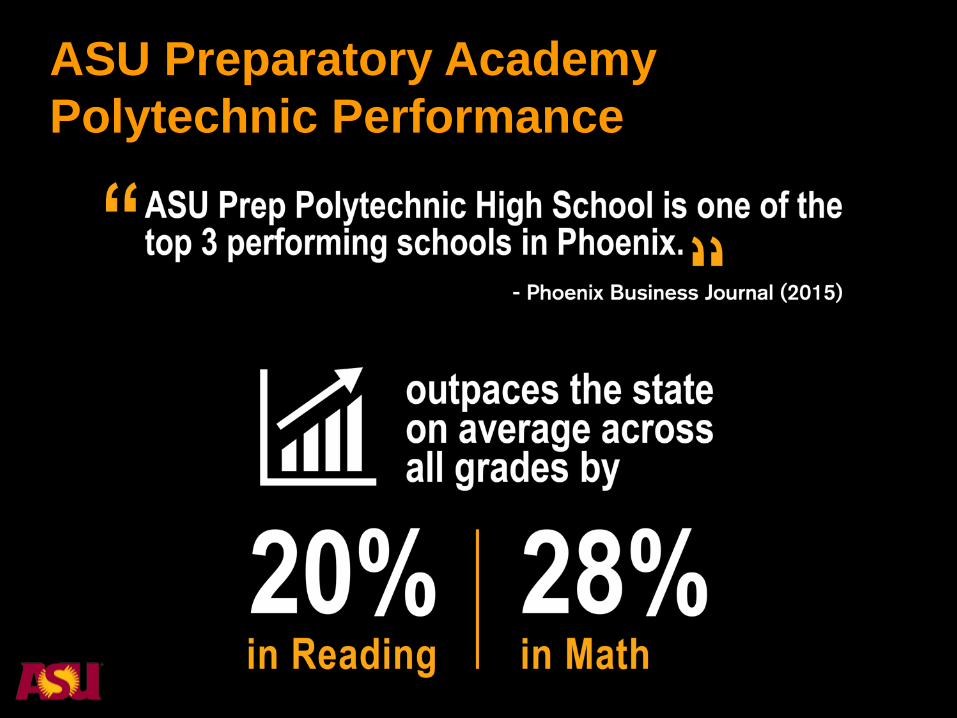
ASU Preparatory Academy
Polytechnic Performance
Access ASU
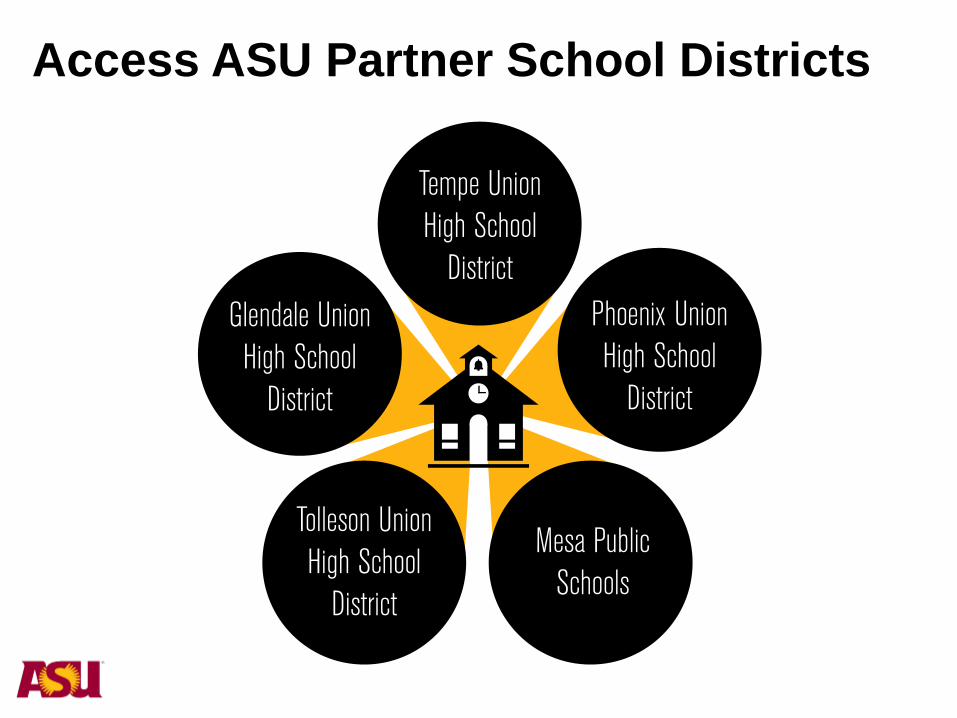
Access ASU Partner School Districts
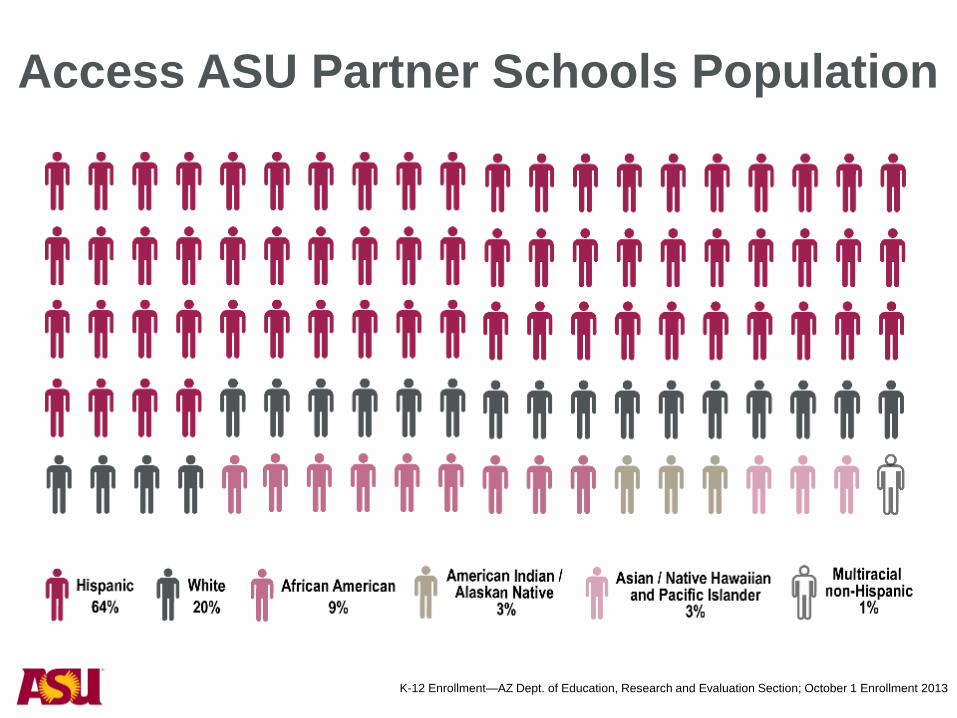
64%
20%
9% 3%
1%
Hispanic 64% White 20% African American 9%
Asian 3% Native American 3% Other 1%
Access ASU Partner Schools Population
3%
K-12 Enrollment—AZ Dept. of Education, Research and Evaluation Section; October 1 Enrollment 2013
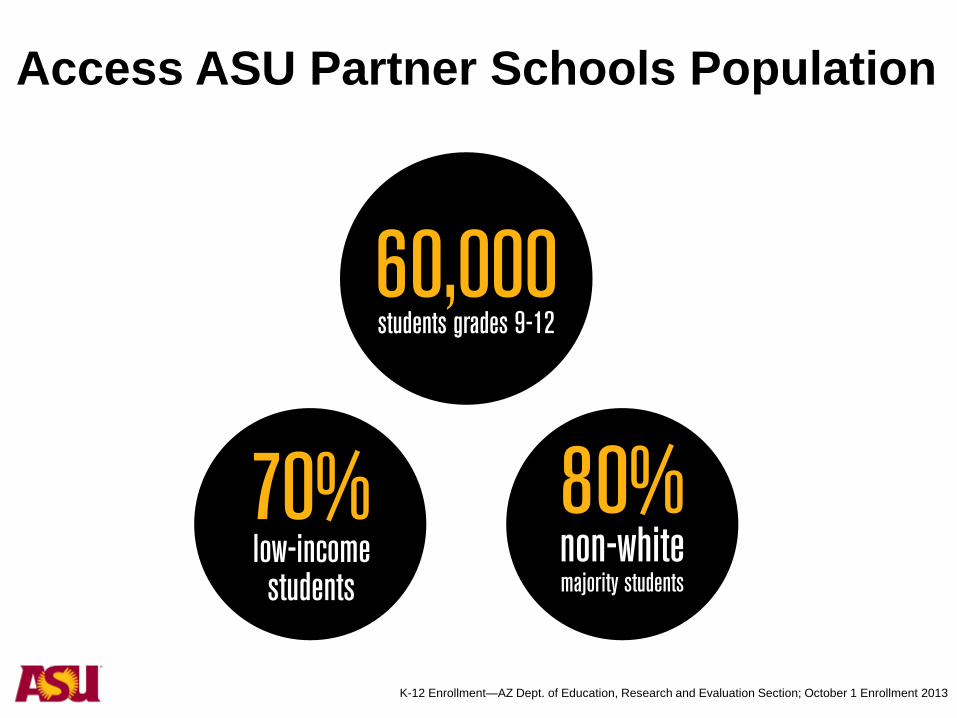
Access ASU Partner Schools Population
K-12 Enrollment—AZ Dept. of Education, Research and Evaluation Section; October 1 Enrollment 2013
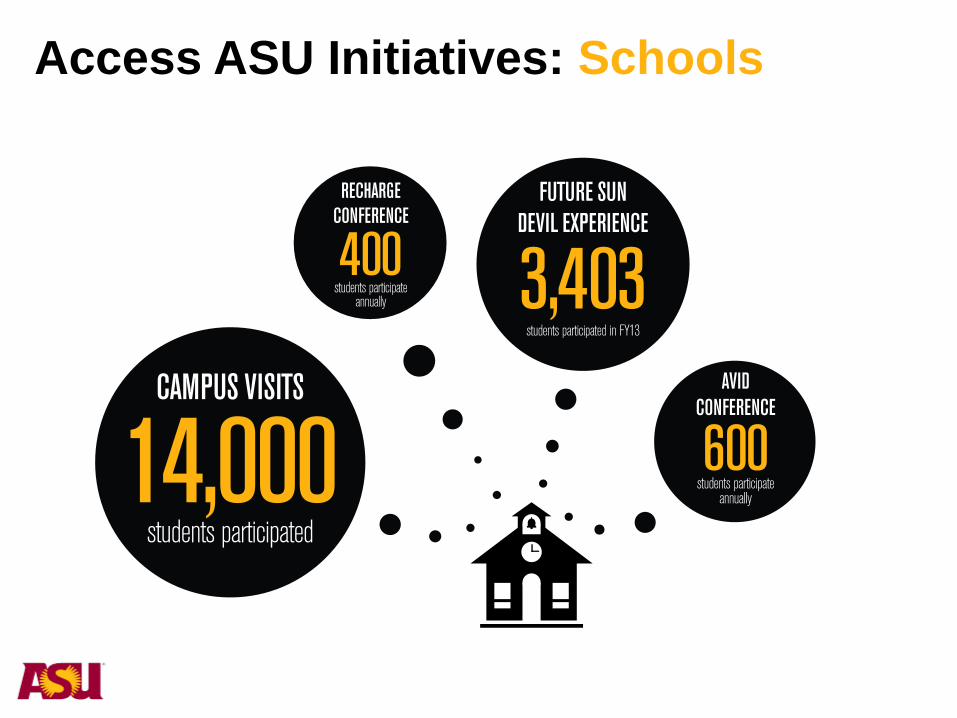
Access ASU Initiatives: Schools
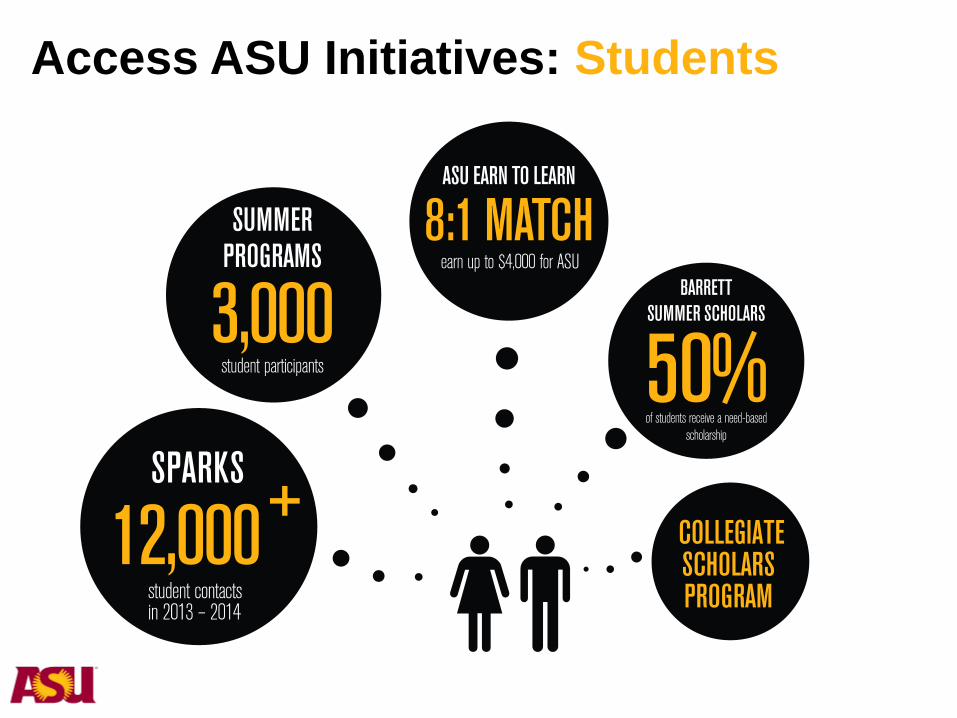
Access ASU Initiatives: Students
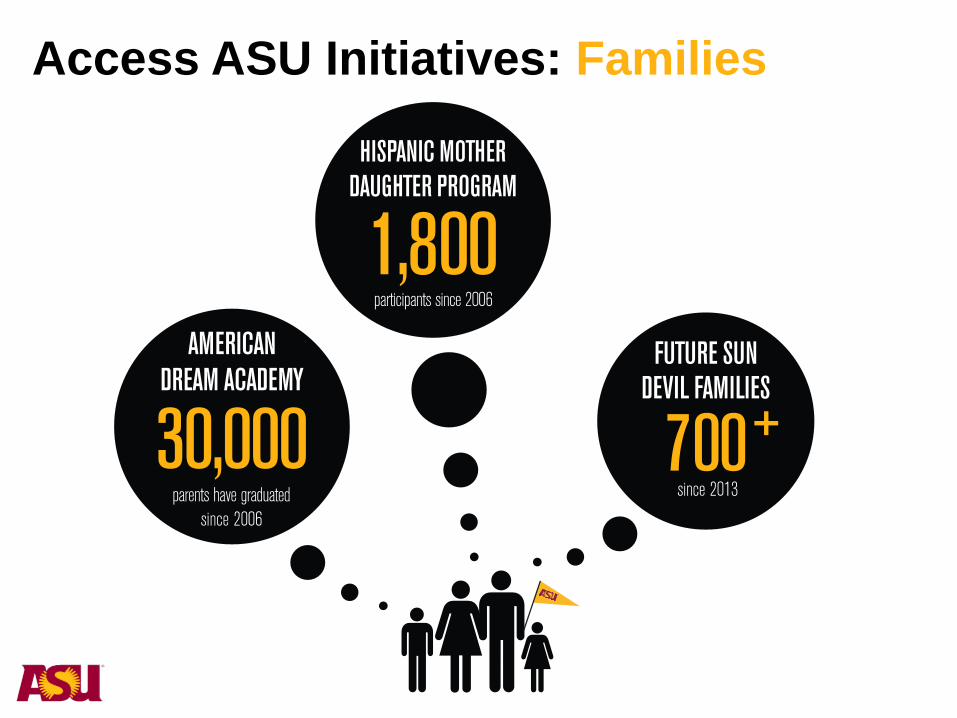
Access ASU Initiatives: Families
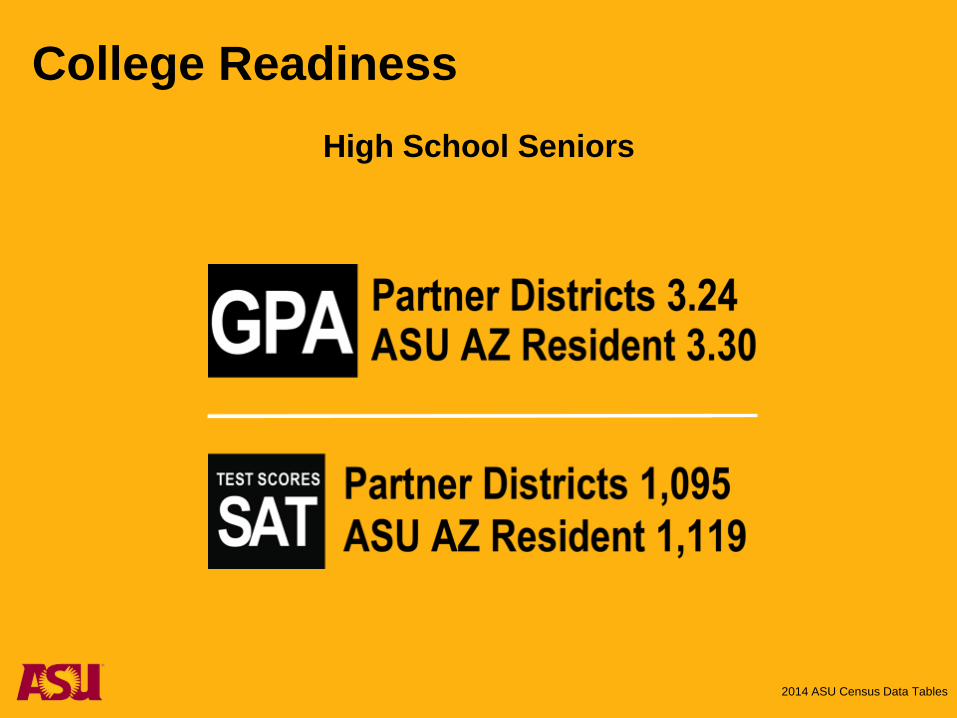
High School Seniors
College Readiness
2014 ASU Census Data Tables
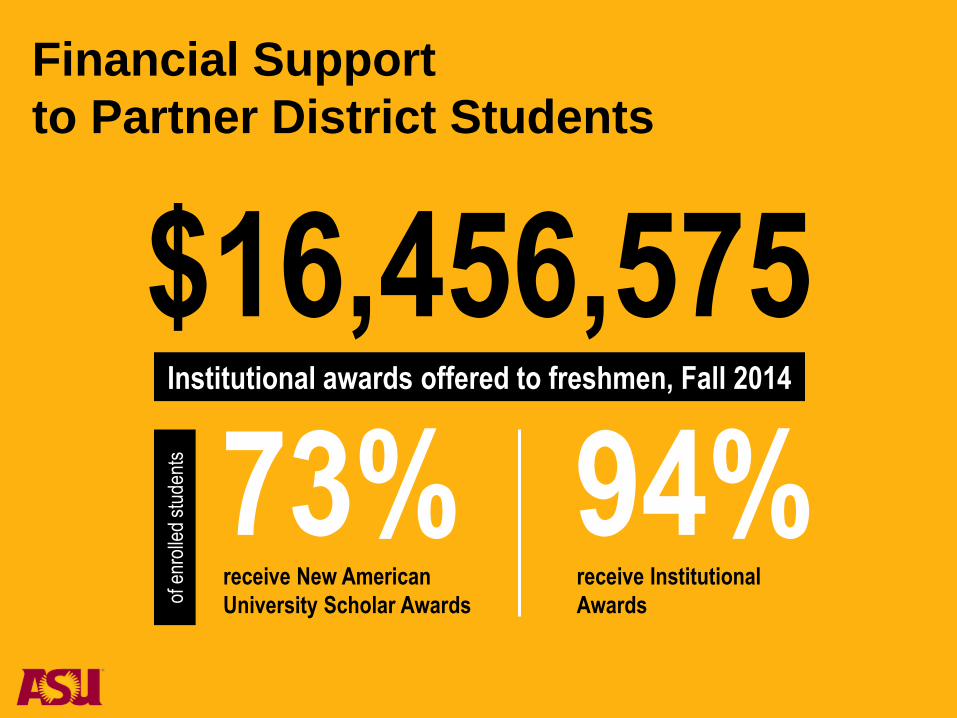
Financial Support
to Partner District Students
$16,456,575 Institutional awards offered to freshmen, Fall 2014
of e
nrol
led
stud
ents
73% receive New American
University Scholar Awards
94% receive Institutional
Awards
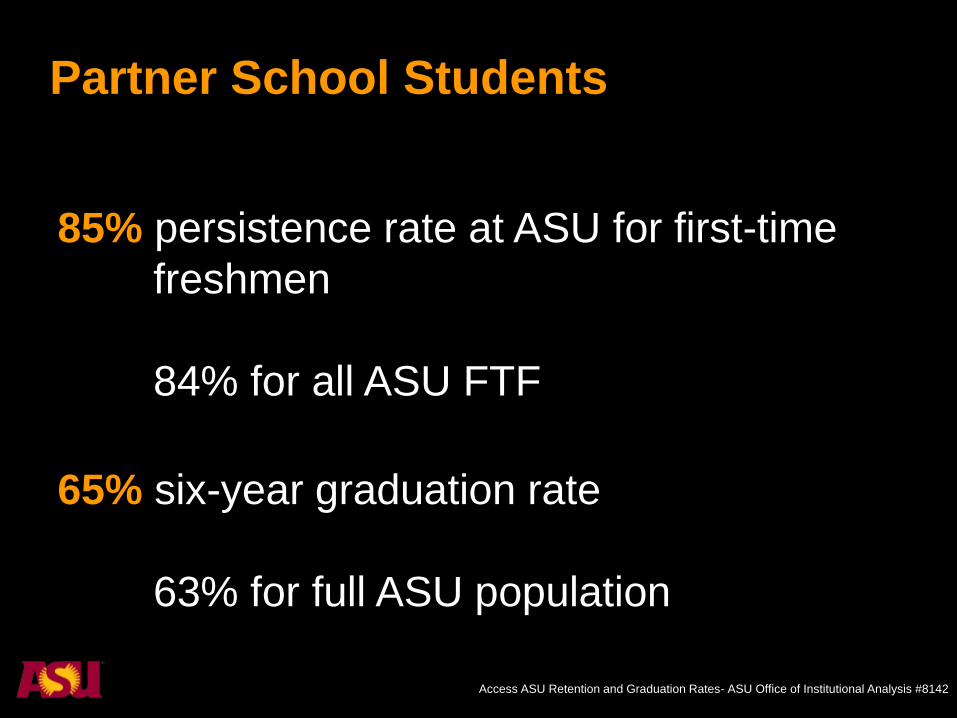
Access ASU Retention and Graduation Rates- ASU Office of Institutional Analysis #8142
85% persistence rate at ASU for first-time
freshmen
84% for all ASU FTF
65% six-year graduation rate
63% for full ASU population
Partner School Students
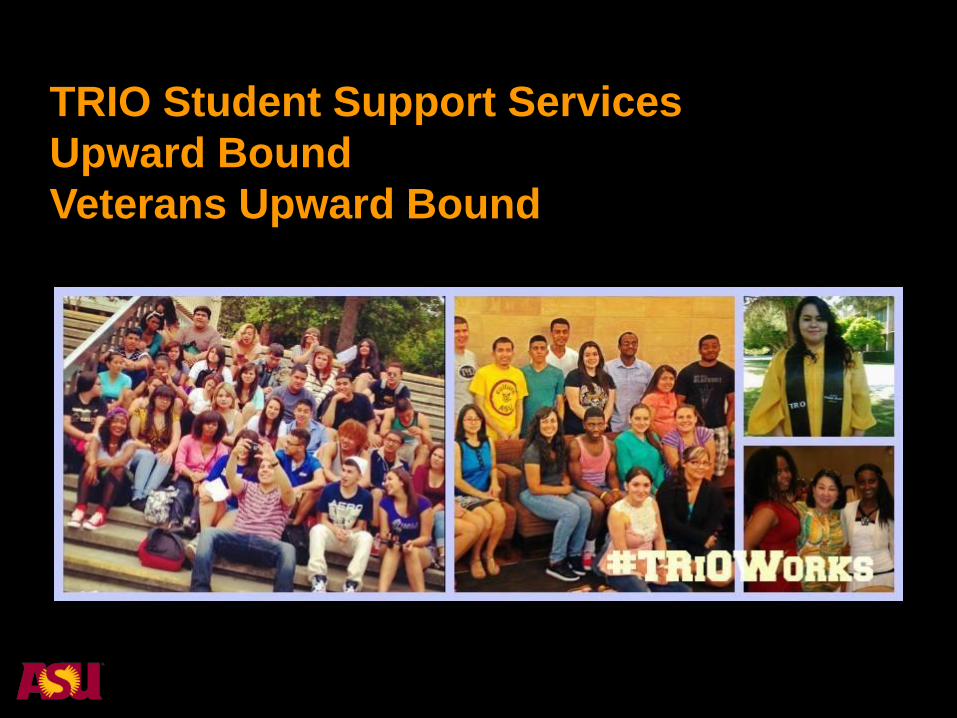
TRIO Student Support Services
Upward Bound
Veterans Upward Bound
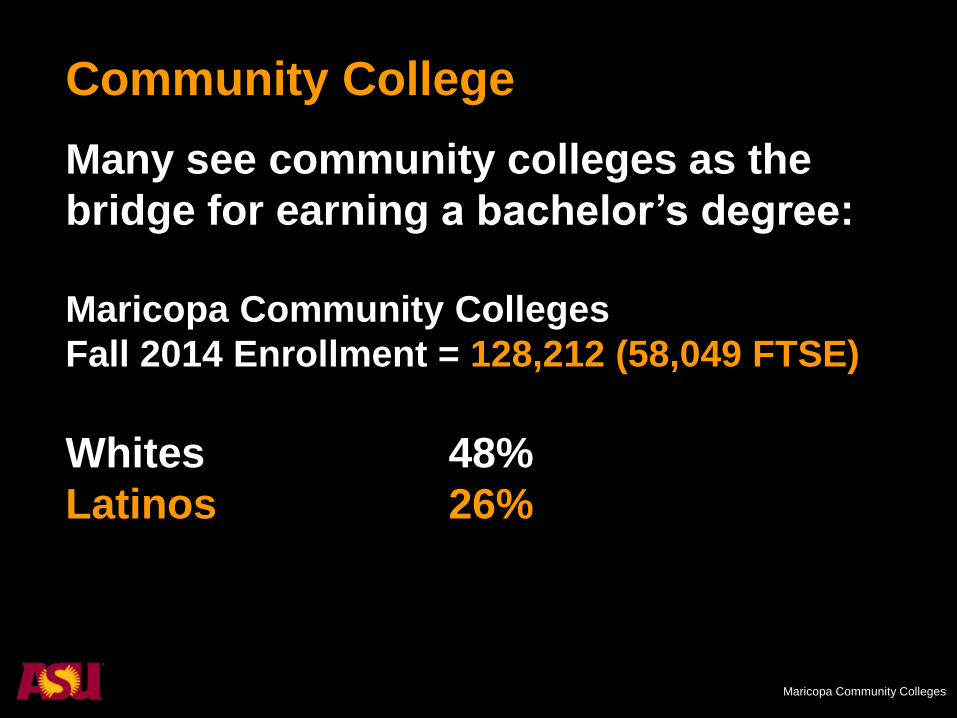
Community College
Many see community colleges as the
bridge for earning a bachelor’s degree:
Maricopa Community Colleges
Fall 2014 Enrollment = 128,212 (58,049 FTSE)
Whites 48%
Latinos 26%
Maricopa Community Colleges
Maricopa Community Colleges
Community College
In 2012-13, about 8,700 students with
12 or more MCC credits earned a
bachelor’s degree from an Arizona
public university.
Maricopa Community Colleges
ASU Pathway Programs
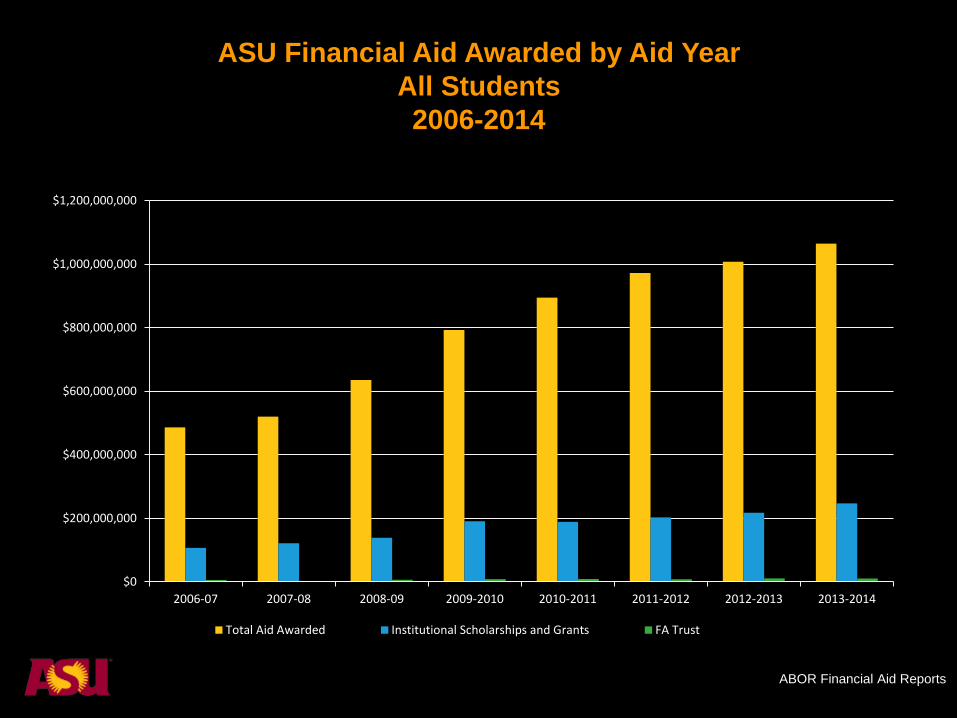
$0
$200,000,000
$400,000,000
$600,000,000
$800,000,000
$1,000,000,000
$1,200,000,000
2006-07 2007-08 2008-09 2009-2010 2010-2011 2011-2012 2012-2013 2013-2014
Total Aid Awarded Institutional Scholarships and Grants FA Trust
ASU Financial Aid Awarded by Aid Year
All Students
2006-2014
ABOR Financial Aid Reports
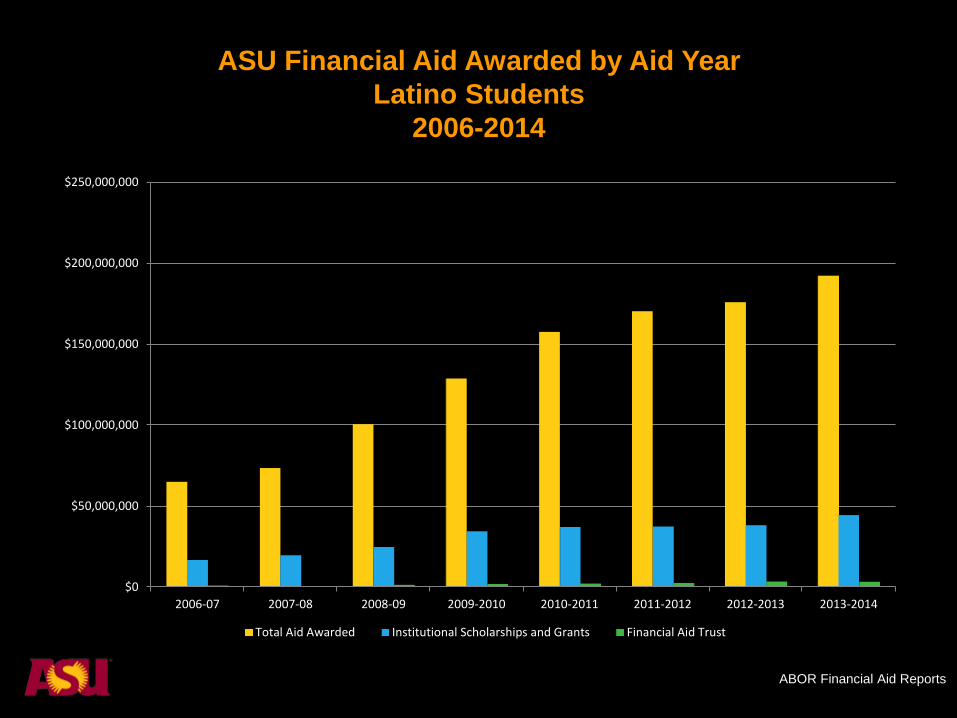
ASU Financial Aid Awarded by Aid Year
Latino Students
2006-2014
$0
$50,000,000
$100,000,000
$150,000,000
$200,000,000
$250,000,000
2006-07 2007-08 2008-09 2009-2010 2010-2011 2011-2012 2012-2013 2013-2014
Total Aid Awarded Institutional Scholarships and Grants Financial Aid Trust
ABOR Financial Aid Reports
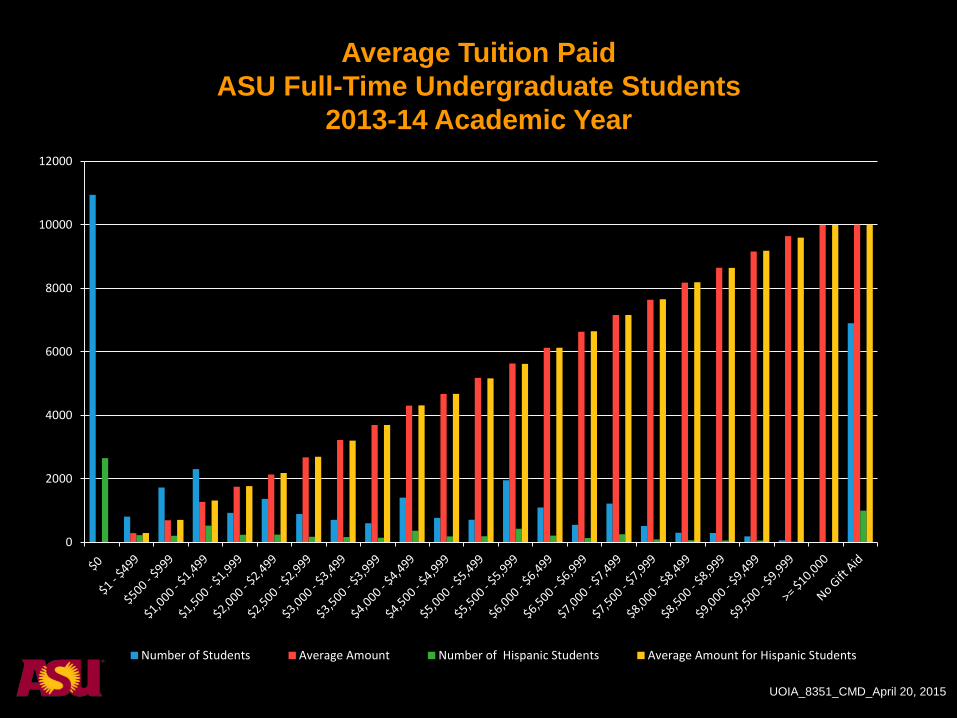
0
2000
4000
6000
8000
10000
12000
Number of Students Average Amount Number of Hispanic Students Average Amount for Hispanic Students
Average Tuition Paid
ASU Full-Time Undergraduate Students
2013-14 Academic Year
UOIA_8351_CMD_April 20, 2015
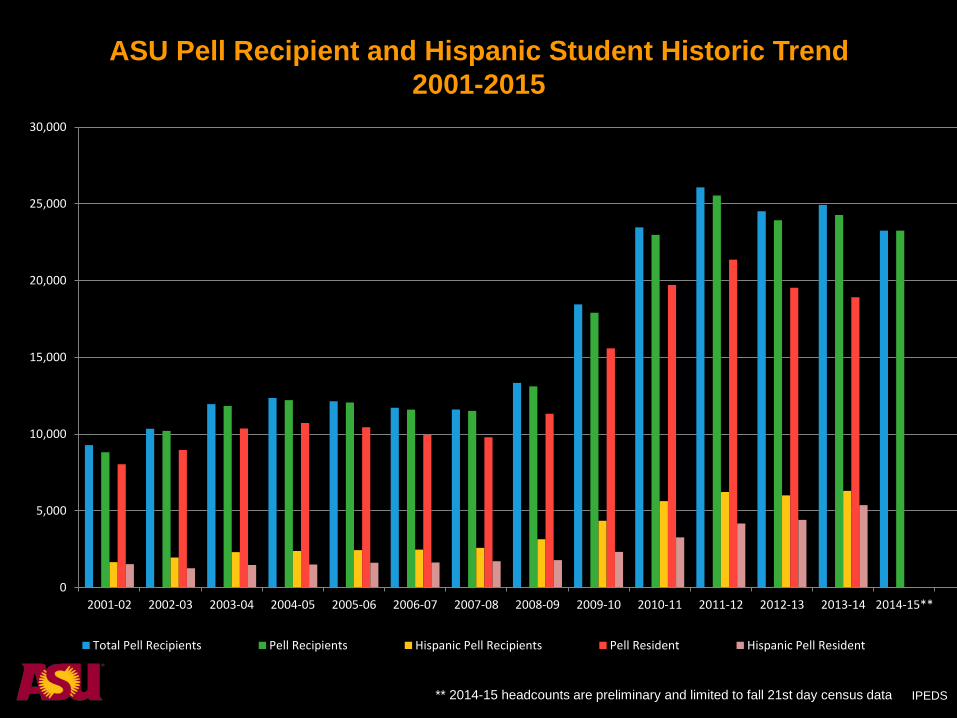
0
5,000
10,000
15,000
20,000
25,000
30,000
2001-02 2002-03 2003-04 2004-05 2005-06 2006-07 2007-08 2008-09 2009-10 2010-11 2011-12 2012-13 2013-14 2014-15**
Total Pell Recipients Pell Recipients Hispanic Pell Recipients Pell Resident Hispanic Pell Resident
ASU Pell Recipient and Hispanic Student Historic Trend
2001-2015
** 2014-15 headcounts are preliminary and limited to fall 21st day census data IPEDS
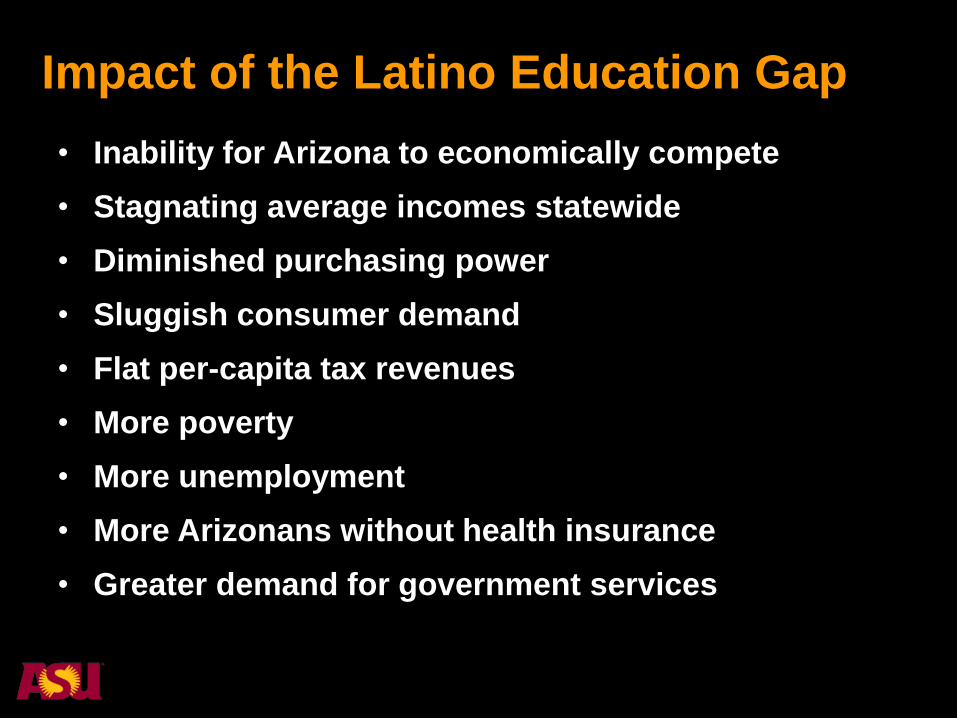
Impact of the Latino Education Gap
• Inability for Arizona to economically compete
• Stagnating average incomes statewide
• Diminished purchasing power
• Sluggish consumer demand
• Flat per-capita tax revenues
• More poverty
• More unemployment
• More Arizonans without health insurance
• Greater demand for government services
How do we work together to
achieve the outcomes Arizona
needs?