Bibliometrics in practice 2016 | Breakout session | Designing the academic self
14
‘Designing the academic self’ What metrics based on publication and citation data can and can’t tell us Tanya Williamson Academic Liaison Librarian: Research Lancaster University Library Bibliometrics in Practice, 27 th June 2016
Bibliometrics in practice 2016 | Breakout session | Designing the academic self
‘Designing the academic self’ What metrics based on publication and citation data can and can’t tell us
Tanya Williamson Academic Liaison Librarian: Research Lancaster University Library Bibliometrics in Practice, 27th June 2016
I will describe how library staff at Lancaster University
became involved in a seminar series entitled ‘Designing the
academic self’, and contributed insights into what metrics
based on publication and citation data can and can’t tell us.
Participants will take part in the discussion-based activities
that were used to illustrate the uses and limitations of
quantitative indicators in the original seminar.
Presenter
Presentation Notes
My aim is to share the experience and the approach I took.
• Context: Designing the Academic Self seminar series • What questions can metrics help us to answer?
– With a discussion activity in pairs/small groups • What questions can’t metrics help us to answer?
– With a discussion activity in two groups • Summary and discussion
Designing the Academic Self
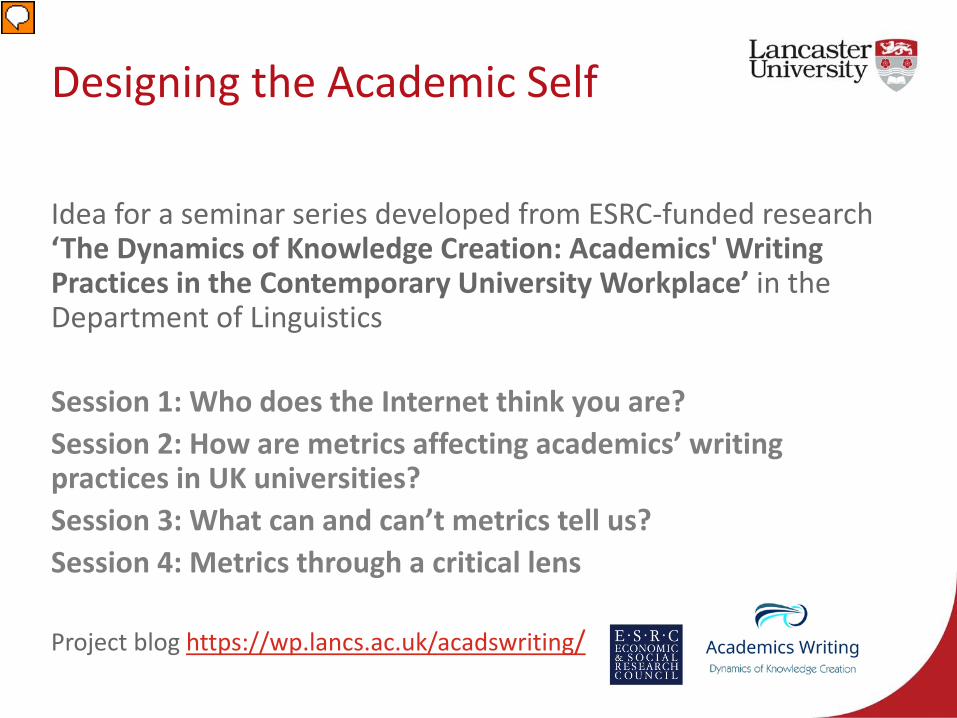
Idea for a seminar series developed from ESRC-funded research ‘The Dynamics of Knowledge Creation: Academics' Writing Practices in the Contemporary University Workplace’ in the Department of Linguistics Session 1: Who does the Internet think you are? Session 2: How are metrics affecting academics’ writing practices in UK universities? Session 3: What can and can’t metrics tell us? Session 4: Metrics through a critical lens Project blog https://wp.lancs.ac.uk/acadswriting/
Presenter
Presentation Notes
The library was approached to offer insights on things like online profiles and metrics, and be less of a how to and more of a discussion and critique. There were 4 seminars in the series, and they were aimed to be thought provoking and Session 1: Who does the Internet think you are? – I talked about how the internet generates a researcher’s profile, and what they can control… Session 2: How are metrics affecting academics’ writing practices in UK universities? – report back on the findings of the research group ***Session 3: What can and can’t metrics tell us? The focus of today’s session. A senior colleague from the Library also spoke about the Institution’s approach to the use of metrics in research assessment Session 4: Metrics through a critical lens – James Wilsdon and Paul Ashwin – big picture on metrics in REF and TEF
I began by explaining to participants the absolute basics, making the point about the assumptions that citation analysis is based on, mainly in the context of research assessment and as an indicator of performance, but we also spoke about it’s use different people and different reasons, e.g. the research student wishing to understand the literature landscape, or the journal editor wishing to gauge a publications’ impact, or decide who to approach for peer review. Collected in citation indexes, and now benefiting from networks of bibliographic information It’s easy to see why citation data would be useful for evaluating research
What questions can metrics help us to answer?
What do you think?
• How many…? • How often…? • What’s the average…? • How many … compared to …? • What are the trends?
According to the data source
Presenter
Presentation Notes
After a brief explanation of how citations are counted, I then posed this question to participants, and invited responses. I explained that for these things to be calculated the body of work in question needed to be recorded accurately, be comprehensive, be categorised for comparison and included and indexed in the data source GET SOME PARTICIPATION, BUT BE BRIEF Examples Works have been published OR ‘Outputs’ have been produced by a researcher Articles are published in a journal over time Times has this work been cited? Times has this researcher’s body of work been cited? Average cites per item, cites per year, items published per year, impact factor, How many articles have been produced compared to another How many citations have been received compared to another journal in the same time period Trends – over time, in a subject category or on a topic, by country, co-authorship, types of documents, by institution, throughout a career…
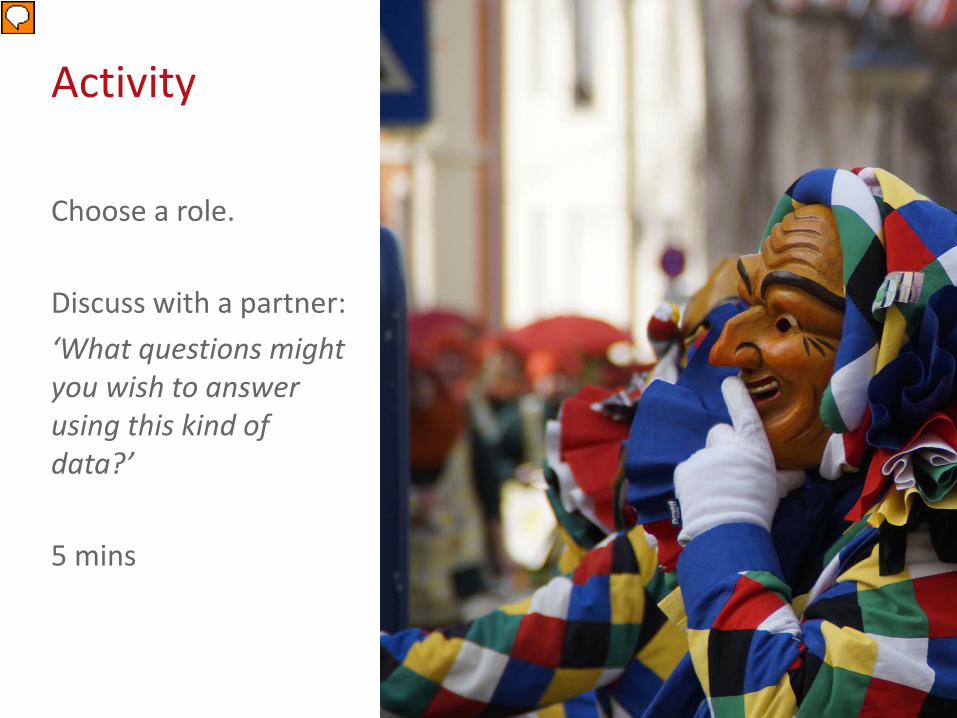
Activity
Choose a role. Discuss with a partner: ‘What questions might you wish to answer using this kind of data?’ 5 mins
Presenter
Presentation Notes
A research student An author A Research Director A University manager A research funder A journal editor RUN ACTIVITY Reflect on the kinds of things people come up with, and interrogate whether they can be truly answered by bibliometrics In the original session, journal editors wanted to know if their journal was being read, university managers wanted to benchmark their departments and research groups against others. They wanted to measure and compare performance. We reflected on the weight applied to citations as evidence.
What can’t metrics help us to answer?
What do you think? • Why was this work cited? • What did they think? • What was the influence, i.e. how did it change thought or
practice? • Why are the metrics low/high? • What will the long term, or delayed impact be? • What is the societal impact?
If it’s not included in the data source, it is not counted
Presenter
Presentation Notes
I then posed the opposing question. BE BRIEF Activity: Table 1: Why might a particular research output, e.g. journal article or book chapter, be highly cited? Table 2: Why might a particular research output receive few or no citations?
Activity
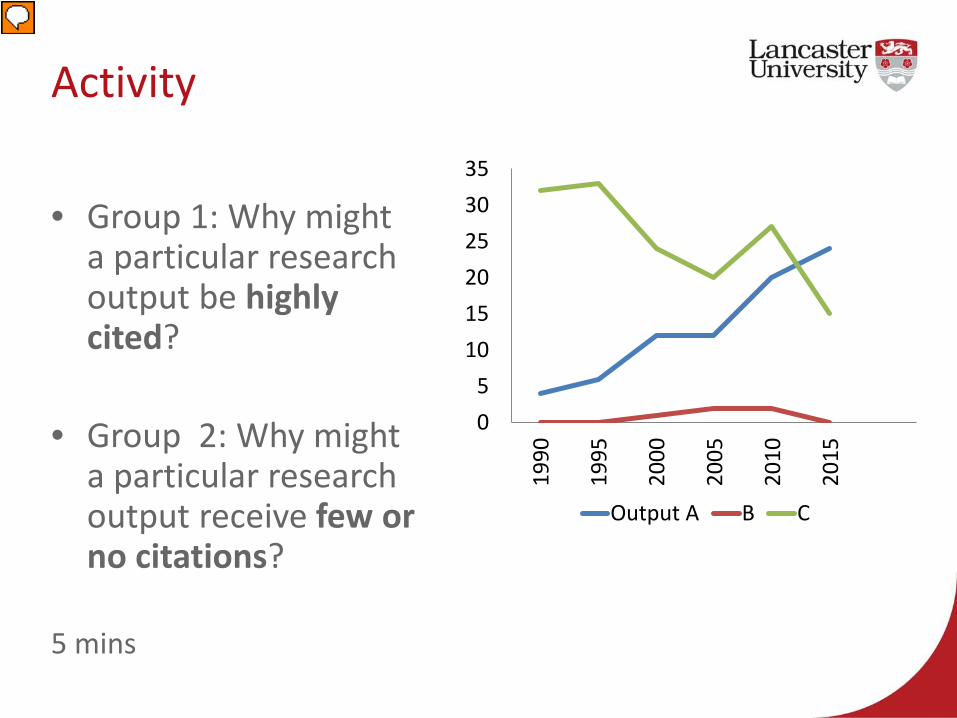
• Group 1: Why might a particular research output be highly cited?
• Group 2: Why might a particular research output receive few or no citations?
5 mins
05
101520253035
1990
1995
2000
2005
2010
2015
Output A B C
Presenter
Presentation Notes
Highly cited: Outstanding discovery Novelty Controversial Well reported Well publicised Prestigious author(s) What does highly cited mean? 10 citations? 2000? Type of output – e.g. clinical trial, review article Easy to discover (technically and linguistically) Culture of the discipline is to cite Few or no citations: Not included in the data source Language other than English Niche, or relevant to a small community Under publicised Poorly reported Lost in the deluge Difficult to discover Culture of the discipline is not to cite Type of output – e.g. novel, exhibition, mathematical monograph, ‘Unfashionable’ Emerging – ahead of it’s time REFLECT on responses, add any missing. Mention that a discussion started about the Matthew effect (the rich get richer, the poor get poorer) And ‘Washback’, a term in language testing, Washback is said to be the result of “high-stakes tests.” Madaus (1988, p. 87) defines these as tests “whose results are seen—rightly or wrongly—by students, teachers, administrators, parents, or the general public, as being used to make important decisions that immediately and directly affect them.” Also spoke about the proportion of ‘research outputs’ that receive no citations at all – estimated hastily as 40% of LU outputs, and likely many more…
The assumption that citations = positive academic impact is usually, but not always true
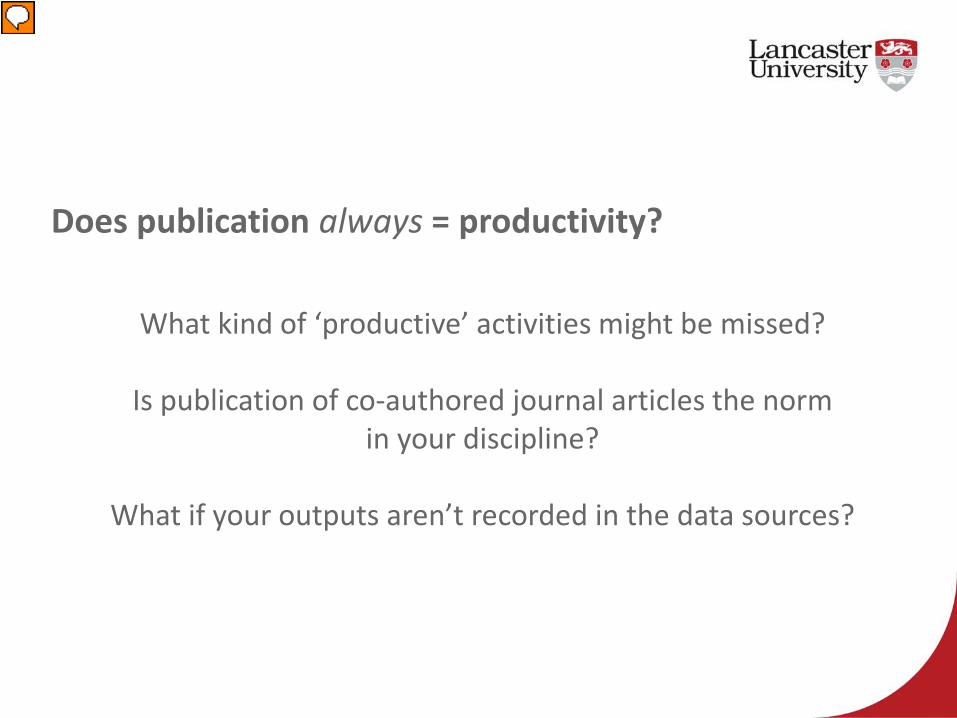
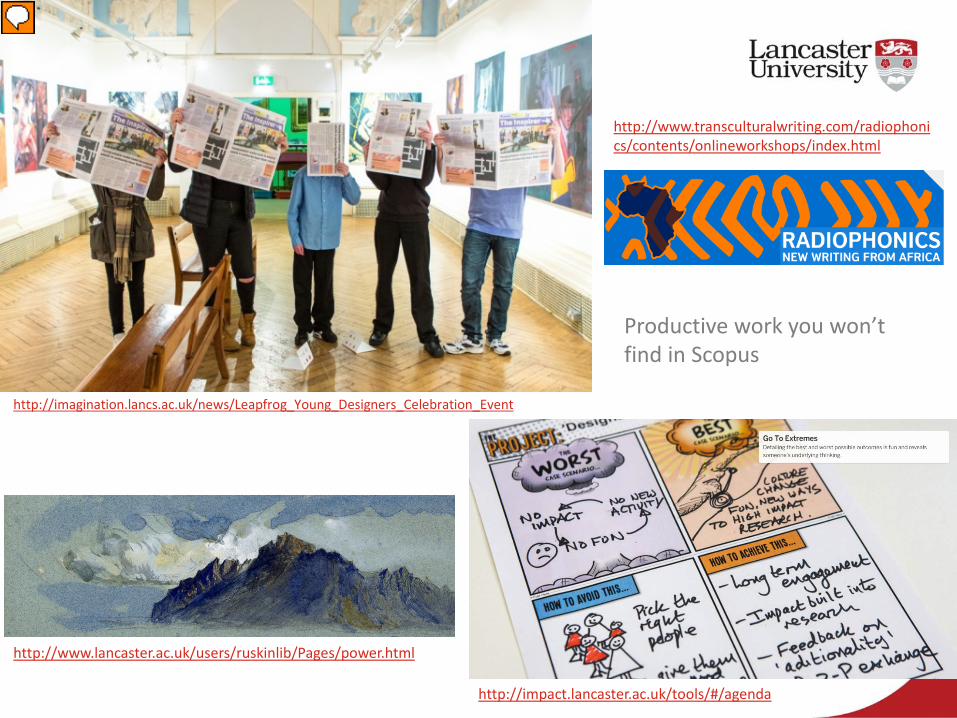
What kind of ‘productive’ activities might be missed?
Is publication of co-authored journal articles the norm in your discipline?
What if your outputs aren’t recorded in the data sources?
Presenter
Presentation Notes
This is where we talked about the different kinds of outputs that fell outside of the citations model, and whether they were considered valid ‘products’ in the age of the metric. Exhibitions Workshops, collaborations Outreach and media Learning materials Creative works Book reviews Encyclopaedia entries Websites Software Datasets