Embed Size (px)
Citation preview

BUILDING SCIENCE 2 [ BLD 61303 / ARC 3413 ]
PROJECT 2: INTEGRATION PROJECT
SENTUL COMMUNITY LIBRARY
REPORT & CALCULATION
CHUNG WEI JIN
0313789
TUTOR: MR. EDWIN CHAN

Table of Content
1.0 Lighting
1.1 Quiet Reading Area
1.1.1 Daylight
1.1.2 Artificial Light
1.1.3 PSALI
1.2 Young Adult Area
1.2.1 Daylight
1.2.2 Artificial Light
1.2.3 PSALI
2.0 Acoustic
2.1 External Noise Sound Pressure Level
2.1.1 Young Adult Area
2.1.2 Quiet Reading Area
2.2 Reverberation Time
2.2.1 Administration Office
2.2.2 Discussion Room
2.3 Sound Reduction Index
2.3.1 Children Area
2.3.2 Individual Study Booth
3.0 References

1.0 Lighting 1.1 Space 1: Quiet Reading Area
1.1.1 Daylight
According to MS 1525, Day lighting Factor distribution is as below:
Daylight Factor, DF
Zone Daylight Factor (%) Distribution
Very Bright >6 Very large with thermal and glare problems
Bright 3-6 Good
Average 1-3 Fair
Dark 0-1 Poor
The area selected, which is the quiet reading area faces southward and is located at the second floor of the
building. This space has a façade of sliding glass windows, which allows daylight into the space and also
visual connectivity with the pedestrians passing by. The façade is further enhanced by external wooden
shutters which can be operated manually by the users when sun shading is needed.
Daylight
Figure 1.0 Second Floor Plan
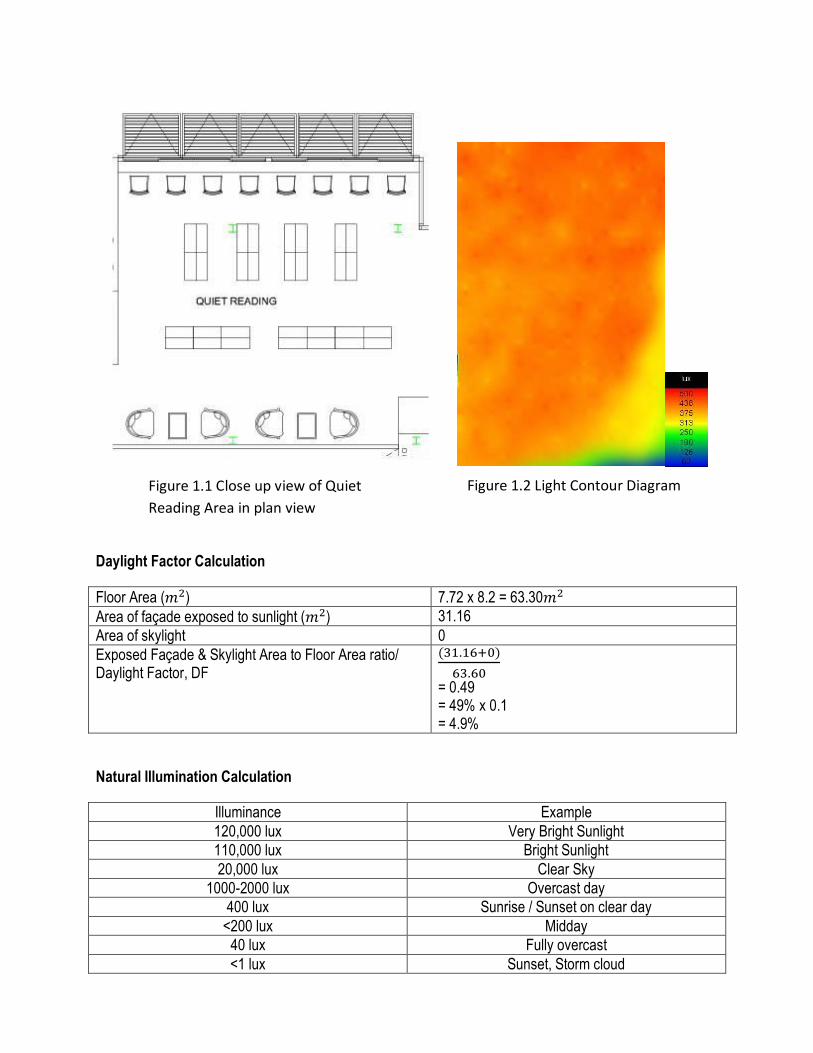
Daylight Factor Calculation
Floor Area ( ) 7.72 x 8.2 = 63.30
Area of façade exposed to sunlight ( ) 31.16
Area of skylight 0
Exposed Façade & Skylight Area to Floor Area ratio/ Daylight Factor, DF
= 0.49 = 49% x 0.1 = 4.9%
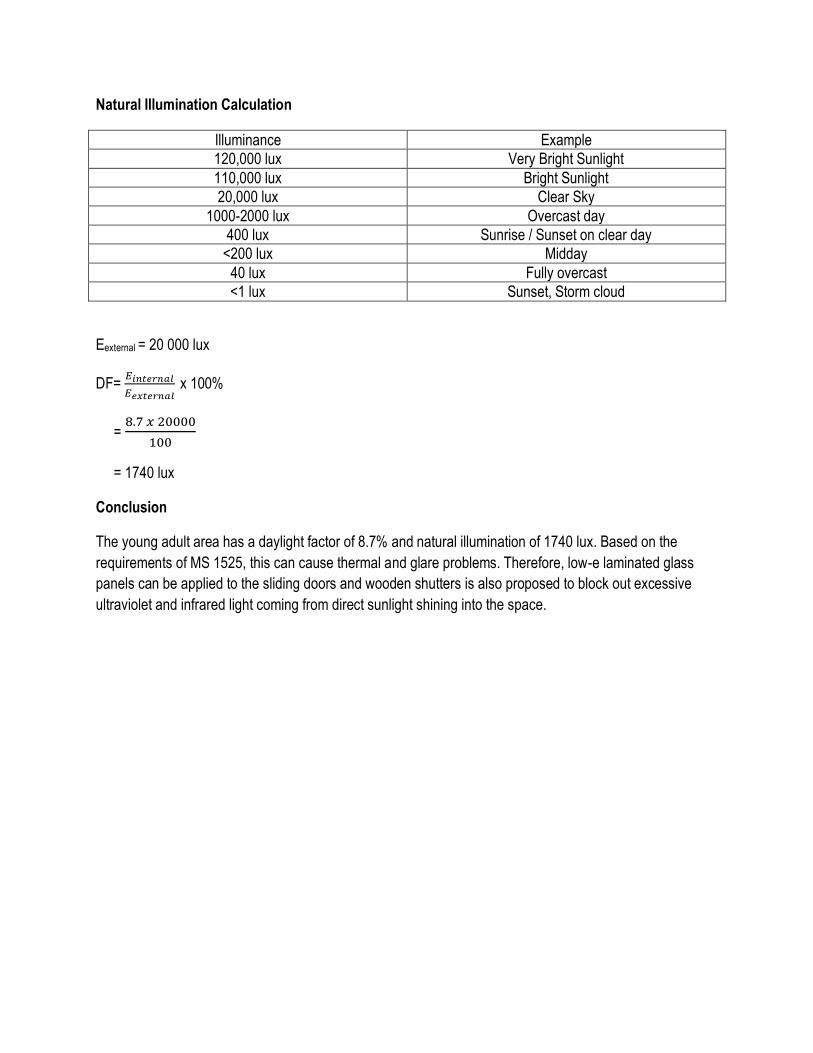
Natural Illumination Calculation
Illuminance Example
120,000 lux Very Bright Sunlight
110,000 lux Bright Sunlight
20,000 lux Clear Sky
1000-2000 lux Overcast day
400 lux Sunrise / Sunset on clear day
<200 lux Midday
40 lux Fully overcast
<1 lux Sunset, Storm cloud
Figure 1.1 Close up view of Quiet
Reading Area in plan view
Figure 1.2 Light Contour Diagram
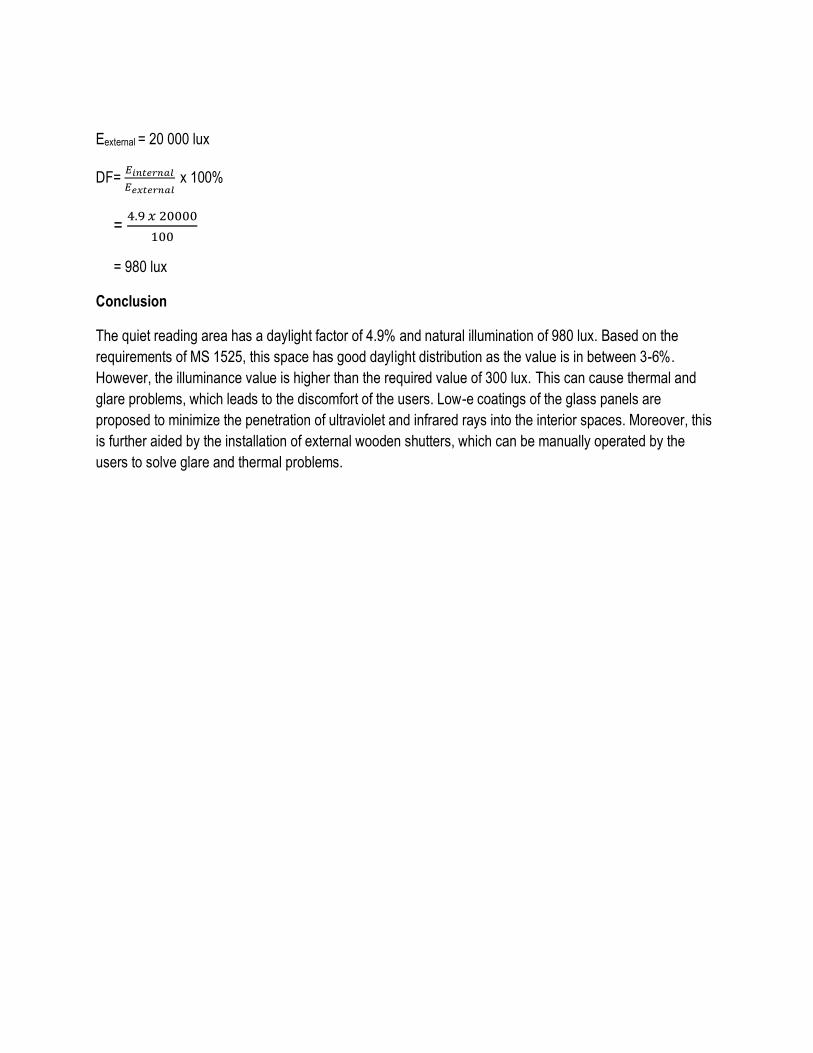
Eexternal = 20 000 lux
DF=
x 100%
=
= 980 lux
Conclusion
The quiet reading area has a daylight factor of 4.9% and natural illumination of 980 lux. Based on the
requirements of MS 1525, this space has good daylight distribution as the value is in between 3-6%.
However, the illuminance value is higher than the required value of 300 lux. This can cause thermal and
glare problems, which leads to the discomfort of the users. Low-e coatings of the glass panels are
proposed to minimize the penetration of ultraviolet and infrared rays into the interior spaces. Moreover, this
is further aided by the installation of external wooden shutters, which can be manually operated by the
users to solve glare and thermal problems.
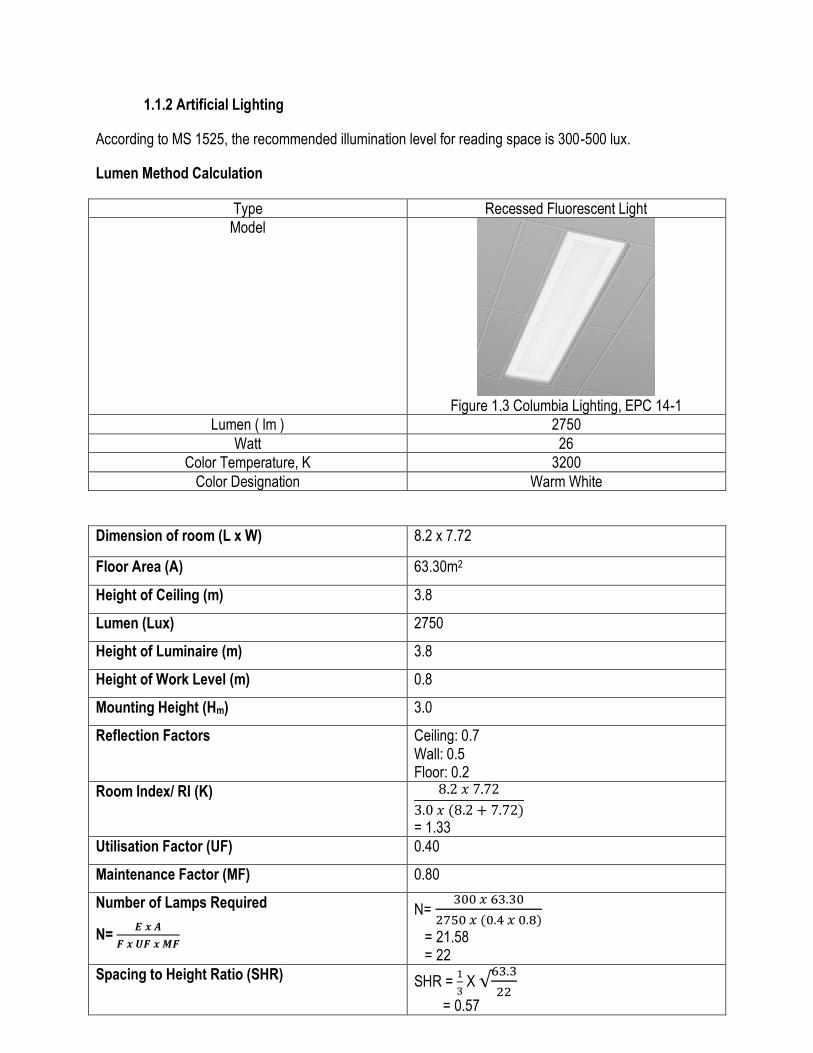
1.1.2 Artificial Lighting
According to MS 1525, the recommended illumination level for reading space is 300-500 lux.
Lumen Method Calculation
Type Recessed Fluorescent Light
Model
Figure 1.3 Columbia Lighting, EPC 14-1
Lumen ( lm ) 2750
Watt 26
Color Temperature, K 3200
Color Designation Warm White
Dimension of room (L x W) 8.2 x 7.72
Floor Area (A) 63.30m2
Height of Ceiling (m) 3.8
Lumen (Lux) 2750
Height of Luminaire (m) 3.8
Height of Work Level (m) 0.8
Mounting Height (Hm) 3.0
Reflection Factors Ceiling: 0.7 Wall: 0.5 Floor: 0.2
Room Index/ RI (K)
= 1.33
Utilisation Factor (UF) 0.40
Maintenance Factor (MF) 0.80
Number of Lamps Required
N=
N=
= 21.58 = 22
Spacing to Height Ratio (SHR) SHR =
X
= 0.57

SHR=
= 0.57
S = 1.71
Fittings Layout Fittings required along 8.2m wall=
= 4.80 = 5 rows
Number of lamps in each row =
= 4.4 = 5 lamps
Spacing along 7.72m wall =
= 1.54m

Fitting Layout
Conclusion
25 fluorescent lamps are used to illuminate the quiet reading area to achieve the minimum illuminance of
300 lux stated by MS 1525.With sufficient illuminance, users are able to perform tasks more efficiently and
accurately.
Figure 1.4 Light fitting layout in quiet reading area.

1.1.3 Permanent Supplementary Artificial Lighting of Interior (PSALI)
Referring to the daylight values obtained above, the quiet reading area has a good daylight factor of 4.9%.
The light contour diagram also shows that the space receives sufficient day lighting during the day from the
façade. The artificial lightings calculation also shows a result of the usage of 25 fluorescent lamps to
illuminate the quiet reading area. Hence, PSALI is applied whereby the lightings are controlled with 3
switches. One for the first two rows near the opening whereby it can be switched off when there is sufficient
day light, one for the successive two rows in the middle and finally, the last one for the last row in the area.
PSALI Fitting Layout
Figure 1.4 PSALI light fitting layout in the quiet reading area.

1.2 Space 2: Young Adult Area
1.2.1 Daylight
According to MS 1525, Day lighting Factor distribution is as below:
Daylight Factor, DF
Zone Daylight Factor (%) Distribution
Very Bright >6 Very large with thermal and glare problems
Bright 3-6 Good
Average 1-3 Fair
Dark 0-1 Poor
The area selected, which is the young adult area faces north and is located at the first floor of the building.
This space has a façade of sliding glass doors and is only enclosed from the left by a solid wall from the
neighboring building. The rest of the space is largely open and exposed to sunlight coming from the glass
façade which expands to the adjacent space.
Daylight
Figure 1.5 First Floor Plan

Daylight Factor Calculation
Floor Area ( ) 9.68 x 6.42 = 62.15
Area of façade exposed to sunlight ( ) 53.88
Area of skylight 0
Exposed Façade & Skylight Area to Floor Area ratio/ Daylight Factor, DF
= 0.87 = 87% x 0.1 = 8.7%
Figure 1.6 Close up view of Young Adult Area in plan view
Figure 1.7 Light Contour Diagram of Young Adult Area.
Natural Illumination Calculation
Illuminance Example
120,000 lux Very Bright Sunlight
110,000 lux Bright Sunlight
20,000 lux Clear Sky
1000-2000 lux Overcast day
400 lux Sunrise / Sunset on clear day
<200 lux Midday
40 lux Fully overcast
<1 lux Sunset, Storm cloud
Eexternal = 20 000 lux
DF=
x 100%
=
= 1740 lux
Conclusion
The young adult area has a daylight factor of 8.7% and natural illumination of 1740 lux. Based on the
requirements of MS 1525, this can cause thermal and glare problems. Therefore, low-e laminated glass
panels can be applied to the sliding doors and wooden shutters is also proposed to block out excessive
ultraviolet and infrared light coming from direct sunlight shining into the space.

1.2.2 Artificial Light
According to MS 1525, the recommended illumination level for reading space is 300-500 lux.
Lumen Method Calculation
Type LED Downlight
Model
Figure 1.8 Philips DN135C
Lumen ( lm ) 2000
Power (W) 13
Color Temperature, K 3000
Color Designation Warm White
Dimension of room (L x W) 9.68 X 6.42
Floor Area (A) 62.15m2
Height of Ceiling (m) 3.8
Lumen (Lux) 2000
Height of Luminaire (m) 3.8
Height of Work Level (m) 0.8
Mounting Height (Hm) 3.0
Reflection Factors Ceiling: 0.7 Wall: 0.5 Floor: 0.2
Room Index/ RI (K)
= 1.29
Utilisation Factor (UF) 0.48
Maintenance Factor (MF) 0.80
Number of Lamps Required
N=
N=
= 24.28 = 23 lamps
Spacing to Height Ratio (SHR) SHR =
X
= 0.55
SHR=
= 0.55

S = 1.65
Fittings Layout Fittings required along 9.68m wall=
= 5.87 = 6 rows
Number of lamps in each row =
= 3.83 = 4 lamps
Spacing along 7.72m wall =
= 1.93m

Fitting Layout
Conclusion
24 LED downlights are used to illuminate the young adult area to achieve the minimum illuminance of 300
lux stated by MS 1525.With sufficient illuminance, users are able to read in a comfortable environment.
Figure 1.9 Light fittings layout in Young Adult Area.

1.2.3 Permanent Supplementary Artificial Lighting of Interior (PSALI)
Referring to the daylight values obtained above, the young adult area has a large distribution of daylight
whereby its daylight factor of 8.9% exceeds the optimum standard of 6%. The light contour diagram also
shows that the space receives excessive day lighting during the day from the façade, resulting in thermal
and glare problems. The artificial lightings calculation also shows a result of the usage of 24 LED down
lights to illuminate the young adult area. Hence, PSALI is applied whereby the lightings are controlled with
2 switches. One for the first two rows near the opening in the north whereby it can be switched off when
there is sufficient day light and another one for the successive two rows at the back.
PSALI Fitting Layout
Figure 1.10 PSALI light fitting layout in the Young Adult Area.

2.0 Acoustic
2.1 External Noise Sound Pressure Level
2.1.1 Young Adult Area
i) Peak Hour ( Jalan Ipoh )
Highest reading= 80dB
Using the formula,
L= 10 log10 (
)
80= 10 log10 (
)
log-1 8=
I= 1x 10⁻⁴
Figure 2.1 First Floor Plan

Lowest Reading= 60dB
Using the formula,
L= 10 log10 (
)
60= 10 log10 (
)
log-1 6=
I= 1x 10⁻⁶
Total Intensity, I= (1x 10⁻⁴) + (1x 10⁻⁶)
= 1.01 x 10⁻⁴
Using the formula, Combined SPL= 10 log10 (
), where po = 1 x 10-12
Combined SPL= 10 log 10 (
)
= 80.04dB
ii) Non-Peak Hour
Highest Reading= 55dB
Using the formula,
L= 10 log10 (
)
55= 10 log10 (
)
log-1 5.5=
I= 3.162x 10⁻⁷
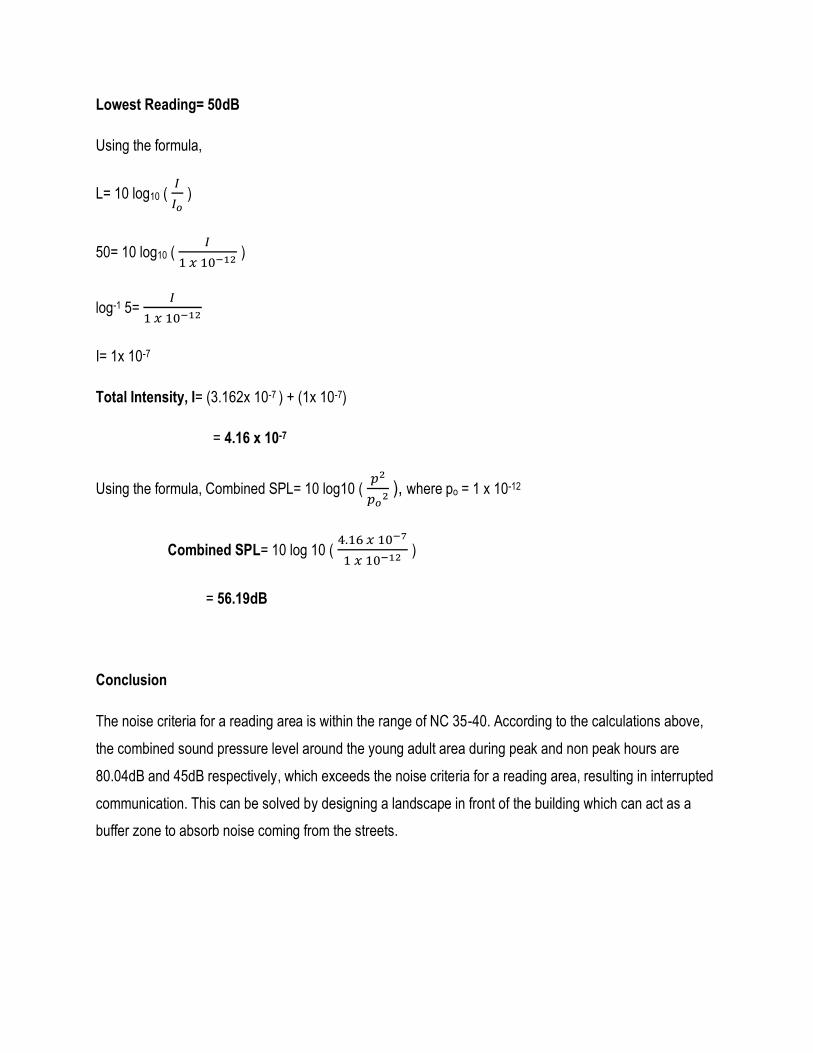
Lowest Reading= 50dB
Using the formula,
L= 10 log10 (
)
50= 10 log10 (
)
log-1 5=
I= 1x 10⁻⁷
Total Intensity, I= (3.162x 10⁻⁷ ) + (1x 10⁻⁷)
= 4.16 x 10⁻⁷
Using the formula, Combined SPL= 10 log10 (
), where po = 1 x 10-12
Combined SPL= 10 log 10 (
)
= 56.19dB
Conclusion
The noise criteria for a reading area is within the range of NC 35-40. According to the calculations above,
the combined sound pressure level around the young adult area during peak and non peak hours are
80.04dB and 45dB respectively, which exceeds the noise criteria for a reading area, resulting in interrupted
communication. This can be solved by designing a landscape in front of the building which can act as a
buffer zone to absorb noise coming from the streets.

2.1.2 Quiet Reading Area
iii) Peak Hour ( Backlane )
Highest reading= 75dB
Using the formula,
L= 10 log10 (
)
75= 10 log10 (
)
log-1 7.5=
I= 3.16x 10⁻⁵
Figure 2.2 First Floor Plan

Lowest Reading= 58dB
Using the formula,
L= 10 log10 (
)
58= 10 log10 (
)
log-1 5.8=
I= 6.31x 10⁻⁷
Total Intensity, I= (3.16x 10⁻⁵ ) + (6.31x 10⁻⁷ )
= 3.22 x 10⁻⁵
Using the formula, Combined SPL= 10 log10 (
), where po = 1 x 10-12
Combined SPL= 10 log 10 (
)
= 75.08dB
iv) Non-Peak Hour
Highest Reading= 53dB
Using the formula,
L= 10 log10 (
)
53= 10 log10 (
)
log-1 5.3=
I= 1.20 x 10⁻⁷

Lowest Reading= 50dB
Using the formula,
L= 10 log10 (
)
50= 10 log10 (
)
log-1 5=
I= 1x 10⁻⁷
Total Intensity, I= (1.2 x 10⁻⁷ ) + (1x 10⁻⁷)
= 2.2 x 10⁻⁷
Using the formula, Combined SPL= 10 log10 (
), where po = 1 x 10-12
Combined SPL= 10 log 10 (
)
= 53.42dB
Conclusion
The noise criteria for a reading area is within the range of NC 35-40. According to the calculations above,
the combined sound pressure level around the quiet reading area during peak and non peak hours are
75.08dB and 53.42dB respectively, which exceeds the noise criteria for a reading area, resulting in a
chaotic environment unfit for quiet reading. This can be solved by proposing a double façade of wooden
shutters and sliding doors, which can filter and deflect noise coming from the street.
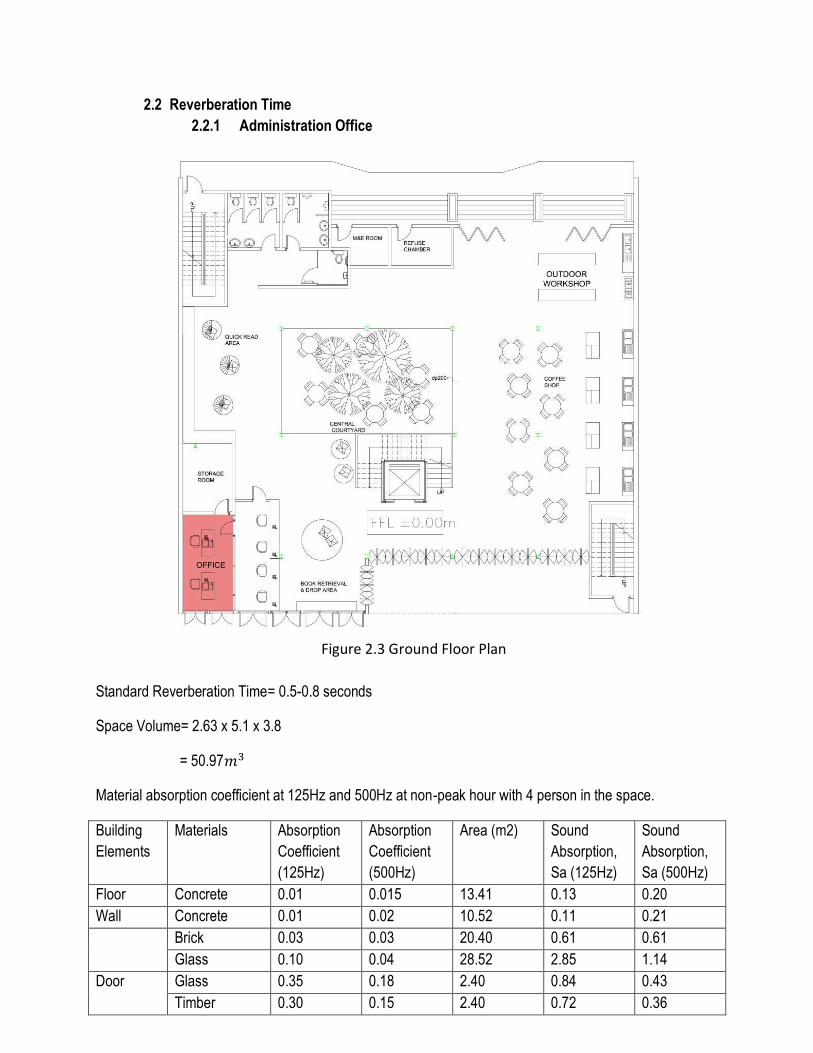
2.2 Reverberation Time
2.2.1 Administration Office
Standard Reverberation Time= 0.5-0.8 seconds
Space Volume= 2.63 x 5.1 x 3.8
= 50.97
Material absorption coefficient at 125Hz and 500Hz at non-peak hour with 4 person in the space.
Building
Elements
Materials Absorption
Coefficient
(125Hz)
Absorption
Coefficient
(500Hz)
Area (m2) Sound
Absorption,
Sa (125Hz)
Sound
Absorption,
Sa (500Hz)
Floor Concrete 0.01 0.015 13.41 0.13 0.20
Wall Concrete 0.01 0.02 10.52 0.11 0.21
Brick 0.03 0.03 20.40 0.61 0.61
Glass 0.10 0.04 28.52 2.85 1.14
Door Glass 0.35 0.18 2.40 0.84 0.43
Timber 0.30 0.15 2.40 0.72 0.36
Figure 2.3 Ground Floor Plan

Ceiling Plaster 0.02 0.02 13.41 0.27 0.27
Furniture Desk 0.50 0.45 2.00 1.00 0.90
Padded Chair 0.44 0.77 0.60 0.26 0.46
People - 0.3/P 0.4/P 4.00 1.20 1.60
7.99 6.18
125Hz
Reverberation Time, RT=
=
=1.02s
500Hz
Reverberation Time=
=
= 1.32s
Conclusion
The reverberation time for the office at 125Hz and also 500Hz is 1.02s and 1.32s respectively. This value
falls out of the standard reverberation time of 0.5-0.8s which shows that the space is lacking absorptive
materials. Carpets can be added to floors to further reduce the reverberation value. Moreover, the office
can also be placed further back into the building, creating a buffer zone in between the office and the
streets
Total absorption, A

2.2.2 Discussion Room
Standard Reverberation Time= 0.6-1.0 seconds
Space Volume= 8.20 x 3.43 x 3.8
= 106.88
Material absorption coefficient at 125Hz and 150Hz at non-peak hour with 12 person in the space.
Building
Elements
Materials Absorption
Coefficient
(125Hz)
Absorption
Coefficient
(500Hz)
Area (m2) Sound
Absorption,
Sa (125Hz)
Sound
Absorption,
Sa (500Hz)
Floor Carpet 0.10 0.25 28.13 2.81 7.03
Wall Concrete 0.01 0.02 13.68 0.14 0.27
Glass 0.10 0.04 71.36 7.14 2.85
Door Glass 0.35 0.18 7.20 2.52 1.30
Ceiling Timber 0.40 0.15 28.13 11.25 4.22
Figure 2.4 Third Floor Plan

Furniture Padded Chair 0.44 0.77 3.00 1.32 2.31
People - 0.30/P 0.40/P 12.00 3.60 4.80
28.78 22.77
125Hz
Reverberation Time, RT=
=
=0.59s
500Hz
Reverberation Time=
=
= 0.75s
Conclusion
The reverberation time for the discussion rooms at 125Hz and also 500Hz is 0.59s and 0.75s respectively.
This value falls in the standard reverberation time range of 0.5-0.8s which shows that the space is optimum
for meetings and discussion.
Total absorption, A

2.3 Sound Reduction Index
2.3.1 Children Area
Building Element Material Surface Area ( ) SRI ( dB) Transmission Coefficient, T
Door Glass 21.39 27 1.995 x 10⁻³
Wall Concrete 8.53 46 2.512 x 10⁻⁵
Glass Door
Sound Reduction Index, SRI= 10 log10 (
)
27= 10 log10 (
)
log-1 2.7=
T= 1.995 x 10⁻³
Figure 2.5 Second Floor Plan

Concrete Wall
Sound Reduction Index, SRI= 10 log10 (
)
46= 10 log10 (
)
log-1 4.6=
T= 2.512 x 10⁻⁵
Average Transmission Coefficient of Materials
Tav=
= 1.433 x 10⁻³
SRI= 10 log10 (
)
= 10 log10 (
)
= 28.44dB
External Sound Pressure Level= 80.04dB
= 80.04 – 28.44
= 51.60dB
Conclusion
The sound reduction index of the façade is 28.44dB. Assuming sound pressure level from the street is
80dB, the sound that is transmitted into the children area is 51.60dB. According to the noise criteria
environment perception, this value is slightly higher than the recommended range of 45-50dB. This can be
improved by proposing a double façade, which can filter noise from the streets or by installing acoustic
panels on the ceiling to absorb noise from the children.

2.3.2 Individual Study Booths
Building Element
Material Surface Area ( ) SRI ( dB) Transmission Coefficient, T
Wall Glass 32.80 26 2.512 x 10⁻³
Window Timber 32.80 22 6.310 x 10⁻³
Glass Wall
Sound Reduction Index, SRI= 10 log10 (
)
26= 10 log10 (
)
log-1 2.6=
T= 2.512 x 10⁻³
Figure 2.6 Third Floor Plan

Timber Shutters
Sound Reduction Index, SRI= 10 log10 (
)
22= 10 log10 (
)
log-1 2.2=
T= 6.310 x 10⁻³
Average Transmission Coefficient of Materials
Tav=
= 4.411 x 10⁻³
SRI= 10 log10 (
)
= 10 log10 (
)
= 23.55dB
External Sound Pressure Level= 75.08dB
= 75.08 – 23.55
= 51.53dB
Conclusion
The sound reduction index of the façade is 23.55dB. Assuming sound pressure level from the street is
75.08dB, the sound that is transmitted into the individual study booths is 51.53dB. According to MS 1525,
the ideal sound pressure level for a quiet library is 40Db, in which this value exceeds. The high sound
pressure level will affect the users’ concentration which causes interruption in studying. Buffer zones can
be created by planting trees or a double façade can be proposed to further absorb the sound transmitted
into the space, reducing the sound pressure level by approximately 5dB.

3.0 References
1. Department of Standards Malaysia. (2007) Malaysian Standard: Code of Practice on Energy
Efficiency and use of Renewable Energy for Non-Residential Buildings (First Revision). Malaysia:
Department of Standards Malaysia
2. Recommended Light Levels. Retrieved from https://www.noao.edu/education/QLTkit/ACTIVITY_Documents/Safety/LightLevels_outdoor+indoor.pdf
3. Architect’s Data. (2012). Chicester: John Wiley and Sons.
4. Cowab, J, (2000) Architectural Acoustics, Design Guide, Mc Graw-Hill, N.Y
5. Long,M. (2006), Architectural Acoustics. Amsterdam: Elsevier/ Academic Press