Embed Size (px)
Citation preview
© 2013 Pearson
© 2013 Pearson
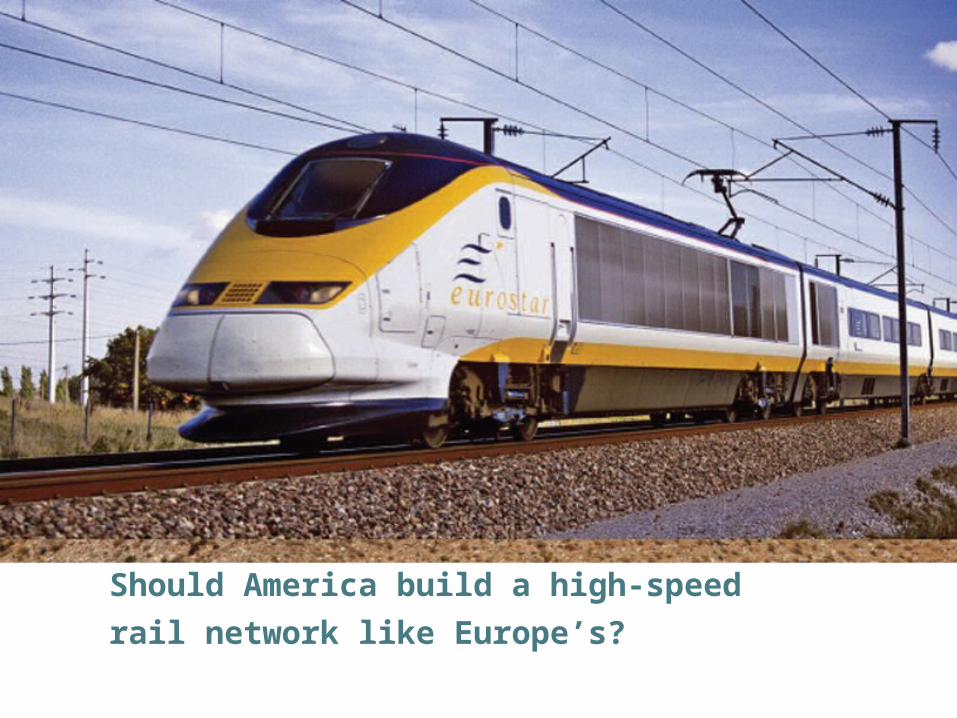
Should America build a high-speed
rail network like Europe’s?
© 2013 Pearson
11When you have completed your study of this chapter, you will be able to
1 Distinguish among private goods, public goods, and common resources.
2 Explain the free-rider problem and how public provision might help to overcome it and deliver an efficient
quantity of public goods.
3 Explain the tragedy of the commons and review its possible solutions.
CHAPTER CHECKLIST
Public Goods and Common Resources
© 2013 Pearson
11.1 CLASSIFYING GOODS AND RESOURCES
What is the essential difference between:• A city police department and Brink’s security• Fish in the Pacific Ocean and fish in a fish farm• A live concert and a concert on television
These, and all goods and services, can be classified according to whether they are excludable or nonexcludable and rival or nonrival.
© 2013 Pearson
Excludable
A good, service, or resource is excludable if it is possible to prevent a person from enjoying its benefits.
A good, service, or resource is nonexcludable if it is impossible to prevent a person from benefiting from it.
11.1 CLASSIFYING GOODS AND RESOURCES
© 2013 Pearson
Examples of excludable items are• The security services of Brink’s• Fish in a fish farm• A live concert
Examples of nonexcludable items are• The services of the city police department• Fish in the Pacific Ocean• A concert on network television
11.1 CLASSIFYING GOODS AND RESOURCES
© 2013 Pearson
11.1 CLASSIFYING GOODS AND RESOURCES
Rival
A good, service, or resource is rival if its use by one person decreases the quantity available to someone else.
A good, service, or resource is nonrival if its use by one person does not decrease the quantity available to someone else.
© 2013 Pearson
Examples of rival items are• The services of Brink’s security• Fish both in ocean and in a fish farm• A seat at a live concert
Examples of nonrival items are• The protection provided by a city police
department• A concert on network television
11.1 CLASSIFYING GOODS AND RESOURCES
© 2013 Pearson
11.1 CLASSIFYING GOODS AND RESOURCES
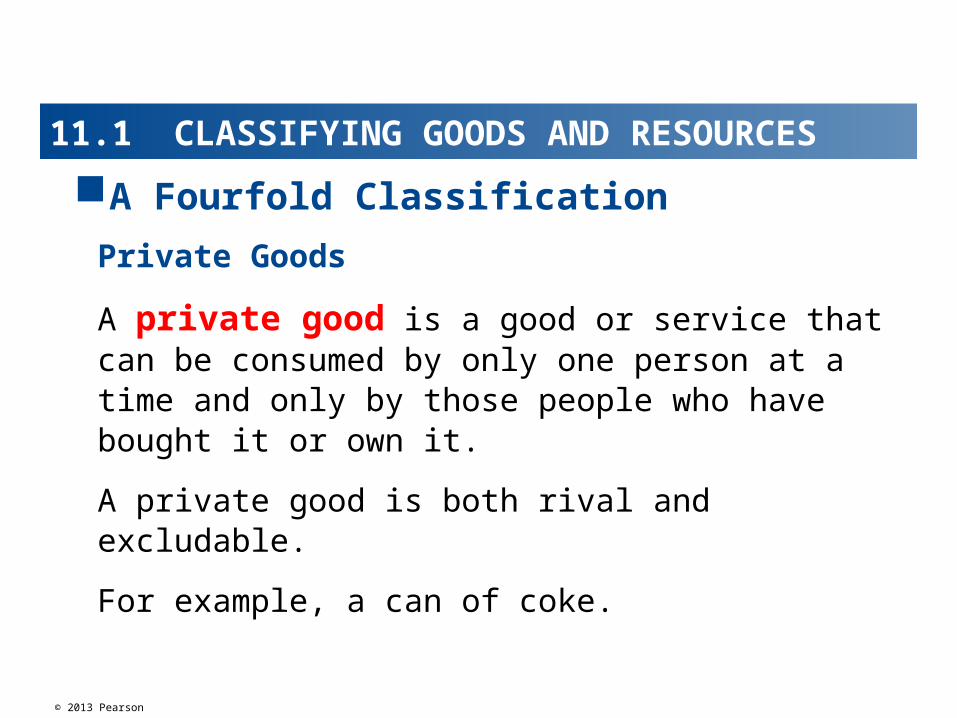
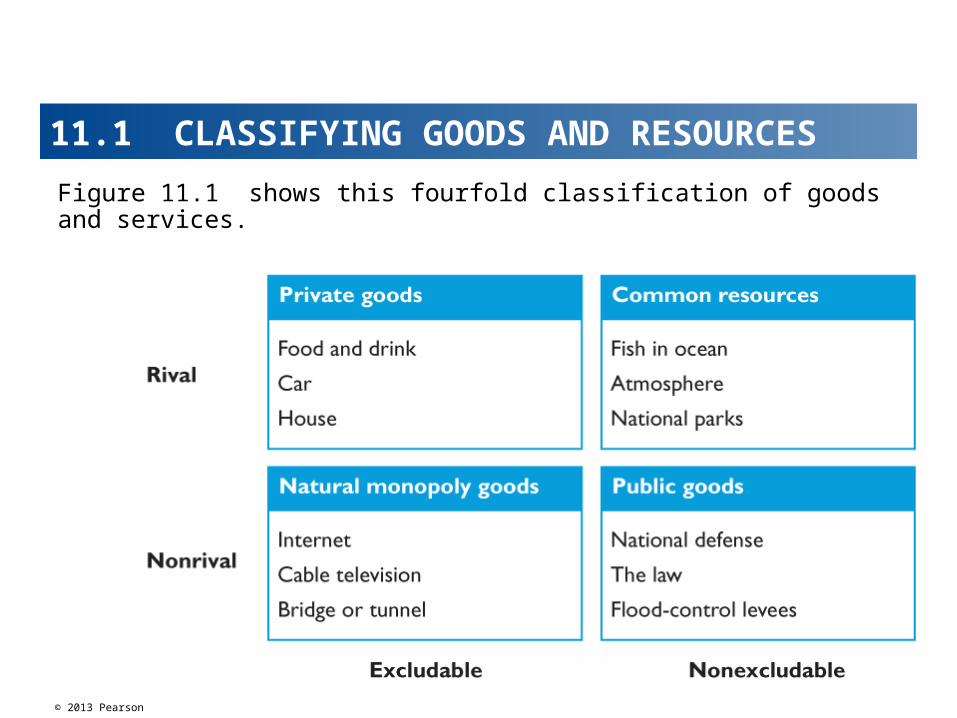
Private Goods
A private good is a good or service that can be consumed by only one person at a time and only by those people who have bought it or own it.
A private good is both rival and excludable.
For example, a can of coke.
A Fourfold Classification
© 2013 Pearson
11.1 CLASSIFYING GOODS AND RESOURCES
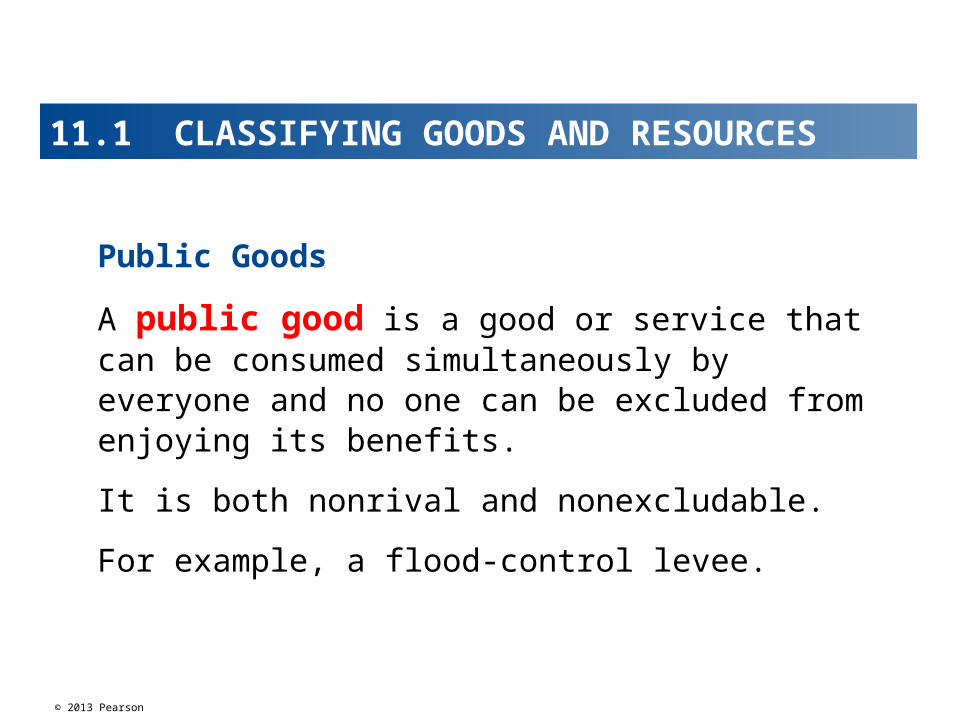
Public Goods
A public good is a good or service that can be consumed simultaneously by everyone and no one can be excluded from enjoying its benefits.
It is both nonrival and nonexcludable.
For example, a flood-control levee.
© 2013 Pearson
11.1 CLASSIFYING GOODS AND RESOURCES
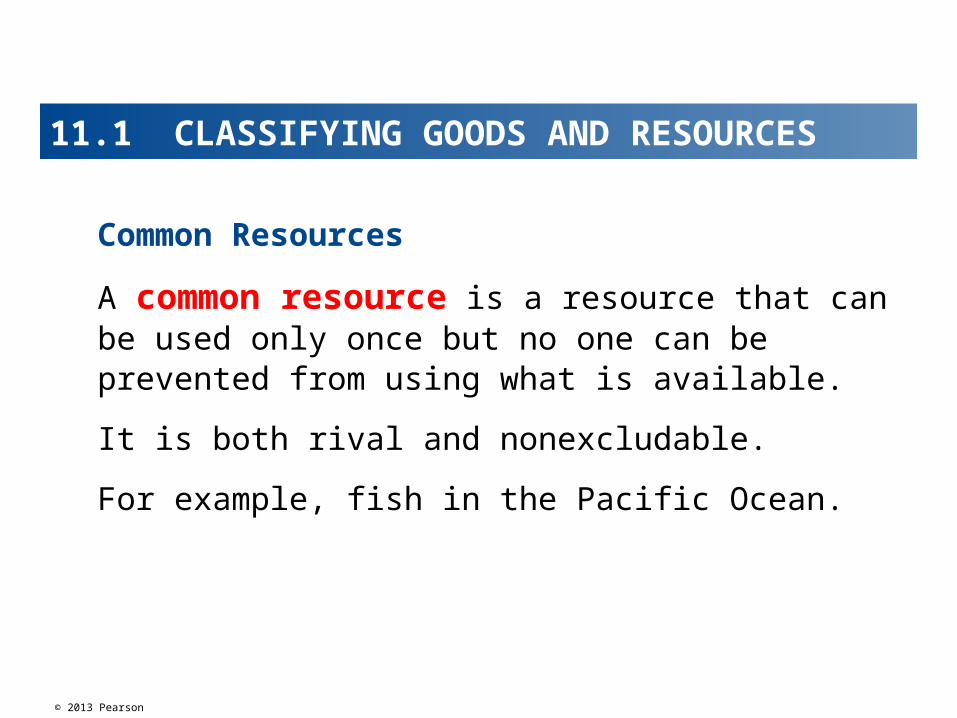
Common Resources
A common resource is a resource that can be used only once but no one can be prevented from using what is available.
It is both rival and nonexcludable.
For example, fish in the Pacific Ocean.
© 2013 Pearson
11.1 CLASSIFYING GOODS AND RESOURCES
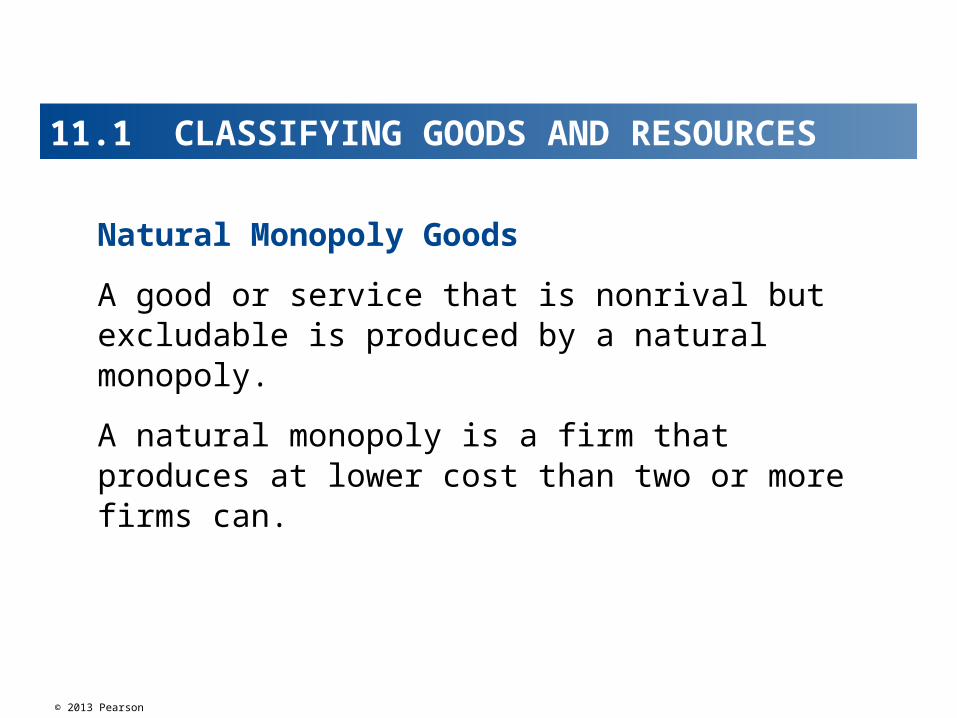
Natural Monopoly Goods
A good or service that is nonrival but excludable is produced by a natural monopoly.
A natural monopoly is a firm that produces at lower cost than two or more firms can.
© 2013 Pearson
Figure 11.1 shows this fourfold classification of goods and services.
11.1 CLASSIFYING GOODS AND RESOURCES
© 2013 Pearson
Public goods create a free-rider problem.
A free rider is a person who enjoys the benefits of a good or service without paying for it.
Because of the free-rider problem, the market would provide too small a quantity of a public good.
To produce the efficient quantity, government action is required.
The Free-Rider Problem
11.2 PUBLIC GOODS AND THE FREE-RIDER PROBLEM
© 2013 Pearson
The benefit a public good provides is the value of its services.
Because security lights in a common parking area are nonrival and nonexcludable, they are a public good.
• Everyone consumes the same quantity of them.
To find the economy-wide value of the security lights, we add together the marginal benefits of everyone who benefits from them.
The Marginal Benefit from a Public Good
11.2 PUBLIC GOODS AND THE FREE-RIDER PROBLEM
© 2013 Pearson
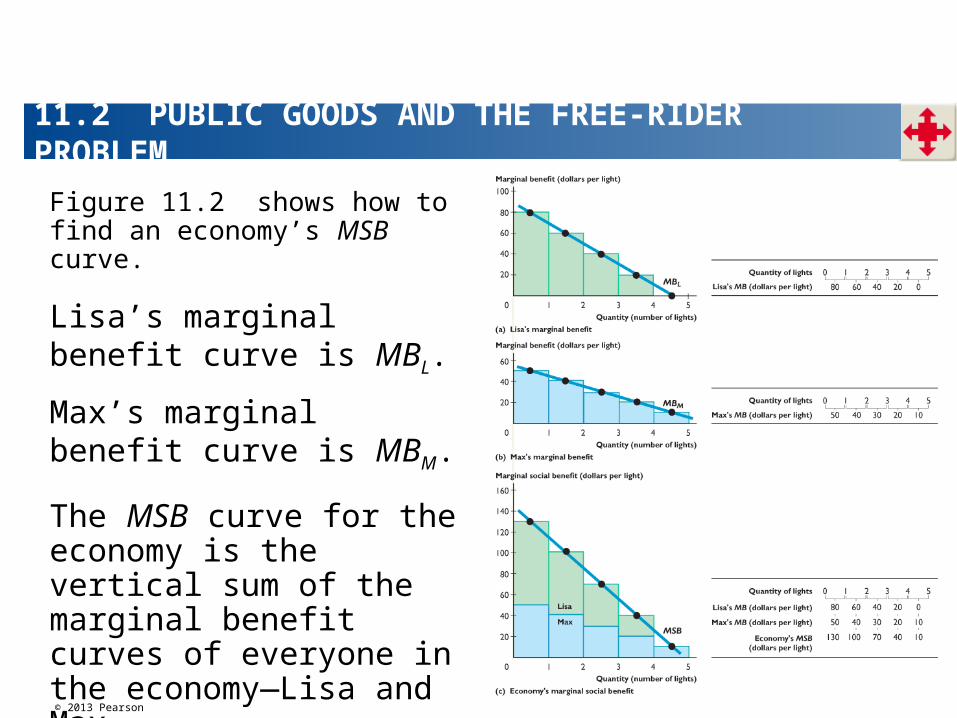
Figure 11.2 shows how to find an economy’s MSB curve.
Lisa’s marginal benefit curve is MBL.
The MSB curve for the economy is the vertical sum of the marginal benefit curves of everyone in the economy—Lisa and Max.
Max’s marginal benefit curve is MBM.
11.2 PUBLIC GOODS AND THE FREE-RIDER PROBLEM
© 2013 Pearson
Marginal cost increases as the quantity of a public good produced increases—the principle of increasing marginal cost.
So the marginal cost curve of public good slopes upward.
The Marginal Cost of a Public Good
11.2 PUBLIC GOODS AND THE FREE-RIDER PROBLEM
© 2013 Pearson
The Efficient Quantity of a Public Good
Resources are used efficiently if marginal benefit equals marginal cost.
If marginal benefit exceeds marginal cost, resources can be used more efficiently by increasing the quantity produced.
If marginal cost exceeds marginal benefit, resources can be used more efficiently by decreasing the quantity produced.
11.2 PUBLIC GOODS AND THE FREE-RIDER PROBLEM
© 2013 Pearson
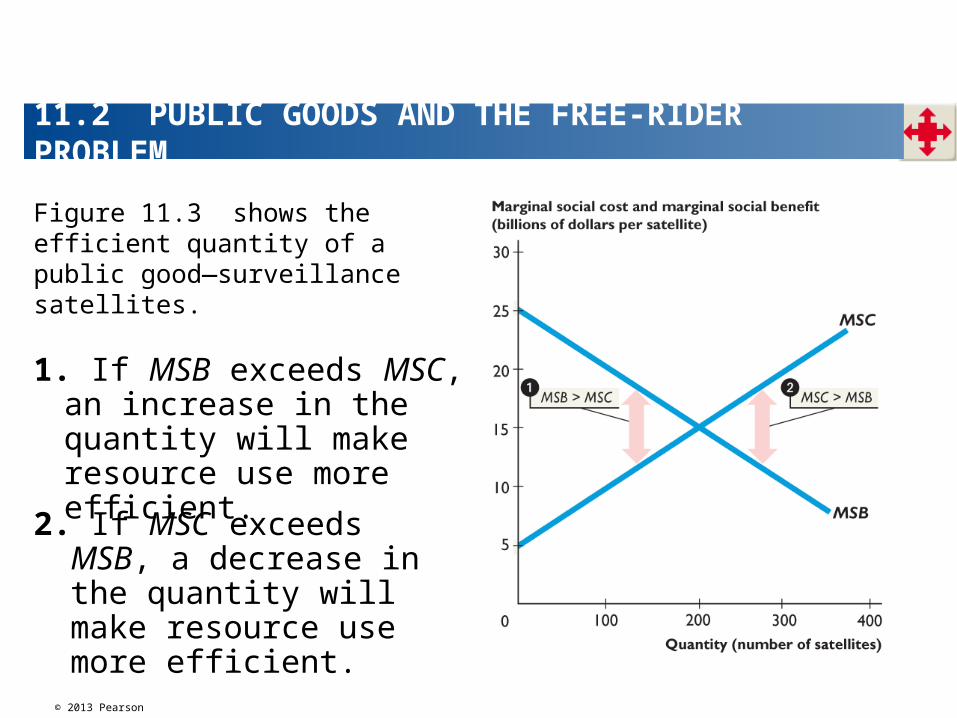
Figure 11.3 shows the efficient quantity of a public good—surveillance satellites.
1. If MSB exceeds MSC, an increase in the quantity will make resource use more efficient.
2. If MSC exceeds MSB, a decrease in the quantity will make resource use more efficient.
11.2 PUBLIC GOODS AND THE FREE-RIDER PROBLEM
© 2013 Pearson
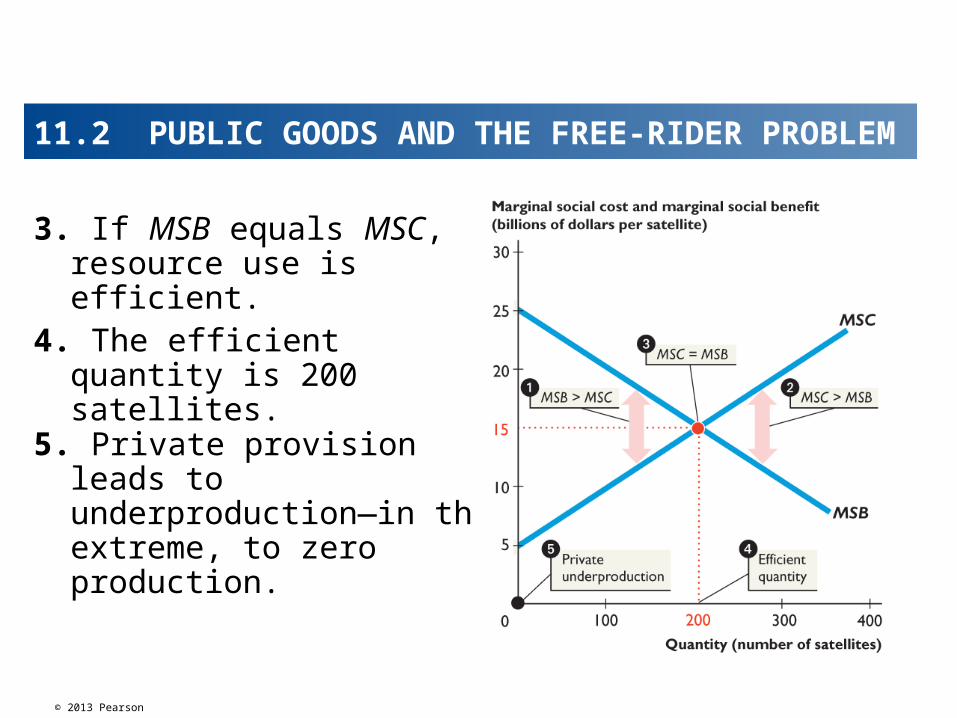
3. If MSB equals MSC, resource use is efficient.
4. The efficient quantity is 200 satellites.
5. Private provision leads to underproduction—in the extreme, to zero production.
11.2 PUBLIC GOODS AND THE FREE-RIDER PROBLEM
© 2013 Pearson
No one would have an incentive to buy his or her share of the satellite system—the free-rider problem.
So a private firm would not supply satellites.
Private Provision: Underproduction
The political process determines the quantity of a public good provided—this quantity might be efficient or inefficient.
Public Provision: Efficient Production
11.2 PUBLIC GOODS AND THE FREE-RIDER PROBLEM
© 2013 Pearson
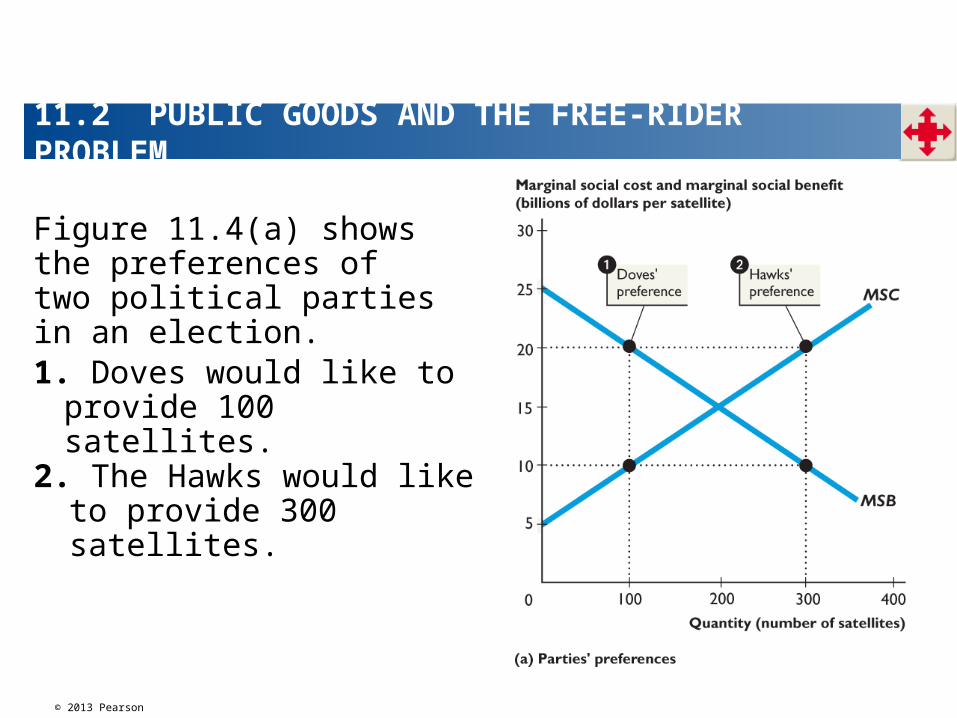
Figure 11.4(a) shows the preferences of two political parties in an election.
1. Doves would like to provide 100 satellites.
2. The Hawks would like to provide 300 satellites.
11.2 PUBLIC GOODS AND THE FREE-RIDER PROBLEM
© 2013 Pearson
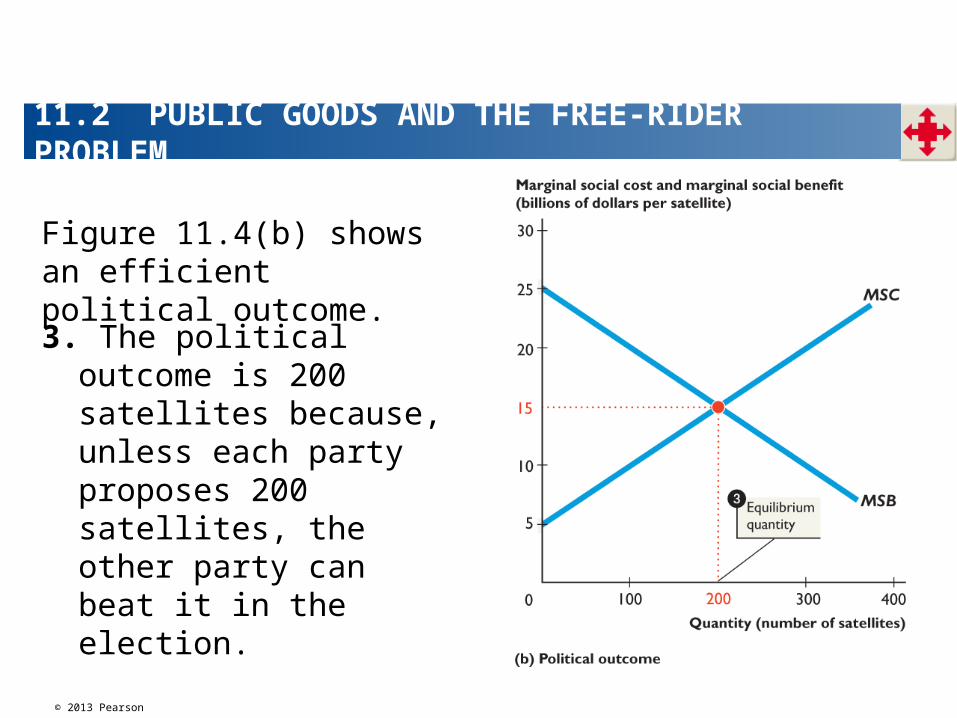
Figure 11.4(b) shows an efficient political outcome.
3. The political outcome is 200 satellites because, unless each party proposes 200 satellites, the other party can beat it in the election.
11.2 PUBLIC GOODS AND THE FREE-RIDER PROBLEM
© 2013 Pearson
The principle of minimum differentiation is the tendency for competitors to make themselves identical to appeal to the maximum number of clients or voters.
The Principle of Minimum Differentiation
11.2 PUBLIC GOODS AND THE FREE-RIDER PROBLEM
© 2013 Pearson
Bureaucrats translate the choices of politicians into programs and control the day-to-day activities that deliver public goods.
The behavior of bureaucrats modifies the political outcome.
Public Provision: Overproduction
11.2 PUBLIC GOODS AND FREE-RIDER PROBLEM11.2 PUBLIC GOODS AND THE FREE-RIDER PROBLEM
© 2013 Pearson
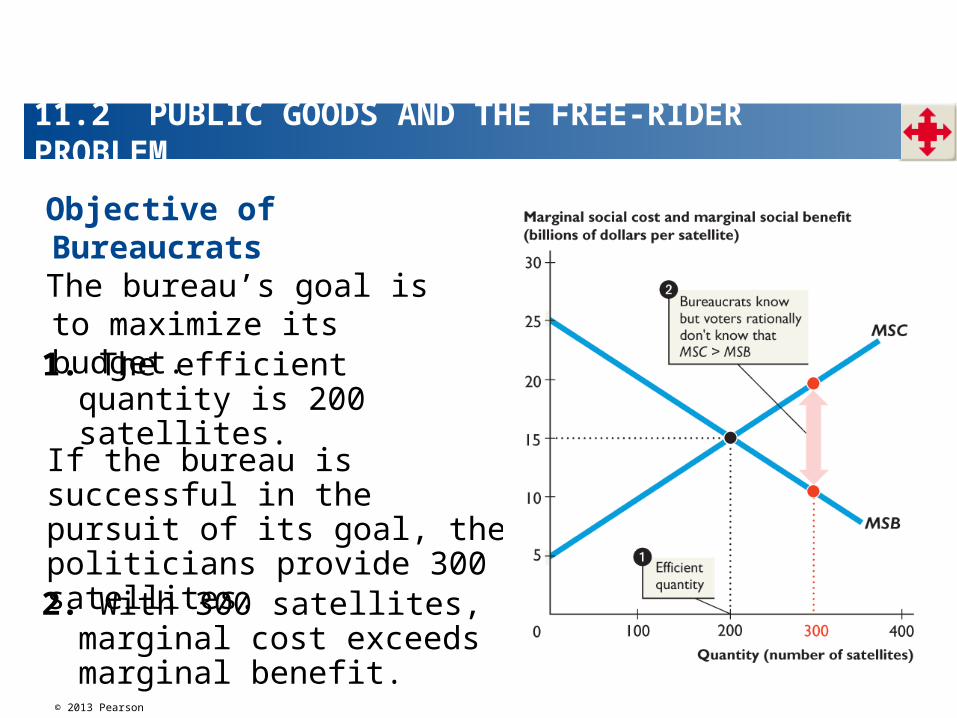
Objective of BureaucratsThe bureau’s goal is to maximize its budget.
1. The efficient quantity is 200 satellites.
If the bureau is successful in the pursuit of its goal, the politicians provide 300 satellites.
2. With 300 satellites, marginal cost exceeds marginal benefit.
11.2 PUBLIC GOODS AND THE FREE-RIDER PROBLEM
© 2013 Pearson
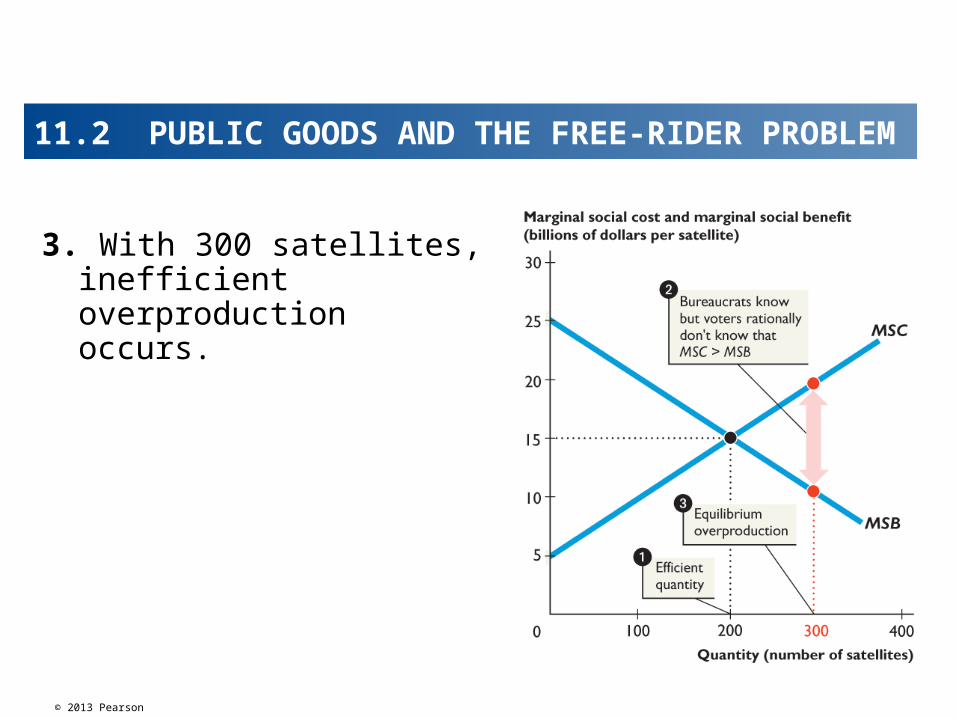
3. With 300 satellites, inefficient overproduction occurs.
11.2 PUBLIC GOODS AND THE FREE-RIDER PROBLEM
© 2013 Pearson
Why don’t the politicians block the bureaucrats?
Rational Ignorance
Rational choice balances marginal benefit and marginal cost.
An implication of rational choice is rational ignorance.
Rational Ignorance is the decision not to acquire information because the marginal cost of doing so exceeds the expected marginal benefit.
11.2 PUBLIC GOODS AND THE FREE-RIDER PROBLEM
© 2013 Pearson
Voter preferences for public goods drive the growth of government.
The demand for national and personal security and the demand for other public goods are income elastic.
As incomes increase, the demand for these services increases by a larger percentage than the increase in income.
Why Government Is Large and Growing
11.2 PUBLIC GOODS AND THE FREE-RIDER PROBLEM
© 2013 Pearson
Part of the reason why government is large is
• Inefficient overprovision of public goods
• Voters’ rational ignorance
There is no easy fix for this problem.
Our ever-growing demand for education and health-care services contribute to the large and growing scale of government.
11.2 PUBLIC GOODS AND THE FREE-RIDER PROBLEM
© 2013 Pearson
11.3 COMMON RESOURCES
The tragedy of the commons is the absence of incentives to prevent the overuse and depletion of a commonly owned resource.
Examples include the Atlantic Ocean cod stocks, South Pacific whales, and the quality of the earth’s atmosphere.
The traditional example from which the term derives is the common grazing land surrounding middle-age villages.
© 2013 Pearson
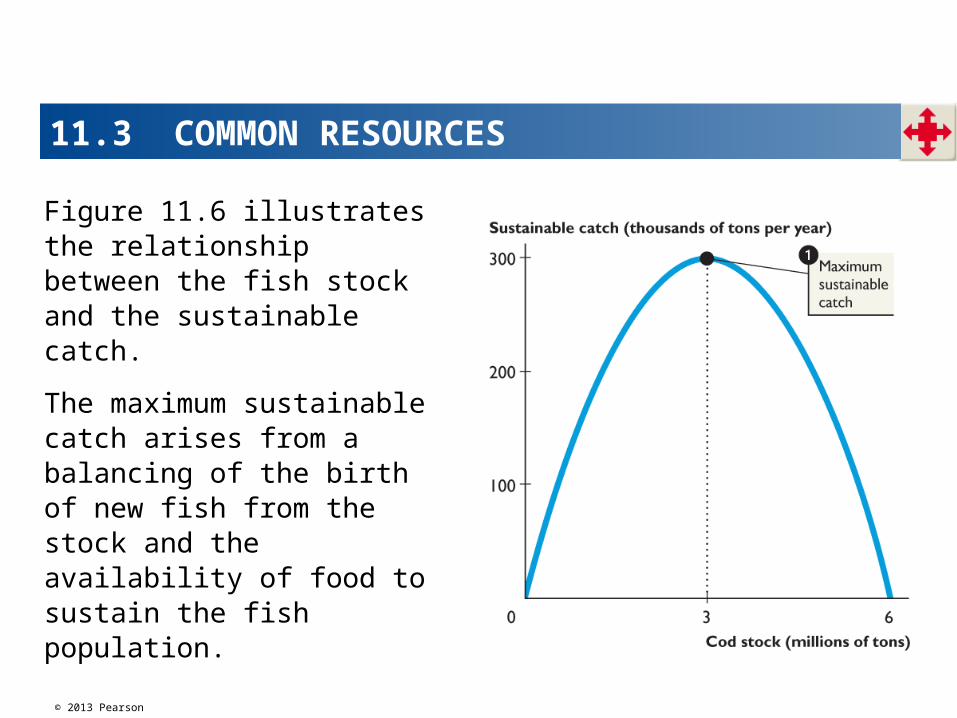
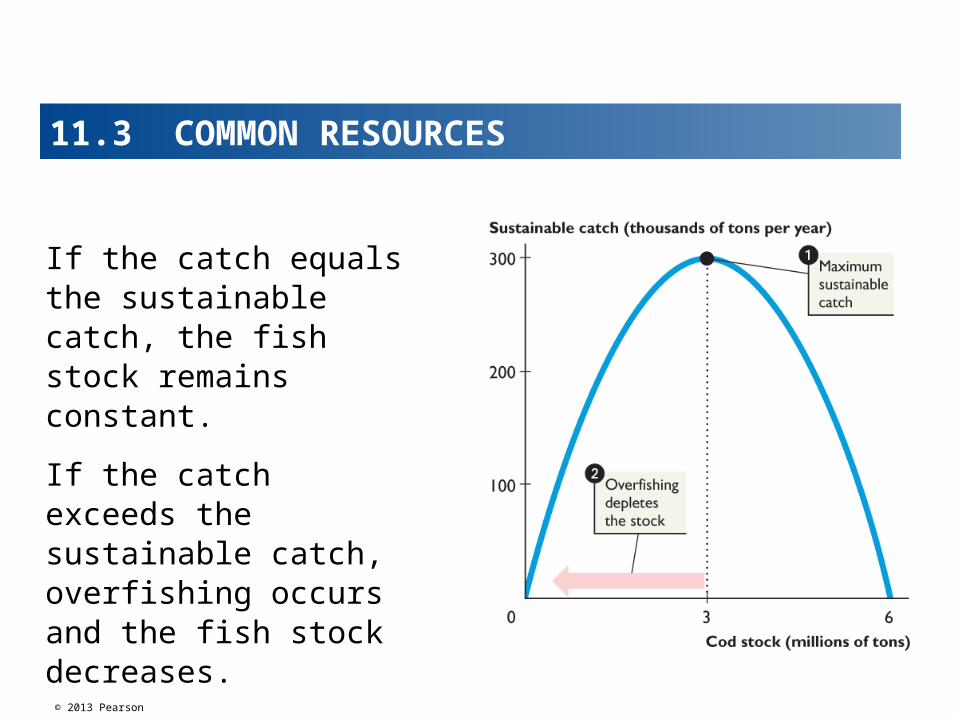
Figure 11.6 illustrates the relationship between the fish stock and the sustainable catch.
The maximum sustainable catch arises from a balancing of the birth of new fish from the stock and the availability of food to sustain the fish population.
11.3 COMMON RESOURCES
© 2013 Pearson
If the catch equals the sustainable catch, the fish stock remains constant.
If the catch exceeds the sustainable catch, overfishing occurs and the fish stock decreases.
11.3 COMMON RESOURCES
© 2013 Pearson
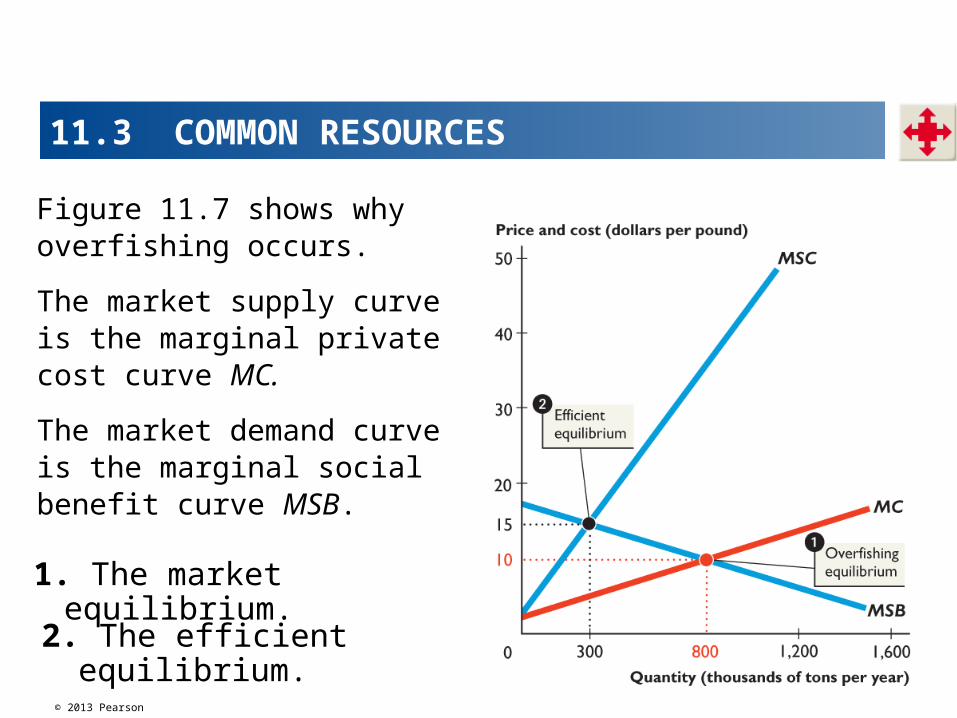
Figure 11.7 shows why overfishing occurs.
The market supply curve is the marginal private cost curve MC.
The market demand curve is the marginal social benefit curve MSB.1. The market equilibrium.
2. The efficient equilibrium.
11.3 COMMON RESOURCES
© 2013 Pearson
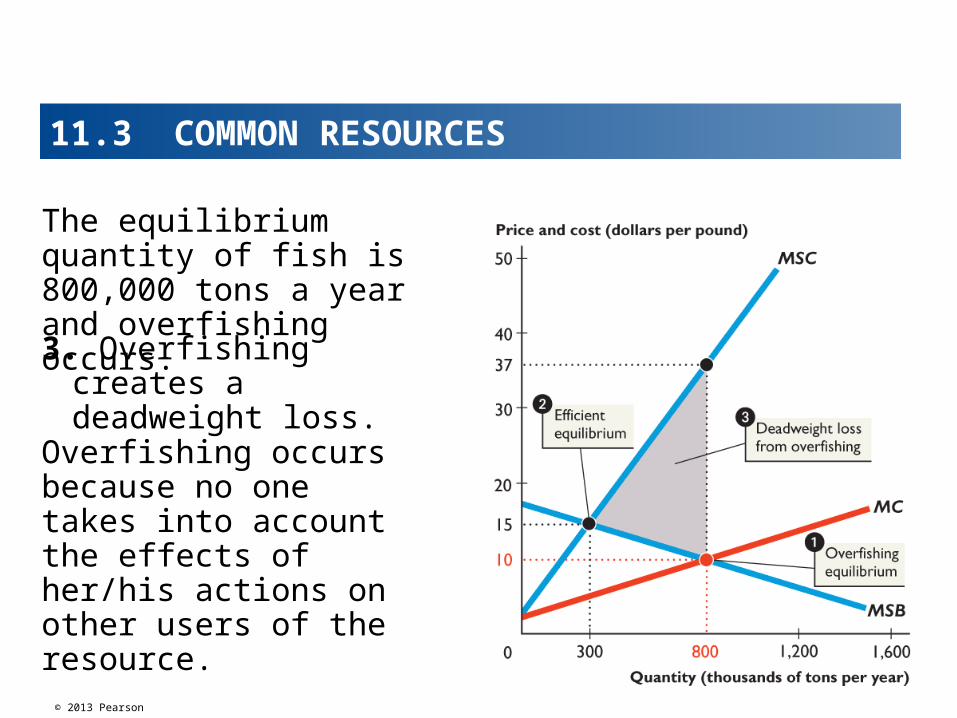
3. Overfishing creates a deadweight loss.
The equilibrium quantity of fish is 800,000 tons a year and overfishing occurs.
Overfishing occurs because no one takes into account the effects of her/his actions on other users of the resource.
11.3 COMMON RESOURCES
© 2013 Pearson
11.3 COMMON RESOURCES
Using the Commons Efficiently
The efficient use of a common resource requires marginal cost to equal marginal social benefit.
To use a common resource efficiently, it is necessary to design an incentive mechanism that confronts users of the common resources with the marginal external cost generated.
© 2013 Pearson
Three methods that might be used to achieve the efficient use of a common resource are
• Property rights• Production quotas• Individual transferable quotas (ITQs)
11.3 COMMON RESOURCES
© 2013 Pearson
11.3 COMMON RESOURCES
Property Rights
By assigning property rights, common property becomes private property.
When someone owns a resource, the owner is confronted with the full consequences of her/his actions when using that resource.
The social benefits become the private benefits.
© 2013 Pearson
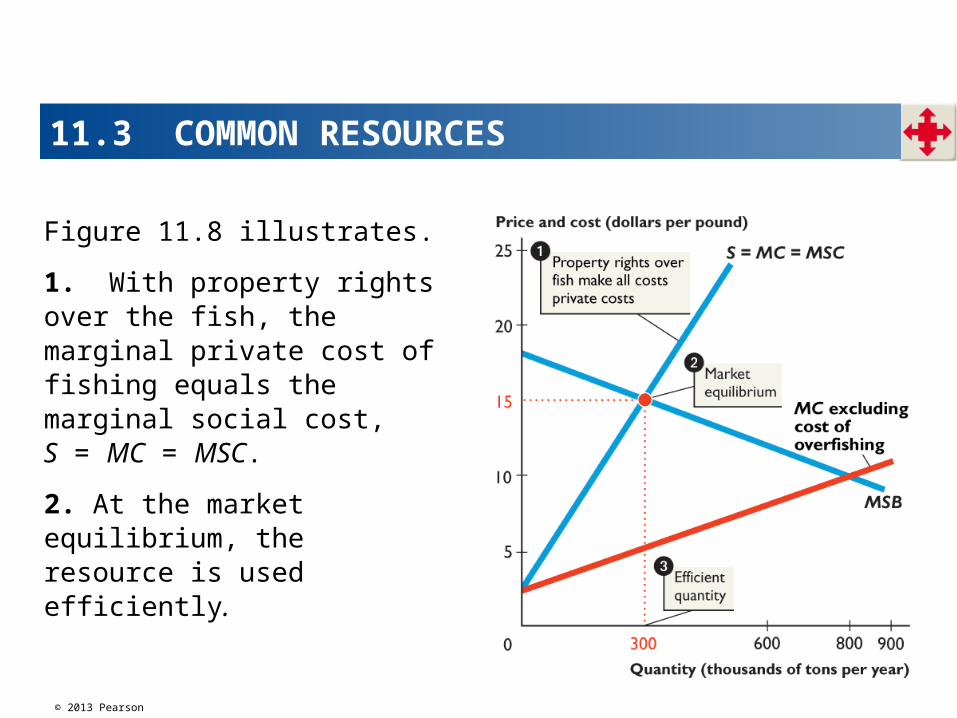
Figure 11.8 illustrates.
1. With property rights over the fish, the marginal private cost of fishing equals the marginal social cost, S = MC = MSC.
2. At the market equilibrium, the resource is used efficiently.
11.3 COMMON RESOURCES
© 2013 Pearson
11.3 COMMON RESOURCES
Production Quotas
A production quota is an upper limit to the quantity of a good that may legally be produced in a specified period.
A production quota can achieve an efficient use of a common resource if it is set equal to total production at the quantity at which marginal social benefit equals marginal cost.
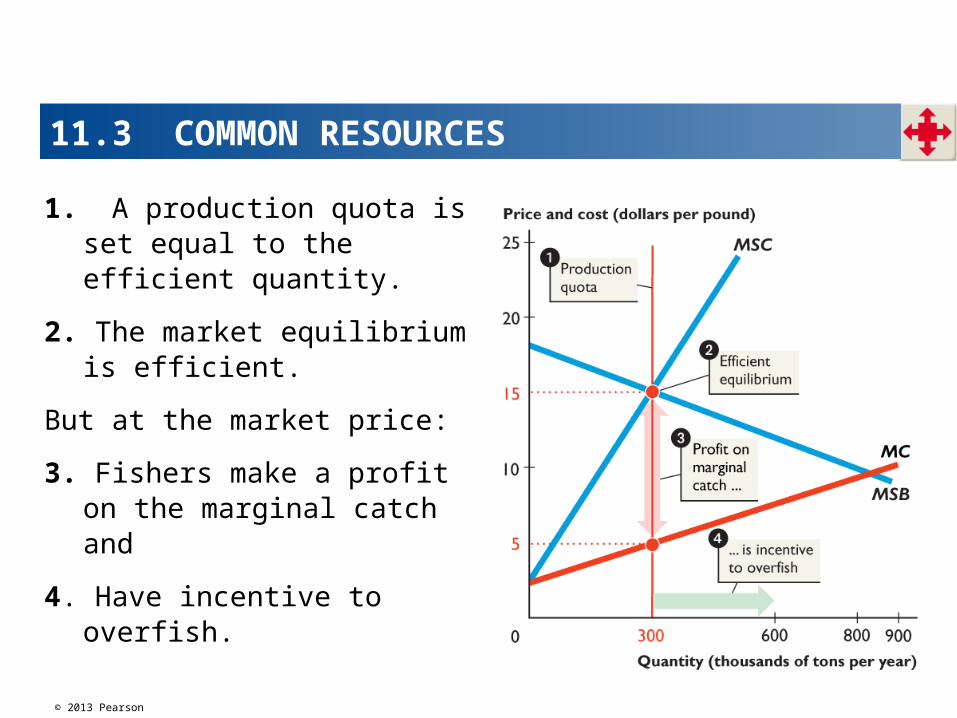
Figure 11.9 illustrates how a production quota works.
© 2013 Pearson
1. A production quota is set equal to the efficient quantity.
2. The market equilibrium is efficient.
But at the market price:
3. Fishers make a profit on the marginal catch and
4. Have incentive to overfish.
11.3 COMMON RESOURCES
© 2013 Pearson
Individual Transferable Quotas
An individual transferable quota (ITQ) is a production limit that is assigned to an individual who is free to transfer the quota to someone else.
A market in ITQs emerges.
The market price of an ITQ is the highest price that someone is willing to pay for one.
That price equals the marginal social benefit minus the marginal cost..
11.3 COMMON RESOURCES
© 2013 Pearson
The market price of an ITQ confronts fishers with the full cost of their catch.
The private marginal cost equals the marginal social cost.
If the efficient quantity of ITQs is assigned, the market price of a quota confronts resource users with a marginal cost that equals the external cost at the efficient quantity.
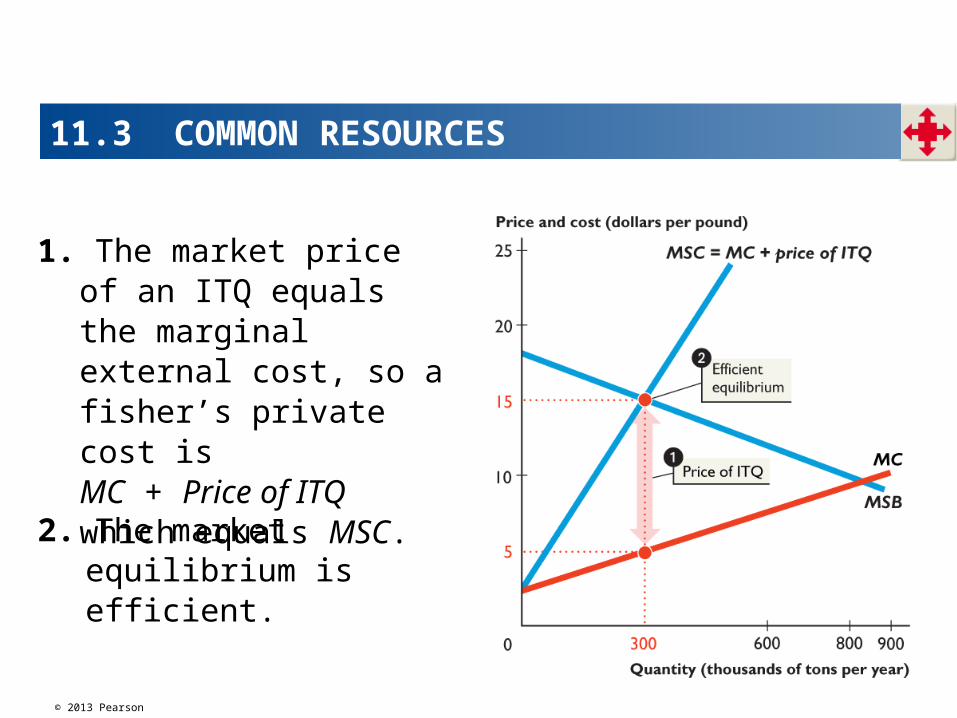
Figure 11.10 illustrates how ITQs work.
11.3 COMMON RESOURCES
© 2013 Pearson
1. The market price of an ITQ equals the marginal external cost, so a fisher’s private cost isMC + Price of ITQ which equals MSC.
2. The market equilibrium is efficient.
11.3 COMMON RESOURCES
© 2013 Pearson
Should America Build a High-Speed Rail Network like Europe’s?
Train travel in Europe is fast: The 190 miles from Paris to Brussels takes 1 hour and 20 minutes.
But the 220 miles from Boston to New York City takes 3 hours and 40 minutes.
President Obama says that by 2036, he wants 80 percent of Americans to be able to go places by train as fast as Europeans can.
Why is the United States lagging in high-speed rail transportation? Is there underprovision?
Or do we have the efficient amount of high-speed rail transportation?
© 2013 Pearson
© 2013 Pearson
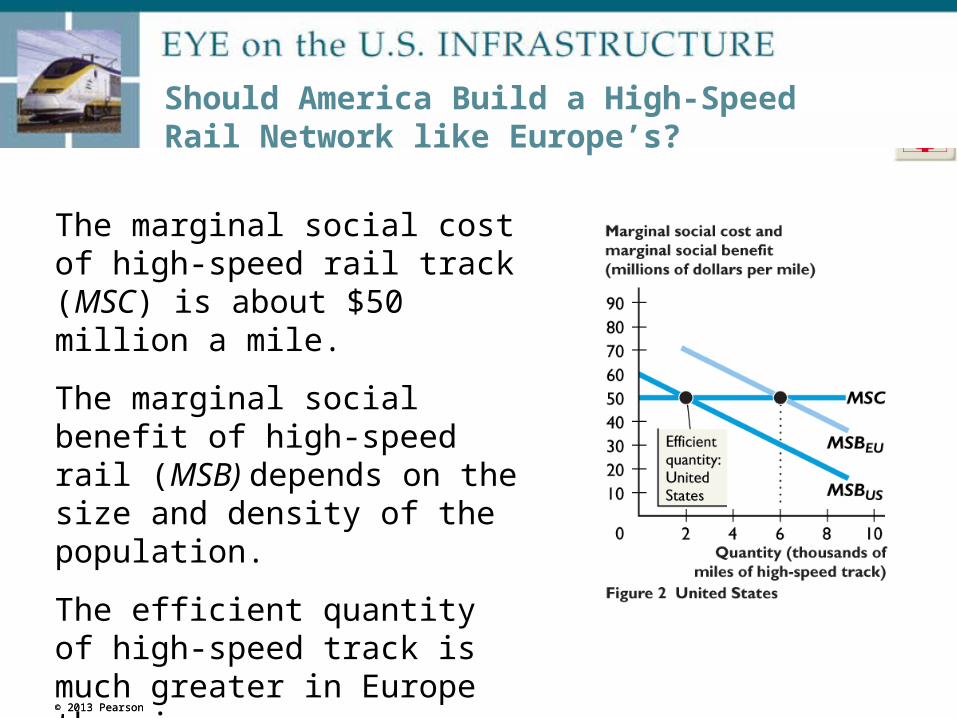
Should America Build a High-Speed Rail Network like Europe’s?
The marginal social cost of high-speed rail track (MSC) is about $50 million a mile.
The marginal social benefit of high-speed rail (MSB) depends on the size and density of the population.
The efficient quantity of high-speed track is much greater in Europe than in
the United States.© 2013 Pearson
© 2013 Pearson
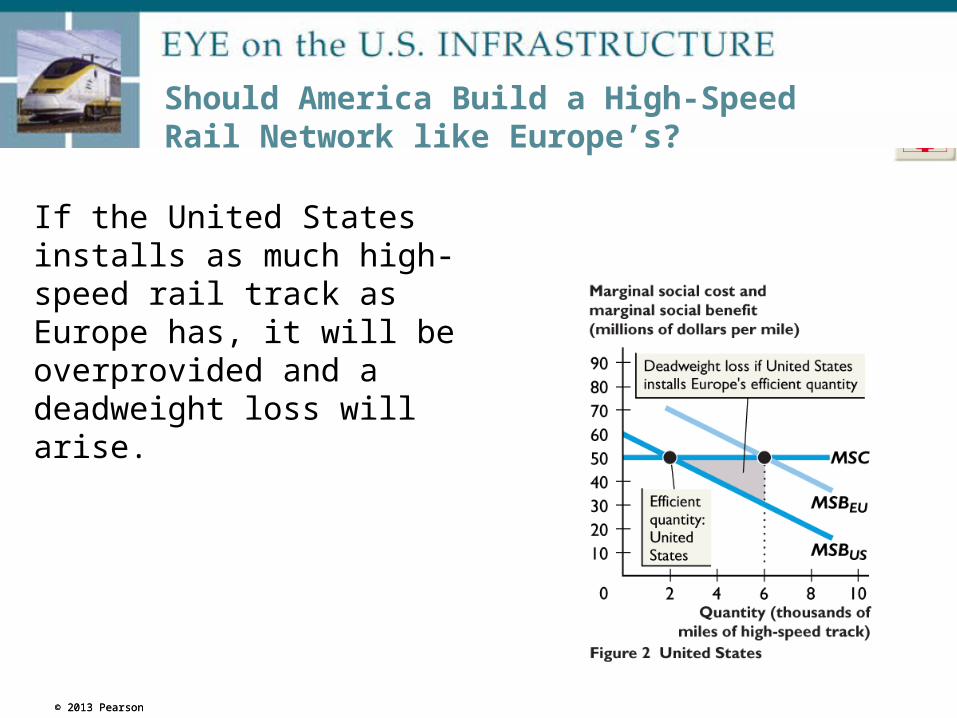
Should America Build a High-Speed Rail Network like Europe’s?
If the United States installs as much high-speed rail track as Europe has, it will be overprovided and a deadweight loss will arise.
© 2013 Pearson


![[Varian] Microeconomic Analysis](https://img.pdfslide.net/doc/110x75/5695d4011a28ab9b029fee27/varian-microeconomic-analysis-56c73dc9c2d65.jpg)