Embed Size (px)
Citation preview
Psychology, 2016, 7, 1352-1368 http://www.scirp.org/journal/psych
ISSN Online: 2152-7199 ISSN Print: 2152-7180
DOI: 10.4236/psych.2016.711137 October 24, 2016
Comparing the Latent Structure of the Children’s Category Test-Level 1 among Young Children and Older Adults: A Preliminary Study
Georgia Papantoniou1, Despina Moraitou2, Magda Dinou1, Effie Katsadima1, Eugenia Savvidou3, Evangelia Foutsitzi1
1Department of Early Childhood Education, School of Education, University of Ioannina, Ioannina, Greece 2School of Psychology, Aristotle University of Thessaloniki, Thessaloniki, Greece 3Department of Primary Education, School of Education, University of Ioannina, Ioannina, Greece
Abstract The aim of this paper was the comparison of the higher order nonverbal abilities, between young children and older adults. In specific, 42 kindergarten and 56 ele-mentary school students (age range: 5 - 8 years), as well as 118 new-old adults and 27 old-old adults (age range: 61 - 88 years), were examined in the Children’s Category Test-Level 1 (CCT-1). Findings from the Confirmatory Factor Analyses that were applied to data, possibly reflect the delay of development of general abstraction and working memory in the group of kindergarten students and the decline of them in the group of old-old adults. Keywords Cognitive Aging, Cognitive Development, General Abstraction, Retrogenesis, Working Memory
1. Introduction
Researchers in the field of cognitive aging seem to agree that, on average, cognitive functioning declines with aging. Among the cognitive abilities that seem to be more af-fected by age is fluid intelligence (Baltes, 1997; Moraitou & Efklides, 2012; Salthouse, Pink, & Tucher-Drob, 2008). Inference, inductive or deductive or heuristic, reflects processes that take an active part during problem solving in novel situations, indepen-dent of acquired knowledge. These processes underlie fluid intelligence (Demetriou, Spanoudis, Shayer, van der Ven, Brydges, Kroesbergen, Podjarny, & Swanson, 2014).
How to cite this paper: Papantoniou, G., Moraitou, D., Dinou, M., Katsadima, E., Savvidou, E., & Foutsitzi, E. (2016). Com-paring the Latent Structure of the Children’s Category Test-Level 1 among Young Child-ren and Older Adults: A Preliminary Study. Psychology, 7, 1352-1368. http://dx.doi.org/10.4236/psych.2016.711137 Received: July 20, 2016 Accepted: October 21, 2016 Published: October 24, 2016 Copyright © 2016 by authors and Scientific Research Publishing Inc. This work is licensed under the Creative Commons Attribution International License (CC BY 4.0). http://creativecommons.org/licenses/by/4.0/
Open Access
G. Papantoniou et al.
1353
More specifically, according to the Dual-Process Model of Life Span Intellectual De-velopment “the fluid cognitive mechanics are indexed by the speed and accuracy of elementary processes of information processing: information input; visual and motor memory; and basic perceptual-cognitive processes such as discrimination, comparison, categorization, as well as their application in working memory” (Baltes, 1997). Fur-thermore, regarding the fluid mechanics, life span theory predicts a form of an inverted U-shape function across the life span, with decline beginning in young adulthood (see Baltes, 1997; Baltes & Lindenberger, 1997; Horn & Hofer, 1992), while the information processing theories propose that the developmental differences in fluid intelligence re-flect differences in processing speed or working memory (see Demetriou et al., 2014).
Moreover, researchers have observed the general relationship between aging and de-velopment as findings in gerontological research have indicated that the collapse of in-telligence in dementia patients causes retrogression to childhood and/or appears to re-verse Piaget’s developmental stages (de Ajuriaguerra & Tissot, 1968; Rubial-Álvarez, de Sola, Machado, Sintas, Böhm, Sánchez-Benavides, Langohr, Muñiz, & Peña-Casanova, 2013; Shoji, Fukushima, Wakayana, Shizuka-Ikeda, Ikeda, Kawakami, Sakazume, Ikeda, Harigaya, Matsubara Kawarabayashi Murakami, Nagano, Manabe, & Abe, 2002). As stated by the retrogenic models, there is an inverse and progressive pattern of function-al and cognitive decline observed in Alzheimer’s Disease (AD) patients compared to the developmental acquisition of the corresponding capacities in children. Retrogenesis has been defined as the process by which degenerative mechanisms reverse the order of acquisition in normal development (Reinsberg, Franssen, Hasan, Monteiro, Boksay, Souren, Kenowsky, Auer, Elahi, & Kluger, 1999a; Reinsberg, Franssen, Souren, Auer, Akram, & Kenowsky, 2002; Reinsberg, Kenowsky, Franssen, Auer, & Souren, 1999b).
The findings regarding the retrogenic models suggest that comparisons should be made between the cognitive ability of these two groups of population, namely the de-veloping children and the retrograding elderly people. This suggestion has been taken into account in the limited use, in assessing cognition in moderate and severe AD pa-tients, of several screening instruments available for cognitive examination in infancy and childhood. For example, the application of the adapted and modified Ordinal Scales of Psychological Developmental (OSPD), developed by Uzgiris and Hunt for cognitive testing in infants, has been found to be superior to the use of traditional tests, such as the Mini-Mental State Examination (MMSE), in evaluating the cognitive ability of patients with moderately severe and severe AD (Borza, 2012). It was also reported that the use of test measures previously applied to infants and young children, based on Piagetian tradition, demonstrated residual cognitive capacity in subjects with severe AD previously considered untestable (Da Silva, Bueno, & Bertolucci, 2011; Reinsberg et al., 1999a). Furthermore, childhood intelligence test measures, such as the Japanese version of the Binet scale, namely the Tanaka-Binet intelligence scale, has been found to be useful in evaluating cognition in moderate to severe AD patients (Borza, 2012).
Since there is a loss of cognitive abilities acquired during childhood before the ap-pearance of clinically detectable dementia (Shoji et al., 2002), comparisons of cognitive
G. Papantoniou et al.
1354
ability should also be made between the aforementioned groups of population, namely the developing children and the cognitively normal older adults or preclinical AD pa-tients.
As regards the preclinical AD patients with neurological changes, it was reported that they do not demonstrate measurable cognitive decline on standard tests (Goldman, Price, Storandt, Grant, McKeel, Rubin, & Morris, 2001; Schmitt, Davis, Wekstein, Smith, Ashford, & Markesbery, 2000). More sensitive tests to detect early or preclinical stages of AD are desired, such as the MMSE, Wechler Adult Intelligence Scale-Revised (WAIS-R) and the Wechler Memory Scale-Revised (WMS-R), which are evidence- based test batteries for memory decline and intelligence. However, these scales can be administered (have been developed and standardized) only to persons between 16 and 74 years of age (Shoji et al., 2002).
In order for an approximate comparison between children’s and older adults’ cogni-tive ability to be correctly conducted, the administration of the same screening instru-ments to the two groups should be available (Papantoniou, Moraitou, Dinou, Katsadi-ma, Savvidou, & Foutsitzi, 2015; Rubial-Alvarez, Machado, Sintas, de Sola, Böhm, & Peña-Casanova, 2007; Shoji et al., 2002). In addition, throughout the many attempts that have been made to develop test batteries for the early detection of dementia, it is also possible that the detection of preclinical AD could be more accurate through neu-ropsychological tests focused on the detection of developmental disturbances both in young children and older adults. Therefore, simple screening instruments, available for cognitive examination in infancy and childhood, are needed to allow the assessment of the cognitive ability in older adults, in a short period of time, which would assist in early detection of cognitive impairment.
1.1. Children’s Category Test
Although, there is an increase in the number of the neuropsychological tests designed to evaluate brain dysfunction in children, until recently there were few measures of novel problem-solving for children that were adequately standardized and normed. The Children’s Category Test (CCT; Boll, 1993) is included among them due to its age- based norms that were based on a large standardization sample that was representative in the U.S. population.
The CCT is an instrument originally created from short forms of the child versions of the Halstead Category Test (HCT; Halstead, 1947) in an effort to reduce lengthy ad-ministration times of the original versions, providing a more efficient and user-friendly version of the HCT, which has established sensitivity to acquired cerebral impairment (Allen, Caron, & Goldstein, 2006). The CCT is an instrument designed to assess non- verbal learning and memory, concept formation and problem-solving abilities with novel material. It provides information on the child’s ability to develop alternative solu-tions, to change problem-solving strategies, to benefit from experience, and to develop, test, and modify hypotheses. This constellation of cognitive processes is highly related to fluid intelligence. The CCT may be used to determine whether or not a child is able
G. Papantoniou et al.
1355
to perform the aforementioned processes despite the existence of learning disorders, verbal or motor deficits, neurological deficits, or emotional handicaps (Boll, 1993). The Children’s Category Test consists of two levels. Level one (CCT-1) was developed for children of 5 - 8 years of age, and Level two (CCT-2) was intended for ages 9 - 16. Both levels require from the child to create and modify strategies of responding to visual stimuli based on corrective feedback.
Studies of the standardization sample indicate that CCT-1 has adequate internal con-sistency and criterion validity (Boll, 1993). However, research with the standardization sample has suggested that the CCT-1 may be a multifactorial task that measures various aspects of abstraction and problem-solving abilities, rather than one more general ab-straction construct. Factor analytic studies have provided evidence for the multidimen-sional nature of the CCT-1. For example, an exploratory factor analysis of the standar-dization sample indicated that the CCT-1 was composed of two factors, with moderate loadings of subtests II and III on one factor, and high loadings of subtests IV and V on another one. No formal names were assigned to the factors, although both factors were thought to assess reasoning abilities, with second factor requiring “…a relatively higher level of concrete operational reasoning” (Donders, 1999: p. 281). More recently, a study by Moore, Donders, & Thompson (2004) indicated that the CCT-1 subtests are diffe-rentially sensitive to the severity of brain injury. In specific, Moore et al. (2004) found subtests III and V to be sensitive to brain damage, but in the standardization sample these two subtests loaded on separate factors. Therefore, the factor structure of the CCT-1 suggested by Donders (1999) and Moore et al. (2004) is different. Since it is not unusual for psychometric measures to have a different latent structure in a clinical sample, than in the standardization sample (Woodward & Donders, 1998), it seems that the factor structure of the CCT-1 differs in children with brain dysfunction, compared to those without.
Taking into account the aforementioned findings, Allen, Knatz, & Mayfield (2006) used Confirmatory Factor Analysis (CFA) in order to examine the construct validity of the CCT-1, in a clinical sample with heterogeneous forms of brain dysfunction, by con-trasting the factor structure reported in the standardization sample (Donders, 1999), to the one indirectly suggested by Moore et al. (2004). The factor structure found in Allen et al.’s (2006) clinical sample, using CFA, was similar to the one found in the standar-dization sample (Donders, 1999), with subtests II and III forming one factor, and sub-tests IV and V forming another. Allen et al.’s (2006) results support viewing CCT-1 as a multidimensional procedure that assesses two distinct but related constructs (factors). The first construct, “Conceptual Discrimination”, is consistent with the view that the CCT-1 is a measure of problem solving and reasoning. The second, “Conceptual Mem-ory”, appears to assess learning and memory, and as such departs from what might be traditionally thought of as a test of reasoning ability (Allen et al., 2006).
1.2. Aim of the Study
Based, firstly, on findings in the field of cognitive aging, supporting that fluid intelli-

G. Papantoniou et al.
1356
gence increases rapidly in the early years of life and declines with aging (Baltes, 1997; Moraitou & Efklides, 2012; Salthouse et al., 2008), and, secondly, on the hypothesis of “retrogenesis”, the aim of the present study was the comparison of the, related with fluid intelligence, higher order thinking abilities such as general abstraction and rea-soning, between the developing children and the cognitively healthy older adults. The comparison has been conducted through the investigation of the qualitative changes in the latent structure of the CCT-1, from age to age, using CFA.
Comparing pair-wise the four groups of our sample (first- to second-grade elemen-tary school students with new-old adults, & kindergarten students with old-old adults), the latent structure of the CCT-1 was expected to differentiate between first- to sec-ond-grade elementary school students and new-old adults, on the one hand and kin-dergarten students and old-old adults, on the other (Hypothesis 1).
In specific, we expected to find similar latent structure of the CCT-1 for first- to sec-ond-grade elementary school students and new-old adults (Hypothesis 2a), and similar latent structure of the CCT-1 for kindergarten students and old-old adults (Hypothesis 2b).
2. Method 2.1. Participants
The total sample consisted of four groups of individuals: a group of kindergarten stu-dents, a group of first- to second-grade elementary school students, a group of new-old adults, and a group of old-old adults.
The first group comprised 42 kindergarten students 5 to 6 years old (mean age = 68.1 months, age range: 61 - 75 months). Of the 42 participants, 16 were boys (38.1%) and 26 were girls (61.9%). The second group included 56 first- to second-grade elementary school students 6 to 8 years old (mean age = 85.45 months, age range: 74 - 98 months). Of the 56 participants, 22 were boys (39.3%) and 34 were girls (60.7%). None of the children had a history of learning difficulties (based on the school records and student reports) and they all attended the regular curriculum in two preschool institutions (one public and one private) and three primary schools (two public and one private) of me-dium and high socioeconomic status, in the city of Ioannina in Epirus (a province in the West of Greece).
Furthermore, two groups of older adults were tested. In specific, one group com-prised 118 new-old adults (mean age = 71.33 years, age range: 61 - 79 years). Of the 118 participants, 45 were men (38.1%) and 73 were women (61.9%). The second group of older adults included 27 old-old adults (mean age = 83.04 years, age range: 80 - 88 years). Of the 27 participants, 10 were men (37.0%) and 17 were women (63.0%). Ex-clusion criteria for both groups were a history of neurological conditions or psychiatric diseases, alcohol or drug abuse, severe head trauma, profound visual impairments, and verbal incomprehension. None of the participants had been diagnosed as meeting the diagnostic criteria for possible dementia, by consultant neurologists and psychiatrists. All the participants were community dwelling adults-volunteers recruited by the re-
G. Papantoniou et al.
1357
searchers from seniors’ day-care centers. They were residents of Thessaloniki and Ko-zani (a town in the province of West Macedonia in Greece). It should be noted that the subsample of older adults included an over representation (57.2%) of persons with 9 years of formal education or fewer.
2.2. Instrument
Children’s Category Test-Level 1 (CCT-1): The CCT-1 (Boll, 1993) is an individually administered test designed for children between the ages of 5 to 8 years. It is presented in booklet form and consists of 80 items distributed across 5 subtests. Each of the sub-tests I and V comprises 10 items while each of the subtests II, III and IV comprises 20 items.
The items comprising each subtest are connected by a single principle which varies across the subtests. The test requires the child to identify the conceptual rule that un-derlies each subtest and apply that concept to answering each item correctly. The child is shown a series of pictures that is intended to suggest a particular color and it has to respond by pointing to (or verbally identifying) one of four colors printed in a response card. The child receives immediate feedback as to the correctness of each response and it is expected to use this feedback to determine the conceptual rule underlying the sub-test. Subtest I can be employed as a practice test to determine if the child understands the task and is able to provide appropriate responses, while subtest V requires the child to remember and apply the principles of the previous subtests. The conceptual rules underlying the subtests include the following: color recognition (subtest I), determina-tion of the relative quantity of a specific color (subtest II), identification of the oddity in shape or size (subtest III), identification of the missing color (subtest IV), and review of the principles presented in subtests I through IV (subtest V).
As regards CCT-1 reliability, averaged coefficient, based on Fisher’s z transforma-tion, is 0.88 demonstrating that CCT-1 possesses a high degree of internal consistency. The averaged test-retest reliability for the total error T score is 0.79 indicating that scores on the CCT-1 possess adequate stability across short time of periods. In specific, higher reliability coefficients are expected as the time between testing increases to 2 to 6 months (Boll, 1993).
2.3. Procedure
As regards the participation of the kindergarten and elementary school students in the study, in collaboration with the school committees, their parents were asked to give a written statement of consent prior to the testing and then they completed an individu-al-demographics form. Children’s testing in CCT-1 was performed at an individual ba-sis, in their school environment. No time limit was assigned for the completion of the tests and all young participants were informed that they were free to withdraw from testing at any time.
Older adults were also examined at an individual basis, either at the center from which they had been recruited, or in their own home. No time limit was assigned for

G. Papantoniou et al.
1358
the completion of the examination and the participants were informed that they were free to withdraw from testing at any time. All the participants signed an informed con-sent and then they completed an individual-demographics form.
The test was administered according to standard procedures by a psychologist and doctoral practicum students who were trained to the reliable and valid administration of the test.
2.4. Statistical Analysis
According to the introduction section, previous empirical works have implied two al-ternative two-factor models for the CCT-1 dimensionality. The aforementioned two- factor models were a priori competing with each other, as well as with a one-factor model in which subtests II, III, IV, and V were specified to load on a single factor (Al-len et al., 2006). Hence, taking into account findings supporting that factor structure of neurocognitive measures may vary from one population to the next (Woodward & Donders, 1998), we used CFA in order to investigate possible qualitative changes in the latent structure of the CCT-1, between developing children and cognitively healthy older adults.
Since the CCT-1 manual does not provide normative data per subtest and because of the relatively small sample size of each group, the total raw numbers of errors per sub-test on CCT-1 were used in the analysis of the present study. Subtest I was not included in the CFA because only 20 (8.2%) participants (4 kindergarten students, 6 elementary school students, and 10 new-old adults) made errors on subtest I and the rest (includ-ing all of the old-old adults) had completely flawless performance. As a result the dis-tribution of error scores for subtest I did not meet assumptions of multivariate normal-ity, which is desirable for factor analyses (see Allen et al., 2006; Moore et al., 2004). Therefore, each covariance matrix was based on four total scores (measured variables), namely, total raw score for subtest II, total raw score for subset III, total raw score for subset IV, and total raw score for subset V.
CFA was conducted in EQS Version 6.1 (Bentler, 2005) and performed on the five covariance matrices, which stemmed from the total sample and each one of the four groups of participants, using the Maximum Likelihood (ML or ML ROBUST) estima-tion method. The Wald test was used to test the need for the estimated parameters and to suggest a more restricted model.
3. Results 3.1. Testing Latent Structure of CCT-1 in the Total Sample
Initially, we compared the three following factor structures, in the total sample (Models A): Model A1 [the one-factor model in which all four measured variables loaded on a single latent variable], Model A2 [the two-factor model which proposed a factor con-sisting of subtests II and IV, and a second factor consisted of subtests III and V, with interrelations between the two factors] and Model A3 [the two-factor model which proposed a factor consisting of subtests II and III, and a second factor consisted of sub-
G. Papantoniou et al.
1359
tests IV and V, with interrelations between the two factors]. Goodness-of-Fit Indexes for the CFA Models A are presented in Table 1.
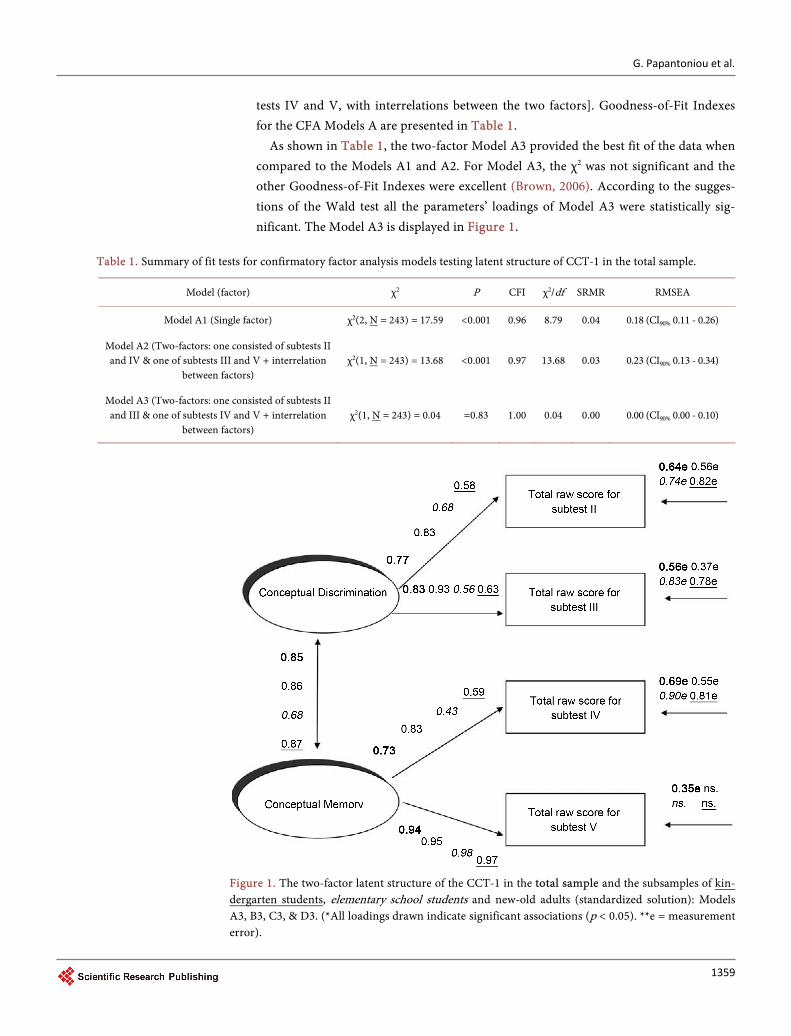
As shown in Table 1, the two-factor Model A3 provided the best fit of the data when compared to the Models A1 and A2. For Model A3, the χ2 was not significant and the other Goodness-of-Fit Indexes were excellent (Brown, 2006). According to the sugges-tions of the Wald test all the parameters’ loadings of Model A3 were statistically sig-nificant. The Model A3 is displayed in Figure 1.
Table 1. Summary of fit tests for confirmatory factor analysis models testing latent structure of CCT-1 in the total sample.
Model (factor) χ2 P CFI χ2/df SRMR RMSEA
Model A1 (Single factor) χ2(2, N = 243) = 17.59 <0.001 0.96 8.79 0.04 0.18 (CI90% 0.11 - 0.26)
Model A2 (Two-factors: one consisted of subtests II and IV & one of subtests III and V + interrelation
between factors) χ2(1, N = 243) = 13.68 <0.001 0.97 13.68 0.03 0.23 (CI90% 0.13 - 0.34)
Model A3 (Two-factors: one consisted of subtests II and III & one of subtests IV and V + interrelation
between factors) χ2(1, N = 243) = 0.04 =0.83 1.00 0.04 0.00 0.00 (CI90% 0.00 - 0.10)
Figure 1. The two-factor latent structure of the CCT-1 in the total sample and the subsamples of kin-dergarten students, elementary school students and new-old adults (standardized solution): Models A3, B3, C3, & D3. (*All loadings drawn indicate significant associations (p < 0.05). **e = measurement error).
G. Papantoniou et al.
1360
3.2. Testing Latent Structure of CCT-1 in the Subsamples of Elementary School Students and New-Old Adults
In order to compare the latent structure in CCT-1 between elementary school students and new-old adults, we tested the three aforementioned factor structures, in the group of first- to second-grade elementary school students (Models B). Due to the statistically significant excess kurtosis of this group of the sample, Models B1, B2 and B3 were computed using the Maximum Likelihood (ML ROBUST) estimation method. Good-ness-of-Fit Indexes for the CFA Models B are presented in Table 2.
As can be seen in Table 2, according to their indexes, it seemed that Models B1, B2, and B3 should be considered as equivalent. Since the Δχ2 among the three models was not statistically significant, they seemed to fit the data equally well. However, according to the suggestions of the Wald test, the Model B1 was not fully confirmed, for the group of elementary school students, because the variance of the single latent variable (factor) was not found to be statistically significant (p = 0.25). Similarly, the Model B2 was not fully confirmed, for the group of elementary school students, because the variance of the factor, consisting of subtests II and IV, was not found to be statistically significant either (p = 0.32).
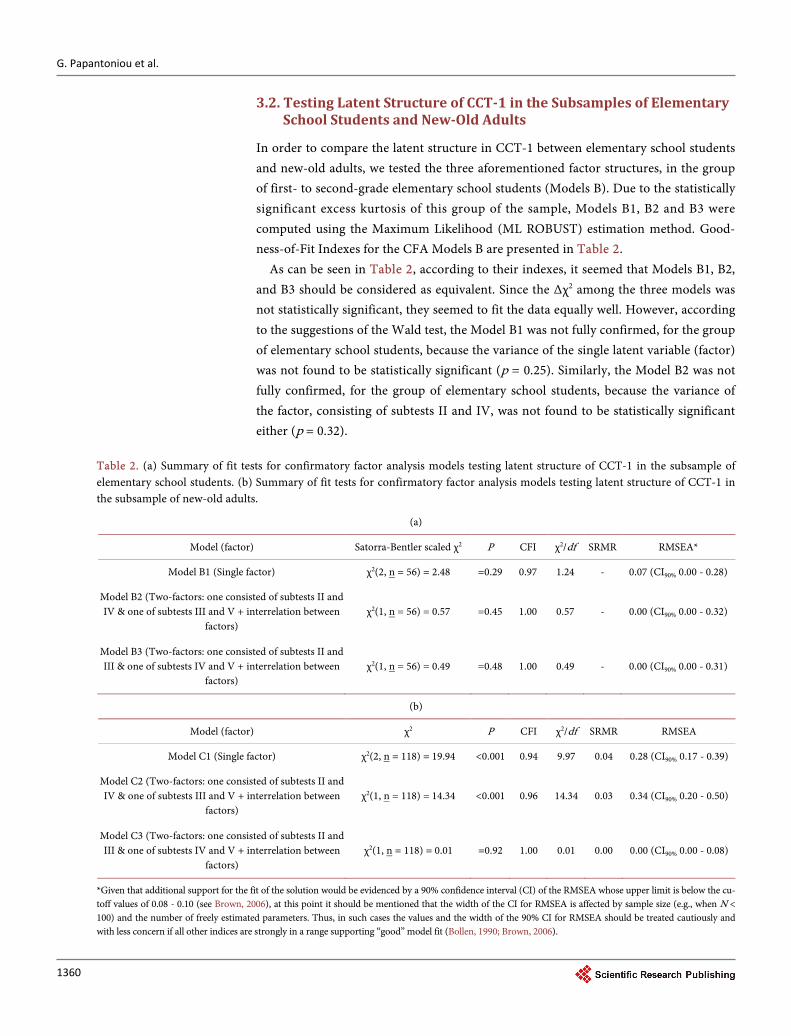
Table 2. (a) Summary of fit tests for confirmatory factor analysis models testing latent structure of CCT-1 in the subsample of elementary school students. (b) Summary of fit tests for confirmatory factor analysis models testing latent structure of CCT-1 in the subsample of new-old adults.
(a)
Model (factor) Satorra-Bentler scaled χ2 P CFI χ2/df SRMR RMSEA*
Model B1 (Single factor) χ2(2, n = 56) = 2.48 =0.29 0.97 1.24 - 0.07 (CI90% 0.00 - 0.28)
Model B2 (Two-factors: one consisted of subtests II and IV & one of subtests III and V + interrelation between
factors) χ2(1, n = 56) = 0.57 =0.45 1.00 0.57 - 0.00 (CI90% 0.00 - 0.32)
Model B3 (Two-factors: one consisted of subtests II and III & one of subtests IV and V + interrelation between
factors) χ2(1, n = 56) = 0.49 =0.48 1.00 0.49 - 0.00 (CI90% 0.00 - 0.31)
(b)
Model (factor) χ2 P CFI χ2/df SRMR RMSEA
Model C1 (Single factor) χ2(2, n = 118) = 19.94 <0.001 0.94 9.97 0.04 0.28 (CI90% 0.17 - 0.39)
Model C2 (Two-factors: one consisted of subtests II and IV & one of subtests III and V + interrelation between
factors) χ2(1, n = 118) = 14.34 <0.001 0.96 14.34 0.03 0.34 (CI90% 0.20 - 0.50)
Model C3 (Two-factors: one consisted of subtests II and III & one of subtests IV and V + interrelation between
factors) χ2(1, n = 118) = 0.01 =0.92 1.00 0.01 0.00 0.00 (CI90% 0.00 - 0.08)
*Given that additional support for the fit of the solution would be evidenced by a 90% confidence interval (CI) of the RMSEA whose upper limit is below the cu-toff values of 0.08 - 0.10 (see Brown, 2006), at this point it should be mentioned that the width of the CI for RMSEA is affected by sample size (e.g., when N < 100) and the number of freely estimated parameters. Thus, in such cases the values and the width of the 90% CI for RMSEA should be treated cautiously and with less concern if all other indices are strongly in a range supporting “good” model fit (Bollen, 1990; Brown, 2006).
G. Papantoniou et al.
1361
Therefore, the two-factor Model B3 provided the best fit of the data when compared to Models B1 and B2. For Model B3, the Goodness-of-Fit Indexes were excellent (Brown, 2006). According to the suggestions of the Wald test all the parameters’ loadings of Model B3 were statistically significant except for the measurement error of the indica-tor that represented the raw total error score of subtest V (p = 0.93). The Model B3 is displayed in Figure 1.
Then, we tested the three aforementioned factor structures, in the group of new-old adults (Models C). Goodness-of-Fit Indexes for the CFA Models C are presented in Table 2.
As shown in Table 2, the two-factor Model C3 provided the best fit of the data when compared to Models C1 and C2. For Model C3, the χ2 was not significant and the other Goodness-of-Fit Indexes were excellent (Brown, 2006). According to the suggestions of the Wald test all the parameters’ loadings of Model C3 were statistically significant ex-cept for the measurement error of the indicator that represented the raw total error score of subtest V (p = 0.05). The Model C3 is displayed in Figure 1.
The comparison of the CFA Model B3 with the Model C3 indicates a similar latent structure in CCT-1 for first- to second-grade elementary school students and new-old adults and verified Hypothesis 2a.
3.3. Testing Latent Structure of CCT-1 in the Subsamples of Kindergarten Students and Old-Old Adults
In order to compare the latent structure in CCT-1 between kindergarten students and old-old adults, we tested the three aforementioned factor structures, in the group of kindergarten students (Models D). Goodness-of-Fit Indexes for the CFA Models D are presented in Table 3.
As can be seen in Table 3, for all the Models (D1, D2 & D3) the χ2 was not significant and the other Goodness-of-Fit Indexes were excellent (Brown, 2006). Furthermore, since the Δχ2 among the three models was not statistically significant, they seemed to fit the data equally well. Therefore, according to their indexes, it seemed that Models D1, D2, and D3 should be considered as equivalent. Thus, we did not derive only a two- factor Model D3 that could explain the variance of the kindergarten students’ perfor-mance on CCT-1. We also derived two more Models (D1 & D2) that could explain the variance of the kindergarten students’ performance on CCT-1, equally well compared to the aforementioned Model D3.
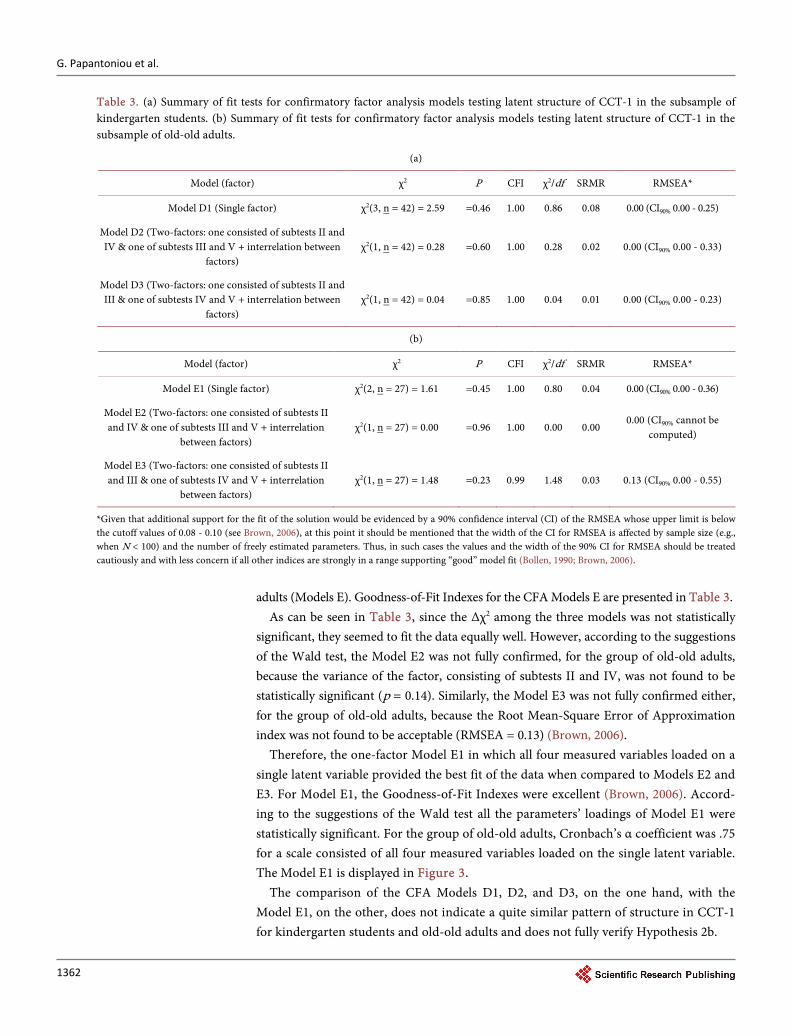
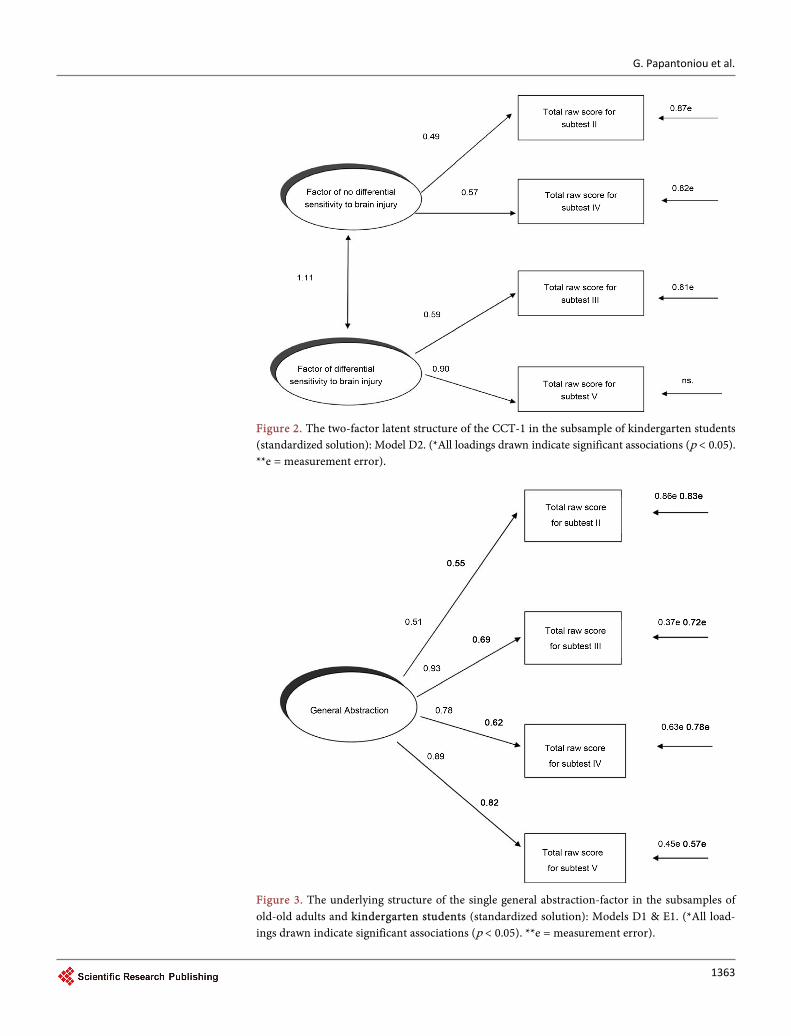
It should be noted here, that according to the suggestions of the Wald test all the pa-rameters’ loadings of Models D1, D2, and D3 were statistically significant except for the measurement error of the indicator that represented the raw total error score of subtest V, both for the Model D2 (p = 0.33) and Model D3 (p = 0.80). For the group of kinder-garten students, Cronbach’s α coefficient was 0.65 for a scale consisted of all four measured variables loaded on the single latent variable. The Model D3 is displayed in Figure 1. The Model D2 is displayed in Figure 2, and the Model D1 is displayed in Figure 3.
Finally, we tested the three aforementioned factor structures, in the group of old-old
G. Papantoniou et al.
1362
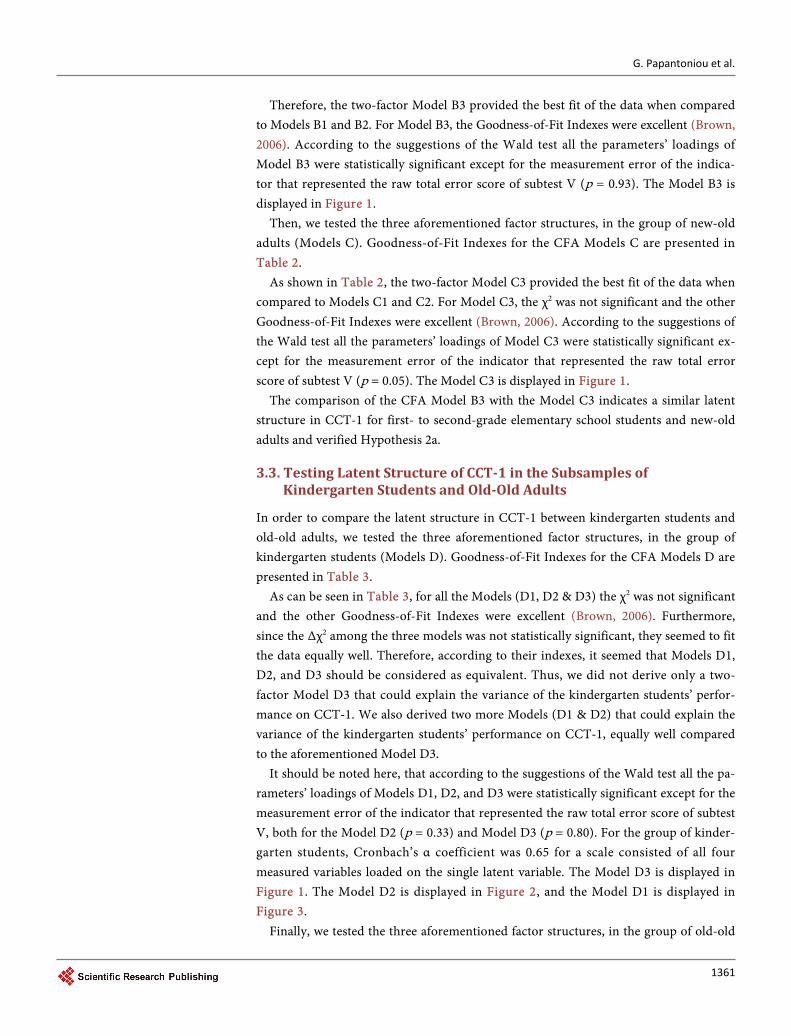
Table 3. (a) Summary of fit tests for confirmatory factor analysis models testing latent structure of CCT-1 in the subsample of kindergarten students. (b) Summary of fit tests for confirmatory factor analysis models testing latent structure of CCT-1 in the subsample of old-old adults.
(a)
Model (factor) χ2 P CFI χ2/df SRMR RMSEA*
Model D1 (Single factor) χ2(3, n = 42) = 2.59 =0.46 1.00 0.86 0.08 0.00 (CI90% 0.00 - 0.25)
Model D2 (Two-factors: one consisted of subtests II and IV & one of subtests III and V + interrelation between
factors) χ2(1, n = 42) = 0.28 =0.60 1.00 0.28 0.02 0.00 (CI90% 0.00 - 0.33)
Model D3 (Two-factors: one consisted of subtests II and III & one of subtests IV and V + interrelation between
factors) χ2(1, n = 42) = 0.04 =0.85 1.00 0.04 0.01 0.00 (CI90% 0.00 - 0.23)
(b)
Model (factor) χ2 P CFI χ2/df SRMR RMSEA*
Model E1 (Single factor) χ2(2, n = 27) = 1.61 =0.45 1.00 0.80 0.04 0.00 (CI90% 0.00 - 0.36)
Model E2 (Two-factors: one consisted of subtests II and IV & one of subtests III and V + interrelation
between factors) χ2(1, n = 27) = 0.00 =0.96 1.00 0.00 0.00
0.00 (CI90% cannot be computed)
Model E3 (Two-factors: one consisted of subtests II and III & one of subtests IV and V + interrelation
between factors) χ2(1, n = 27) = 1.48 =0.23 0.99 1.48 0.03 0.13 (CI90% 0.00 - 0.55)
*Given that additional support for the fit of the solution would be evidenced by a 90% confidence interval (CI) of the RMSEA whose upper limit is below the cutoff values of 0.08 - 0.10 (see Brown, 2006), at this point it should be mentioned that the width of the CI for RMSEA is affected by sample size (e.g., when N < 100) and the number of freely estimated parameters. Thus, in such cases the values and the width of the 90% CI for RMSEA should be treated cautiously and with less concern if all other indices are strongly in a range supporting “good” model fit (Bollen, 1990; Brown, 2006).
adults (Models E). Goodness-of-Fit Indexes for the CFA Models E are presented in Table 3.
As can be seen in Table 3, since the Δχ2 among the three models was not statistically significant, they seemed to fit the data equally well. However, according to the suggestions of the Wald test, the Model E2 was not fully confirmed, for the group of old-old adults, because the variance of the factor, consisting of subtests II and IV, was not found to be statistically significant (p = 0.14). Similarly, the Model E3 was not fully confirmed either, for the group of old-old adults, because the Root Mean-Square Error of Approximation index was not found to be acceptable (RMSEA = 0.13) (Brown, 2006).
Therefore, the one-factor Model E1 in which all four measured variables loaded on a single latent variable provided the best fit of the data when compared to Models E2 and E3. For Model E1, the Goodness-of-Fit Indexes were excellent (Brown, 2006). Accord-ing to the suggestions of the Wald test all the parameters’ loadings of Model E1 were statistically significant. For the group of old-old adults, Cronbach’s α coefficient was .75 for a scale consisted of all four measured variables loaded on the single latent variable. The Model E1 is displayed in Figure 3.
The comparison of the CFA Models D1, D2, and D3, on the one hand, with the Model E1, on the other, does not indicate a quite similar pattern of structure in CCT-1 for kindergarten students and old-old adults and does not fully verify Hypothesis 2b.
G. Papantoniou et al.
1363
Figure 2. The two-factor latent structure of the CCT-1 in the subsample of kindergarten students (standardized solution): Model D2. (*All loadings drawn indicate significant associations (p < 0.05). **e = measurement error).
Figure 3. The underlying structure of the single general abstraction-factor in the subsamples of old-old adults and kindergarten students (standardized solution): Models D1 & E1. (*All load-ings drawn indicate significant associations (p < 0.05). **e = measurement error).
G. Papantoniou et al.
1364
To summarize, the aforementioned findings confirm Hypothesis 1 and support the existence of a different factor structure in CCT-1 between first- to second-grade ele-mentary school students and new-old adults, on the one hand, and kindergarten stu-dents and old-old adults, on the other.
4. Discussion
The aim of the present study was the comparison of the higher order thinking abilities, which are related to fluid intelligence, between the developing children and the retro-grading older adults through the investigation of the qualitative changes in the latent structure of the CCT-1, from age to age, using CFA. For the groups of elementary school students and new-old adults, the results of CFA seem to support the existence of two factors measured by the CCT-1, namely a “Conceptual Discrimination” factor, and a “Conceptual Memory” factor. These results are consistent with previous findings (see Allen et al., 2006; Donders, 1999) regarding the factor structure of the CCT-1.
On the contrary, for the groups of kindergarten students and old-old adults, the ex-istence of the aforementioned two-factor structure of the CCT-1 was not fully con-firmed. In specific, for the group of kindergarten students, CFA verified all three testing models: one which was similar to the aforementioned two factors model, a second model in which two measured variables (subtest II and subtest IV) loaded on one underlying factor and the other two variables (subtest III and subtest V), loaded on a second un-derlying factor, as well as a third single-factor model in which all four measured va-riables loaded on a general abstraction factor.
The simultaneous verification of all three a priori competing models, for the group of kindergarten students, is consistent with previous findings (Fajgelj, Bala, & Katic, 2010; Papantoniou et al., 2015), indicating that the factor solutions of the [R] Educational CPM test are stabilized after the age of 5 - 6, and reflects a delay of differentiation in general abstraction and reasoning of kindergarten students. A possible explanation for this delay could be that abstraction is possible to start as a unitary cognitive operation and only later to develop into conceptual discrimination and conceptual memory. Some researchers (Fajgelj et al., 2010) provided another explanation, taking also into account a possible component of complex reasoning, namely the executive functioning. According to them, the delay of stabilization of the CCT-1 factor structure at earlier ages could reflect lack of metacognitive and self-regulative processes—two of the main components of executive functioning—and could be attributed to the inflexible solving strategy, the poor management of goal activity and the weak mechanisms of control (Anderson & Reidy, 2012; Carlson, Davis, & Leach, 2005; Miyake, Friedman, Emerson, Witzki, Howerter, & Wager, 2000).
An additional explanation could be provided taking into account Demetriou, Spa-noudis, Shayer, Mouyi, Kazi, & Platsidou’s (2013) finding that the relations between speed, working memory and fluid intelligence vary with growth. According to Deme-triou et al. (2014: p. 109), “Fluid intelligence evolves along a reconceptualization se-quence (ReConceP) where changes in the nature of representations alternate with
G. Papantoniou et al.
1365
changes in the command and interlinking of representations constructed earlier”. This sequence involves four reconceptualization cycles with transition from symbol-based mental representations (2nd cycle) to inference-based concepts (3rd cycle) at 6 years. Demetriou et al. (2013, 2014) also found that changes in fluid intelligence were pre-dicted by working memory at the second phase (i.e. at 4 - 6 years) of the second cycle (symbol-based mental representations) and by speed at the first phase (i.e. at 6 - 8 years) of the third cycle (inference-based concepts). Since the group of kindergarten students of our study comprised children 5 to 6 years old (mean age = 68.1 months), who were at the age boundary between the second phase of the symbol-based mental representations cycle and the first phase of the inference-based concepts cycle, and given that according to Demetriou et al. (2014), the age boundary are approximate, the simultaneous verification of all three a priori competing models could reflect the young participants’ individual differences, either in working memory, or in speed of pro- cessing. More specifically, the verification of the two-factors measured by the CCT-1, namely a “Conceptual Discrimination” factor, and a “Conceptual Memory” factor could reflect the early start of speed to operate as the predictive construct of fluid intel-ligence, while the confirmation of the single-factor model in which all four measured variables loaded on a general abstraction factor could reflect the still developing work-ing memory as the predictive construct of fluid intelligence.
Regarding the group of old-old adults, the results of CFA support the existence of a single general abstraction factor measured by the CCT-1, although previous findings (Allen et al., 2006; Donders, 1999; Moore et al., 2004), in both normal and clinical pop-ulation, support viewing the CCT-1 as a multidimensional measure, rather than one more general abstraction construct.
The start of uniformity of conceptual discrimination (problem solving and reason-ing) and conceptual memory (learning and memory) reflecting in the unidimensional structure of the CCT-1 test that was observed for the group of old-old adults, is possible to indicate a qualitative change, perhaps a start of disorganization in the abstraction and reasoning of the old-old adults comparing to those of the new-old adults (Ander-son & Reidy, 2012; Carlson et al., 2005; Miyake et al., 2000; Salthouse, 2005; Savvidou, Papantoniou, Moraitou, Dinou, Katsadima, Foutsitzi, & Tsentidou, 2016; Zelazo & Carlson, 2012). This finding is consistent with the general admission in the field of cognitive aging, stating that cognitive functioning declines with aging and fluid intelli-gence—which is highly related to general reasoning—is among the cognitive abilities that seem to be more affected by age (Baltes, 1997; Moraitou & Efklides, 2012; Salthouse et al., 2008). Taking into account, that the comparison of the CFA models, which were confirmed in the present study, for kindergarten students and old-old adults, indicate a similar pattern in the structure of the CCT-1 as regards the existence of a single general abstraction factor measured by it, on the one hand, and that working memory seems to act as the predictive construct of kindergarten students’ fluid intelligence (Demetriou et al., 2013, 2014), on the other, the uniformity of conceptual discrimination and concep-tual memory, that was found for the old-old adults, could be attributed to a deficit in

G. Papantoniou et al.
1366
their working memory. It should be also noted that the disorganization of these higher order thinking abilities, which are related to fluid intelligence, was found to be present before the appearance of clinically detectable dementia in the participants in the sample of old-old adults. This result seems to be in line with findings indicating that a large proportion of healthy old-old adults shows memory decline which may represent the early stages of a potentially more severe cognitive impairment (Goldman et al., 2001; Shoji et al., 2002; Schmitt et al., 2000).
In general terms, the different pattern in the latent factor structure of the CCT-1, that was found in the present study, between the groups of kindergarten students and old-old adults, on the one hand, and the groups of first- to second-grade elementary school students and new-old adults, on the other, supports the hypothesis of “retroge-nesis”. However, our research findings must be interpreted with a few limitations in mind. The restricted nature of the sample should be noted with regard to the number of participants in each age group as well as to the comparative uniformity of 1) the educa-tional status in the groups of the older adults and 2) the socioeconomic status in the groups of students. More research is also needed to further validate and refine, in other cultural contexts, the different pattern in the structure of the higher order thinking ab-ilities, as they are measured by the CCT-1, that was found among the various groups of the present study.
5. Conclusion
Nevertheless, the results of our study conducted in a Greek population, with the size of the sample used, support the usefulness of the CCT-1 as a sensitive neuropsychological test for the detection, in old-old adults, of the differentiation and/or the decline of gen-eral abstraction and reasoning acquired during childhood.
References Allen, D. N., Caron, J. E., & Goldstein, G. (2006). Process Index Scores for the Halstead Category
Test. In A. Poreh (Ed.), The Quantified Process Approach to Neuropsychological Assessment (pp. 259-279). Lisse, The Netherlands: Swets & Zeitlinger.
Allen, D. N., Knatz, D. T., & Mayfield. J. (2006). Validity of the Children’s Category Test-Level 1 in a Clinical Sample with Heterogeneous Forms of Brain Dysfunction. Archives of Clinical Neuropsychology, 21, 711-720. http://dx.doi.org/10.1016/j.acn.2006.08.003
Anderson, P. J., & Reidy, N. (2012). Assessing Executive Function in Preschoolers. Neuropsy-chology Review, 22, 345-360. http://dx.doi.org/10.1007/s11065-012-9220-3
Baltes, P. B. (1997). On the Incomplete Architecture of Human Ontogeny. American Psycholo-gist, 52, 366-380. http://dx.doi.org/10.1037/0003-066X.52.4.366
Baltes, P. B., & Lindenberger, U. (1997). Emergence of a Powerful Connection between Sensory and Cognitive Functions across the Adult Life Span: A New Window at the Study of Cognitive Aging? Psychology and Aging, 12, 12-21. http://dx.doi.org/10.1037/0882-7974.12.1.12
Bentler, P. M. (2005). EQS 6.1. Encino, CA: Multivariate Software, Inc.
Boll, T. (1993). Children’s Category Test. San Antonio, TX: Psychological Corporation.
Bollen, K. A. (1990). Overall Fit in Covariance Structure Models: Two Types of Sample Size Ef-

G. Papantoniou et al.
1367
fects. Psychological Bulletin, 107, 256. http://dx.doi.org/10.1037/0033-2909.107.2.256
Borza, L. R. (2012). The Concept of Retrogenesis: New Ways of Understanding Alzheimer’s Dis-ease. Ph.D. Thesis, New York: New York University.
Brown, T. A. (2006). Confirmatory Factor Analysis for Applied Research. New York: Guilford.
Carlson, S. M., Davis, A., & Leach, J. G. (2005). Less Is More: Executive Function and Symbolic Representation in Preschool Children. Psychological Science, 16, 609-616. http://dx.doi.org/10.1111/j.1467-9280.2005.01583.x
Da Silva, R., Bueno, O., & Bertolucci, P. (2011). The Retrogenesis Theory to Classify Stages of Alzheimer’s Disease in a Sample of the Brazilian Population. Alzheimer’s & Dementia: The Journal of the Alzheimer’s Association, 7, 241-242. http://dx.doi.org/10.1016/j.jalz.2011.05.685
de Ajuriaguerra, J., & Tissot, R. (1968). Some Aspects of Psychoneurologic Disintegration in Se-nile Dementia. In C. H. Mueller & L. Ciompi (Eds.), Senile Dementia (pp. 69-79). Switzerland: Huber.
Demetriou, A., Spanoudis, G., Shayer, M., Mouyi, A., Kazi, S., & Platsidou, M. (2013). Cycles in Speed-Working Memory-G Relations: Towards a Developmental-Differential Theory of Mind. Intelligence, 41, 34-50. http://dx.doi.org/10.1016/j.intell.2012.10.010
Demetriou, A., Spanoudis, G., Shayer, M., van der Ven, S., Brydges, C. R., Kroesbergen, E., Pod-jarny, G., & Swanson, H. L. (2014). Relations between Speed, Working Memory, and Intelli-gence from Preschool to Adulthood: Structural Equation Modeling of 14 Studies. Intelligence, 46, 107-121. http://dx.doi.org/10.1016/j.intell.2014.05.013
Donders, J. (1999). Latent Structure of the Children’s Category Test at Two Age Levels in the Standardization Sample. Journal of Clinical and Experimental Neuropsychology, 21, 279-282.
Fajgelj, S., Bala, G., & Katic, R. (2010). Latent Structure of Raven’s Colored Progressive Matrices. Collegium Antropologicum, 34, 1015-1026.
Goldman, W. P., Price, J. L., Storandt, M., Grant, E. A., McKeel Jr., D. W., Rubin, E. H., & Mor-ris, J. C. (2001). Absence of Cognitive Impairment or Decline in Preclinical Alzheimer’s Dis-ease. Neurology, 56, 361-367. http://dx.doi.org/10.1212/WNL.56.3.361
Halstead, W. C. (1947). Brain and Intelligence: A Quantitative Study of the Frontal Lobes. Chi-cago, IL: University of Chicago Press.
Horn, J. L., & Hofer, S. M. (1992). Major Abilities and Development in the Adult Period. In R. J. Sternberg, & C. A. Berg (Eds.), Intellectual Development (pp. 44-99). New York: Cambridge University Press.
Miyake, A., Friedman, N. P., Emerson, M. J., Witzki, A. H., Howerter, A., & Wager, T. D. (2000). The Unity and Diversity of Executive Functions and Their Contributions to Complex “Frontal Lobe” Tasks: A Latent Variable Analysis. Cognitive Psychology, 41, 49-100. http://dx.doi.org/10.1006/cogp.1999.0734
Moore, B. A., Donders, J., & Thompson. E. H. (2004). Validity of the Children’s Category Test- Level 1 after Pediatric Traumatic Brain Injury. Archives of Clinical Neuropsychology, 19, 1-9. http://dx.doi.org/10.1093/arclin/19.1.1
Moraitou, D., & Efklides, A. (2012). The Wise Thinking and Acting Questionnaire: The Cogni-tive Facet of Wisdom and Its Relation with Memory, Affect, and Hope. Journal of Happiness Studies, 13, 849-873. http://dx.doi.org/10.1007/s10902-011-9295-1
Papantoniou, G., Moraitou, D., Dinou, M., Katsadima, E., Savvidou, E., Foutsitzi, E., & Masoura, E. (2015). Comparing the Latent Structure of Raven’s Educational Coloured Progressive Ma-trices among Young Children and Older Adults: A Preliminary Study. Hellenic Journal of Nuclear Medicine, 18, 122-130.
G. Papantoniou et al.
1368
Reinsberg, B., Franssen, E. H., Hasan, S. M., Monteiro, I., Boksay, I., Souren, L. E. M., Kenowsky, S., Auer, S. R., Elahi, S., & Kluger, A. (1999a). Retrogenesis: Clinical, Physiologic, and Patho-logic Mechanisms in Brain Aging, Alzheimer’s and Other Dementing Processes. European Archives of Psychiatry and Clinical Neuroscience, 249, S28-S36. http://dx.doi.org/10.1007/PL00014170
Reinsberg, B., Franssen, E. H., Souren, L. E. M., Auer, S. R., Akram, Ι., & Kenowsky, S. (2002). Evidence and Mechanisms of Retrogenesis in Alzheimer’s and Other Dementias: Management and Treatment Import. American Journal of Alzheimer’s Disease & Other Dementias, 17, 202- 212. http://dx.doi.org/10.1177/153331750201700411
Reinsberg, B., Kenowsky, S., Franssen, E. H., Auer, S. R., & Souren, L. E. M. (1999b). Towards a Science of Alzheimer’s Disease Management: A Model Based upon Current Knowledge of Re-trogenesis. International Psychogeriatrics, 11, 7-23. http://dx.doi.org/10.1017/S1041610299005554
Rubial-Álvarez, S., de Sola, S., Machado, M. C., Sintas, E., Böhm, P., Sánchez-Benavides, G., Langohr, K., Muñiz, R., & Peña-Casanova, J. (2013). The Comparison of Cognitive and Func-tional Performance in Children and Alzheimer’s Disease Supports the Retrogenesis Model. Journal of Alzheimer’s Disease, 33, 191-203.
Rubial-Alvarez, S., Machado, M.-C., Sintas, E., de Sola, S., Böhm, P., & Peña-Casanova, J. (2007). A Preliminary Study of the Mini-Mental State Examination in a Spanish Child Population. Journal of Child Neurology, 22, 1269-1273. http://dx.doi.org/10.1177/0883073807307098
Salthouse, T. A. (2005). Relations between Cognitive Abilities and Measures of Executive Func-tioning. Neuropsychology, 19, 532-545. http://dx.doi.org/10.1037/0894-4105.19.4.532
Salthouse, T. A., Pink, J. E., & Tucher-Drob, E. M. (2008). Contextual Analysis of Fluid Intelli-gence. Intelligence, 36, 464-486. http://dx.doi.org/10.1016/j.intell.2007.10.003
Savvidou, E., Papantoniou, G., Moraitou, D., Dinou, M., Katsadima, E., Foutsitzi, E., & Tsentidou, G. (2016). Comparing the Latent Structure of the Mini-Mental State Examination among Young Children and Older Adults: A Preliminary Study. Frontiers in Human Neuroscience. Conference Abstract: SAN2016 Meeting. http://dx.doi.org/10.3389/conf.fnhum.2016.220.00077
Schmitt, F. A., Davis, D. G., Wekstein, D. R., Smith, C. D., Ashford, J. W., & Markesbery, W. R. (2000). “Preclinical” AD Revisited: Neuropathology of Cognitive Normal Older Adults. Neu-rology, 55, 370-376. http://dx.doi.org/10.1212/WNL.55.3.370
Shoji, M., Fukushima, K., Wakayana, M., Shizuka-Ikeda, M., Ikeda, Y., Kawakami, A., Sakazume, Y., Ikeda, M., Harigaya, Y., Matsubara, E., Kawarabayashi, T., Murakami, T., Nagano, I., Ma-nabe, Y., & Abe, K. (2002). Intellectual Faculties in Patients with Alzheimer’s Disease Regress to the Level of a 4 - 5-Year-Old Child. Geriatrics & Gerontology International, 2, 143-147. http://dx.doi.org/10.1046/j.1444-1586.2002.00040.x
Woodward, H., & Donders, J. (1998). The Performance of Children with Traumatic Head Injury on the Wide Range Assessment of Memory and Learning-Screening. Applied Neuropsycholo-gy, 5, 113-119. http://dx.doi.org/10.1207/s15324826an0503_1
Zelazo, P. D., & Carlson, S. M. (2012). Hot and Cool Executive Function in Childhood and Ado-lescence: Development and Plasticity. Child Development Perspectives, 6, 354-360. http://dx.doi.org/10.1111/j.1750-8606.2012.00246.x

Submit or recommend next manuscript to SCIRP and we will provide best service for you:
Accepting pre-submission inquiries through Email, Facebook, LinkedIn, Twitter, etc. A wide selection of journals (inclusive of 9 subjects, more than 200 journals) Providing 24-hour high-quality service User-friendly online submission system Fair and swift peer-review system Efficient typesetting and proofreading procedure Display of the result of downloads and visits, as well as the number of cited articles Maximum dissemination of your research work
Submit your manuscript at: http://papersubmission.scirp.org/ Or contact [email protected]