Embed Size (px)
Citation preview
COMPARING THREE OR MORE
MEANSPrepared by:
Miss MJ B. Eduria
OUTLINEI. Compare Three or More Means
1. ANOVA
a. One Factor Anova
b. Two Factor Anova
2. ANCOVA
a. Concept of Covariate
b. Selecting Covariates
c. One Factor Ancova
d. Two Factor Ancova
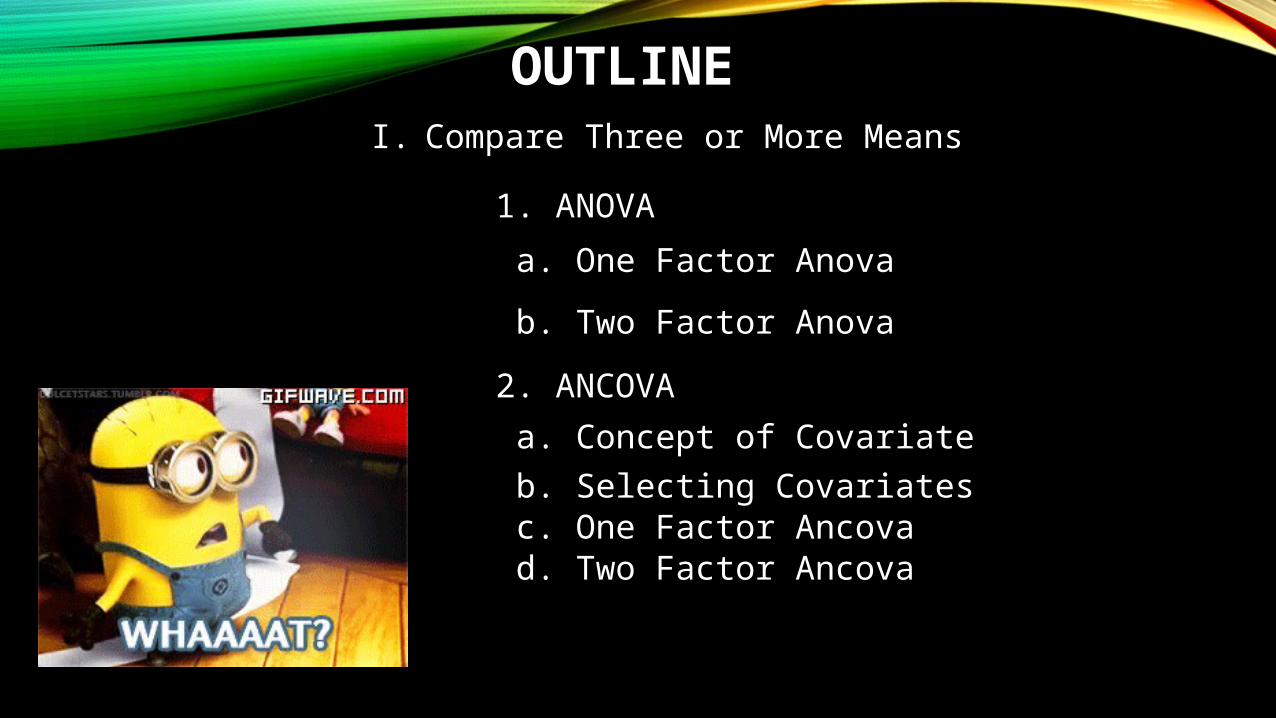
• The analysis of variance, popularly known as the ANOVA, can be used in cases where there are more than two groups.
• A procedure of comparing more than two groups - independent variable: smoking status non smoking, onepack a day, two pack a day
- dependent variable: number of coughs per day
K = number of conditions (in this case, 3)
ANOVA (Analysis of Variance)
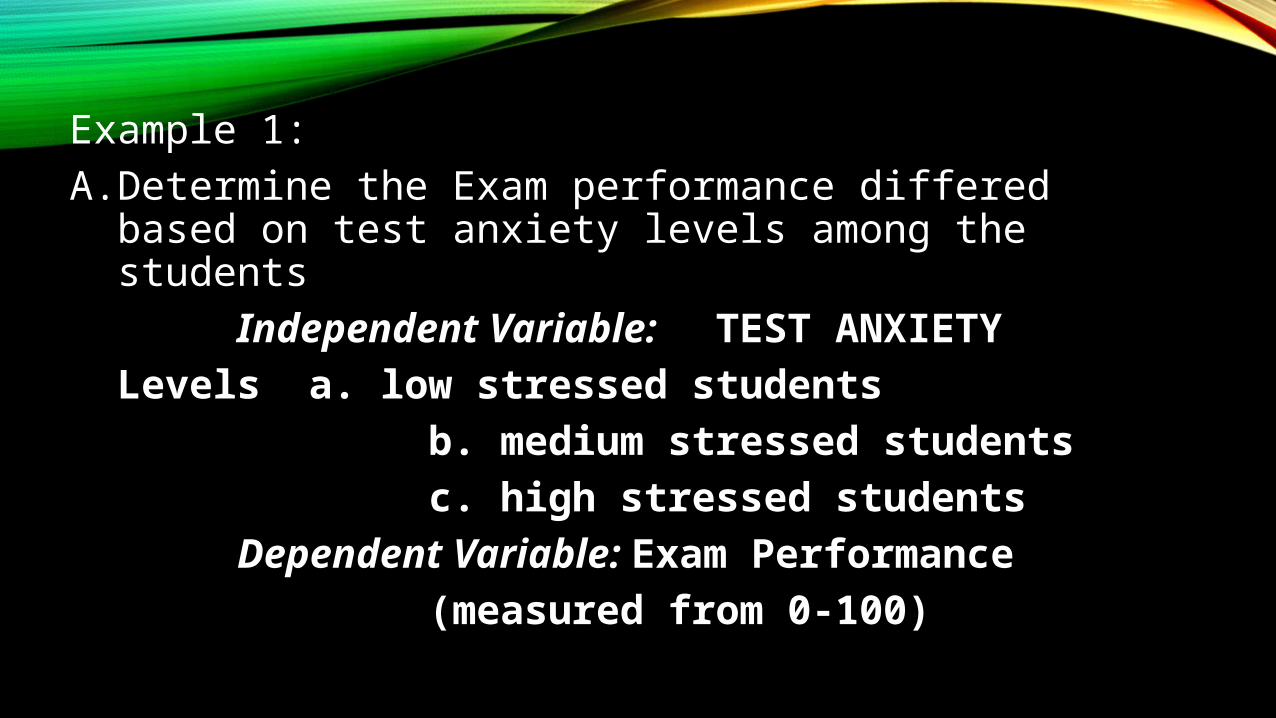
Example 1: A. Determine the Exam performance differed based on
test anxiety levels among the students Independent Variable: TEST ANXIETY Levels a. low stressed students b. medium stressed students c. high stressed students Dependent Variable: Exam Performance (measured from 0-100)

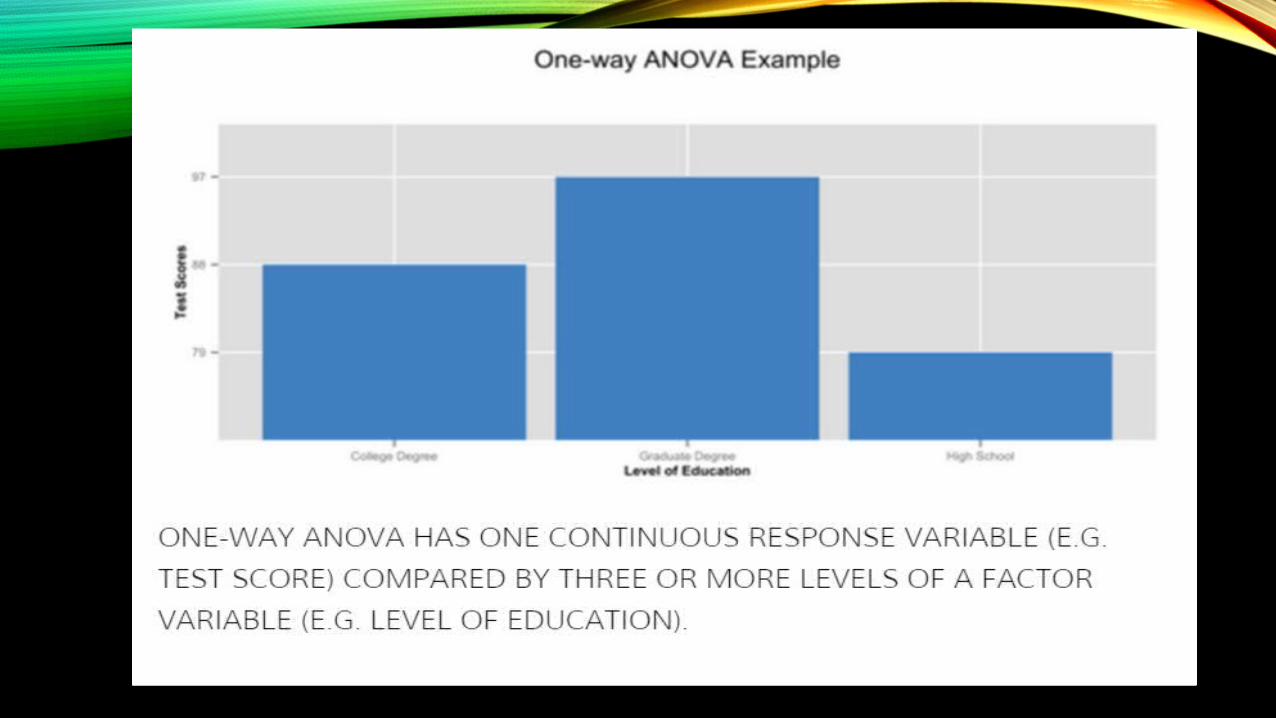
ONE WAY ANOVA•The ONE-WAY ANOVA is used to determine whether there are any significant differences between the means of three or more independent (unrelated) groups.
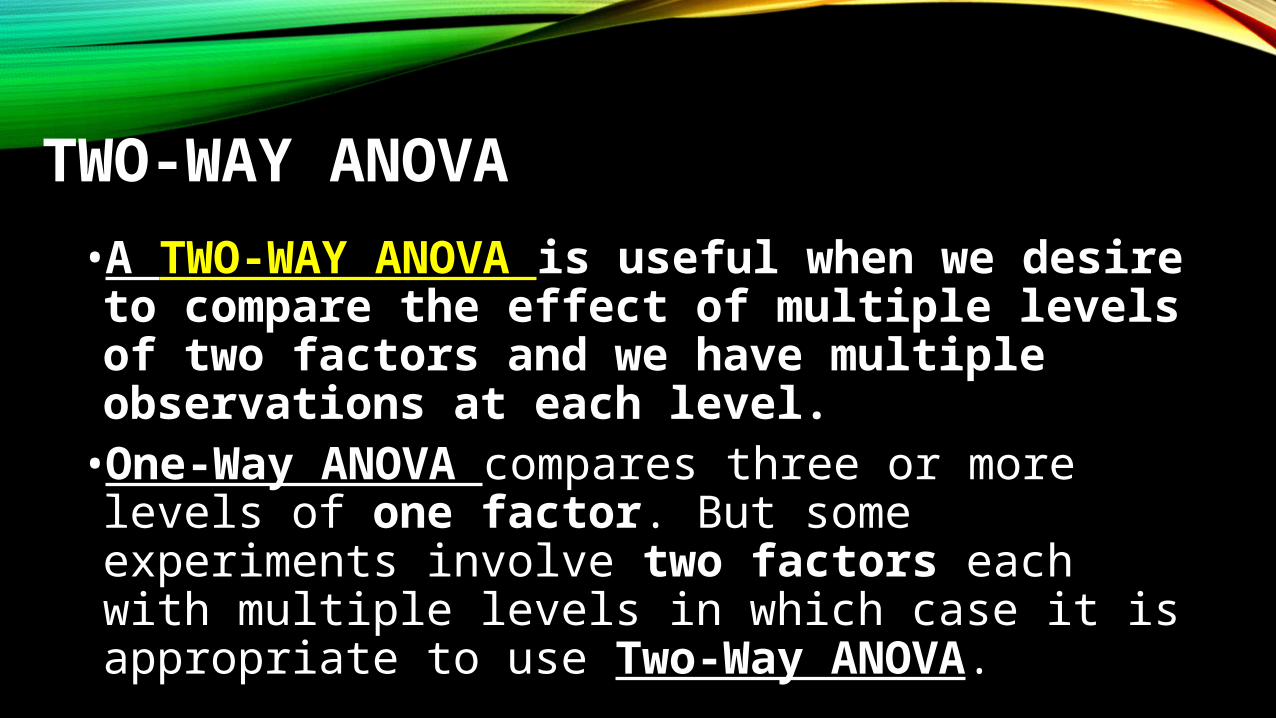
TWO-WAY ANOVA
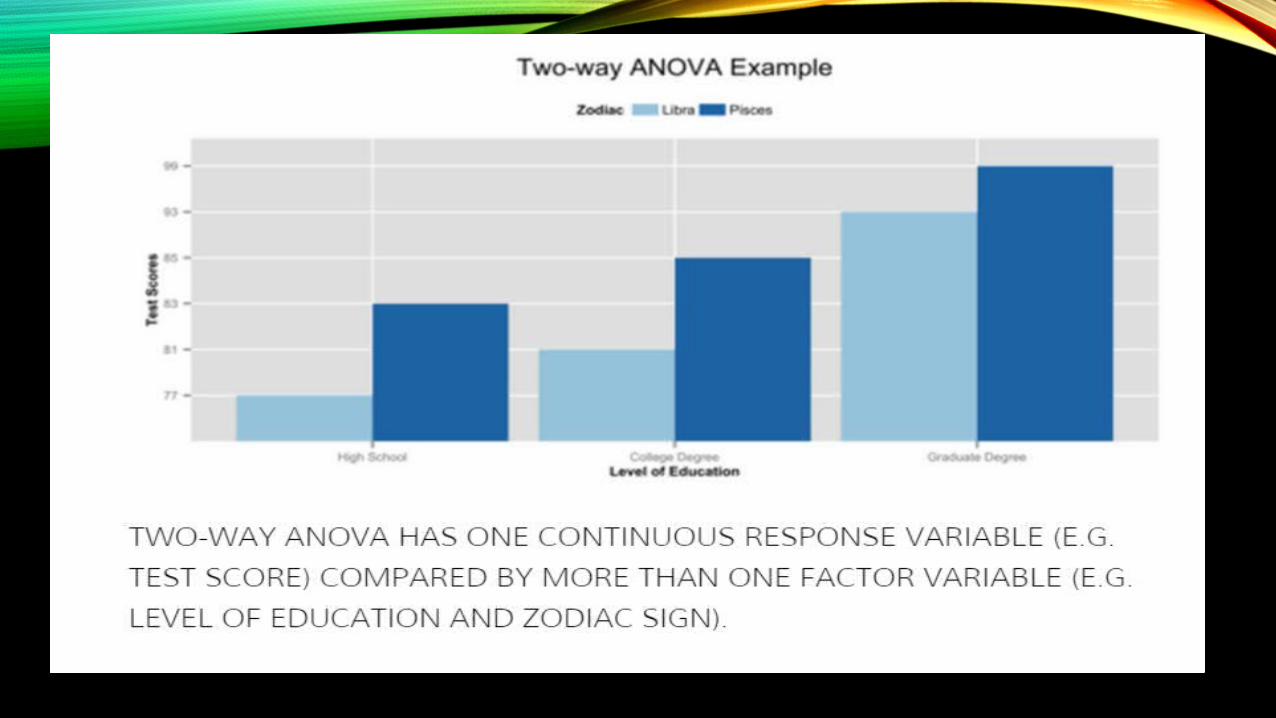
•A TWO-WAY ANOVA is useful when we desire to compare the effect of multiple levels of two factors and we have multiple observations at each level.•One-Way ANOVA compares three or more levels of one factor. But some experiments involve two factors each with multiple levels in which case it is appropriate to use Two-Way ANOVA.
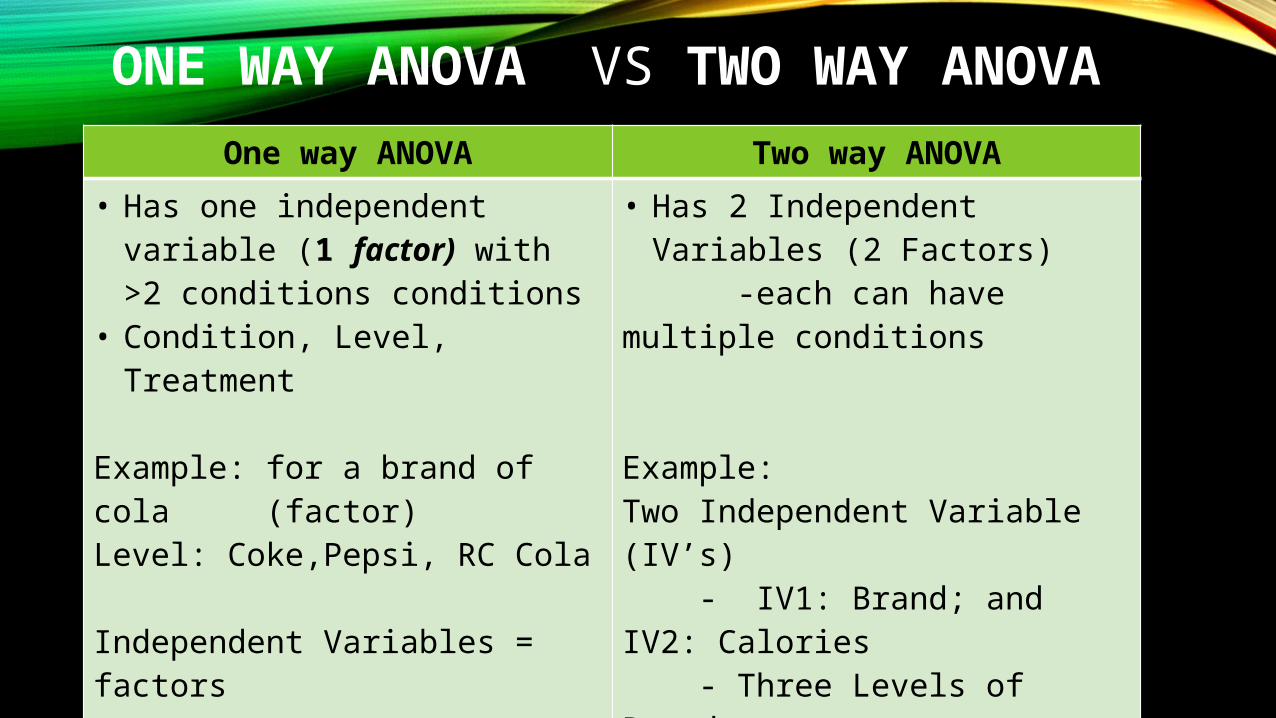
ONE WAY ANOVA VS TWO WAY ANOVA
One way ANOVA Two way ANOVA
• Has one independent variable (1 factor) with >2 conditions conditions
• Condition, Level, Treatment
Example: for a brand of cola (factor)Level: Coke,Pepsi, RC Cola
Independent Variables = factors
• Has 2 Independent Variables (2 Factors)
-each can have multiple conditions
Example: Two Independent Variable (IV’s) - IV1: Brand; and IV2: Calories - Three Levels of Brand: Coke, Pepsi, RC Cola - Two Levels of Calories: Regular, Diet

ANALYSIS OF
COVARIANCE
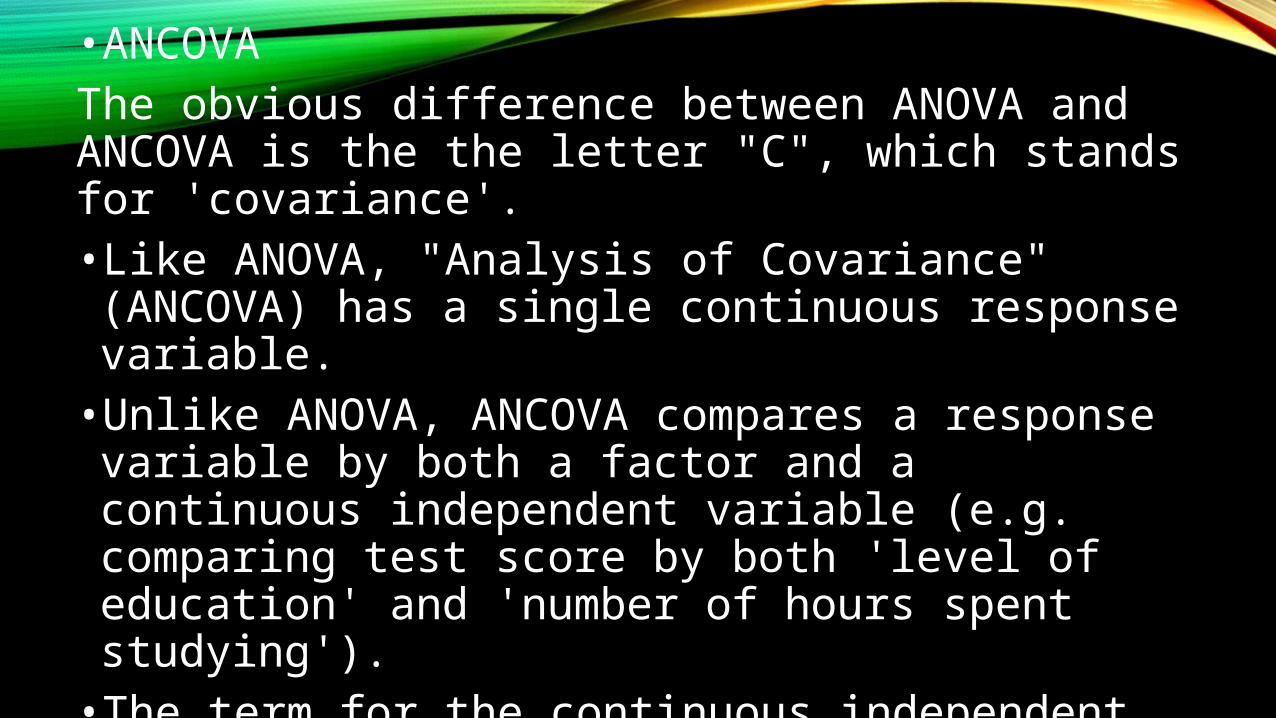
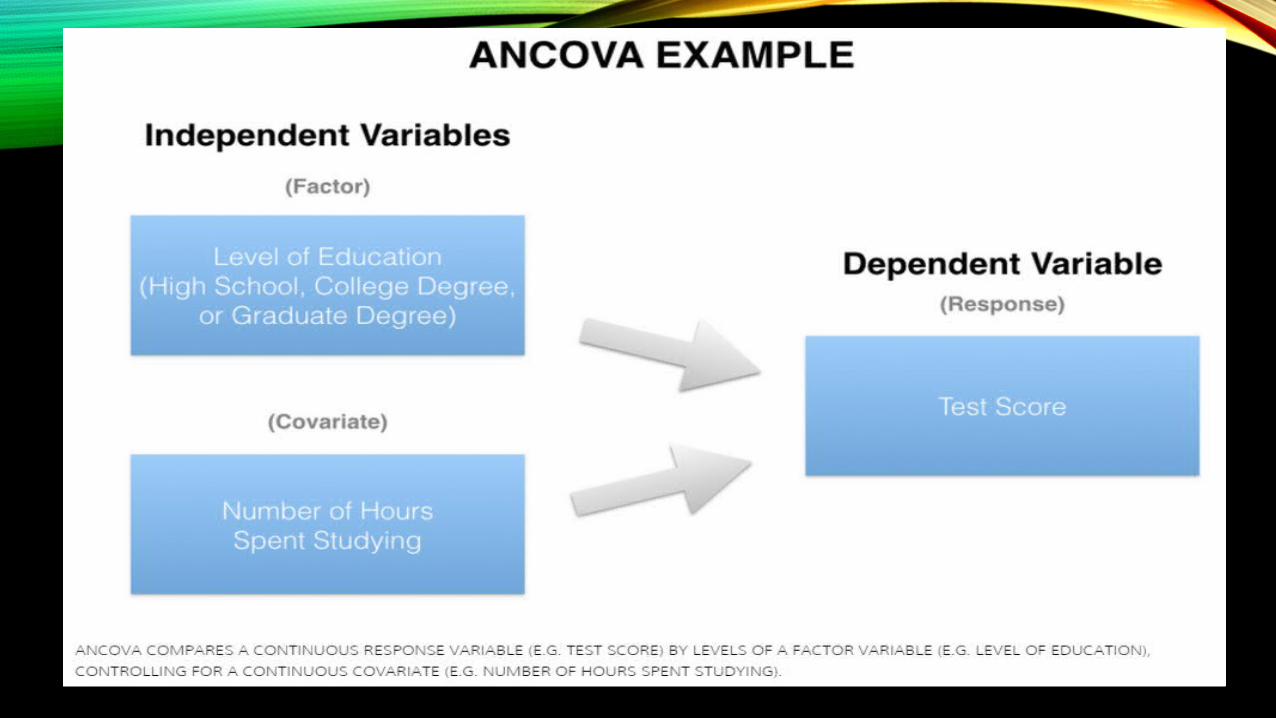
•ANCOVAThe obvious difference between ANOVA and ANCOVA is the the letter "C", which stands for 'covariance'. • Like ANOVA, "Analysis of Covariance" (ANCOVA) has a single continuous response variable. •Unlike ANOVA, ANCOVA compares a response variable by both a factor and a continuous independent variable (e.g. comparing test score by both 'level of education' and 'number of hours spent studying'). • The term for the continuous independent variable (IV) used in ANCOVA is "covariate".
WHEN TO USE ANCOVA?
• ANCOVA is used in experimental studies when researchers want to remove the effects of some antecedent variable. For example, pretest scores are used as covariates in pretest posttest experimental designs. • ANCOVA is also used in non-experimental research, such as surveys or nonrandom samples, or in quasi-experiments when subjects cannot be assigned randomly to control and experimental groups. Although fairly common, the use of ANCOVA for non-experimental research is controversial (Vogt, 1999)
EXAMPLE
• A One-way ANCOVA was conducted to determine a statistically significant difference between [name levels of the independent variables] on (dependent variable) controlling for [name the covariate].
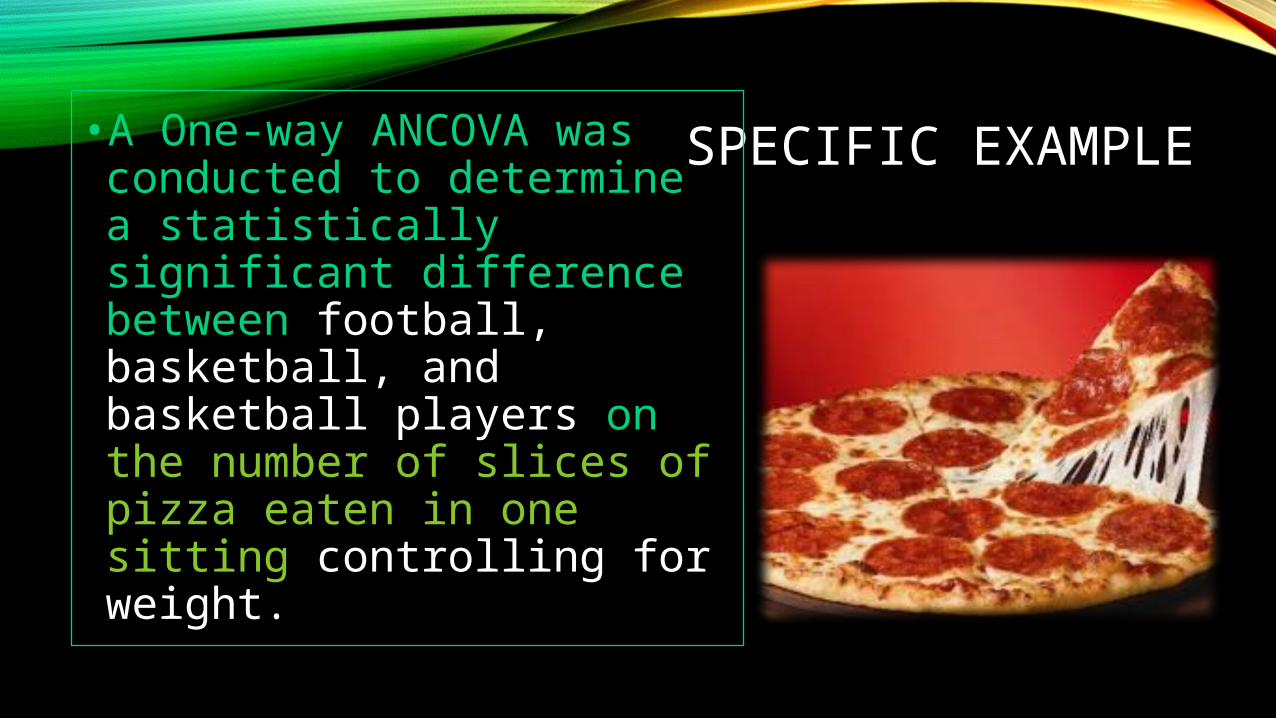
SPECIFIC EXAMPLE•A One-way ANCOVA was conducted to determine a statistically significant difference between football, basketball, and basketball players on the number of slices of pizza eaten in one sitting controlling for weight.
Here is the problem again:
A pizza café owner wants to know which type of high school athlete she should market to, by
comparing how many ounces of pizza are consumed across all three athlete groups.
She will control for pizza preference.
The Problem: A pizza café owner wants to know which type of high school athlete she should market to, by comparing how many ounces of pizza are consumed across all three athlete groups. She will control for pizza preference.
Is This:
Inferential Descriptiveor
Based on the data set of 36 athletes, this is a sample from which the owner would like to make generalizations about potential athlete customers.
The Problem: A pizza café owner wants to know which type of high school athlete she should market to, by comparing how many ounces of pizza are consumed across all three athlete groups. She will control for pizza preference.
Is This: Inferent
ialDescript
iveor
Based on the data set of 36 athletes, this is a sample from which the owner would like to make generalizations about potential athlete customers.
The Problem: A pizza café owner wants to know which type of high school athlete she should market to, by comparing how many ounces of pizza are consumed across all three athlete groups. She will control for pizza preference.
Is This Question of:
Relationship Differenceor
The Problem: A pizza café owner wants to know which type of high school athlete she should market to, by comparing how many ounces of pizza are consumed across all three athlete groups. She will control for pizza preference.
Is This Question of:
Relationship Differenceor
Because the owner wants to compare groups differences, we are dealing with DIFFERENCE.
The Problem: A pizza café owner wants to know which type of high school athlete she should market to, by comparing how many ounces of pizza are consumed across all three athlete groups. She will control for pizza preference.
Is This Question of: Relations
hipDifferen
ceor
Because the owner wants to compare groups differences, we are dealing with DIFFERENCE.
The Problem: A pizza café owner wants to know which type of high school athlete she should market to, by comparing how many ounces of pizza are consumed across all three athlete groups. She will control for pizza preference.
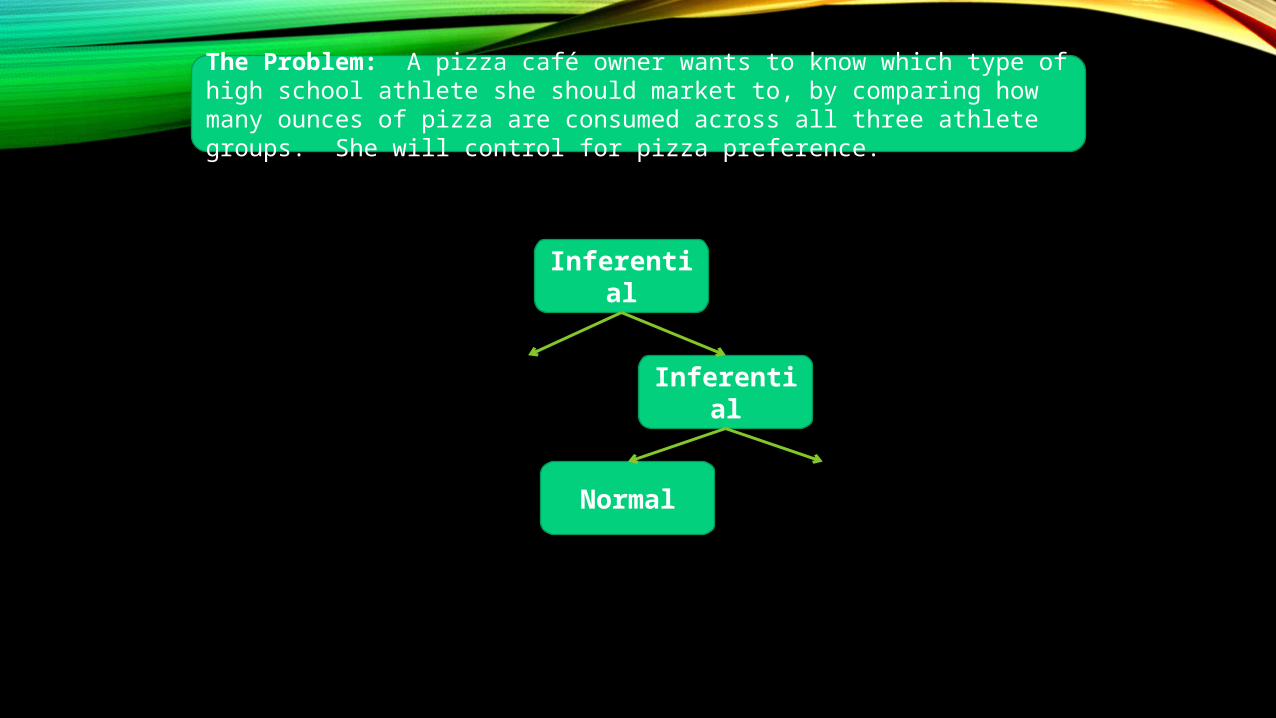
Inferential Descriptive
InferentialDescriptive
The Problem: A pizza café owner wants to know which type of high school athlete she should market to, by comparing how many ounces of pizza are consumed across all three athlete groups. She will control for pizza preference.
Is The Distribution:
NormalNot
Normalor
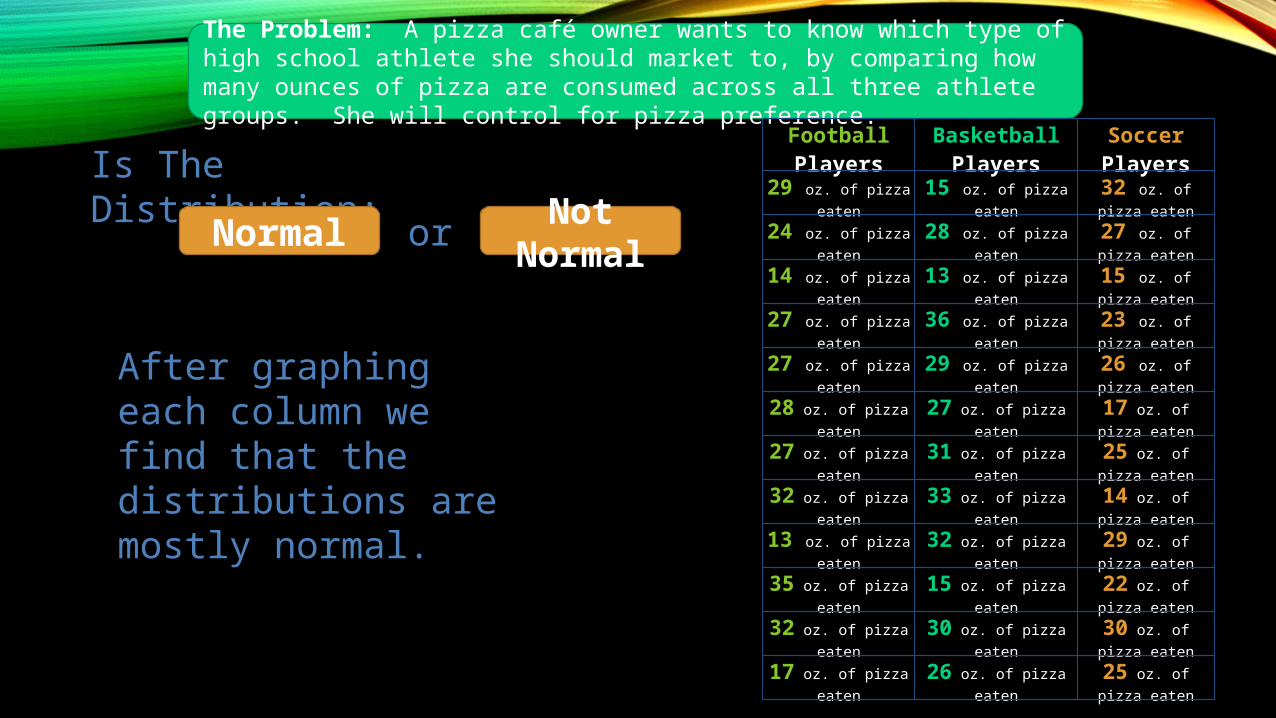
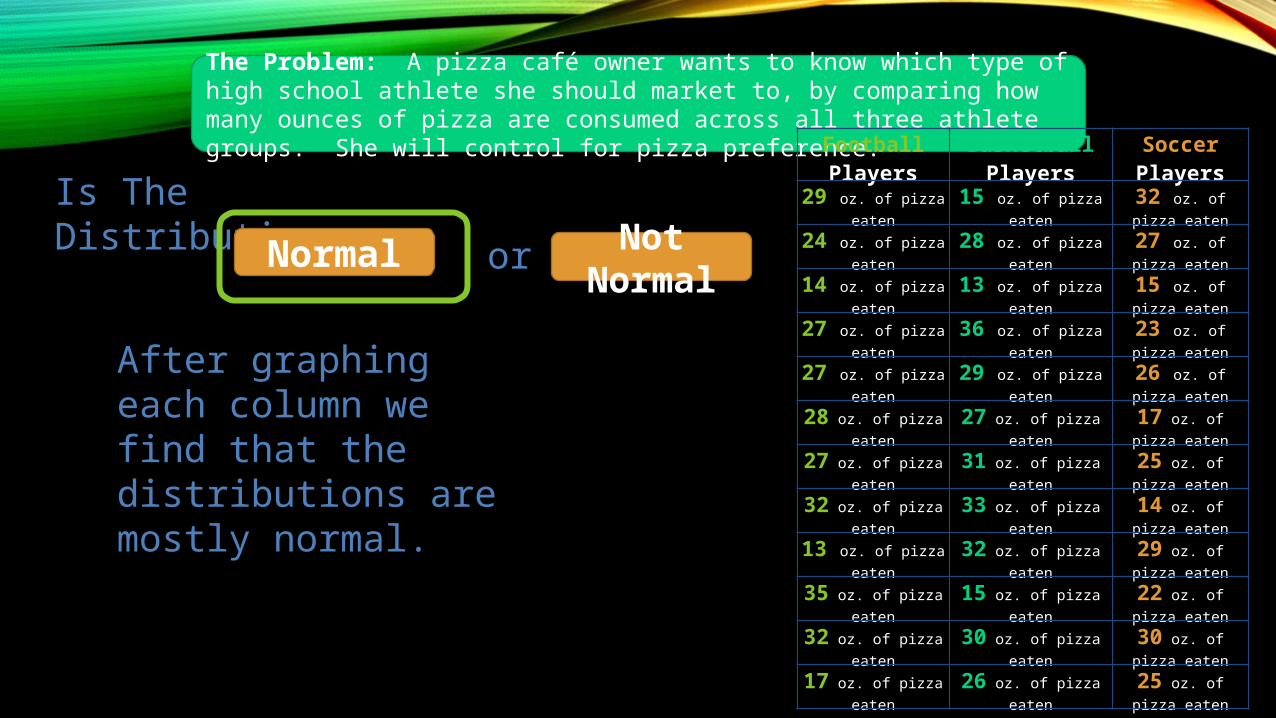
The Problem: A pizza café owner wants to know which type of high school athlete she should market to, by comparing how many ounces of pizza are consumed across all three athlete groups. She will control for pizza preference.
Is The Distribution:
NormalNot
Normalor
After graphing each column we find that the distributions are mostly normal.
Football Players
Basketball Players
Soccer Players
29 oz. of pizza eaten
15 oz. of pizza eaten
32 oz. of pizza eaten
24 oz. of pizza eaten
28 oz. of pizza eaten
27 oz. of pizza eaten
14 oz. of pizza eaten
13 oz. of pizza eaten
15 oz. of pizza eaten
27 oz. of pizza eaten
36 oz. of pizza eaten
23 oz. of pizza eaten
27 oz. of pizza eaten
29 oz. of pizza eaten
26 oz. of pizza eaten
28 oz. of pizza eaten
27 oz. of pizza eaten
17 oz. of pizza eaten
27 oz. of pizza eaten
31 oz. of pizza eaten
25 oz. of pizza eaten
32 oz. of pizza eaten
33 oz. of pizza eaten
14 oz. of pizza eaten
13 oz. of pizza eaten
32 oz. of pizza eaten
29 oz. of pizza eaten
35 oz. of pizza eaten
15 oz. of pizza eaten
22 oz. of pizza eaten
32 oz. of pizza eaten
30 oz. of pizza eaten
30 oz. of pizza eaten
17 oz. of pizza eaten
26 oz. of pizza eaten
25 oz. of pizza eaten
The Problem: A pizza café owner wants to know which type of high school athlete she should market to, by comparing how many ounces of pizza are consumed across all three athlete groups. She will control for pizza preference.
Is The Distribution:
Normal Not Normal
or
After graphing each column we find that the distributions are mostly normal.
Football Players
Basketball Players
Soccer Players
29 oz. of pizza eaten
15 oz. of pizza eaten
32 oz. of pizza eaten
24 oz. of pizza eaten
28 oz. of pizza eaten
27 oz. of pizza eaten
14 oz. of pizza eaten
13 oz. of pizza eaten
15 oz. of pizza eaten
27 oz. of pizza eaten
36 oz. of pizza eaten
23 oz. of pizza eaten
27 oz. of pizza eaten
29 oz. of pizza eaten
26 oz. of pizza eaten
28 oz. of pizza eaten
27 oz. of pizza eaten
17 oz. of pizza eaten
27 oz. of pizza eaten
31 oz. of pizza eaten
25 oz. of pizza eaten
32 oz. of pizza eaten
33 oz. of pizza eaten
14 oz. of pizza eaten
13 oz. of pizza eaten
32 oz. of pizza eaten
29 oz. of pizza eaten
35 oz. of pizza eaten
15 oz. of pizza eaten
22 oz. of pizza eaten
32 oz. of pizza eaten
30 oz. of pizza eaten
30 oz. of pizza eaten
17 oz. of pizza eaten
26 oz. of pizza eaten
25 oz. of pizza eaten
The Problem: A pizza café owner wants to know which type of high school athlete she should market to, by comparing how many ounces of pizza are consumed across all three athlete groups. She will control for pizza preference.
Inferential
Descriptive
Inferential
Descriptive
NormalNot
Normal
The Problem: A pizza café owner wants to know which type of high school athlete she should market to, by comparing how many ounces of pizza are consumed across all three athlete groups. She will control for pizza preference.
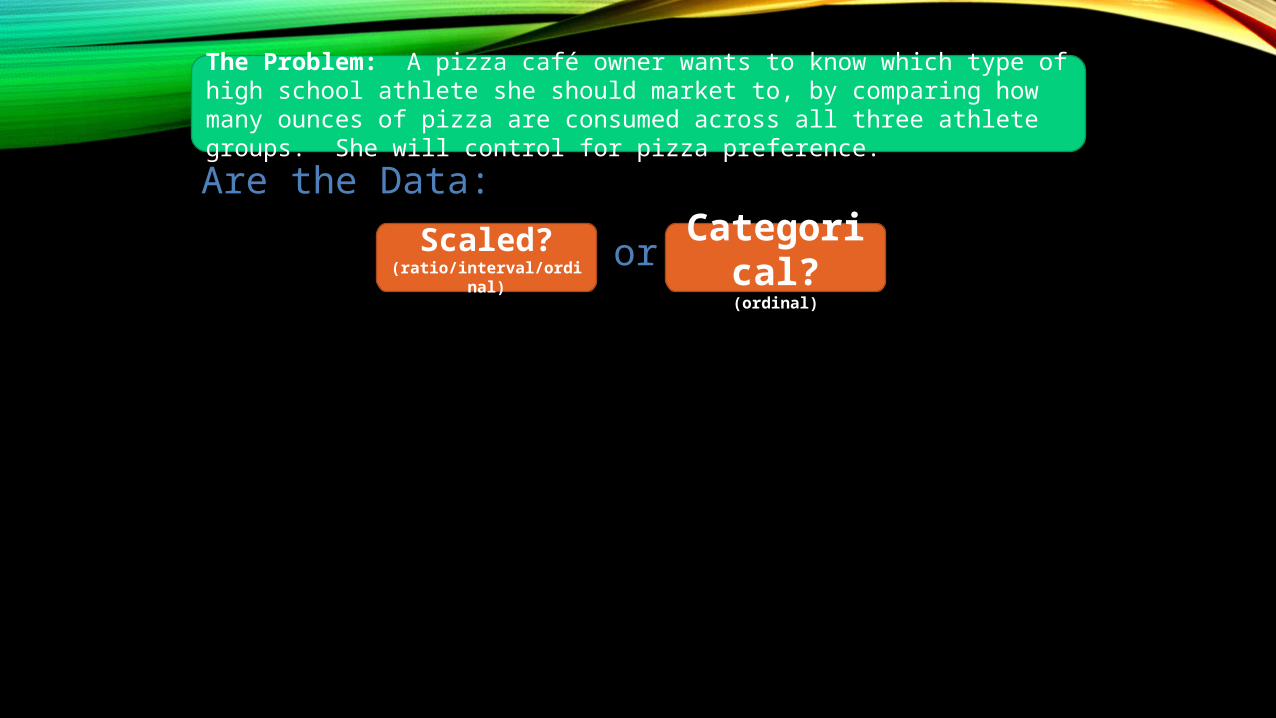
Are the Data:
Scaled? (ratio/interval/ordinal
)
Categorical?(ordinal)
or
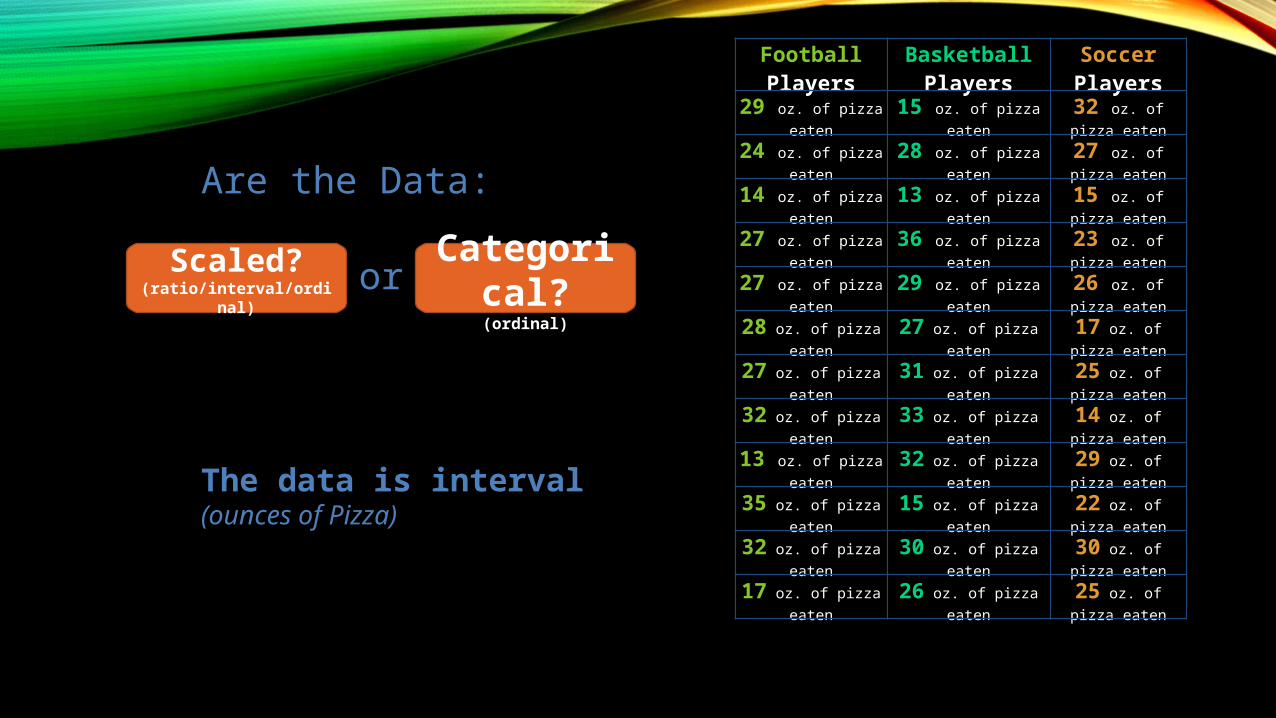
Are the Data:
Scaled? (ratio/interval/ordinal
)
Categorical?(ordinal)
or
The data is interval (ounces of Pizza)
Football Players
Basketball Players
Soccer Players
29 oz. of pizza eaten
15 oz. of pizza eaten
32 oz. of pizza eaten
24 oz. of pizza eaten
28 oz. of pizza eaten
27 oz. of pizza eaten
14 oz. of pizza eaten
13 oz. of pizza eaten
15 oz. of pizza eaten
27 oz. of pizza eaten
36 oz. of pizza eaten
23 oz. of pizza eaten
27 oz. of pizza eaten
29 oz. of pizza eaten
26 oz. of pizza eaten
28 oz. of pizza eaten
27 oz. of pizza eaten
17 oz. of pizza eaten
27 oz. of pizza eaten
31 oz. of pizza eaten
25 oz. of pizza eaten
32 oz. of pizza eaten
33 oz. of pizza eaten
14 oz. of pizza eaten
13 oz. of pizza eaten
32 oz. of pizza eaten
29 oz. of pizza eaten
35 oz. of pizza eaten
15 oz. of pizza eaten
22 oz. of pizza eaten
32 oz. of pizza eaten
30 oz. of pizza eaten
30 oz. of pizza eaten
17 oz. of pizza eaten
26 oz. of pizza eaten
25 oz. of pizza eaten
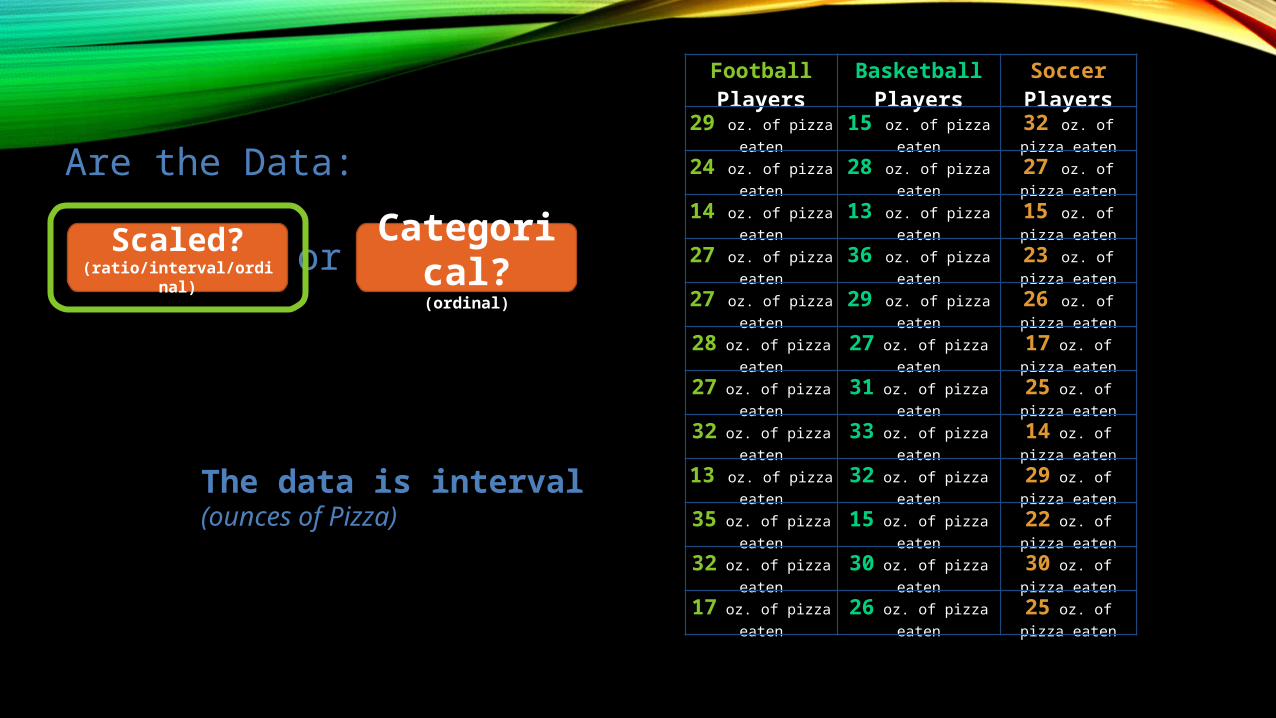
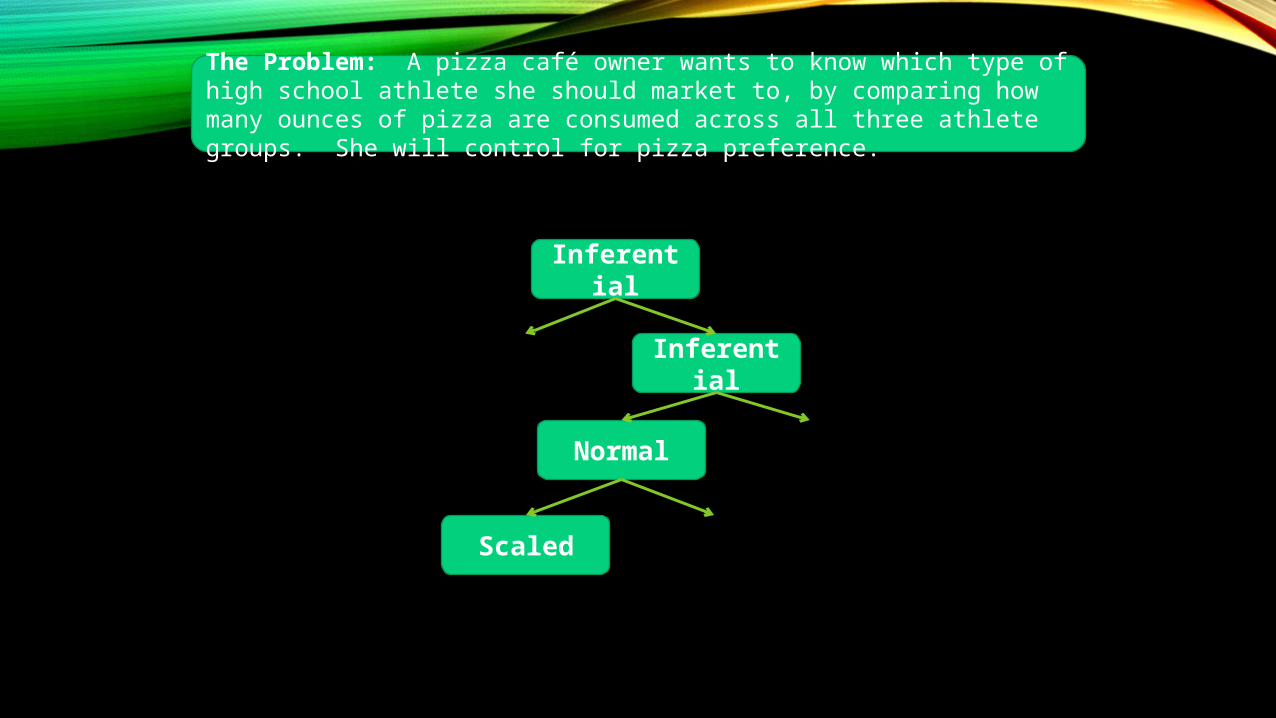
The Problem: A pizza café owner wants to know which type of high school athlete she should market to, by comparing how many ounces of pizza are consumed across all three athlete groups. She will control for pizza preference.
Inferential
Descriptive
Inferential
Descriptive
NormalNot
Normal
Scaled Categorical

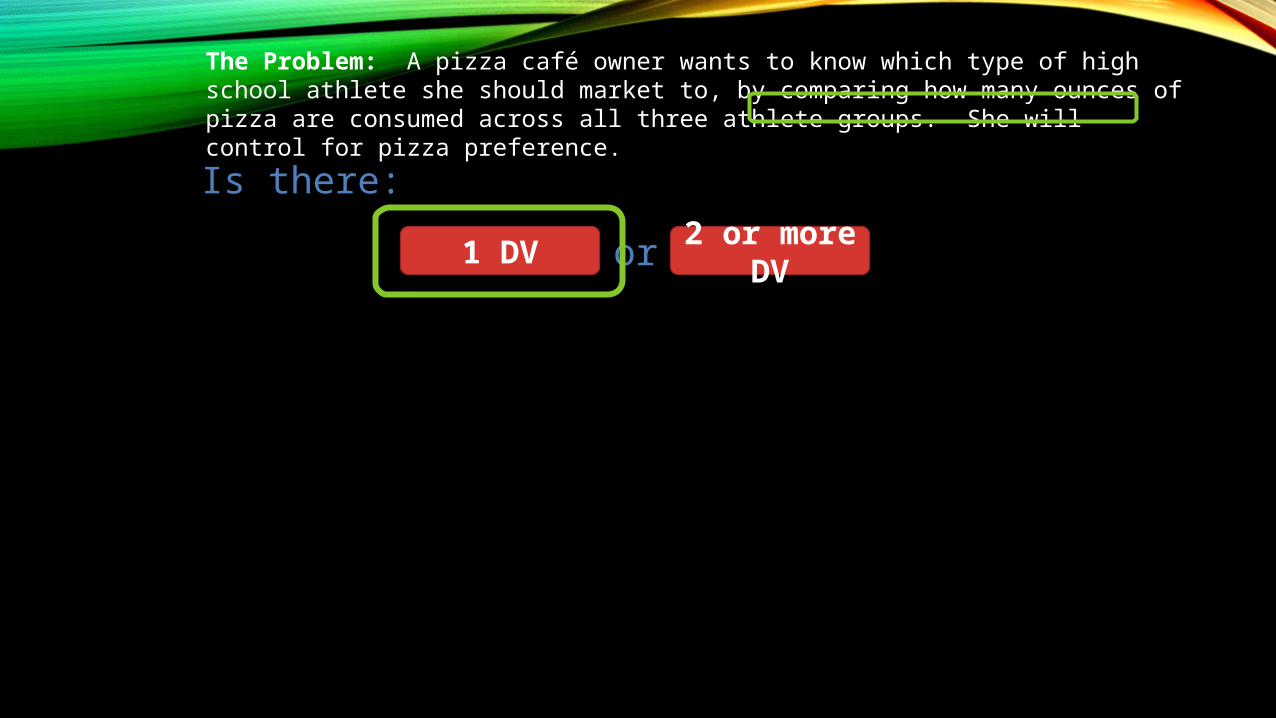
The Problem: A pizza café owner wants to know which type of high school athlete she should market to, by comparing how many ounces of pizza are consumed across all three athlete groups. She will control for pizza preference.
Is there:
1 DV2 or more
DVor
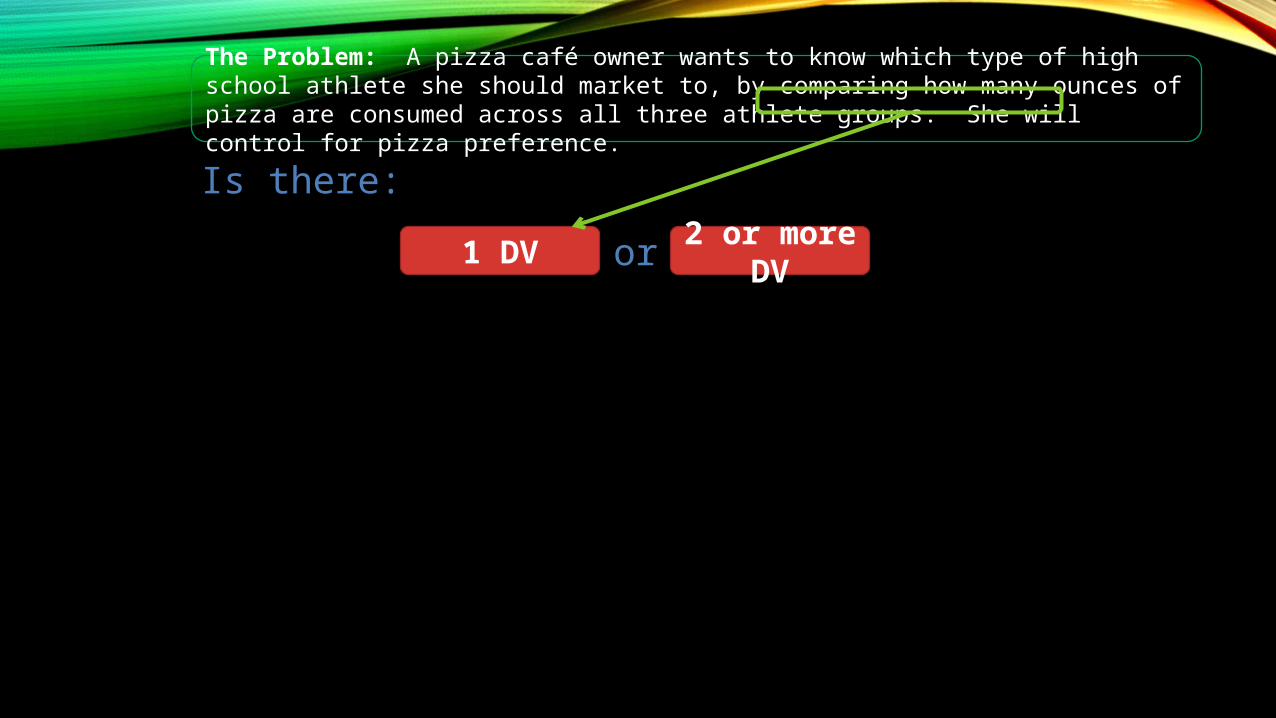
The Problem: A pizza café owner wants to know which type of high school athlete she should market to, by comparing how many ounces of pizza are consumed across all three athlete groups. She will control for pizza preference.
Is there:
1 DV2 or more
DVor
The Problem: A pizza café owner wants to know which type of high school athlete she should market to, by comparing how many ounces of pizza are consumed across all three athlete groups. She will control for pizza preference.
Is there:
1 DV2 or more
DVor
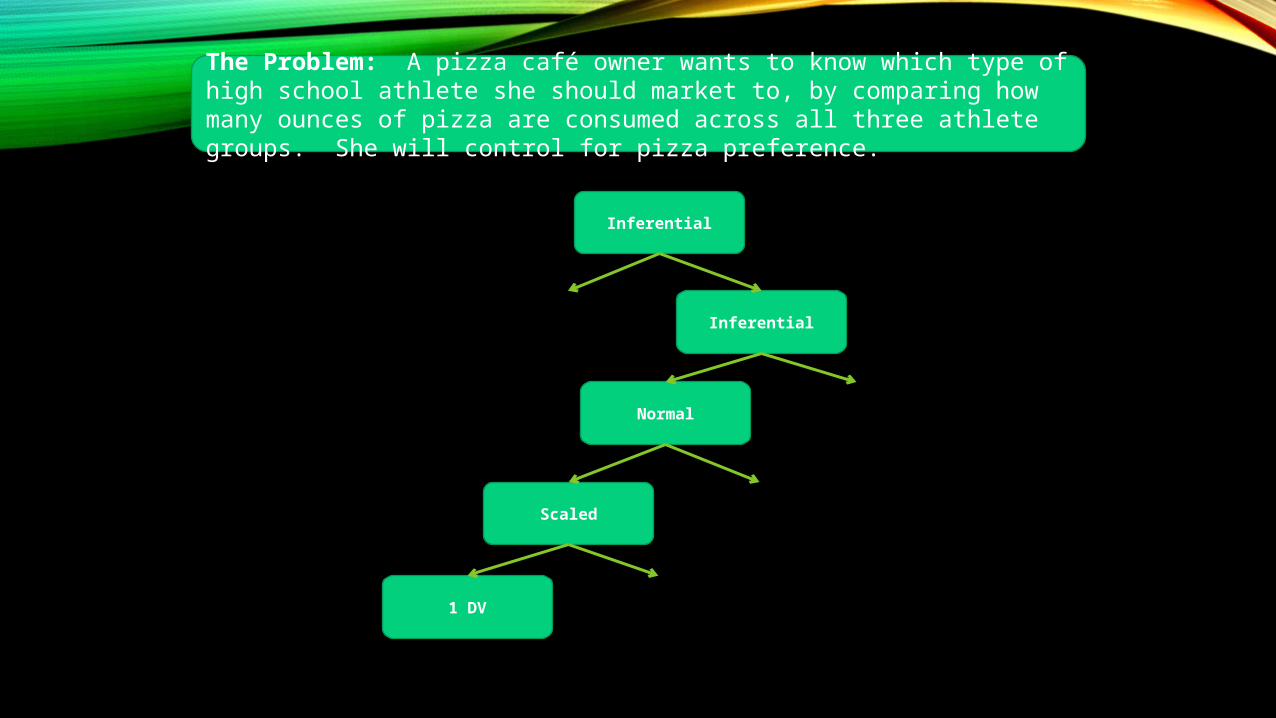
The Problem: A pizza café owner wants to know which type of high school athlete she should market to, by comparing how many ounces of pizza are consumed across all three athlete groups. She will control for pizza preference.
Inferential Descriptive
InferentialDescriptive
Normal Not Normal
Scaled Categorical
1 DV 2 or more DV
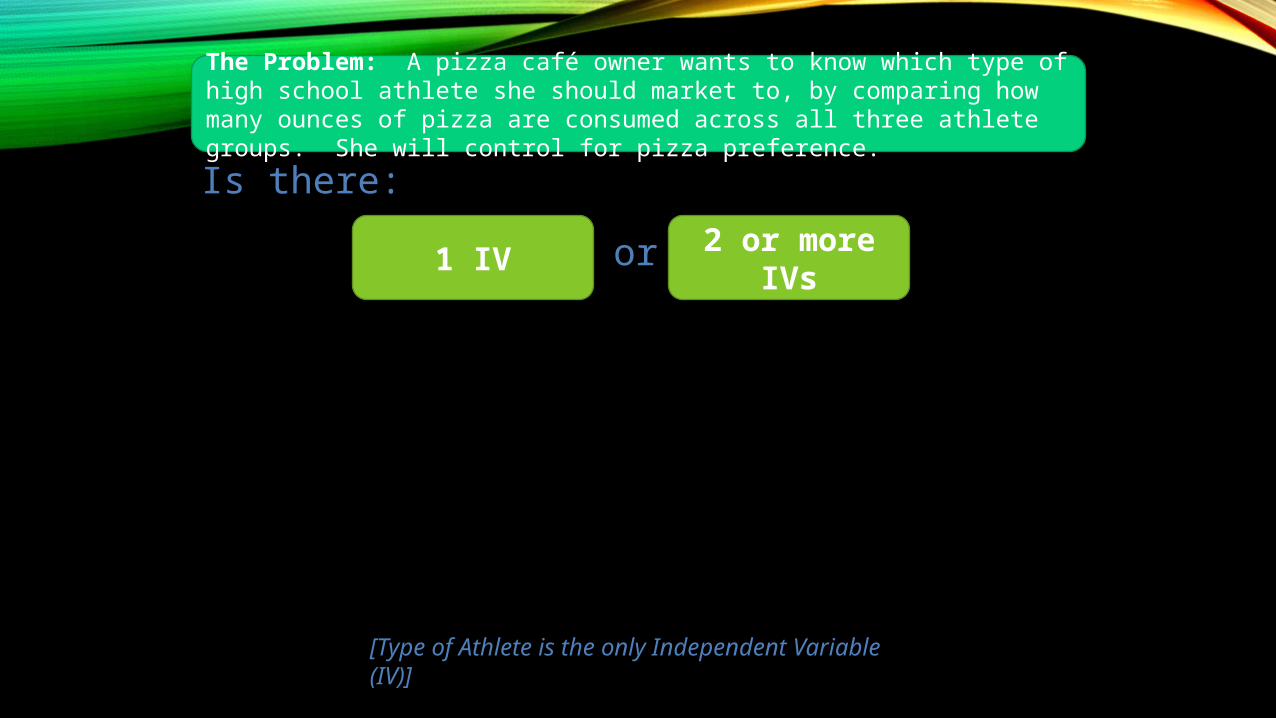
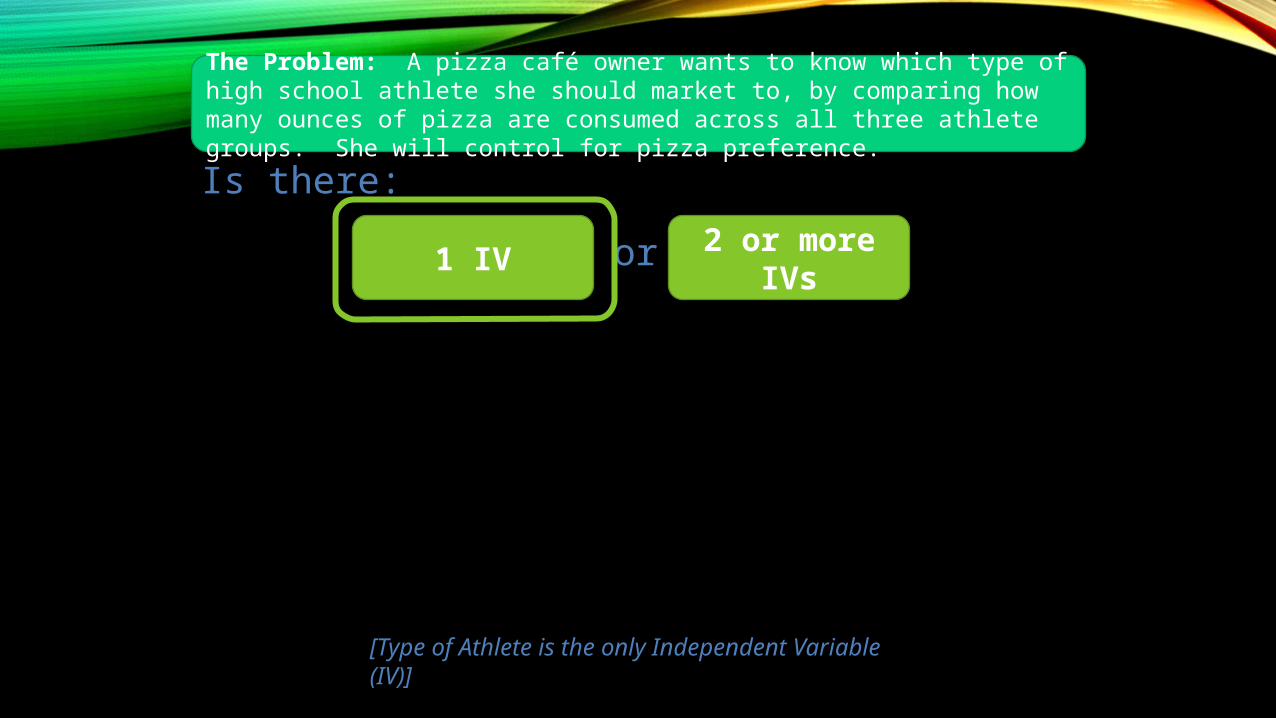
The Problem: A pizza café owner wants to know which type of high school athlete she should market to, by comparing how many ounces of pizza are consumed across all three athlete groups. She will control for pizza preference.
Is there:
1 IV2 or more
IVsor
[Type of Athlete is the only Independent Variable (IV)]
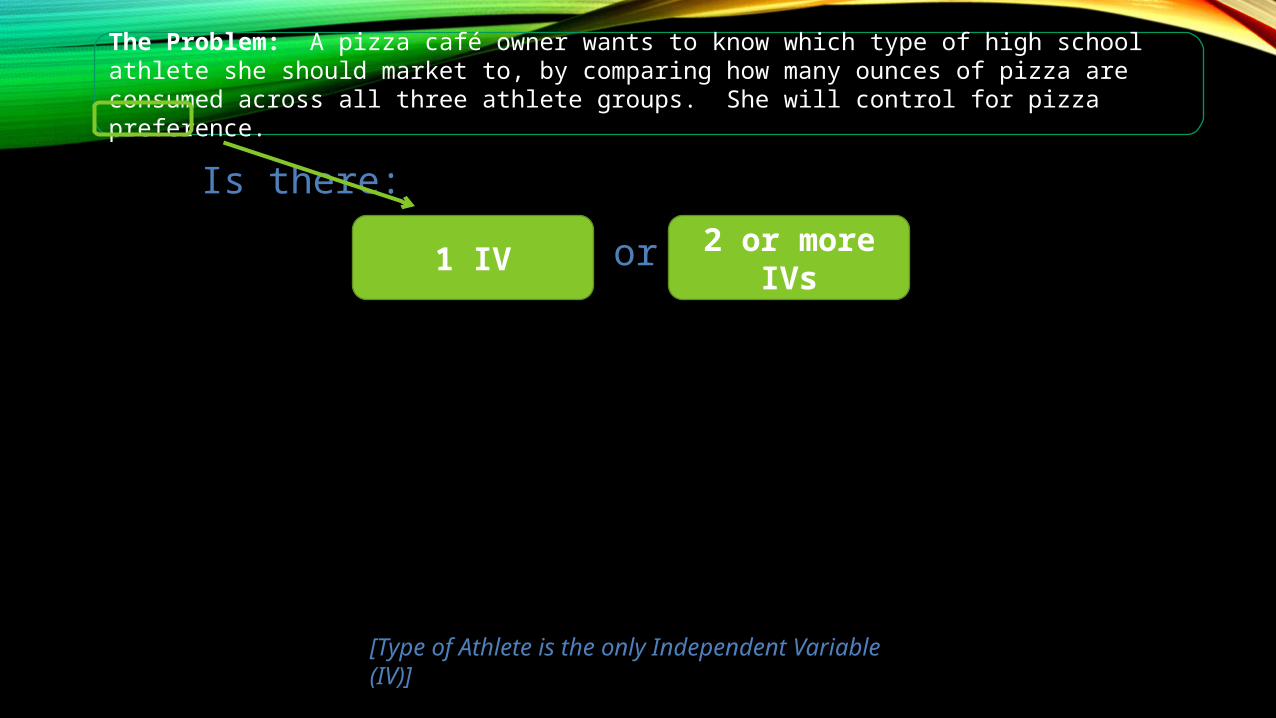
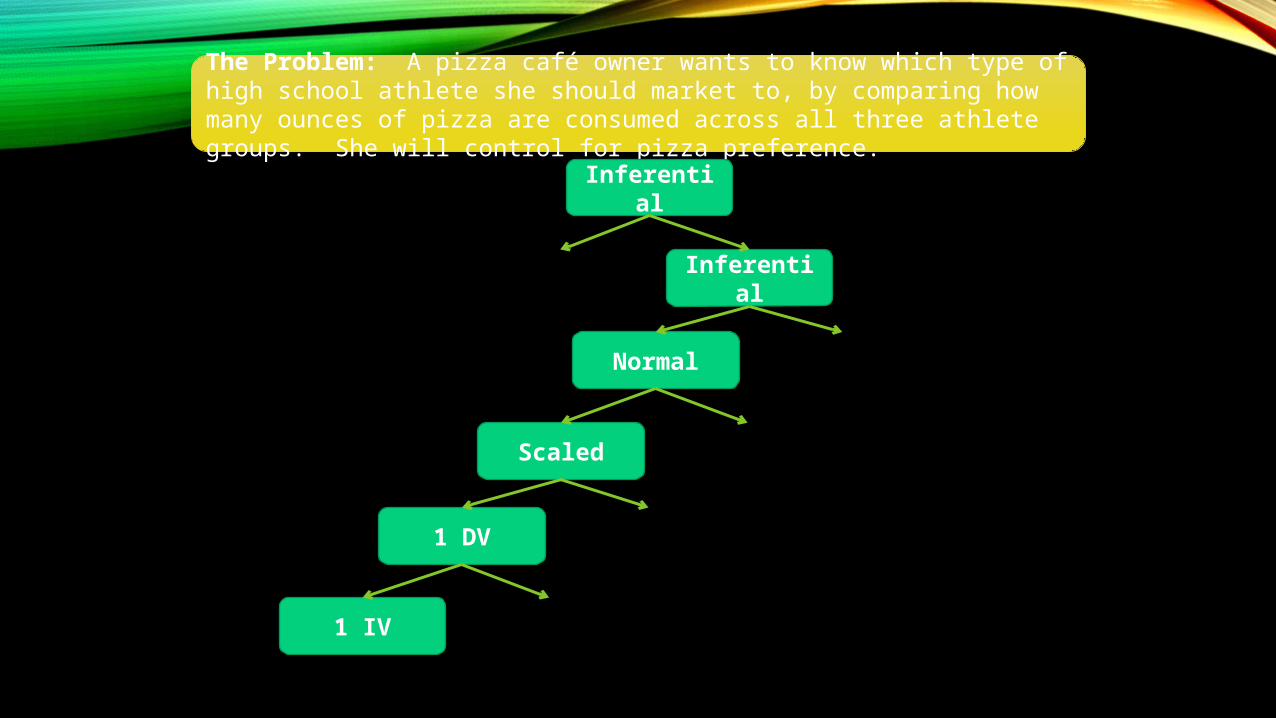
The Problem: A pizza café owner wants to know which type of high school athlete she should market to, by comparing how many ounces of pizza are consumed across all three athlete groups. She will control for pizza preference.
InferentialDescriptiv
e
InferentialDescriptiv
e
NormalNot
Normal
ScaledCategoric
al
1 DV2 or more
DV
1 IV2 or more
IV
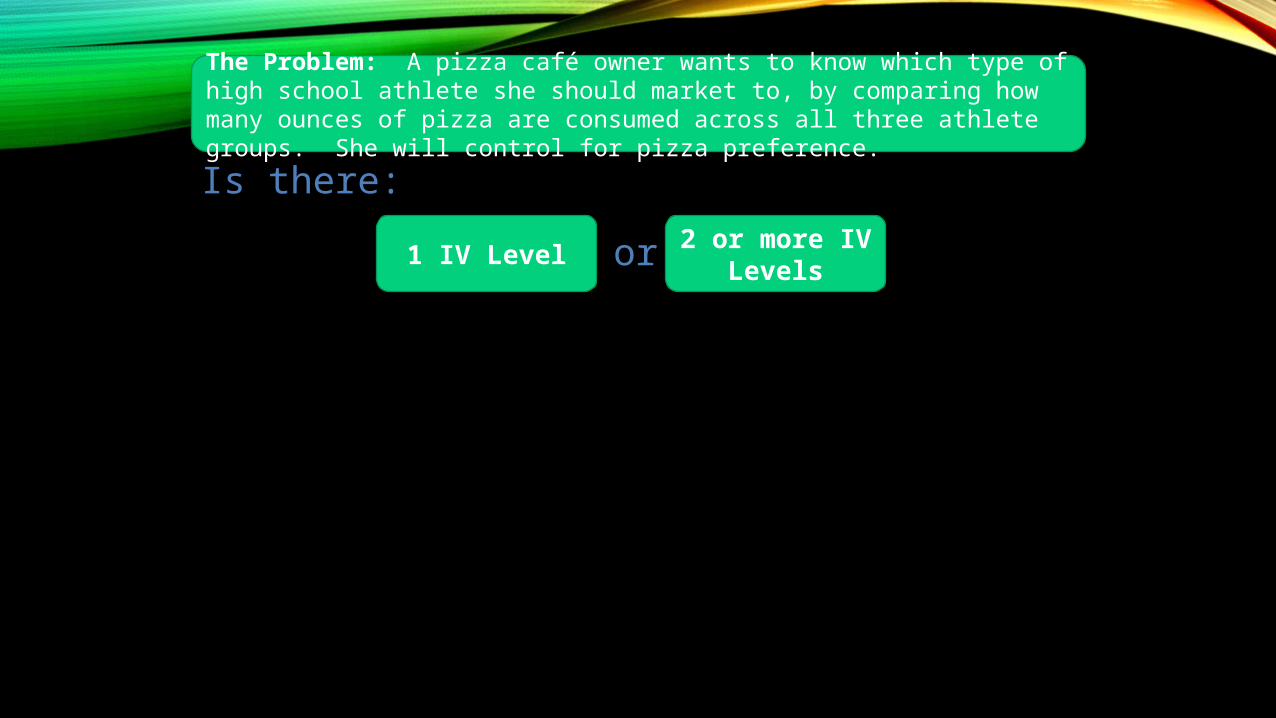
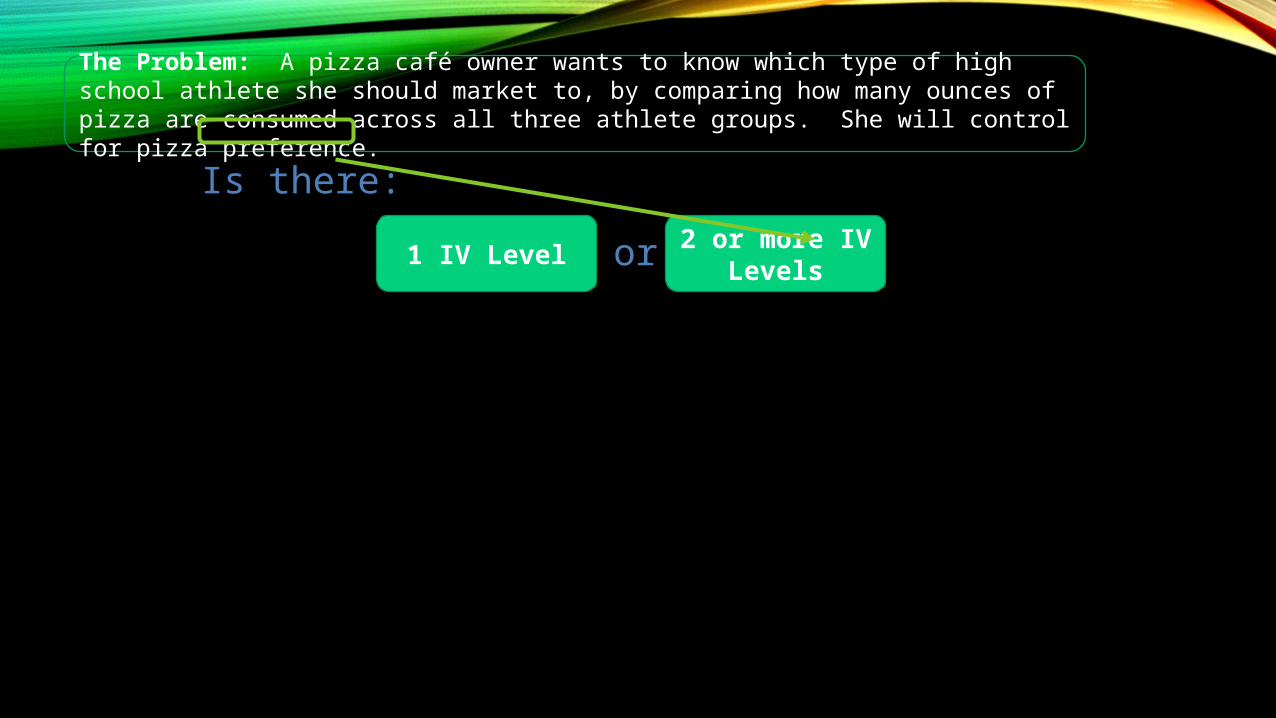
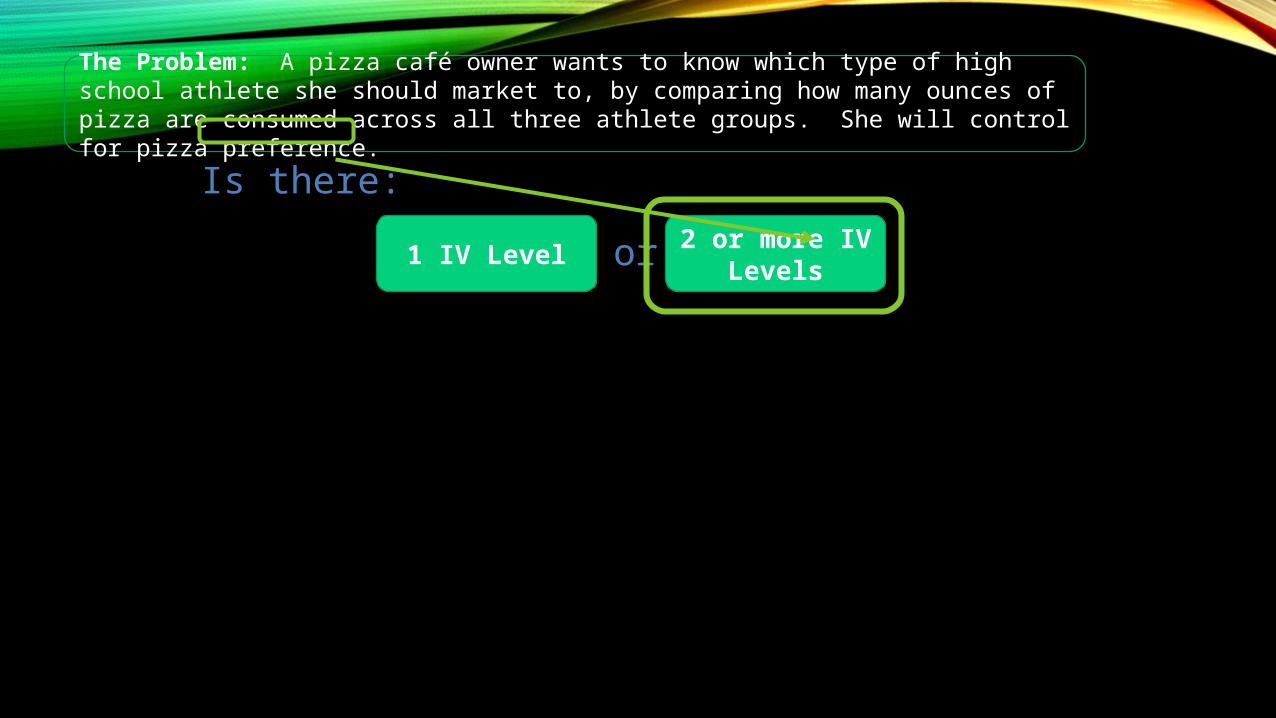
The Problem: A pizza café owner wants to know which type of high school athlete she should market to, by comparing how many ounces of pizza are consumed across all three athlete groups. She will control for pizza preference.
Is there:
1 IV Level2 or more IV
Levelsor
The Problem: A pizza café owner wants to know which type of high school athlete she should market to, by comparing how many ounces of pizza are consumed across all three athlete groups. She will control for pizza preference.
Is there:
1 IV Level2 or more IV
Levelsor
The Problem: A pizza café owner wants to know which type of high school athlete she should market to, by comparing how many ounces of pizza are consumed across all three athlete groups. She will control for pizza preference.
Is there:
1 IV Level2 or more IV
Levelsor
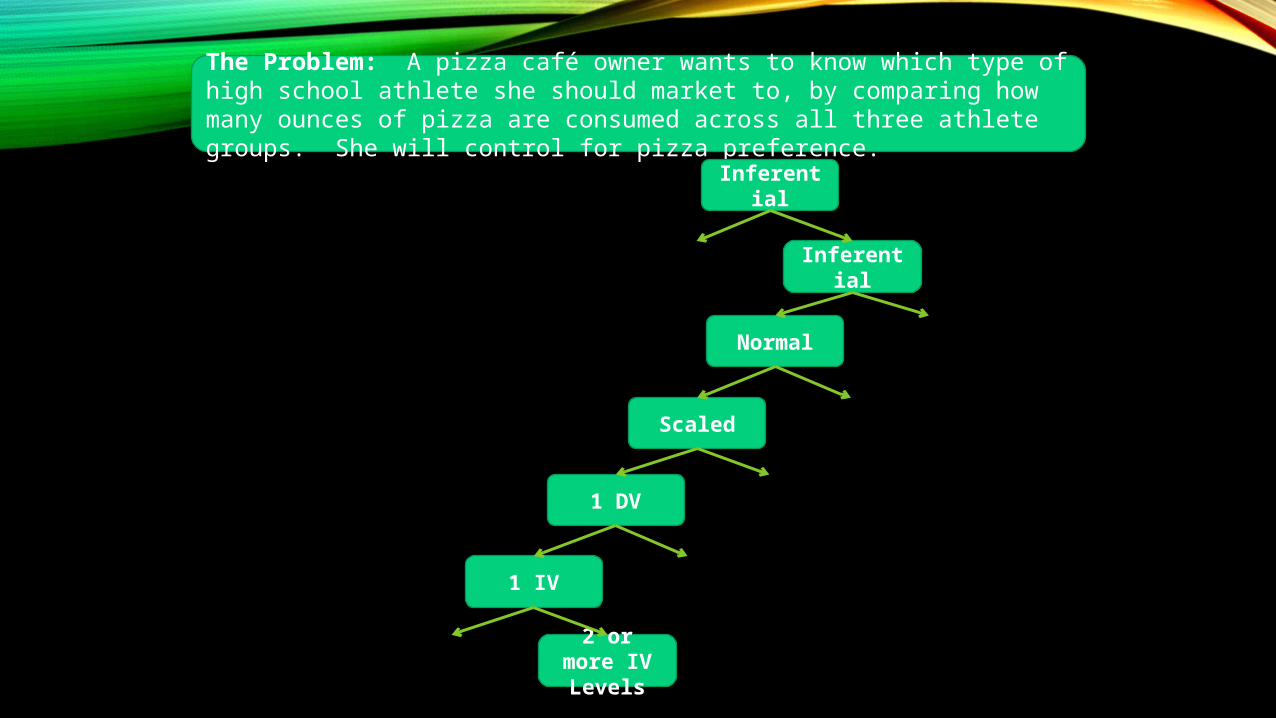
The Problem: A pizza café owner wants to know which type of high school athlete she should market to, by comparing how many ounces of pizza are consumed across all three athlete groups. She will control for pizza preference.
Inferential
Descriptive
Inferential
Descriptive
NormalNot
Normal
ScaledCategori
cal
1 DV2 or
more DV
1 IV2 or
more IV
2 or more IV Levels
1 IV Level
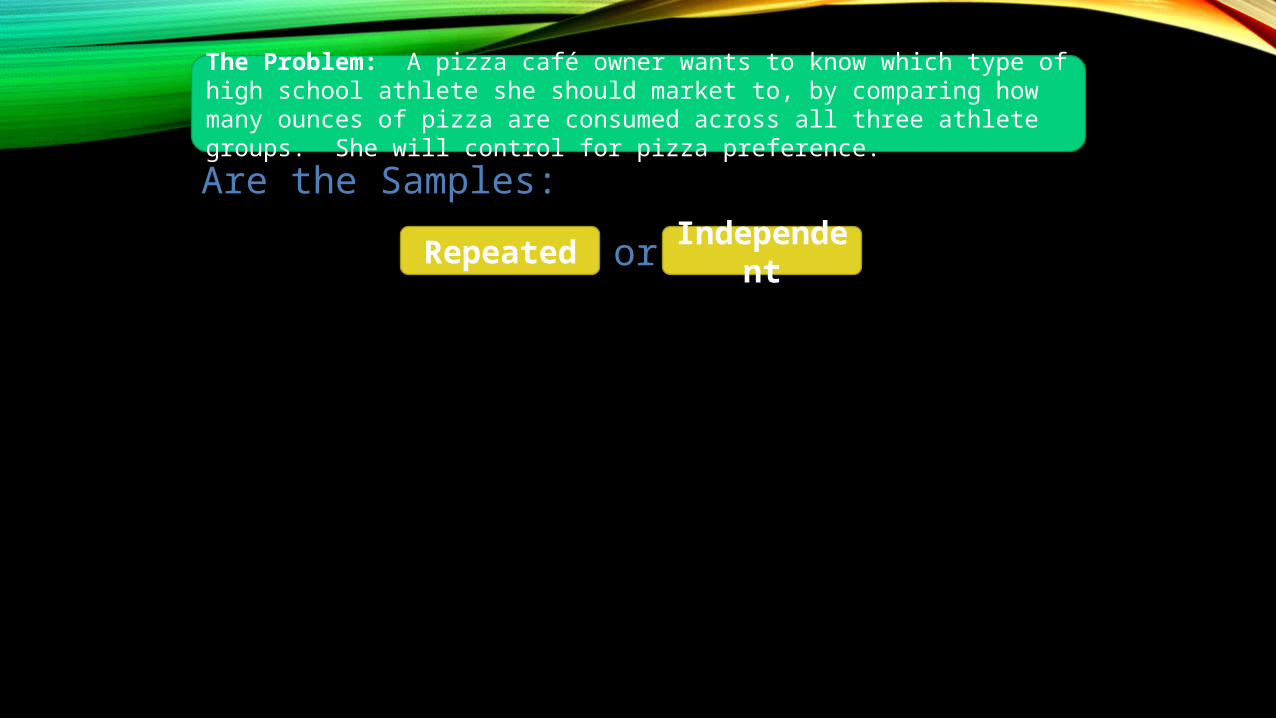
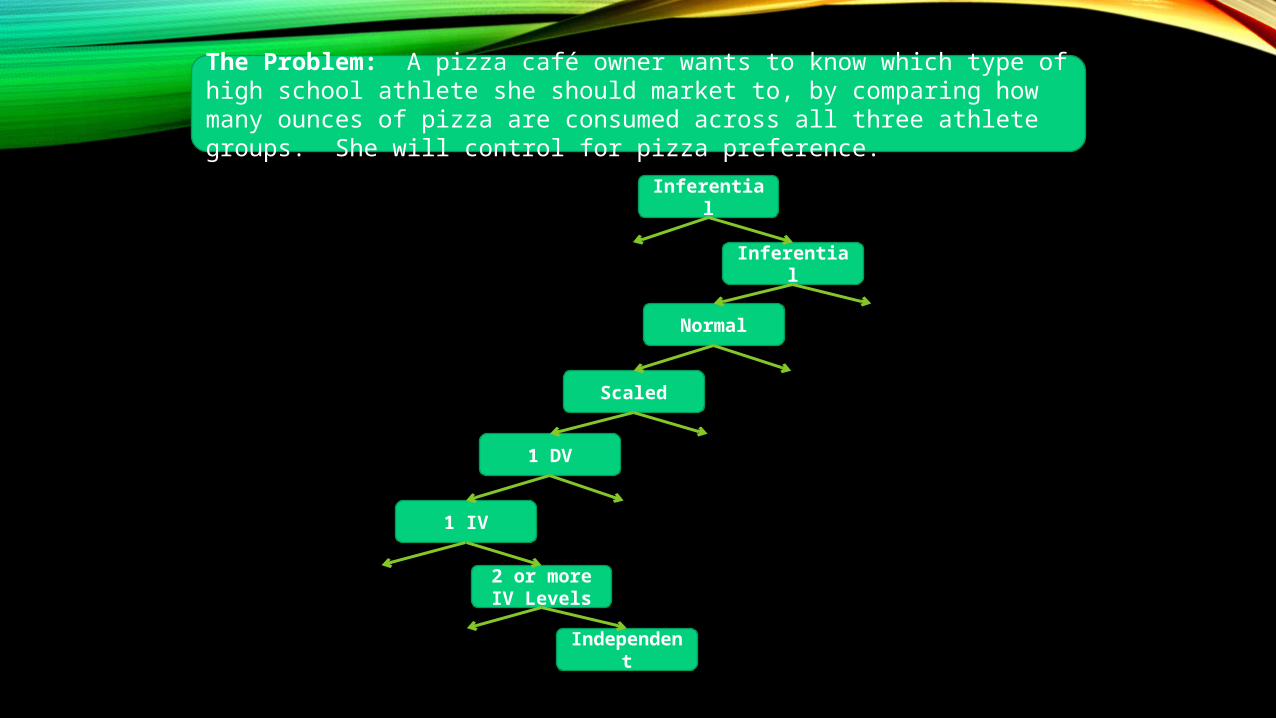
The Problem: A pizza café owner wants to know which type of high school athlete she should market to, by comparing how many ounces of pizza are consumed across all three athlete groups. She will control for pizza preference.
Are the Samples:
RepeatedIndepend
entor
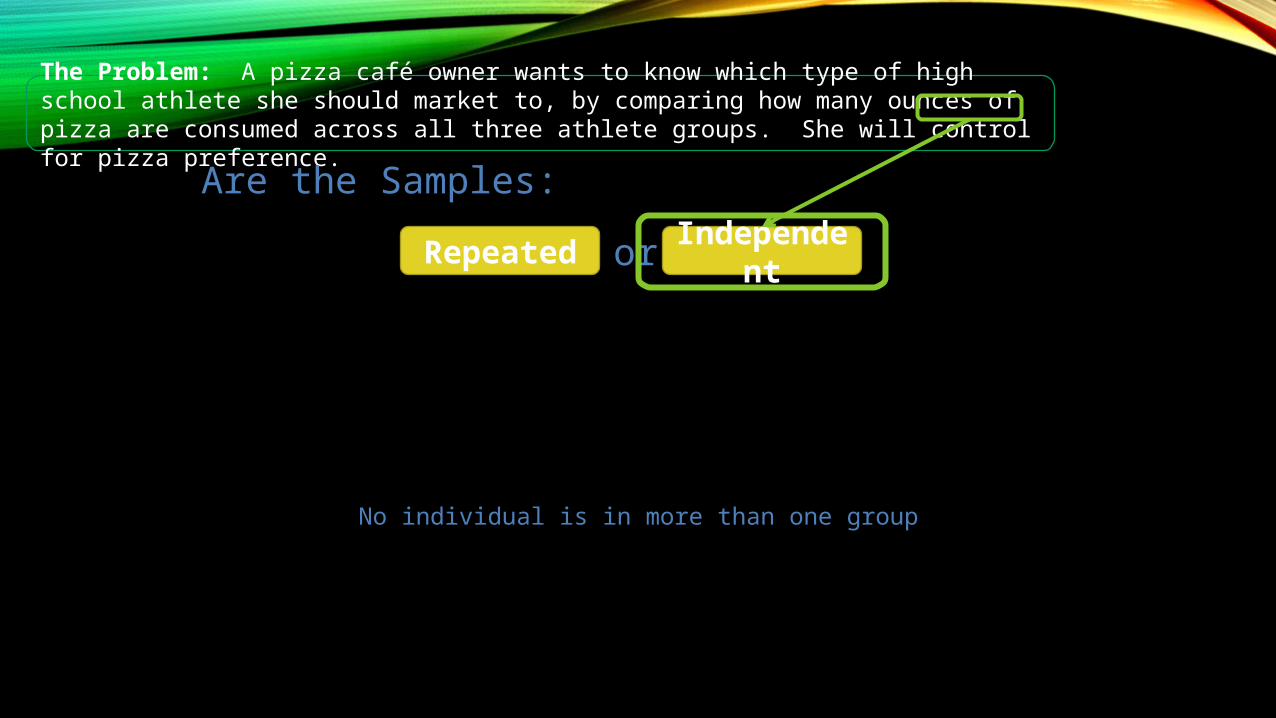
The Problem: A pizza café owner wants to know which type of high school athlete she should market to, by comparing how many ounces of pizza are consumed across all three athlete groups. She will control for pizza preference.
Are the Samples:
RepeatedIndepend
entor
No individual is in more than one group
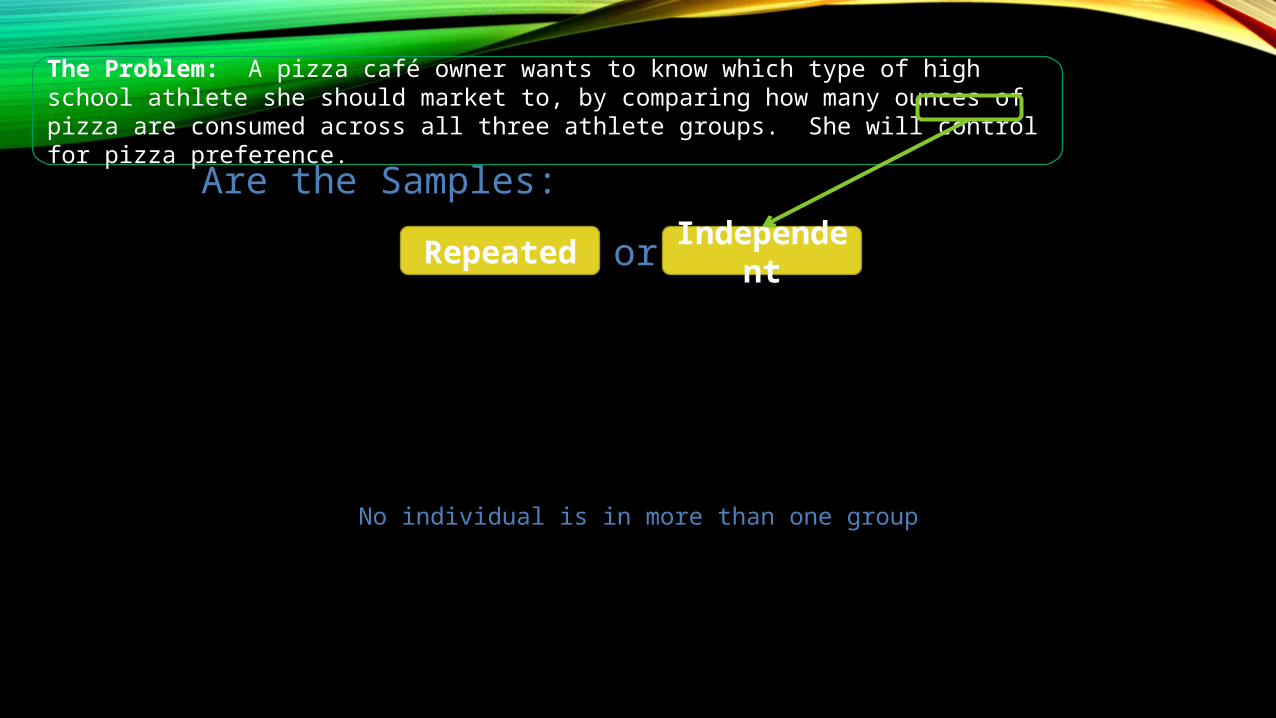
The Problem: A pizza café owner wants to know which type of high school athlete she should market to, by comparing how many ounces of pizza are consumed across all three athlete groups. She will control for pizza preference.
InferentialDescriptiv
e
InferentialDescriptiv
e
NormalNot
Normal
ScaledCategorica
l
1 DV2 or more
DV
1 IV2 or more
IV
2 or more IV Levels
1 IV Level
Independent
Repeated
The Problem: A pizza café owner wants to know which type of high school athlete she should market to, by comparing how many ounces of pizza are consumed across all three athlete groups. She will control for pizza preference.
Is There:
A CovariateNot a
Covariateor
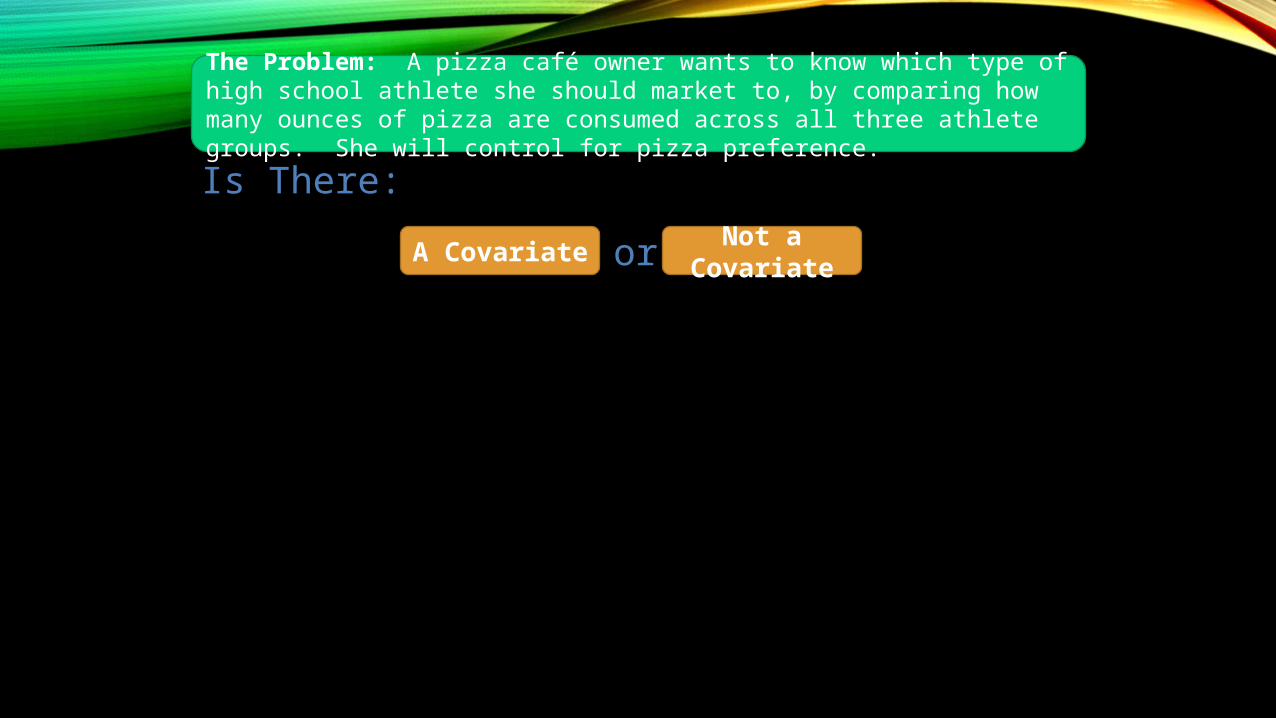
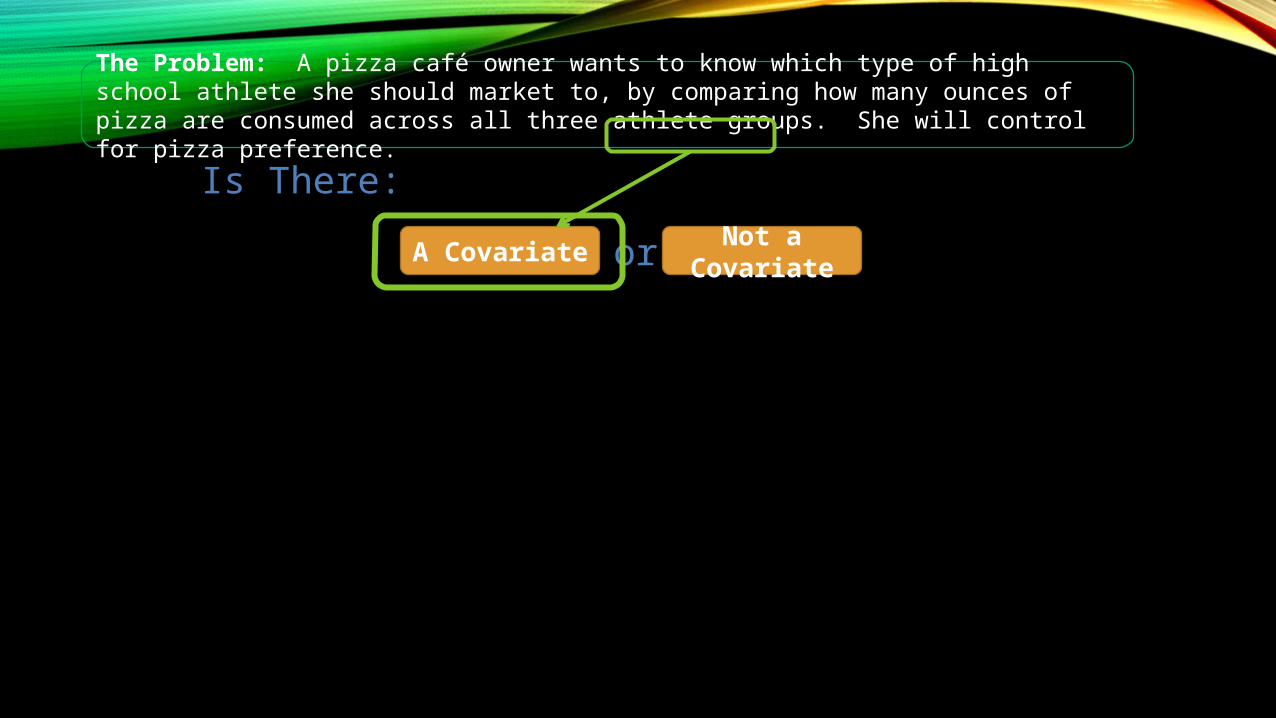
The Problem: A pizza café owner wants to know which type of high school athlete she should market to, by comparing how many ounces of pizza are consumed across all three athlete groups. She will control for pizza preference.
Is There:
A CovariateNot a
Covariateor
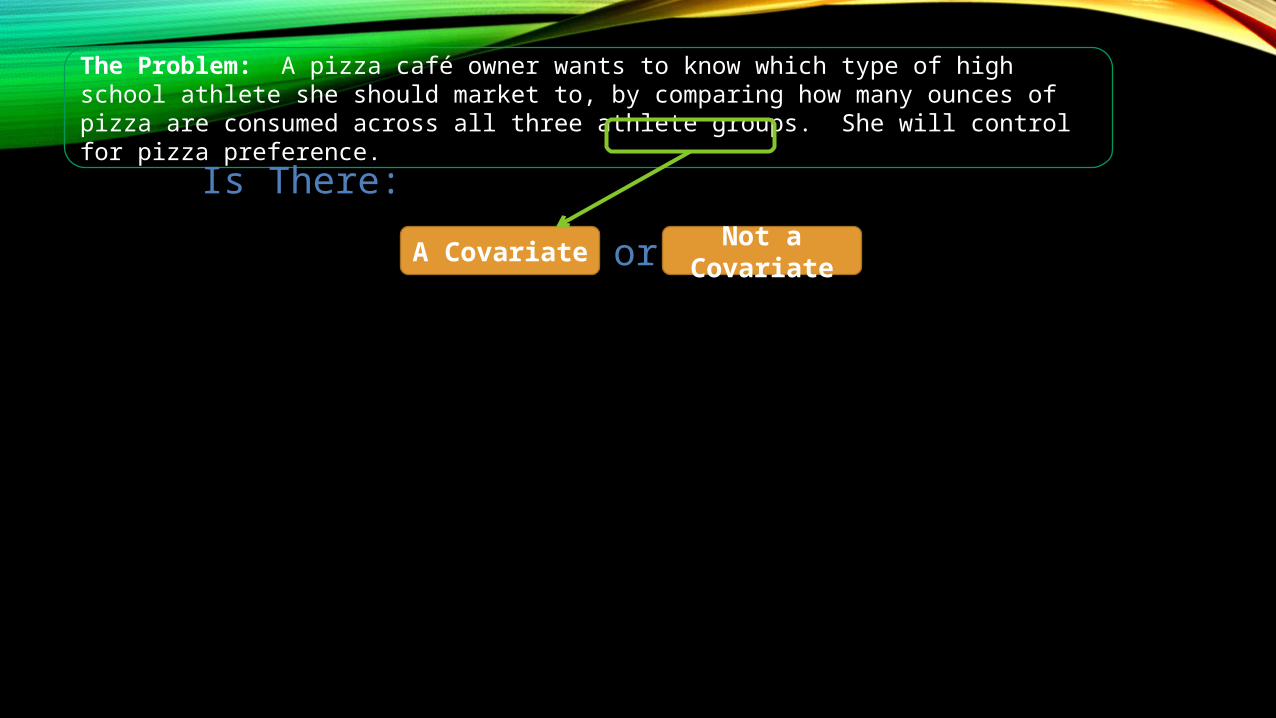
The Problem: A pizza café owner wants to know which type of high school athlete she should market to, by comparing how many ounces of pizza are consumed across all three athlete groups. She will control for pizza preference.
Is There:
A CovariateNot a
Covariateor
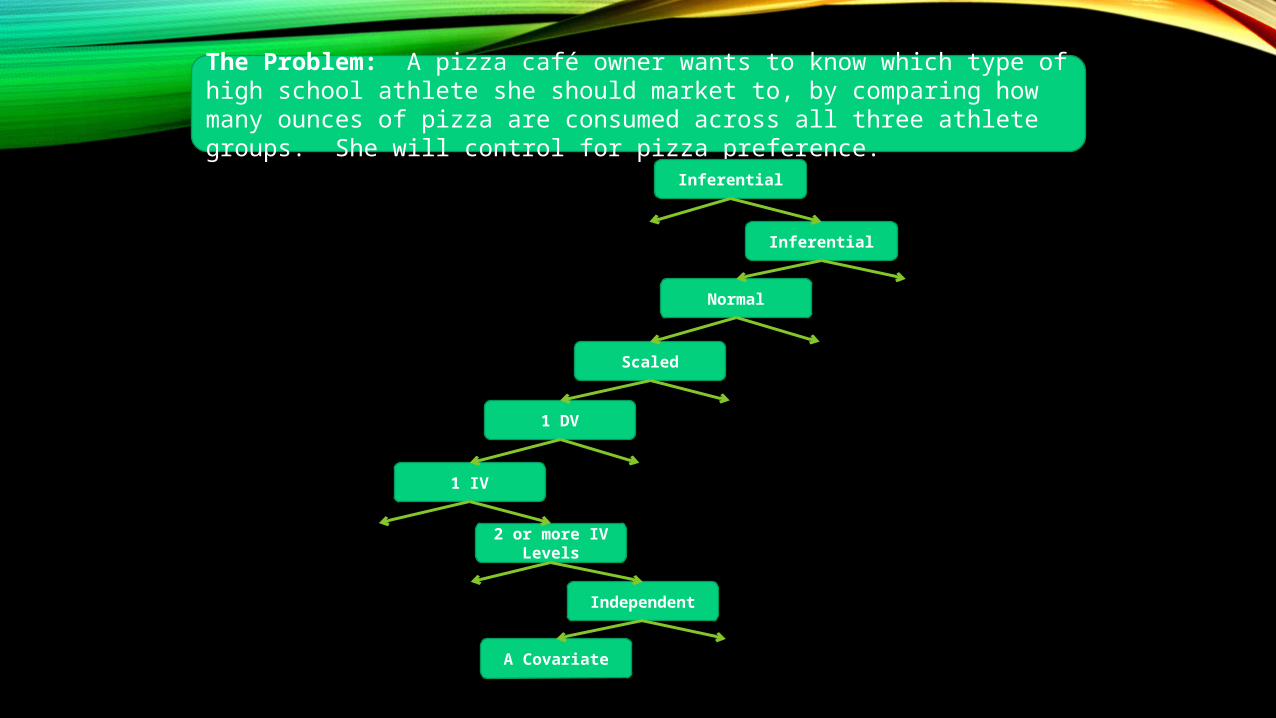
The Problem: A pizza café owner wants to know which type of high school athlete she should market to, by comparing how many ounces of pizza are consumed across all three athlete groups. She will control for pizza preference.
Inferential Descriptive
InferentialDescriptive
Normal Not Normal
Scaled Categorical
1 DV 2 or more DV
1 IV 2 or more IV
2 or more IV Levels
1 IV Level
IndependentRepeated
A CovariateNot a
Covariate

Now that we know how we got here, let’s consider what Analysis of Covariance is.

Now that we know how we got here, let’s consider what Analysis of Covariance is.
First, . . . what is covariance?

Now that we know how we got here, let’s consider what Analysis of Covariance is.First, . . . what is covariance?As you know, variance is a statistic that helps you determine how much the data in a distribution varies.
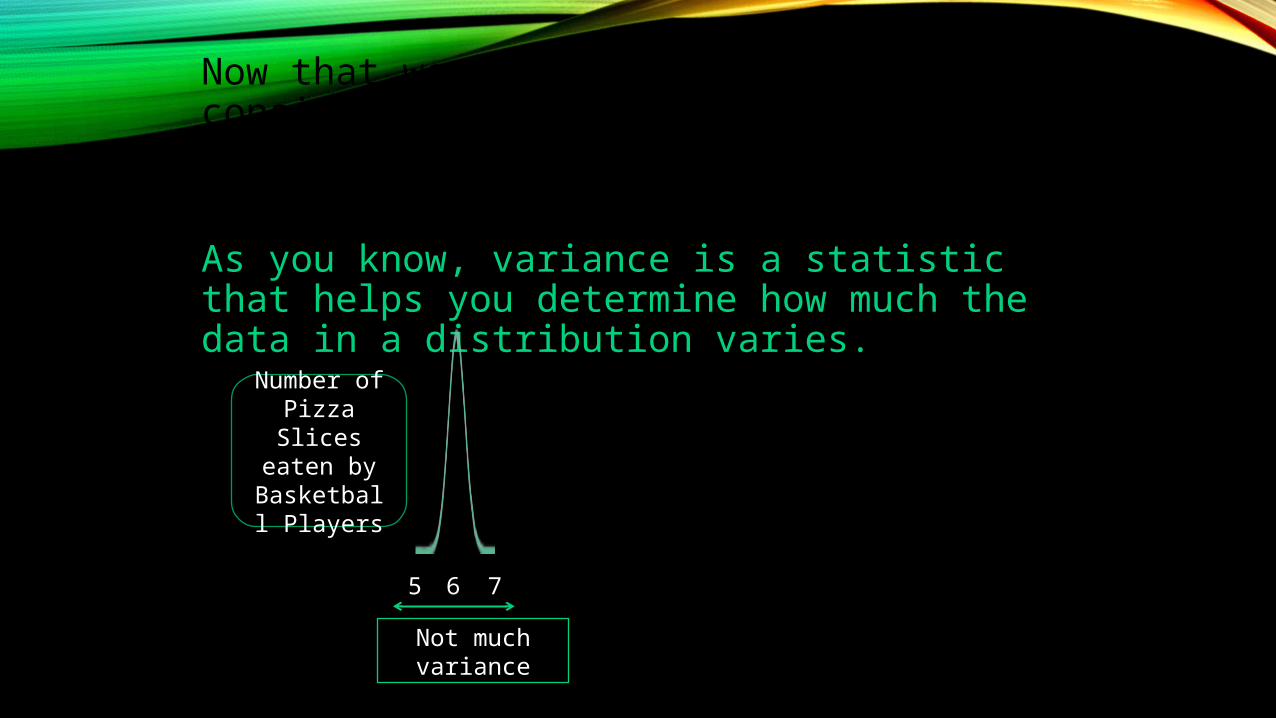
Now that we know how we got here, let’s consider what Analysis of Covariance is.First, . . . what is covariance?As you know, variance is a statistic that helps you determine how much the data in a distribution varies.
6 75
Number of Pizza Slices
eaten by Basketball
Players
Not much variance
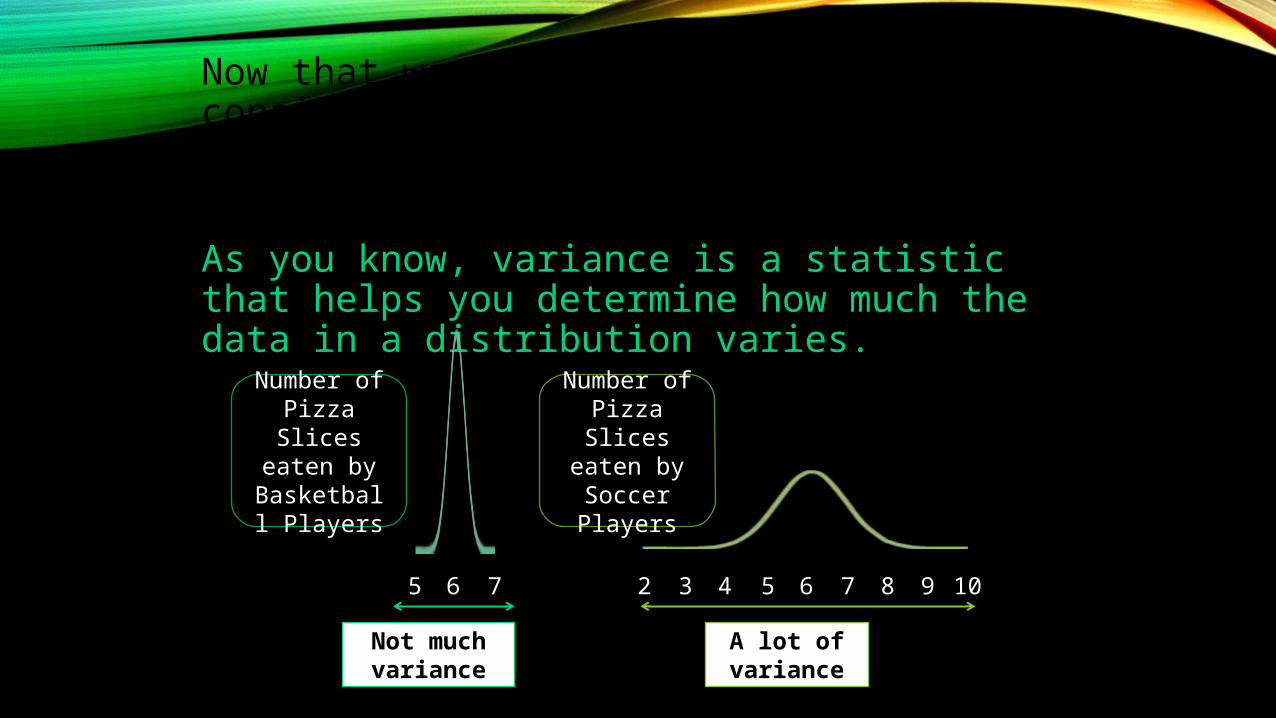
Now that we know how we got here, let’s consider what Analysis of Covariance is.First, . . . what is covariance?As you know, variance is a statistic that helps you determine how much the data in a distribution varies.
6 75
Number of Pizza Slices
eaten by Basketball
Players
Not much variance
6 754 8 932 10
Number of Pizza Slices
eaten by Soccer Players
A lot of variance
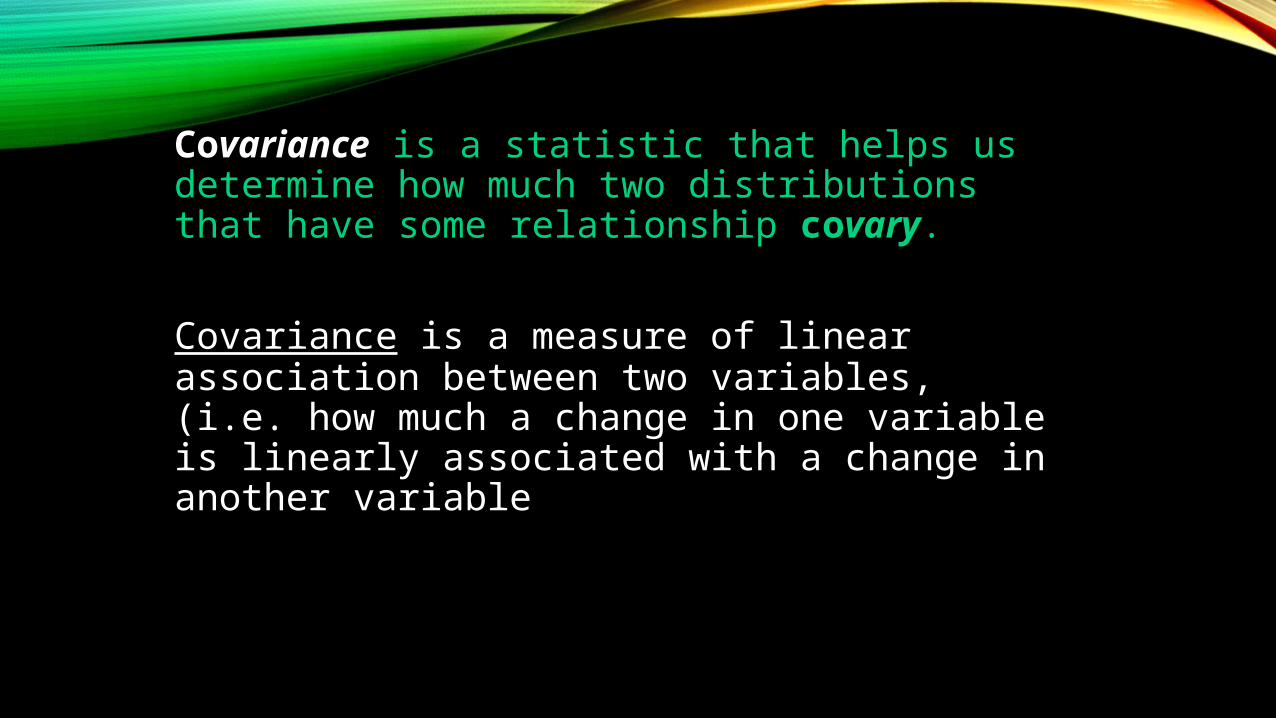
Covariance is a statistic that helps us determine how much two distributions that have some relationship covary.
Covariance is a measure of linear association between two variables, (i.e. how much a change in one variable is linearly associated with a change in another variable
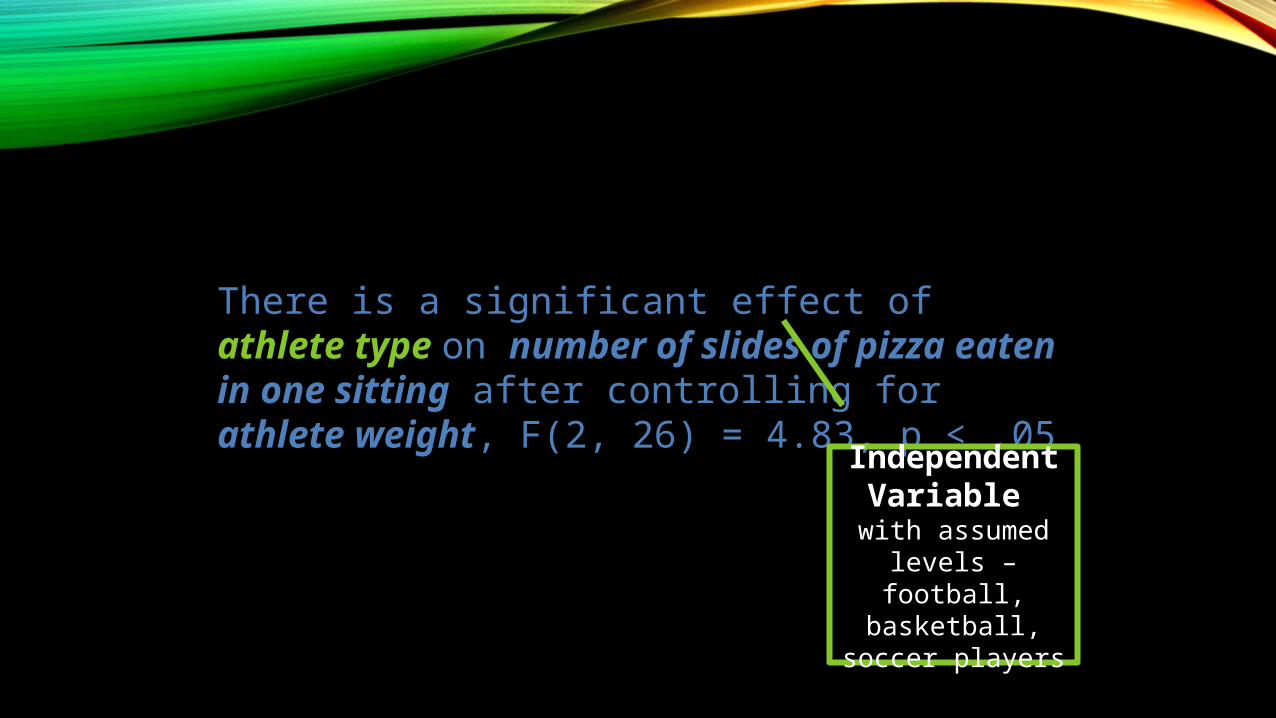
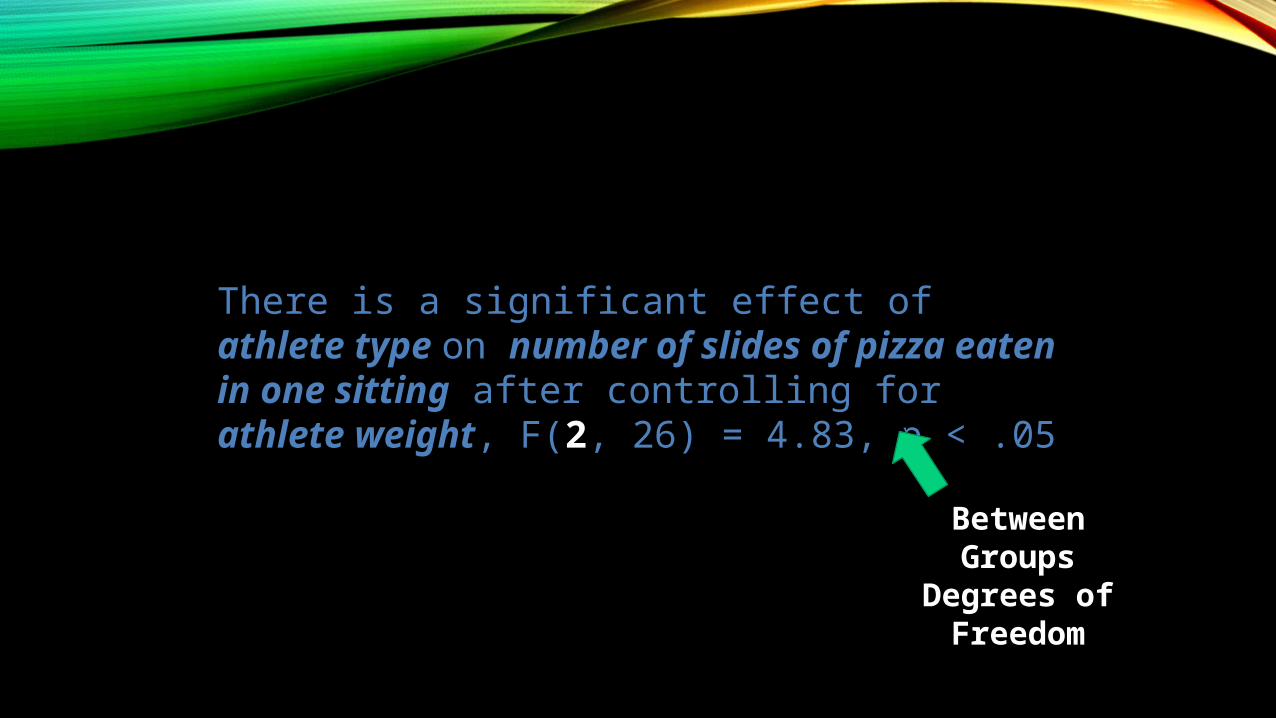
There is a significant effect of athlete type on number of slides of pizza eaten in one sitting after controlling for athlete weight, F(2, 26) = 4.83, p < .05
Independent Variable with assumed
levels –football, basketball,
soccer players
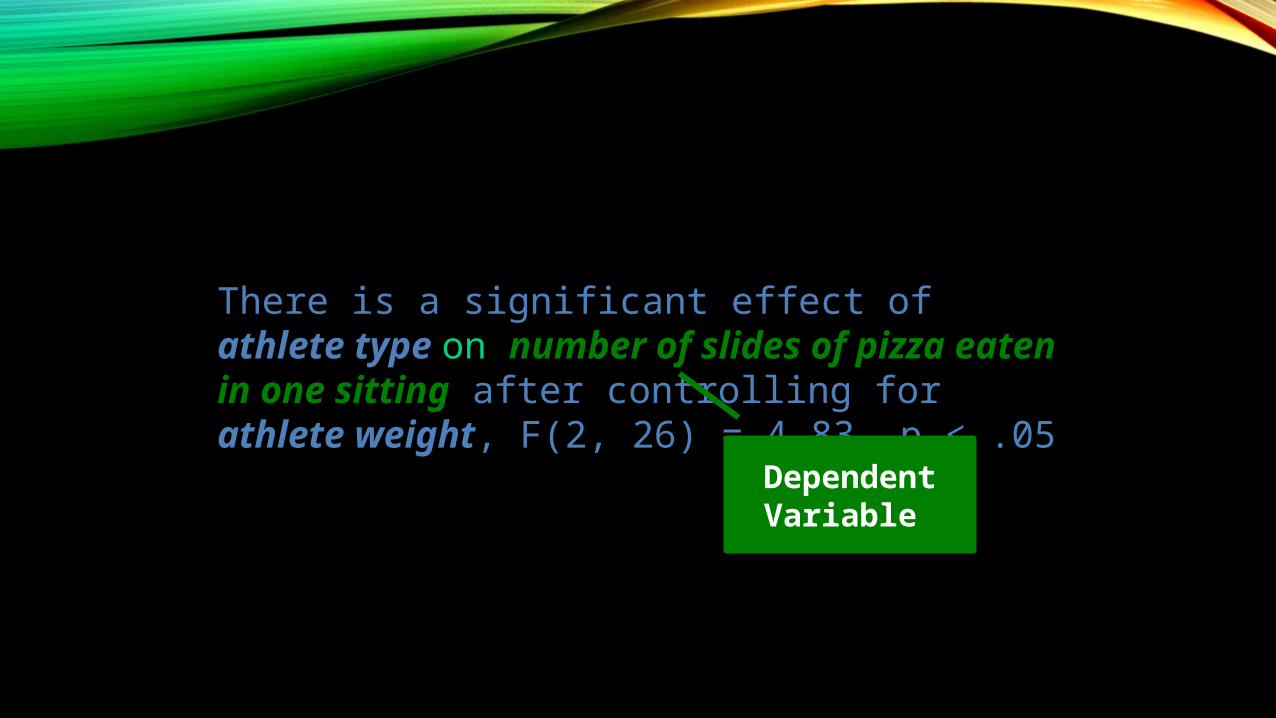
There is a significant effect of athlete type on number of slides of pizza eaten in one sitting after controlling for athlete weight, F(2, 26) = 4.83, p < .05
Dependent Variable
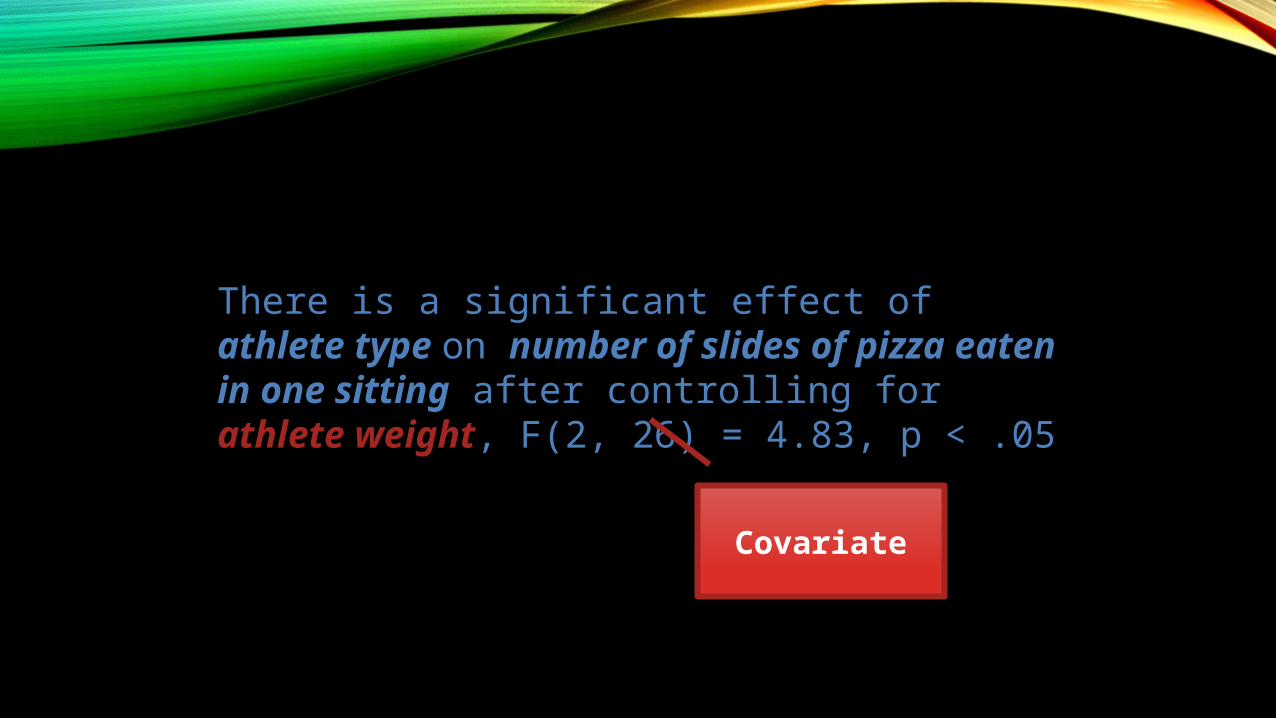
There is a significant effect of athlete type on number of slides of pizza eaten in one sitting after controlling for athlete weight, F(2, 26) = 4.83, p < .05
Covariate
There is a significant effect of athlete type on number of slides of pizza eaten in one sitting after controlling for athlete weight, F(2, 26) = 4.83, p < .05
Between Groups
Degrees of Freedom
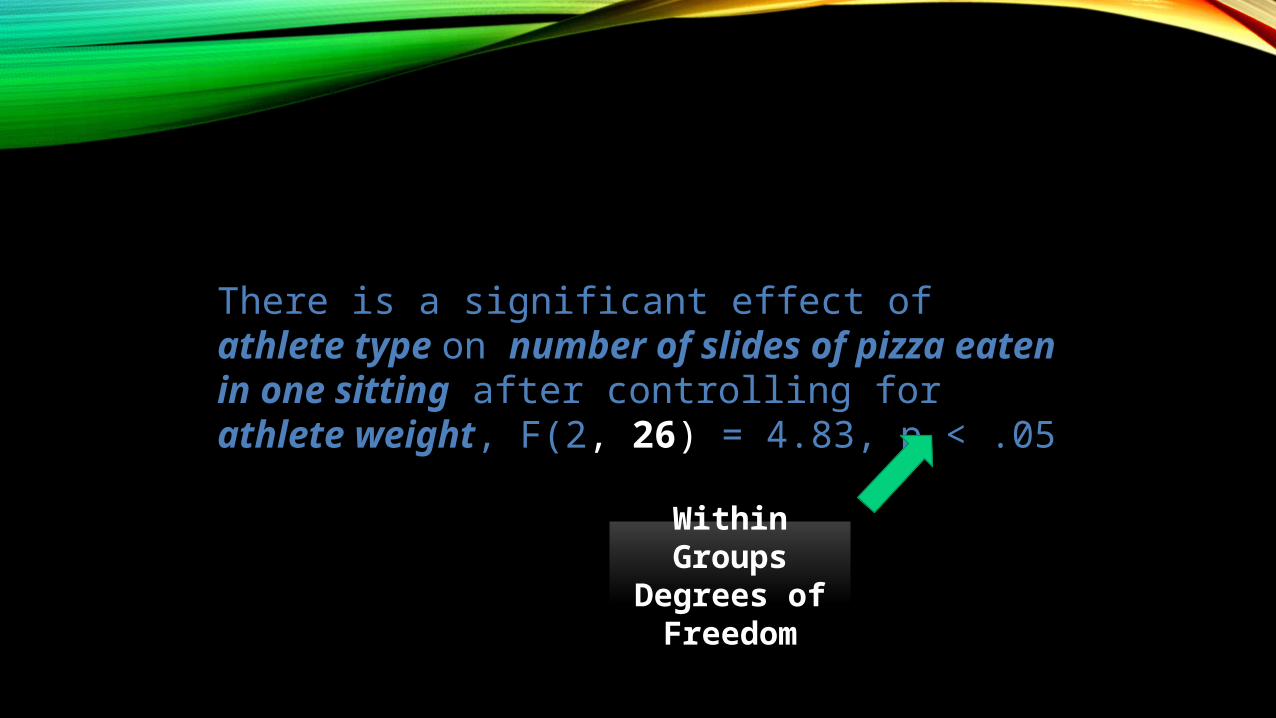
There is a significant effect of athlete type on number of slides of pizza eaten in one sitting after controlling for athlete weight, F(2, 26) = 4.83, p < .05
Within Groups
Degrees of Freedom
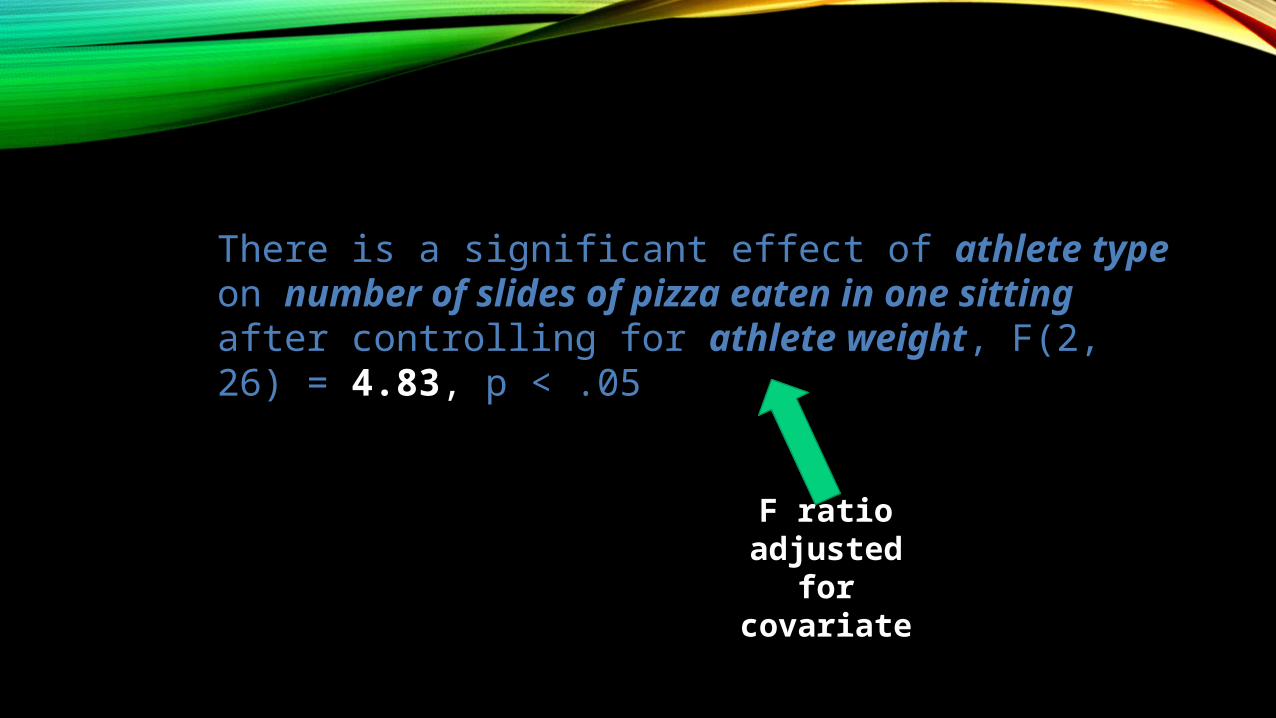
There is a significant effect of athlete type on number of slides of pizza eaten in one sitting after controlling for athlete weight, F(2, 26) = 4.83, p < .05
F ratio adjusted for
covariate
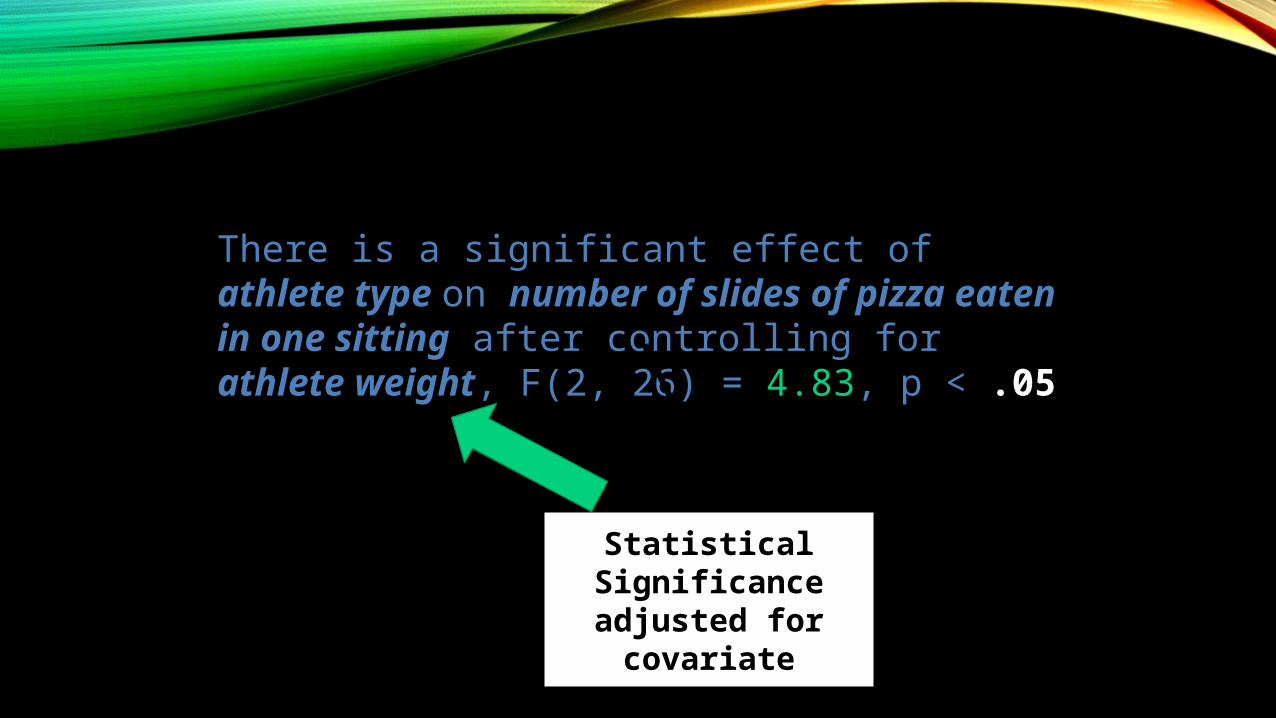
There is a significant effect of athlete type on number of slides of pizza eaten in one sitting after controlling for athlete weight, F(2, 26) = 4.83, p < .05
Statistical Significance adjusted for
covariate
SOURCES
http://wikieducator.org/images/f/fb/Stats_11_ANOVA.pdf
http://www.statsmakemecry.com/smmctheblog/stats-soup-anova-ancova-manova-mancova
http://www.theanalysisfactor.com/confusing-statistical-terms-5-covariate/
http://www.slideshare.net/plummer48/reporting-an-ancova-1?related=1