Embed Size (px)
Citation preview

A R A N D O M A S S I G N M E N T E V A L U A T I O N O F S C H O O L V I S I T S T O A N A R T M U S E U M
J A Y P . G R E E N EB R I A N K I S I D A
D A N B O W E N
U N I V E R S I T Y O F A R K A N S A S
Learning from Crystal Bridges

Motivations for Research
Culturally enriching field trips have a long tradition in public education, but are recently in decline because of budgetary constraints
focus on core subject instruction to maximize performance on high stakes exams
shift to “reward” field trips
What is lost when enriching field trips are cut?
Can we expand the measures of educational outcomes to capture the role of the arts and cultural institutions?
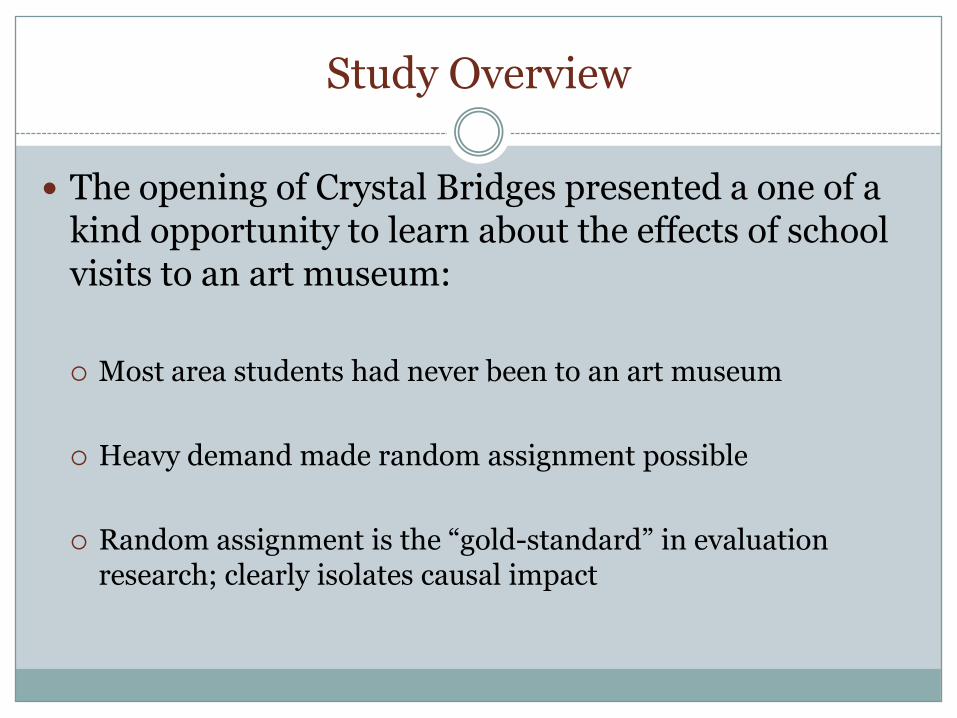
Study Overview
The opening of Crystal Bridges presented a one of a kind opportunity to learn about the effects of school visits to an art museum:
Most area students had never been to an art museum
Heavy demand made random assignment possible
Random assignment is the “gold-standard” in evaluation research; clearly isolates causal impact

Study Overview
Crystal Bridges is the first major art museum built in four decades
Over $800 million endowment, including resources for school tours
In total, 525 K-12 school groups with 38,347 students applied
Applicants were organized into matched pairs
Pairs randomly assigned to treatment and control
Pairs randomly ranked to fill available spots
95 applicants awarded tours (treatment group) and 95 applicants
awarded deferred tours (control group)
Data collected from 174 applicant groups (80 matched pairs) on
average 3 weeks after tour

Enormous Effort
174 applicant groups
123 schools
11,973 miles driven
10,912 students surveyed
489 teachers surveyed
531,781 bits of data

Study Overview: Student Sample
Grade Treatment N Control N Total N
Kindergarten 305 18 323
1st grade 506 634 1,140
2nd grade 624 536 1,160
3rd grade 363 917 1,280
4th grade 924 533 1,457
5th grade 656 1106 1,762
6th grade 635 723 1,358
7th grade 470 243 713
8th grade 204 298 502
9th grade 96 108 204
10th grade 116 276 392
11th grade 147 171 318
12th grade 148 155 303
Total 5,194 5,718 10,912

Study Overview: Student Sample
Student Characteristics Treatment Control Total
Females (K-12 sample) 50.6 50.8 50.7
Ethnicity (3-12 sample)
Hispanic 18.8 18.6 18.7
White 59.3 60.2 59.8
Native American 6.6 5.3 5.8
Black 2.8 3.8 3.3
Marshallese 1.8 2.5 2.2
Asian or Pacific Islander 3.3 2.8 3.0
Mixed race 5.1 4.6 4.8
Other/Unknown 2.3 2.3 2.3

Data Analysis
Estimate of mean differences using the following equation for outcome Y of student i in matched pair m
Yim = α + β1Treati + β2Matchim + εim
This basic regression model is improved by adding controls for observable characteristics
Yim = α + β1Treati + β2Matchim + β3Femalei + β4Gradei + εim
Subgroup effects are estimated with indicator variables and an interaction term where S indicates that a student is a member of a particular subgroup:
Yim = α + β1Treati + β2Matchim + β3Femalei + β4Gradei + β5Si + β6 Si*Treati + εim

Summary of Findings
Students who won the lottery and received a school tour of Crystal Bridges are significantly more likely to:
Recall school visit themes
Demonstrate stronger critical thinking skills
Display higher tolerance
Exhibit greater historical empathy
Develop a taste for art museums and cultural institutions
Benefits are generally significantly larger for disadvantaged students (minority, low-income, or rural schools)

Rural Schools

Rural Schools

Rural Schools

81.7%***
90.5%***
59.9%
66.6%
0% 50% 100%
What does this painting show?
What is the name of this painting?
Control Treatment
What is the name of this painting?
Recalling Themes
Painting C is showing… the importance of women entering the workforce during World War II.

80.5%***
79.2%***
49.4%
27.0%
0% 20% 40% 60% 80% 100%
What does this painting s
plowing it under
Control Treatment
Painting C is showing…An African-American perspective of real and idealized visions of the American dream?
Recalling Themes
Why do you think this man is plowing under his crop rather than harvesting it?

87.9%***
94.1%***
30.0%
45.4%
0% 20% 40% 60% 80% 100%
johnson
Control Treatment
Painting B is showing… abolitionists making maple syrup to undermine the sugar made from slave labor.
Recalling Themes
Painting A is showing… a community in transition to a more industrial lifestyle, from wood-burning to coal-burning.

Thinking Critically about Art
What do you think is going on in this painting?
What do you see that makes you think that?
Scored on 7 Item Rubric
Observing
Interpreting
Evaluating
Associating
Problem Finding
Comparing
Flexible Thinking

Thinking Critically About Art
Group Effect Size Group Effect Size
Full Sample +9.1%**
Smaller Towns +33.4%*** Larger Towns +2.5%
> 40 Minutes +33.6%*** < 40 Minutes +1.0%
Higher Poverty +17.9%*** Lower Poverty -1.5%
First Visit +16.6%***

Tolerance
Survey items included in scale
People who disagree with my point of view bother me.
Artists whose work is critical of America should not be allowed to have their work shown in art museums.
I appreciate hearing views different from my own.
I think people can have different opinions about the same thing.

Tolerance
Group Effect Size Group Effect Size
Full Sample +6.8%**
Smaller Towns +13.3%*** Larger Towns +2.8%
> 40 Minutes +16.8%*** < 40 Minutes +2.6%
Higher Poverty +9.2%** Lower Poverty +0.8%
First Visit +4.0%

“Artists whose work is critical of America should not be allowed to have their work shown in art museums.”
Group Treatment Control Difference
Full Sample 31.9% 34.7% -2.8%***
Smaller Towns 30.2% 33.9% -3.6%*
Larger Towns 33.0% 35.2% -2.2%*
> 40 Minutes 28.1% 34.4% -6.3%**
< 40 Minutes 33.7% 34.9% -1.2%
Higher Poverty 31.6% 37.0% -5.3%***
Lower Poverty 33.2% 29.8% +3.3%***
First Visit 34.5% 35.8% -1.4%

Historical Empathy
Survey items included in scale
I have a good understanding of how early Americans thought and felt.
I can imagine what life was like for people 100 years ago.
When looking at a painting that shows people, I try to imagine what those people are thinking.

Historical Empathy
Group Effect Size Group Effect Size
Full Sample +5.9%**
Smaller Towns +15.0%*** Larger Towns +0.2%
> 40 Minutes +13.8%*** < 40 Minutes +0.6%
Higher Poverty +4.6% Lower Poverty +7.6%
First Visit +12.2%***

“I have a good understanding of how early Americans thought and felt.”
Group Treatment Control Difference
Full Sample 69.7% 65.5% +4.1%***
Smaller Towns 68.8% 61.8% +7.0%***
Larger Towns 70.3% 68.0% +2.3%*
> 40 Minutes 71.0% 63.7% +7.3%***
< 40 Minutes 69.6% 67.1% +2.6%
Higher Poverty 69.7% 66.5% +3.1%**
Lower Poverty 69.7% 63.5% +6.3%*
First Visit 69.3% 63.4% +5.9%***

Cultivating a Taste for Art Museums
Survey items included in scale
I plan to visit art museums when I am an adult.
I would tell my friends they should visit an art museum.
Trips to art museums are interesting.
Trips to art museums are fun.
Would your friend like to go to an art museum on a field trip?
Would you like more museums in your community?
How interested are you in visiting art museums?
If your friends or family wanted to go to an art museum, how interested would you be in going?

Cultivating a Taste for Art Museums
Group Effect Size Group Effect Size
Full Sample +8.0%**
Smaller Towns +22.4%*** Larger Towns +1.6%
> 40 Minutes +20.7%*** < 40 Minutes +2.7%
Higher Poverty +11.0%*** Lower Poverty +4.0%
First Visit +16.8%***

“I would tell my friends they should visit an art museum.”
Group Treatment Control Difference
Full Sample 69.8% 65.7% +4.1%***
Smaller towns 72.5% 62.6% +9.9%***
Larger towns 68.5% 67.1% +1.5%
> 40 Minutes 74.3% 65.1% +9.2%***
< 40 Minutes 67.9% 66.1% +1.9%
Higher Poverty 73.7% 67.6% +6.1%***
Lower Poverty 63.4% 62.2% +1.1%
First Visit 70.1% 63.5% +6.6%***

Behavioral Measure
Treatment Observed Rate
Treatment Expected Rate
Treatment Effect
Total People 57.8% 48.8% +9.0%***
Adults 58.0% 48.8% +9.2%***
Students 57.4% 48.8% +8.6%**

Policy Implications
Visits to cultural institutions have significant benefits for students.
Policymakers need to ensure that schools have resources to take their students on tours of cultural institutions.
School administrators need to decide to use their resources and time for these tours.
Philanthropists need to build and maintain these cultural institutions with quality educational programs.
We need more rigorous research on the effects of culturally enriching experiences on students.

Other Projects
Walton Arts Center
Evaluation of cumulative effect of field trips on students
Museum of Discovery
Measuring effect of field trips on student desire to consume and produce science as well as their factual knowledge about science
Crystal Bridges 2.0
Examination of “spill-over” benefits of school tours on community attendance at museum
Long term evaluation of virtual education program targeted toward rural students