Embed Size (px)
Citation preview

Digital storytelling for enhancing studnets academic achievement, critical thinking, and learning motivation: A year-long exerimental study
Presenter: Ellie Lin Instructor: Teresa Hsu Date: Apr 27, 2015 1

2
Citation
Wu, W. C., & Yang, Y. T. (2011). Digital storytelling for enhancing student academic achievement, critical thinking, and learning motivation: A year-long experimental study. Computer & Education, 59, 339-352.

3
Contents
• Introduction
• Method
• Results and discussion
• Conclusion
• Reflection

4
Definition of terms
DST Digital storytelling
ITII Information technology
integrated instruction

Introduction
• Background• Digital storytelling (DST)• DST & academic achievement• DST & critical thinking• DST & learning motivation• Purpose of study• Research questions
5

Background
Digital stories allow opportunities for students control of the learning process and self-expression, fostering learning confidences, task value; and learning motivation.
(Wu & Yang, 2011 )
6

DST
Digital storytelling takes the ancient art of oral storytelling and engages a palette of technical tools to weave personal tales using images, graphics, music, and sound mixed together with the author’s own story voice.
(Porter, 2005)
7

DST & academic achievement
It has been demonstrated that an early stage of learning acquisition, academic achievement correlates positively with the oral behaviors of repeating, chanting and singing.
(Ellis, 1993; Gomez, Arai & Lowe, 1995; Schank, 1990; Tsou, 2003)
8

DST & critical thinking
With a critical theorizing process and reflection skills, storytellers should have deduction and interpretation skills to create dramatic digital stories in order to persuade their audience.
(Wu & Yang, 2011)
9

DST & learning motivation
Enhancing students’ motivation is always the key factor of leaning language. By offering meaningful curriculums, students can gain knowledge of task value and self-efficacy.
10

Purpose of study
To examine the comparison between digital
storytelling(DST) and information
technology integrated instruction(ITII) with
innovative technology strategies
11

Research questions
1. Will there be any difference in academic achievement between classes taught under different levels of ITII (lecture-type ITII and digital storytelling DST)?
2. Will there be any difference in critical thinking between classes taught under different levels of ITII (lecture-type ITII and DST)?
3. Will there be any difference in learning motivation between classes taught under different levels of ITII (lecture-type information technology integrated instruction ITII and DST)?
12

Method
• Participants
• Independent variable
• Dependent variable
• Research procedures
13

14
Participants
110 senior high school students
Entrance exam results below the national average
Two 10th grade English classes
Comparison group(ITLL) 56
Experimental group(DST) 54
The proportion of M & F is 1:2
Groups of seven
15
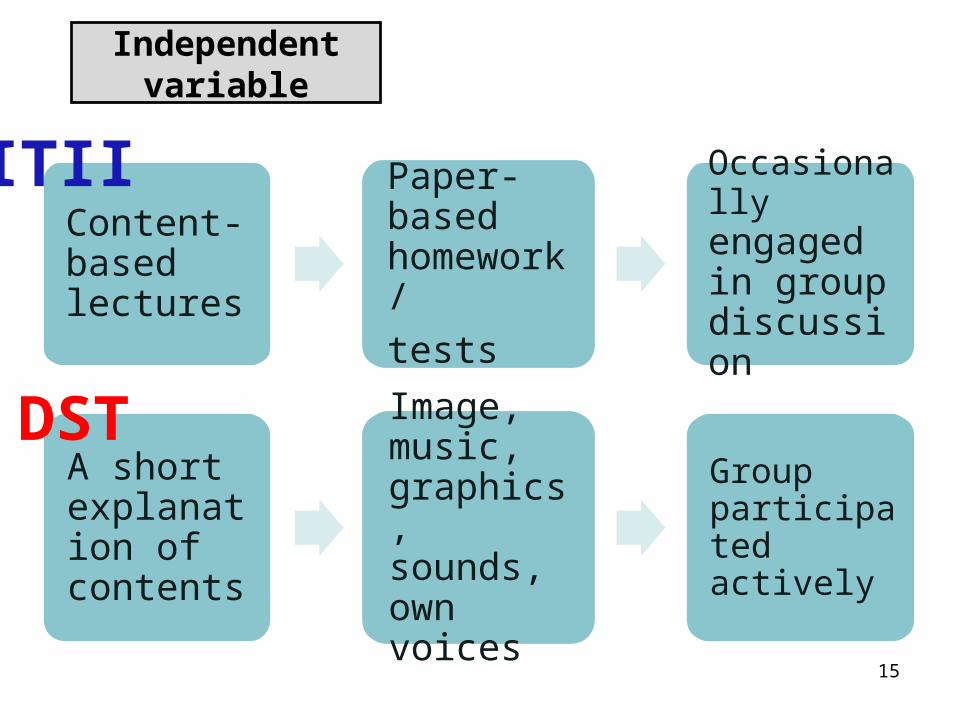
Independent variable
Content-based lectures
Paper-based homework/
tests
Occasionally engaged in group discussion
A short explanation of contents
Image, music, graphics, sounds, own voices
Group participated actively
ITII
DST

Independent variable
Table 1 Class activities and time allocation for the two levels of ITIIClass activities
Comparison group ( lecture-type ITII)
Time allocation
Experimental group (DST) Time allocation
Instruction Instructor provides leading Qs
5% Instructor provide leading Qs. 5%
Instructor presents course content with PPT & textbook.
75% Instructor presents course content with PPT & textbook.
5%
Student tasks Students collaborate on team work
10% Students collaborate on DST project (pre-production, production, post-production, & distribution
70%
Student presentations
Students present their team work
5% Students present their DST project & post it to the class blog, accessible for a global audience.
10%
Instructor provides feedback on students’ presentation
5% Whole class provides feedback for the DST presentations
10%
16
17
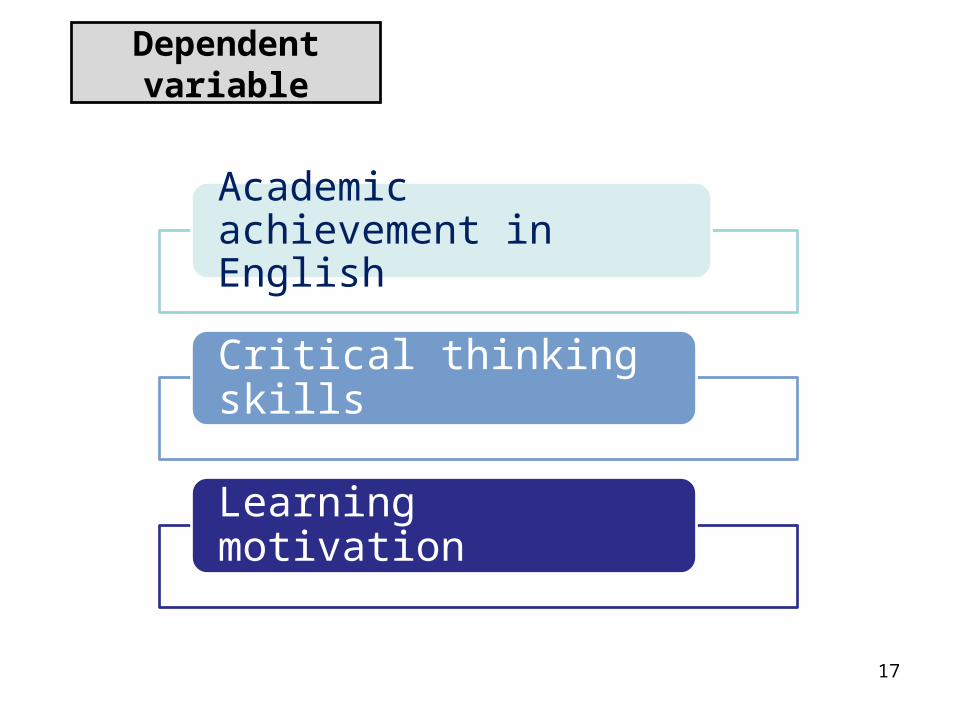
Dependent variable
Academic achievement in English
Critical thinking skills
Learning motivation

18
Dependent variable
Vocabulary
20 scores
Grammar
20
Listening
20Reading
20
Writing
100-word 0~5
ANENGLISH
ACHIEVEMENT TESTEAT

19
Dependent variable
Recognition of
assumption 5
Induction
5 scores
Deduction
5
Interpretation
5
Evaluation of
arguments 5THE
CRITICAL THINKING TEST-LEVEL Ӏ
CTT- Ӏ

20
Dependent variable
Task
Value
6 items
Self-efficacy
5 items
The motivation
strategies for learning
questionnaire
(MSLQ)

Research procedures
Duration 22 weeks
10-week lesson plan
& one class activity
Twice a week
45-min per
session
21

22
Comparison
Discussed questions from the textbook
Wrote a composition as collaborative homework
Presented their work with presentation software
Experiment
Collaboratively created digital stories
Encouraged groups’ contribution & participation
1. Course content 2. Instructor
3. Schedule 4.Examinations

Results & discussion
• Academic achievement in English
• Critical thinking
• Learning motivation
23

Academic achievement in English
Table 4 Descriptive statistics for English academic achievement
EAT (maximum score
Comparison group Experimental group
Pretest Posttest Pretest Posttest
M SD M SD Adj.M M SD M SD Adj.M
Vocabulary(20)
9.29 3.76 14.14 4.67 14.82 10.59 4.34 16.67 2.77 15.96
Grammar(20)
8.39 2.97 12.82 4.17 13.98 12.48 3.27 16.67 2.88 15.47
Listening(20)
12.05 5.46 9.73 5.43 10.29 10.65 5.32 14.26 4.99 13.68
Reading(20)
7.68 3.14 7.61 4.75 8.75 10.67 3.30 12.93 4.34 11.74
Writing(20)
3.14 4.40 1.76 4.03 2.35 8.86 6.08 11.29 4.72 10.68
Total score(100)
40.55 9.88 46.06 16.16 49.93 53.25 13.17 71.81 12.74 67.80
24

25
Academic achievement in English
Table 5 ANCOVA summary table for English academic achievement
SV SS¹ Df MS¹ F p
Pretest EAT 5602.38 1.00 5602.38 34.50 .00*
Between (Group)
6727.71 1.00 6727.71 41.43 .00*
Within(Error)
17373.36 107.00 162.37
Total 420220.00 110.00
Corrected total
41194.10 109.00
*P < .05. A difference in EAT posttest scoresSignificant

Academic achievement in English
ᴥTable 6 MANCOVA summary table for English academic achievementSV Df SSCP¹ Wilks¹⩘
Between 1 169.2456.6773.95149.13414.74
56.6718.9824.7649.94138.88
73.9524.7632.3165.17181.23
179.1349.9465.17131.41365.47
414.74138.88181.23365.471016.41
.62*
Covariance 5 274.82249.02238.81282.06153.22
249.02305.93305.36263.51130.66
238.81305.36366.88315.90118.64
282.06263.51315.90434.37206.21
153.22130.66118.64206..21162.04
.56*
Within 10 2666.54309.80380.18549.08307.15
309.801300.93648.07554.30385.94
380.18648.031031.34556.8466.12
549.08554.30556.811806.70337.14
307.15385.9466.12337.141910.26
*P < .05 26
Sig.
Posttest scores on the five subscales
1. Will there be any difference in academic achievement between classes taught under different levels of ITII (lecture-type ITII and DST)?

27
Academic achievement in English
*P < .05
Table 7 Post hoc comparison for subscales of English academic achievement
Subscales Comparison of group
Mean difference
95% Confidence interval Direction of difference
Lower bound
Upper bound
Vocabulary E-C 1.14 -.70 2.98 E = C
Grammar E-C 1.49 -.15 3.13 E = C
Listening E-C 3.40* .76 6.04 E > C
Reading E-C 3.00* .82 5.17 E > C
Writing E-C 8.33* 6.10 10.56 E > C
Three subscales differed between two groupsSignificantly

Critical thinking
Table 8 Descriptive statistics for critical thinkingCTT-I (maximum score)
Comparison group Experimental group
Pretest Posttest Pretest Posttest
M SD M SD Adj.M M SD M SD Adj.M
Recognition of assumption (5)
4.20 .82 4.30 .74 4.30 4.17 .72 4.33 .64 4.33
Induction (5) 3.86 1.09 4.00 .91 4.00 3.87 1.03 4.19 .85 4.19
Deduction (5) 4.14 .88 4.11 1.00 4.12 4.13 .87 4.33 .73 4.32
Interpretations (5)
3.32 1.18 3.46 1.22 3.42 3.02 1.16 3.83 .93 3.88
Evaluation of arguments (5)
2.48 1.13 2.48 1.25 2.46 2.17 1.09 3.28 1.12 3.30
Total score (25)
18.00 3.21 18.36 3.04 18.22 17.35 2.66 19.96 2.29 20.11
28

29
Critical thinking
Table 9 ANCOVA summary table for critical thinkingSV SS¹ Df MS¹ F p
Pretest 178.13 1.00 178.13 31.42 .00*
Between 96.77 1.00 96.77 17.07 .00*
Within 606..65 107.00 5.67
Total 41176.00 110.00
Corrected total
855.67 109.00
*P < .05
SignificantA difference in critical thinking scores between groups

ᴥTable 10 MANCOVA summary table for critical thinkingSV Df SSCP¹ Wilks¹
Between 1 .03.16.17.37.68
.16
.981.062.354.29
.171.061.142.534.60
.372.352.535.6410.26
.684.294.6010.2618.68
.85*
Covariance
5 7.387.424.053.584.32
7.4214.729.4714.369.51
4.059.479.178.893.19
3.5814.368.8926.219.74
4.329.513.199.7410.54
.53*
Within 103 44.462.25-4.875.532.43
2.2569.436.2010.325.71
-4.876.2074.1917.321.92
5.5310.3217.32101.2221.23
2.485.711.9221.23142.28
Critical thinking
*P < .05 30Posttest scores on the five subscales of CTT-I
2. Will there be any difference in critical thinking between classes taught under different levels of ITII (lecture-type ITII and DST)?
Sig.

31
Critical thinking
*P < .05
Table 11 Post hoc comparison for subscales of critical thinkingSubscales Comparison
of groupMean difference
95% Confidence interval Direction of difference
Lower bound
Upper bound
Recognition of assumptions
E-C .03 -.22 .28 E = C
Induction E-C .09 -.12 .51 E = C
Deduction E-C .21 -.12 .53 E > C
Interpretation E-C .46* .08 .84 E > C
Evaluation of arguments
E-C .84* .39 1.29 E > C
Two subscales differed between two groupsSignificantly

32
Learning motivation
*P < .05
Table 12 Descriptive statistics for learning motivationMSLQ (maximum score)
Comparison group Experimental group
Pretest Posttest Pretest Posttest
M SD M SD Adj.M M SD M SD Adj.M
Task value (36)
26.23 4.05 25.09 4.54 25.67 28.54 3.37 29.43 3.83 28.83
Self-efficacy (30)
16.61 3.80 17.61 4.50 18.28 18.56 4.16 20.57 3.92 19.88
Total score (66)
42.84 6.72 42.70 7.90 44.01 47.09 6.20 50.00 6.80 48.64
The mean scores of the experimental group on both pre/post tests

33
Learning motivation
*P < .05
Table 13 ANCOVA summary table for learning motivationSV SS¹ Df MS¹ F p
Pretest 1791.16 1.00 1791.16 46.83 .00*
Between 530.50 1.00 530.50 13.87 .00*
Within 4092.68 107.00 38.25
Total 242971.00 110.00
Corrected total
7350.26 109.00
A difference in the total scores between two groupsSignificant

34
Learning motivation
*P < .05
ᴥTable 14 MANCOVA summary table for learning motivationSV Df SSCP¹ Wilks¹⩘
Between 1 246.81125.15
125.1563.46
.86*
Covariance 2 331.66389.60
389.60801.76
.52*
Within 106 1582.10632.16
632.161124.81
Posttest scores of the two subscales of MSLQ
3. Will there be any difference in learning motivation between classes taught under different levels of ITII (lecture-type ITII and DST)?
Sig.

35
Learning motivation
*P < .05
Table 15 Post hoc comparison of learning motivationSubscales Comparison
of groupsMean difference
95% Confidence interval
Direction of difference
Lower bound
Upperbound
Task value
E > 0 3.16* 1.62 4.70 E > 0
Self-efficacy
E > 0 1.60* .30 2.90 E > 0
Both subscales differed between two groupsSignificantly

ConclusionWith such the interesting and challenging
digital storytelling curriculum, students can
be profoundly impressed on their potential
capacity for language learning talent and
higher order thinking skills.
36

37
Reflection
Technology and language learning can form a combination to enhance one’s problem solving skills and higher level thinking abilities in order to survive the daily life.

38
Thank you

39
“ Have the courage to
follow your heart and
intuition. They somehow
know what you truly
want to become.”