Embed Size (px)
Citation preview
i
ENVIRONMENTAL AND SOCIO-ECONOMIC
EFFECTS OF ARTISANAL MINING IN OKE-OGUN
REGION
BY
OPARA MICHAEL OBINNA
170723
A FIELDWORK REPORT SUBMITTED TO THE DEPARTMENT OF
GEOGRAPHY, FACULTY OF THE SOCIAL SCIENCES, UNIVERSITY
OF IBADAN, IN PARTIAL FULFILMENT OF THE REQUIREMENTS
OF THE COURSE, GEO 385
MARCH,2016
ii
ENVIRONMENTAL AND SOCIO-ECONOMIC EFFECTS OF
ARTISANAL MINING IN OKE-OGUN REGION
BY
OPARA MICHAEL OBINNA
170723
iii
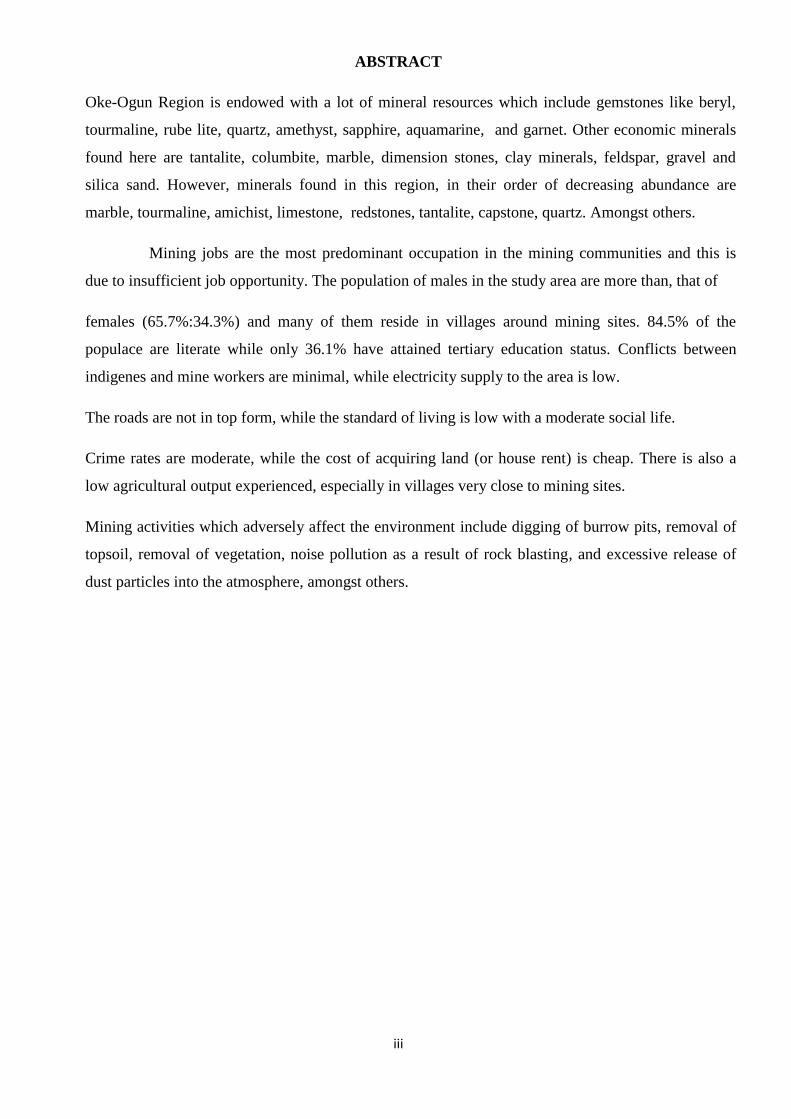
ABSTRACT
Oke-Ogun Region is endowed with a lot of mineral resources which include gemstones like beryl,
tourmaline, rube lite, quartz, amethyst, sapphire, aquamarine, and garnet. Other economic minerals
found here are tantalite, columbite, marble, dimension stones, clay minerals, feldspar, gravel and
silica sand. However, minerals found in this region, in their order of decreasing abundance are
marble, tourmaline, amichist, limestone, redstones, tantalite, capstone, quartz. Amongst others.
Mining jobs are the most predominant occupation in the mining communities and this is
due to insufficient job opportunity. The population of males in the study area are more than, that of
females (65.7%:34.3%) and many of them reside in villages around mining sites. 84.5% of the
populace are literate while only 36.1% have attained tertiary education status. Conflicts between
indigenes and mine workers are minimal, while electricity supply to the area is low.
The roads are not in top form, while the standard of living is low with a moderate social life.
Crime rates are moderate, while the cost of acquiring land (or house rent) is cheap. There is also a
low agricultural output experienced, especially in villages very close to mining sites.
Mining activities which adversely affect the environment include digging of burrow pits, removal of
topsoil, removal of vegetation, noise pollution as a result of rock blasting, and excessive release of
dust particles into the atmosphere, amongst others.

iv
DEDICATION
To the Glory of God, The Alpha, The Omega, The Elshaddai; I dedicate this work to my parents, my
sibling and all friends of goodwill; especially those who love Geography.

v
ACKNOWLEDGEMENTS
I thank God Almighty for giving me the grace to complete this work successfully. Next I wish to
express my profound indebtedness to our fieldwork supervisors; Dr O.J Taiwo, Dr Olutoyin Fashae,
Dr F.A Olaniyan, Mr H.D Olaniran, and Mr T.O Osayomi , for creating time out of their busy
schedule to accompany us for the fieldwork.
I also acknowledge my fellow course mates for conducting themselves properly throughout the
duration of the fieldwork. Not forgetting the drivers who were patient in conveying us to different
locations for the three days.
Next, I thank some of my colleagues who were members of the fieldwork organizing committee;
Yemi, Samuel, Temi, Aanu, Cindy, Esther, Ayo, and Rotimi for a job well done in terms of a perfect
organization, before, during and after the fieldwork.
All good efforts are appreciated. May God continue to shower his blessings on all of you. Amen.
OPARA MICHAEL OBINNA
vi
TABLE OF CONTENTS
Title Page………………………………….………..…………………………………
Abstract…………………………………………………………………………… …
Dedication………………………………………………………………………………
Acknowledgement…………………………………………………………………….. .
Table of Contents………………………………………………………………...
List of Tables……….……………………………………………………………..
List of Figures…………………………………………………………………..…..
CHAPTER ONE: INTRODUCTION.
1.1. Background of Study………… …………… …… …………
1.2. Statement of the Problem….……………. ………… ………… …. .
1.3 Aims and Objectives of the Study…………………………………………….
1.4. The Study Area …………… …… ………… ………… …..
1.5. History of Mining in the Study Area: …………… …… …………
1.6. Structure of this Report …………… …… ………… ……
1.7 Hypothesis of the Study …………………………………………………….
CHAPTER TWO: CONCEPTUAL FRAMEWORK AND LITERATURE REVIEW
2.1 Introduction……………………………………………………….… .. …
2.2. Conceptual Framework: Framework of Environmental Sustainability……
2.2.1 Concept of Environmental Risk Cells………………………………………
2.3 Literature Review: An Overview of the Nigerian Minerals and Mining Acts 2007…
2.3.1 Mineral Titles…………………………………………………………………
2.3.2 A Reconnaissance Permit…………………………………………………….
2.3.3 An Exploration Licence……………………………………………………….
2.3.4 A Small Scale Mining Lease………………………………………………….
2.3.5 A Mining Lease…………………………………………………………………
2.3.6 A Quarrying Lease……………………………………………………………….
2.3.7 A Water Use Permit………………………………………………………………
2.3.8 Environmental Considerations and Rights of Host Communities …………….
2.4 The Resource Curse Phenomenon. …… ……… ……….…… ………..
2.5 The Impact of Artisanal Mining on the Environment………… …… ……..
2.6 Socio-Economic Impacts of Artisanal Mining. …… ……… ………..……
vii
CHAPTER THREE: RESEARCH METHODOLOGY.
3.1. Introduction……………………… …… ……… … ….……............
3.2 Research Design…………………… …..…….…... …………………
3.3 Types and Sources of Data………… …… …… ……... ……………..
3.3.1. Primary Data…………………… …..… ….…... ……..… ………
3.3.2 Secondary Data…………………… .. …..…….…... ……….. ………
3.4 Sampling Techniques and Data Collection Procedure ……………………
3.5: Data Analysis. …………………… …….…... …..................................
3.6 Limitations of Data Sources. …………………… …….…………………
CHAPTER FOUR: RESULTS AND DISCUSSION
4.1. Introduction …………. …… …… ….. .…………
2 Demographic Characteristics of Respondents………………….…... ……..
4.3 Socio-economic Impact of Mining Activities……………………………………
4.4 Environmental Impact of Mining Activities ……………………………………..
4.5 Hypothesis Testing………………………………………………………………..
CHAPTER FIVE: SUMMARY, CONCLUSIONS AND RECOMMENDATIONS
5.1 Summary………………………………………………………………………...
5.2 Conclusions…………………………………………………………………..…
5.3 Recommendations………..………………………….. …………………..
Reference
Appendix
viii
LIST OF TABLES
Table 3.4.1 Place of Residence of Respondents.
Table 4.2.1 Gender of Respondents.
Table 4.2.2 Place of Residence of Respondents.
Table 4.2.3 Type of Residential Location.
Table 4.2.4 Community Type.
Table 4.2.5 Educational Status.
Table 4.2.6 Type of Mining Workers.
Table 4.2.7 Descriptive Statistics.
Table 4.3.1 Frequency Analysis of Socio-economic Impact of
Mining Activities.
Table 4.4.1 Frequency Analysis of Environmental Impact of
Mining Activities.
Table 4.4.2 Has there been any loss of relative as a result of mining?
Table 4.4.3 Has the state government indicated interest in the mining
of minerals?
Table 4.4.4 Problems involved in Mining.
Table 4.4.5 Disease Frequencies.
Table 4.5.1 ANOVA Table.
Table 4.5.2 Paired Sample Statistics.
Table 4.5.3 Paired Sample Test.
Table 4.5.4 Correlation.
Table 4.5.5 Chi-Square Test.
ix
LIST OF FIGURES
Figure 1.4.1 Map of Oyo State Showing 10 L.G.A‟s that Make-up Oke-
Ogun Region.
Figure 1.4.2 Pile of White Marbe at Igbetti.
Figure 1.4.3 A Mining Pit
Figure 4.2.1 Marital Status of Respondents.
Figure 4.2.2 Occupation of Respondents.
Figure 4.2.3 Reasons for Quitting Former Jobs.
Figure 4.2.4 Abundance Level of Minerals being mined.
Figure 4.4.1 What steps is government taking towards exploiting this
minerals for the development of this community?
Figure 4.5.1 Occupation of Respondents.
10
CHAPTER ONE
INTRODUCTION
1.1 Background of Study
Broadly speaking, artisanal and small-scale mining (ASM) refers to mining by individuals, groups,
families or cooperatives with minimal or no mechanization, often in the informal sector of the market.
Despite many attempts, a common definition of ASM has yet to be established. In some countries a
distinction is made between „artisanal mining‟ that is purely manual and on a very small scale, and
„small-scale mining‟ that has some mechanization and is on a larger scale. In some West African
countries (for example, Mali), small-scale mining is differentiated from artisanal mining by the presence
of permanent, fixed installations that are established once an ore body is confirmed
Nevertheless, ASM is characterized by a number of conditions:
Lack of or limited use of mechanization, and a lot of physically demanding work.
Low level of occupational safety and health care.
Poor qualification of personnel at all levels of the operation.
Inefficiency in exploitation and processing of mineral production (low recovery value).
Exploitation of marginal and/or very small deposits, which are not economically exploitable by
mechanized mining.
Low level of productivity.
Low level of salaries and income.
Periodic operation by local peasants by season or according to the market price development.
Lack of social security.
Insufficient consideration of environmental issues.
Chronic lack of working and investment capital.
Majority of the earth crust in the Oke-Ogun region is overlain with pegmatite. Pegmatite are
found to possess various gemstones like beryl, tourmaline, rube lite, quartz, amethyst, aquamarine,
garnet, and other economic minerals like tantalite, columbite, clay minerals, feldspars, construction
gravels and silica sand. “The increase in global demand for these economic minerals has led to keen
interest in prospecting for mineral deposits from different areas of south western Nigeria” (Okunlola and
Oyedokun, 2009). Pegmatite are important because they are classic source of broad spectrum of rare
11
earth elements such as Lithium (Li), Rubidium (Rb), Caesiun (Cs), Berylium (Be), gallium (Ga),
Scandium (Sc), Yttrium (Y), Tin (Sn), Niobium (Nb), Tantalum (Ta), Uranium (U) and Thorium (Th) .
1.2 Statement of the Problem
In Nigeria, the most commonly talked about environmental impacts have been on the oil producing
region of the Niger-Delta where agricultural, surface and underground water resources have been badly
affected. However, artisanal mining of solid minerals pervade the entire country leaving behind their
effects on the environment. Most of these artisanal miners (men, women and children) are rural and poor
and usually work without legal mining title. Their activities include mining of gemstones like tourmaline,
beryl, amethyst, aquamarine and garnet and precious minerals like gold. It also includes mining of other
minerals like columbite, tantalite and cassiterite. Mining of river sands, digging of burrow pits, removal
of topsoil, sand and laterite for building purposes are also carried out. Other activities include removal of
vegetation and cleaning of dams to produce dam sands. These arrays of activities lead to uncoordinated
and unregulated mining which usually result in haphazard extraction of the minerals and eventual
destruction of the environment. Evidences of such destruction are observed in the form of soil erosion,
and, change in topography, and water pollution and dumps of overburden material. The resultant effects
of abandoned pits and other mining sites that becomes flooded during the raining season pose health
dangers to the citizens. All these impact negatively on and degrade the environment.
“Mining extraction comes at a cost to environment, community health and with social consequences,
most of which are borne by mining host communities. At the core of planning and implementation in the
mining sector, there must be a deliberate attention to the protection of the rights of mining host
communities”(Abiodun Baiyewu, 2014)
In spite of high revenues generated from extractive activities, socio-economic development in
the host communities is not commensurate by any standard. Most residents complained that mining have
done little to enhance their economic, social and infrastructural development. At Komu where a
gemstone mining camp is located for example, there is a noticeable absence of governmental presence
evidenced by the abysmal level of infrastructural development in and around the camp. The community
lacks good roads, portable water, a functional healthcare centre, power supply and telephone services.
There are also myriads of health challenges that these communities face, such as, asthma, chronic
bronchitis, and pneumoconiosis which are due to air effluent and dust pollution. Noise pollution due to
rock blasting has causeeded a varying degree of deafness and stress related disorders and water pollution
causing outbreaks of cholera and other water borne ailments.
12
1.3 Aims and Objectives of the Study
The principal study aim of this research is to; investigate the environmental and socio-economic effect of
artisanal mining in Oke-Ogun region on people‟s livelihood.
In order to achieve the aim above, the research is structured around two specific objectives.
(1). To locate certain communities located around mining areas in order to conduct a firsthand assessment
of the impacts of mining in these areas.
(2). To conduct a credible survey in these areas, of how mining activities have affected the environment
and the people living in these areas.
1.4 The Study Area
Oke-Ogun is situated entirely within the north side of Oyo State in Nigeria. It is located at an elevation of
188 meters above sea level and its population amounts to 174,153. Oke-Ogun is made up of 10 out of the
33 local government areas in Oyo State, which include; Irepo, Orelope, Olorunsogo, Saki East, Saki
West, Atisbo, Itesiwaju, Kajola, Iseyin and Iwajowa. Oke-Ogun makes up 60% of total land mass of
Oyo State and is fondly referred to as the “food basket of Southwestern Nigeria”. Oke-Ogun area is
situated between Oyo and the present Kwara state. The area starts from Iseyin and ends in Bakase, a
small town along the boundary of Oyo State and Kwara State.
Communities where artisanal and small scale mining (ASM) is being carried out in Oke-Ogun region of
Oyo State include Igbetti (in Olorunsogo L.G.A). Others are Komu, Igbojaiye , (in Itesiwaju L.G.A) ,and
Ofiki (in Atisbo L.G.A)
The mining sites at Igbojaiye are Balogun Ojo, Ibudo Are and Ibudo Fulani. The mining site at Ofiki is at
Iluku while the mining site at Komu is at Agate and Abuja Leather.
13
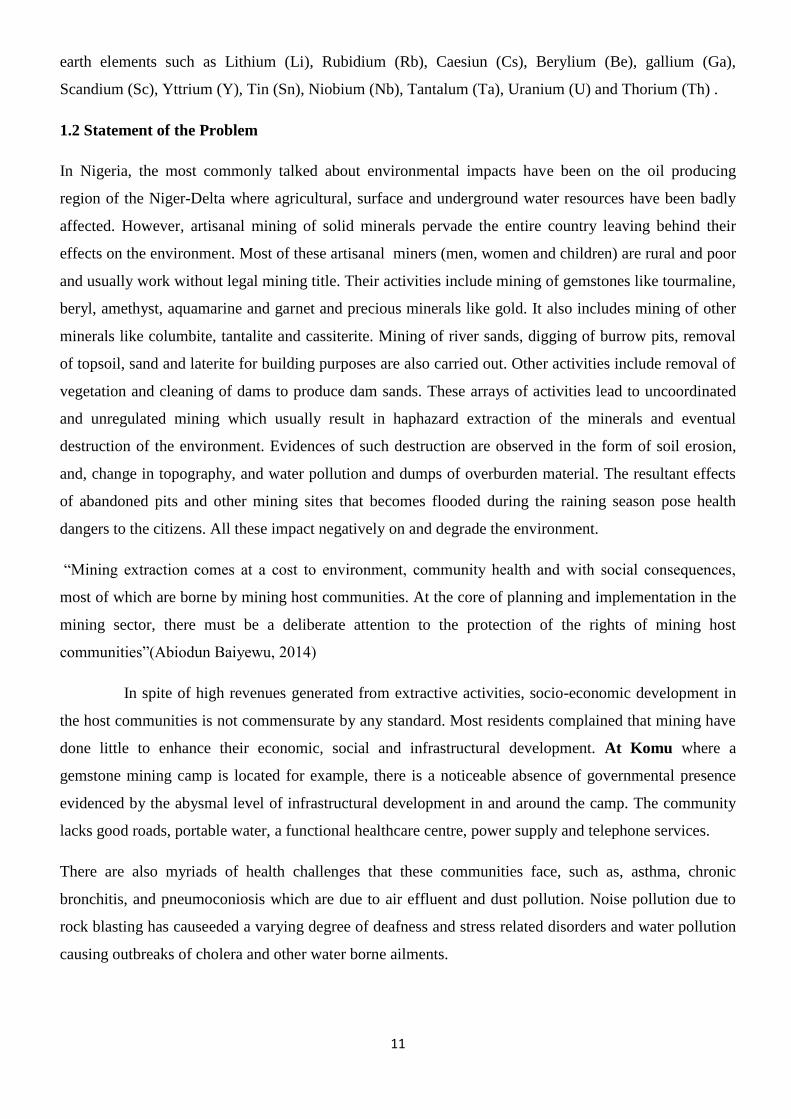
Figure 1.4.1: MAP OF OYO STATE SHOWING 10 L.G.A’s THAT MAKE UP OKE-OGUN
REGION
Source: Environment Systems Research Institute (ESRI) Database.
However, two mining locations were visited for the purpose of this study. These are Igbetti and
Komu.
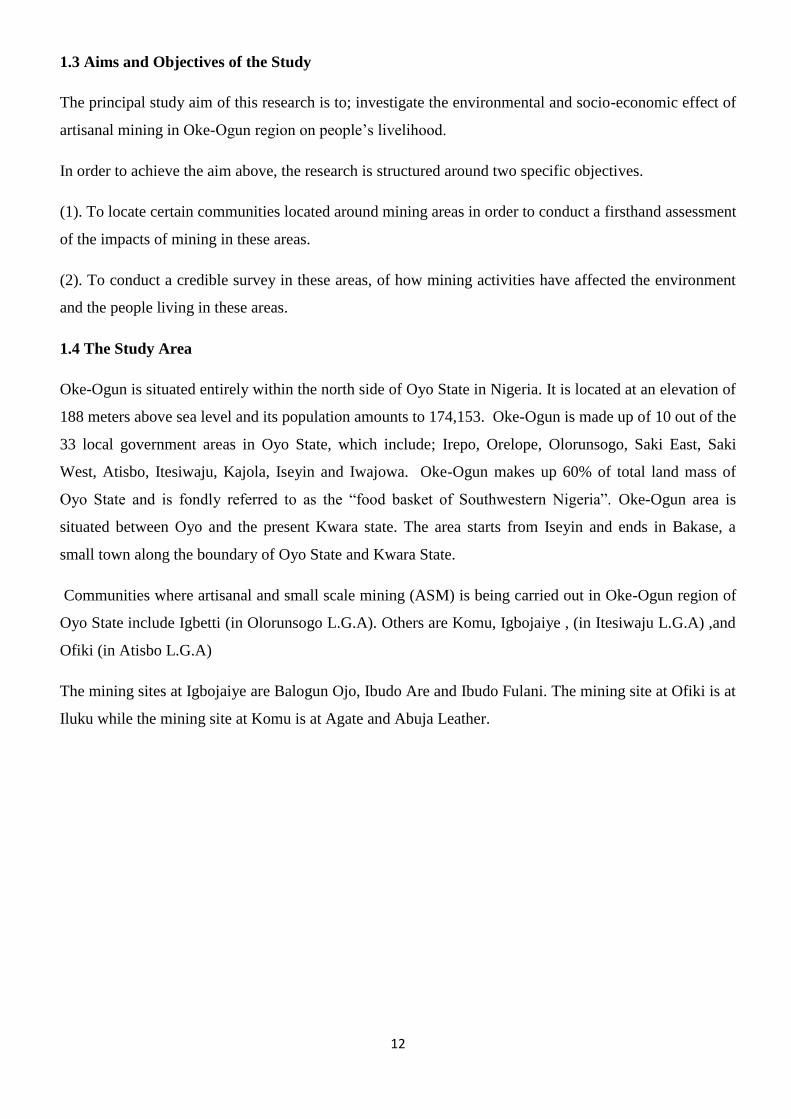
Igbetti lies within latitude 8 40 and 9 05 North, longitude 3 45 and 4 15 East in Olorunsogo L.G.A of
Oyo State. It has a large deposit of marble. Marble is formed from limestone as a result of heat and
pressure in the earth crust causing a change in texture and make-up of the stone. It has been highly valued
for its beauty, strength and resistance to fire and erosion and is used in construction of statues, columns,
floors and other parts of buildings. They can also be crushed and used as abrasives in soaps and other
14
such products. Crushed or ground marble can also be used in paving roads and in manufacturing roofing
materials and soil treatment products.
Figure 1.4.2: Pile of white marble at Igbetti.
Source: Fieldwork (2015)
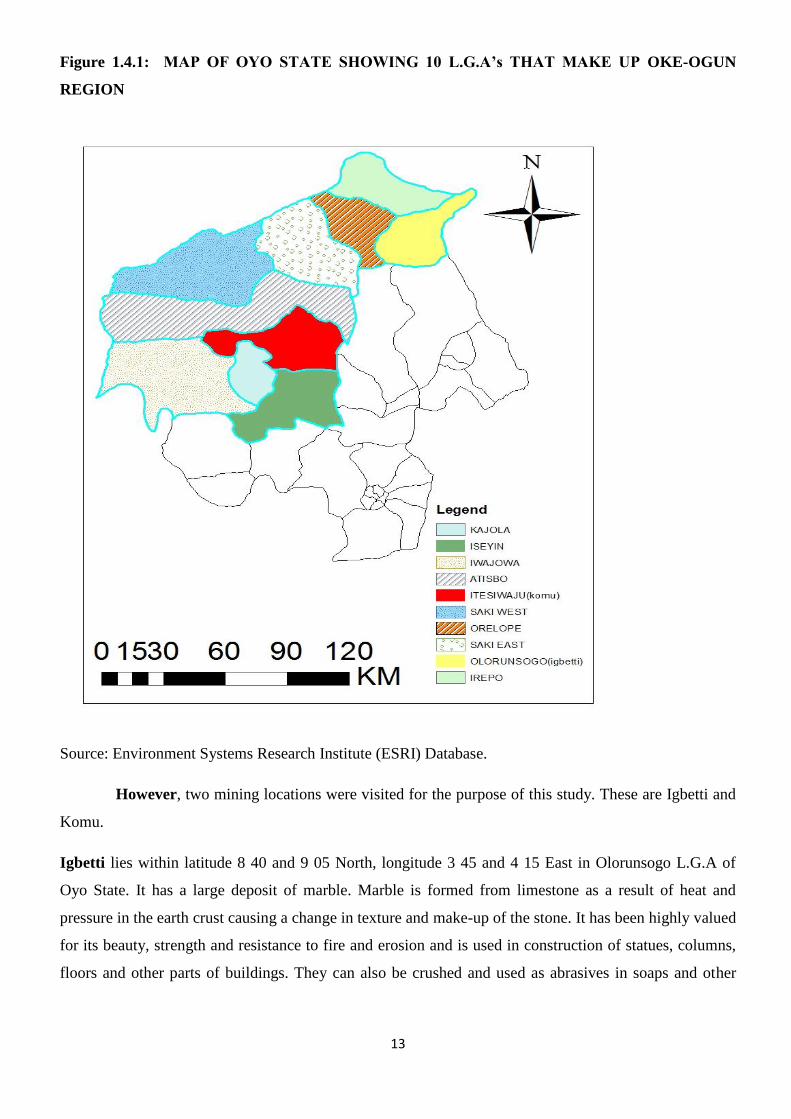
Komu, on the other hand, is located in Itesiwaju L.G.A, at latitude 8 20 North and longitude 3 2 30 East.
Komu has two mining sites, which are Agate and Abuja Leather. The area is rich in pegmatite, which is a
host rock to many gemstones like tourmaline, rube lite, quartz, garnet etc.
Figure 1.4.3: A mining pit
15
1.5 History of Mining in the Study Area
Post-colonial peasant mining started in Southern Kaduna (Goma Lafia and Kafanchan) at Jamaa Local
Government Area in the late 1970s. New mining sites were discovered in Borno state; Idoyi and Okene
in Kogi state; Keffi in Nassarawa state and Ijero-Ekiti, Ekiti state in the 1980s.
When the precious stones became scarce in Northern Nigeria, peasant miners and West African „stone
boys‟(gemstone buyers from other West African contries) migrated southwards to new mining frontiers
in Ibadan, Oyo State in 1993. Gemstones were discovered at Olode, Ibadan in commercial quantities.
Mining activities also started in Komu along the Oyan River.
The new mining frontiers motivated migration of the “stone boys” to the hinterland areas,
about 200 kilometres from Ibadan. They established major mining camps at Agate and Abuja Leather
about 27 kilometers from Komu, Itesiwaju Local government; and Ofiki in Atisbo local government.
Abuja Leather was developed by the massive influx of the miners. In July 1998, Ofiki and Igbojaiye
areas were swamped by “stone boys” when other mines were discovered at Ibudo Are (Igbojaiye area)
about 3 miles from Komu. The new mining sites were discovered by Fulani pastoralists (called
pathfinders). The discovery and mining of gemstones in Komu led to controversies over land acquisition
as miners fiercely protected their “territories”.
Komu was opened up to influx of migrants from various parts of Nigeria and West Africa.
The population explosion led to unplanned expansion of the community in which socio-economic lives
were dislocated. Local youths and women abandoned farming for „emergency mining.‟ Among the
“stone boys”, Senegalese and Malians were the pioneers
The major gemstones in Oyo state exported by West African immigrant entrepreneurs included:
Tourmalin-Red, Blue, Yellow and Ruby Lite; Quartz; Ganet-Red and Yellow; and Tantalite (not
gemstone but industrial material). These gemstones were largely unknown in Yoruba society where they
exist in commercial quantities. Mining was pioneered by Hausa peasant miners who discovered and dug
the sites. Many of them were involved in accidents while digging pits for gemstones. These retinue of
peasant miners were tolerated by the local population because mining provided greater source of cash for
an impoverished rural economy. The rural population took up the advantage of unprecedented
commercial opportunities created by the new mineral rush.
16
1.6 Structure of this Report
This report is divided into five chapters along conventional lines, which reflects the transition from
introduction to conceptual background, followed by methodological issues to more substantive/empirical
findings and then the conclusion. A summary of the contents of each chapter is presented below.
Chapter one presents a brief introduction to the report providing a background to the artisanal mining
industries and its associated “risks” .The aims and objectives and structure of the report are also
presented.
Chapter two provides a review of the literature on the relationship between resource extraction and
national development and the conceptual framework. Attention is paid to the related discourse on the
“resource curse” and the Nigerian Minerals and Mining Acts 2007. Additionally, the chapter examines
the theoretical and empirical debates concerning the concept of local mining communities and mining
impacts. In short, the literature review highlighted in Chapter Two forms the backdrop against which the
analysis in subsequent chapters is undertaken.
Chapter three presents the research design to examine the impacts of mining in Oke-Ogun region, types
and sources of data, sampling techniques and data collection procedure, data analysis and limitation of
data source. In short, this chapter gives a detailed justification of the methods used.
Chapter four presents the results of analysis and further discussions, including hypothesis testing. The
first section is the demographic characteristics of the respondents, which is followed by; socio-economic
impacts of mining activities, environmental impacts of mining activities and lastly, hypothesis testing.
Chapter five rounds up the essay with summary, conclusion and recommendation.
1.7 Hypothesis of the Study
1. Null hypothesis: There is no significant difference in the respondents‟ income based on their type
of occupation.
Alternative hypothesis: There is a significant difference in the respondents‟ income based on their
type of occupation.
2. Null hypothesis: There is no significant difference between the mean of the respondents‟ income
in his previous occupation and the mean of the respondents‟ income in his present occupation.
Alternative hypothesis: There is a significant difference
17
3. Null hypothesis: There is no relationship between the estimated distance from your residence to
the nearest mining site and the level of environmental impact of mining activities.
Alternative hypothesis: There exist a relationship.
4. Null hypothesis: There is no relationship between the level of socio-economic impact and
occupation.
Alternative hypothesis: There exist a relationship between the level of socio-economic impact and
occupation.
18
CHAPTER TWO
CONCEPTUAL FRAMEWORK AND LITERATURE REVIEW
2.1 Introduction
This chapter reviews the conceptual framework, propositions and practices relating to the key aims of the
research introduced in Chapter One. The major aim of the review is to pull together the relationship
between “resources” and “development” in the literature and locate it within the Nigerian context. The
first section of the chapter is the conceptual framework, which is on framework of environmental
sustainability, and concept of environmental risk cells. The literature review begins with the Nigerian
Minerals and Mining Acts 2007, which is followed by resource curse phenomenon, particularly within
developing countries, with particular emphasis on Nigeria as a resource-cursed economy. After which it
looks into the environmental impacts of artisanal mining, before concluding with the socio-economic
impacts of artisanal mining.
The sequence of the literature review proceeds from a broader perspective to a narrower focus that
matches the aims of the report. This chapter contains varied sources of theoretical and contextual
discussions; further references are contained at the end of the report
2.2 Conceptual Framework: Framework of Environmental Sustainability.
The framework which emerged from the concept of sustainable development. Environmental
sustainability in development has become a cardinal principle in developmental processes all over the
world. The need to plan, organize, control, regulate and manage the available natural resources is vital if
development and growth are to be achieved in a sustainable way. The concept of sustainable development
came into prominence in 1980, when the International Union for the Conservation of Nature and Natural
Resources (IUCN) presented the World Conservation Strategy (WCS) with the overall aim of “achieving
sustainable development through the conservation of living resources”. It became a global tool in 1987,
after publication of the report of the World Commission on Environment and Development (WCED).
The popularly accepted definition of sustainable development is “development that meets the needs of the
present generation without compromising the ability of future generations to meet their own needs”
(WCED 1987). The implication of this definition is that development must not endanger the natural
systems that support life on earth (the atmosphere, water, soils and the living being). The concept has
been put forward as a framework within which we can balance immediate and long-term human demands
and the health of the environment, both now and in the future.
2.2.1 Concept of Environmental Risk Cells
19
The concept of environmental risk cells (ERCs) provides the conceptual basis for this study also. ERCs
indicates that in any settlement, human beings are influenced by artificial factors to such an extent that
indicators of ill-health can be interpreted by considering their living conditions and lifestyle
characteristics. The concept therefore recognizes the important role of human activities in man-
environment interaction (Johnston, 1979). As a result of the ecological dominance of humans over the
environment, the balance between environmental elements as well as between himself and the
environment is altered. The altered environment so created exposes humans to backwash repercussions
(Johnston, 1983; Last, 1998; Enger and Smith, 2002) which informed an aggravation of certain illnesses
and emergence of new ones. In a city for instance, the concentration pollutants or hazards create areas or
zones of varying risks magnitude (risk cells). The regularity of individual‟s interaction with such cells
(zones) of varying hazards (Shannon and Spurlock, 1976) determines their possibility of contacting
diseases. The concept of ERCs assists us to appreciate the fact that particulate matter concentration
constitutes hazards to humans that either work at quarry sites or live in close proximity to quarry sites.
Different ailments, most especially respiratory diseases are risks to which humans exposed to particulates
are likely to contact. Due to the dilution and spread of particulates from quarry sites to other locations,
workers at the quarry are expected to experience multiple episodes of respiratory ailments than people
that live at distances away from the quarry sites. Although, the general approach of public health to
reducing the burden of respiratory tract infection is hinged on controlling indoor and outdoor air
pollution, ERCs concept equally identified frequency of human interaction with zones of high
particulates concentration and the distance of human residence to quarry sites as important factors in
respiratory diseases intervention.
2.3 Literature Review: An Overview of the Nigerian Minerals and Mining Act 2007.
The Nigerian Minerals and Mining Acts 2007 was passed into law on March 16, 2007 to repeal the
Minerals and Mining Act, No. 34 of 1999 for the purposes of regulating the exploration and exploitation
of solid materials in Nigeria.
The Act vests control and ownership of all properties and minerals in Nigeria in the hands of the Federal
Government and prohibits unauthorized exploration or exploitation of minerals. All lands in which
minerals have been found in commercial quantities shall be acquired by the Federal Government in
accordance with the Land Use Act. Property in mineral resources shall pass from the Government to the
person by whom the mineral resources are lawfully won, upon their recovery in accordance with
provisions of the Act.
20
The Act further provides that the use of land for mining operations shall have a priority over other uses of
land and be considered (for the purposes of access, use and occupation of land for mining operations) as
constituting an overriding public interest within the meaning of the Land Use Act. In the event that a
mining lease, a small scale mining lease or a quarry lease is granted over land subject to an existing and
valid statutory or customary right of occupancy, the Governor of the state within which such rights are
granted shall within 60 days of such grant or declaration revoke such right of occupancy in accordance
with the provisions of section 28 of the Land Use Act.
2.3.1 Mineral Titles
The right to search for or exploit Mineral Resources is obtained through one of the following underlisted
mineral titles and engaging in any of these activities without the requisite mineral title or authority is an
offence under the Act.
2.3.2 A Reconnaissance Permit:
This is a non-exclusive permit granted for a period of 1 year renewable annually upon compliance with
relevant provisions of the Act. It permits its holder to search for mineral resources and obtain and remove
surface samples in small quantities over any land which is not already subject to an exploration lease,
small scale mining lease, mining lease or water use permit.
2.3.3 An Exploration License:
This License is granted for the duration of 3 years renewable for further two periods of 2 years each
provided that the holder has complied with his minimum work obligation commitments and other
relevant provisions of the Act. It is granted over land area not exceeding 200 square kilometers which is
not already subject to an existing exploration license, mining lease, small scale mining lease or quarry
lease and provides an exclusive right to its holder to conduct exploration activities upon the land within
the area of his license including but not limited to the right to explore for all mineral resources and to
carry out the operations and work necessary for the achievement of this objective, to take specimens and
samples within specified limits for the purpose of analysis and conducting bulk sampling and trial
processing for determining mining potential. The holder of an exploration license has the exclusive right
to apply for, and to be granted subject to the Act, one or more Small Scale Mining Leases, Mining Leases
or Quarry Leases in respect of any part (s) of the exploration area, upon due compliance with its
exploration obligations under the Act. The holder of an exploration license who sells any mineral
resources as provided for in the Act shall be subject to the payment of royalty as if the mineral resources
sold were obtained under a mining lease.
21
2.3.4 A Small Scale Mining Lease:
A Small Scale Mining Lease covers an area not exceeding 3 square kilometers and requires its holders to
carry out effective rehabilitation of the mined out areas and pay prescribed fees. The Government through
the Ministry shall provide certain extension services to duly registered and performing mining co-
operatives of small scale artisanal miners to include amongst other services prospecting and exploration
services to determine the geological setting, structure, nature of occurrence, quantity and quality of
minerals being mined, provision of environmental impact assessment report and detailed guidelines on
waste and tailing disposal and holding regular workshops to update miners knowledge on legal,
marketing, business skills and infrastructural support.3
2.3.5 A Mining Lease:
This is an exclusive permit granted in respect of an area not exceeding 50 square kilometers which is not
within an exploration license area or a small scale mining area except to the holder of the Exploration
License or Small Scale Mining Lease covering such area. It is granted for a period of 25 years renewable
every 24 years provided the holder has complied with his minimum work obligation commitments and all
other obligations and requirements of the Act. The Lease confers upon the holder the right to among
other things, use, occupy and carry out mineral exploitation within the mining lease area, and market,
sell, export or otherwise dispose of the mineral products resulting from the mining operations. subject to
the provisions of the Act and any other enactment, the exclusivity of the mining lease does not derogate
from the right of the lawful occupier of a licensed area to retain the right to graze livestock upon or to
cultivate the surface of the land in so far grazing or cultivation does not interfere with the mining
operations in such area.
2.3.6 A Quarrying Lease:
This part of the Act applies in relation to all naturally occurring quarriable minerals such as asbestos,
china clay, fuller's earth, gypsum, marble, limestone, mica, pipe clay, slate, sand, stone, late rite, gravel,
which may also be lawfully extracted under mining leases and prohibits every operation for the purpose
of extracting any quarriable mineral from a quarry including sand dredging in the navigable water ways
or else for industrial use without the grant of a lease or license by the Minister under the Act.
A Quarrying Lease is granted in respect of any area of land not exceeding 5 hectares and unless
previously revoked or otherwise determined, remains in force for a period of five years or less from the
date of the grant of the lease and shall then expire unless renewed. The holder is authorized to amongst
other things, carry out quarry operations on the land within the area of the lease, remove and dispose of
any quarriable minerals specified in the lease and do all such things as specified in the Act which may be
necessary or convenient for the carrying out of its quarrying operations.
22
2.3.7 A Water Use Permit:
A Water Use Permit confers on its holder, the right to obtain and use water for its exploration and mining
operations.
2.3.8 Environmental Considerations and Rights of Host Communities.
This provides for the winning of materials [such as salt, soda, potash or galena] by host communities in
relation to areas covered by mining leases; prohibition of mineral exploration in certain areas; reservation
of rights of owner or occupier; payment of surface rents; assessment of various compensations and
payment of same; restoration of mines land; reclamation; Community Development Agreements;
Environmental obligations to include preparation and submission of environmental impact assessment
statements and participation in the environmental protection and rehabilitation program.
The Minister shall establish an Environmental Protection and Rehabilitation Fund for the purpose of
guaranteeing the environmental obligations of Holders of Mineral titles as provided under the Act. The
trustees appointed by the Minister shall operate the fund in accordance with the provisions of the
Trustees Investment Act or amendments thereof.
It prohibits pollution of water course, alterations in water supply and provides that everyone who uses
water in connection with mining operation shall ensure that the water in use does not contain injurious
substances in quantities likely to prove detrimental to animal or vegetable life. Also, no person shall, in
the course of Exploration or mining, carry out operations, in or under any area held to be sacred or permit
injury or destruction of any tree or other thing which is the object of veneration.
2.4 The Resource Curse Phenomenon
Resource endowment can bring huge wealth to countries and can be a valuable development asset.
Considering the rising mineral prices and increasing revenue to resource-rich countries after the Second
World War, this view was challenged, as it was observed that resource-rich countries grew more slowly
than resource-poor countries (Auty and Warhusrst, 1993; Sachs and Warner, 1995). This gave rise to
alternative views that resources are a “curse” that hinder rather than promote economic sustainability in
mineral economies (e.g. Auty, 1993; Davis, 1998).
The conventional view argues that revenue from mineral wealth should generate substantial
wealth for the economy, which would then translate into economic prosperity, just like the path taken by
the developed nations. Proponents of this view, known as the “big push theorists” (e.g. Rosenstein-Rodan
1943; 1961), suggested that mineral endowment would industrialize the developing countries based on
23
revenue windfalls from extractive activities. Likewise, Rostow‟s (1960) third stage of the five-stage
development model
argued that the presence of abundant natural resources would allow developing countries to “take off” (a
transitional stage) similar to Britain‟s course to development. No doubt, resources have historically
played a vital role in the economic success of resource-rich countries, such as in Canada, Australia and
the United States.
However, the global economy has changed significantly since the nineteenth century, and
assumptions based on historical analogy that all resource-rich countries will take the same path to
development are misleading (Power, 2002).
Furthermore, the ICMM, UNCTAD and The World Bank (2006) and the ODI (2006) established that
mineral extraction provides economic growth and poverty eradication opportunities to countries that are
at their early stages of development. This was based on case studies where the mineral industry is
bringing about economic prosperity. Surely the above are examples of countries that have managed to
avoid the curse. For example, Ross (2001:62) admitted that “some states with large extractive industries -
like Botswana, Chile and Malaysia - have overcome many of the obstacles …and implemented sound
pro-poor strategies”. Other similar instances include Indonesia (Temple, 2001) and Norway (Wright and
Czelusta, 2002).
The alternative view is negative about the ability of mineral revenues to promote economic
prosperity. While Auty was the first to use the term resource curse in economic literature to show why
resource wealth hinders economic growth and development, Sachs and Warner (1995) are among the first
authors to use cross-country evidence for the resource curse phenomenon. An earlier study by Auty
(1991) found that per capita income of non-mineral producing nations is two to three times higher than
that of the mineral economies. The resource curse thesis, however, offers a diverse set of explanations
covering, amongst others, terms of trade effects, Dutch disease, internal conflict, human rights violation,
debt overhang, institutional quality, corruption and rent-seeking behaviour, and other political economy
arguments.
The transition to resource curse can be broken into behavioural, state-centred and social capital
perspectives (Rosser, 2006) - Nigeria incorporates each of these. The behaviouralist perspective places
blame on the attitude of rent-seeking political actors in the context of natural resource wealth (Jensen and
Wantchekon, 2004; Lam and Wantchekon, 2003; 1987; Ross, 1999; UNDP, 2006). The concentration of
capital ownership among political elites reproduces social inequalities between those inside the elite
(mostly politicians) and those outside it.
24
Based on a mixture of cognitive, societal, and institutional arguments, state-centred explanations
elucidate how over-reliance on resource rents can inhibit the development of sound economic policies,
increase public spending through ill co-ordinated decisions, and result in less accountability and
transparency (Auty, 2001; Ross, 1999). The state-centred explanation contends that oil extraction, for
example, generates large streams of foreign exchange, and these large flows become the basis for
patronage that supports dictatorship and autocracy, and less accountability to the societies they govern
(Bray, 2003). The failures of governance and complete lack of public accountability can be one of the
main reasons for the failure of resource wealth to translate into development. Part of the revenue surplus
is used in suppressing opposition through tax policies (Ross,1999). Mehlum (2002) considers reduction
or elimination of taxes by governments in mineral economies as the commonest way of making people
less likely to hold the government accountable.
There exist evidences to show that commodity price volatility has a negative effect on economic growth
of mineral economies (e.g. Ploeg and Poelhekke, 2009; Santos, 2010). Instead of saving the excess
revenue during the boom period for the future, the boom cycle encourages governments to initiate
immediate, often short-term, unrealistic expenditures. This leads to a spending spree including embarking
on high-cost infrastructure projects that may be financed by external debts. More importantly in this
context, Palley (2006:5) argued, making unproductive investments and unplanned spending is the
“vehicle for corruption and influence peddling. The net result is loss of fiscal discipline that contributes
to inflation, the build-up of external indebtedness, and the development of cultures of corruption”. This
way, the Dutch disease sets in, because the additional wealth generated induces exchange rate volatility
which, if uncontrolled, can harm domestic production in the long-run.
The social capital perspective argues that access to and the struggle for ownership of natural
resources creates conflicts (Humphreys, 2005; Jensen and Watchenko, 2004; Lujala, 2003). Jensen and
Watchenko (2004) make a further suggestion that the concentration of power among the few makes it
rational for the opposition to pursue power through extra-constitutional means. Second, it gives rise to
agitation over the acquisition of a fair share of the natural resources revenue. Third, separatist tendencies
may arise with the feeling that resources revenue has been siphoned from the producing region to the
capital or abroad. Ross (2006) suggests that conflict in resource-rich regions can emanate through
insurgency or trade shocks. These views have in part led to conflict and instability in the Niger Delta
(Obi, 2008; Orogun, 2010; Watts, 2004a, b, 2008; Xavier and Subramanian, 2003).
A number of solutions for transforming the resource curse into a blessing have being proffered.
Several scholars have focused on sound economic policy changes (Auty, 1995; Collier and Hoeffler
2000), diversification (Adeloye and Ekwere, 2010; Solomon, 2000; Veit et al., 2011), the creation of
stabilisation funds (Santos, 2010; Skancke, 2003), introduction of neo-liberal economic policies (Ross,
25
2003:200 and UNDP, 2006) and the reform of governance and social structures (Iimi, 2006; McPhail,
2008; Woolcock et al., 2001:90). Other scholars have called for international intervention to reduce the
curse (Bannon and Collier, 2003:10) and Auty (2004: 46) has supported the use of international
certification processes, such as the Kimberley Process Certification Scheme. According to Müller (2010),
the institutionalisation of best practices such as the EITI is a means to overcome lack of transparency and
corruption in the management of resource wealth. Lastly, Gylfason (2001:850) suggested investment in
human resources through education. Detailed explanations of these solutions to the resource curse are
outside the scope of this study.
While the various suggestions outlined above can foster development in resource-rich countries
of the developing world, they tend to centre at the national level, neglecting the communities where the
resource economy hits the ground, and who are the ones that bear the brunt of the curse. This study,
however, concentrates on the local impacts of resource development, which attempts to provide a basis
for the discussions on the potential impacts of mining development on local communities. The focus of
the study on the communities extends the resource curse thesis by considering local issues that can hinder
or help a national economy‟s ability to manage resources for development.
2.5 The Impact of Artisanal Mining on the Environment
Mining in Nigeria is currently in a rudimentary stage and also serves as secondary occupation. At
the same time, there is the tendency for most operators to change occupation from farming and adopt
mining as their primary occupation. In Nigeria, artisanal miners produce the following minerals:
cassiterite, columbite, tantalite, gold, gemstones (garnets, tourmaline, aquamarine, and amethyst),
limestone, marble, talc, gypsum, galena/sphalerite, barites, sand, gravel and crushed stones. Some of
these (limestone, marble, sand, gravel, crushed stones) are useful mainly in the construction industry
while the others are exported usually illegally. The implements and equipment they use are simple and
crude and in most cases include shovels, pickaxes, hammers, headpans, simple crushers, sluice boxes,
rolling mills and sieves. All the mining activities at present in Nigeria fall within the small-scale
category, since there are no big corporations miners in the country.
The following are the ways they carry out their operations which explain the manner of their
impacts on the environment:
Panning: Panning is done for mining gold, cassiterite, tantalite, and columbite. This is done by simply
stripping the overburden materials which ranges between 2 and 3 meters before getting to the mineralized
26
zone of the bottom of the river bed. The material is brought out for hand panning (gravity separation).
Occasionally, mercury is added to the pan to enhance recovery. Many tonnes of materials are extracted
to produce a few ounces of the mineral. Panning, therefore, is characterized by large mounds of sand
punctuated by numerous pits along the riverbanks.
Artisanal Mining : Minerals worn by artisanal mining include limestone for lime production, marble,
gemstones, barites, gypsum, galena and sphalerite. For these minerals, the miners use simple implements
such as pickaxes for digging, and shovels for removing the materials. For gemstones, hammers are used
for cobbing out undesired minerals.
Open cast mining: This is carried out by excavating pits that are usually not more than 20 metres deep in
the case of the artisanal and illegal miners. Minerals worn by this method include gemstones, tantalite in
weathered pegmatites, etc. Also, river sand and laterite mining involve shoveling and scooping. Stone
aggregates are mined using pickaxes and shovels while final napping is by a hammer.
In general, all these extraction methods are technically inefficient and carried out without much
knowledge about basic technical parameters such as ore grades or reserves. However, provided the
operations are still profitable despite poor management „the miners‟ only objective is to extract the
greatest amount of mineral in the least amount of time and get out.
The array of minerals produced and the manner of their production as well as the materials and features
left behind cause the environmental problems. The following are the negative impacts left after the
mineral has been extracted:
De-vegetation and soil erosion: wherever mining is taking place, land has to be cleared which
means removal of vegetation. So in all the above aforementioned mining activities, land clearing
has led to de-vegetation and soil erosion.
The aesthetics of the landscape is destroyed through the production pits on the surface which pose
danger because of rock falls and flooding during the raining season. They are hazardous in that
they lack ground support, are poorly ventilated and badly lit. They are not even fenced off as
danger zones. Many deaths have occurred due to caving but have not been reported officially.
This is to ensure that these miners‟ location and identity are not exposed because of the illegal and
clandestine nature of their operations.
In the case of panning and alluvial mining, their actions impact directly on the river and water
system. Some of the tailings are dumped directly into the river system thereby polluting it.
Where tailings are discharged into the river, the river course may be diverted. So, apart from river
pollution, the river system is affected. Gold panners are usually normadic and whenever they
discover a lucrative panning site, they move there and construct make-shift homes using local
27
trees. In addition, 100% of their fuel needs come from wood. Hence they add to vegetation
destruction. The gold panners move considerable millions of tonnes of material for panning per
year and this ends up directly in the streams and dams as silt causing siltation. Also, they destroy
about 2 metres of river bank on either side of the river in cases where mineralization continues
beyond the banks.
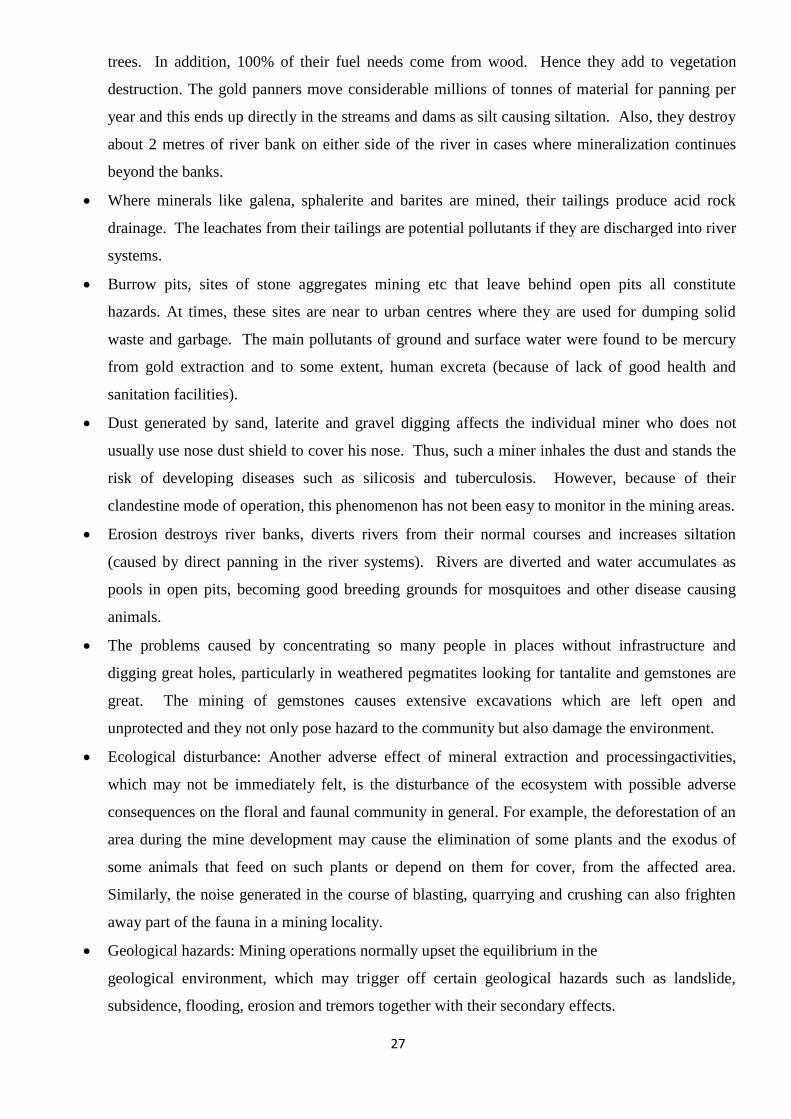
Where minerals like galena, sphalerite and barites are mined, their tailings produce acid rock
drainage. The leachates from their tailings are potential pollutants if they are discharged into river
systems.
Burrow pits, sites of stone aggregates mining etc that leave behind open pits all constitute
hazards. At times, these sites are near to urban centres where they are used for dumping solid
waste and garbage. The main pollutants of ground and surface water were found to be mercury
from gold extraction and to some extent, human excreta (because of lack of good health and
sanitation facilities).
Dust generated by sand, laterite and gravel digging affects the individual miner who does not
usually use nose dust shield to cover his nose. Thus, such a miner inhales the dust and stands the
risk of developing diseases such as silicosis and tuberculosis. However, because of their
clandestine mode of operation, this phenomenon has not been easy to monitor in the mining areas.
Erosion destroys river banks, diverts rivers from their normal courses and increases siltation
(caused by direct panning in the river systems). Rivers are diverted and water accumulates as
pools in open pits, becoming good breeding grounds for mosquitoes and other disease causing
animals.
The problems caused by concentrating so many people in places without infrastructure and
digging great holes, particularly in weathered pegmatites looking for tantalite and gemstones are
great. The mining of gemstones causes extensive excavations which are left open and
unprotected and they not only pose hazard to the community but also damage the environment.
Ecological disturbance: Another adverse effect of mineral extraction and processingactivities,
which may not be immediately felt, is the disturbance of the ecosystem with possible adverse
consequences on the floral and faunal community in general. For example, the deforestation of an
area during the mine development may cause the elimination of some plants and the exodus of
some animals that feed on such plants or depend on them for cover, from the affected area.
Similarly, the noise generated in the course of blasting, quarrying and crushing can also frighten
away part of the fauna in a mining locality.
Geological hazards: Mining operations normally upset the equilibrium in the
geological environment, which may trigger off certain geological hazards such as landslide,
subsidence, flooding, erosion and tremors together with their secondary effects.
28
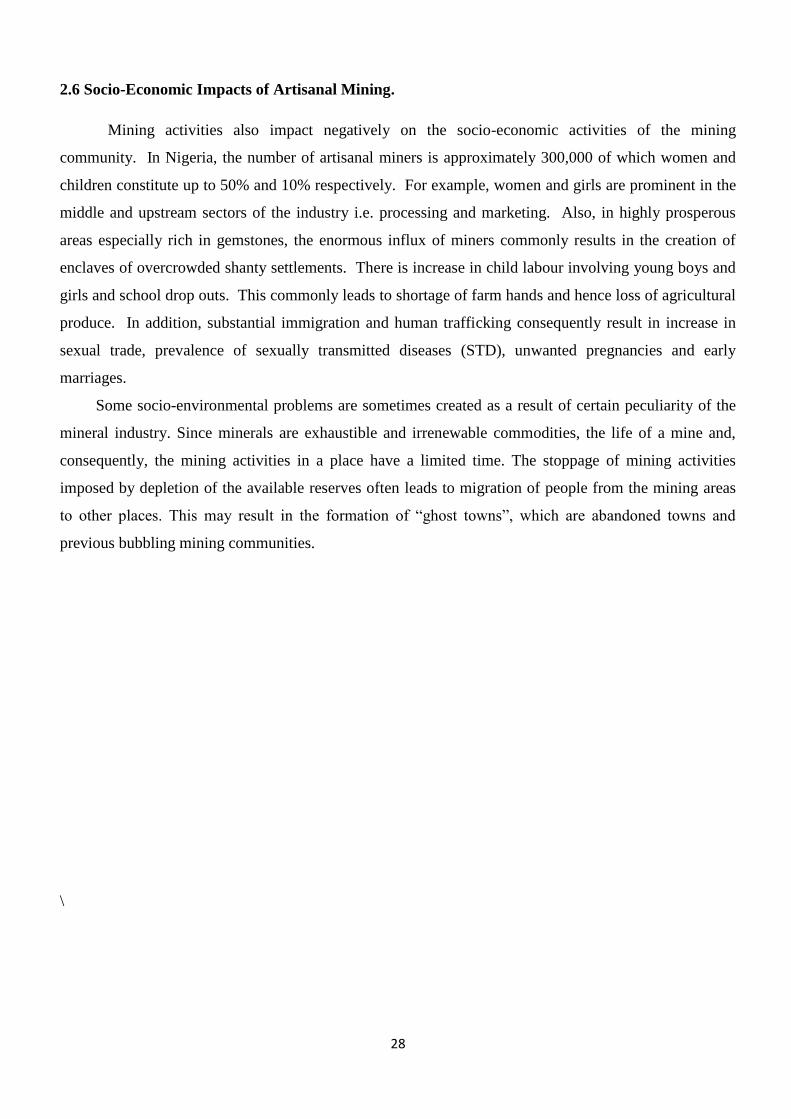
2.6 Socio-Economic Impacts of Artisanal Mining.
Mining activities also impact negatively on the socio-economic activities of the mining
community. In Nigeria, the number of artisanal miners is approximately 300,000 of which women and
children constitute up to 50% and 10% respectively. For example, women and girls are prominent in the
middle and upstream sectors of the industry i.e. processing and marketing. Also, in highly prosperous
areas especially rich in gemstones, the enormous influx of miners commonly results in the creation of
enclaves of overcrowded shanty settlements. There is increase in child labour involving young boys and
girls and school drop outs. This commonly leads to shortage of farm hands and hence loss of agricultural
produce. In addition, substantial immigration and human trafficking consequently result in increase in
sexual trade, prevalence of sexually transmitted diseases (STD), unwanted pregnancies and early
marriages.
Some socio-environmental problems are sometimes created as a result of certain peculiarity of the
mineral industry. Since minerals are exhaustible and irrenewable commodities, the life of a mine and,
consequently, the mining activities in a place have a limited time. The stoppage of mining activities
imposed by depletion of the available reserves often leads to migration of people from the mining areas
to other places. This may result in the formation of “ghost towns”, which are abandoned towns and
previous bubbling mining communities.
\
29
CHAPTER THREE
RESEARCH METHODOLOGY
3.1 Introduction
This chapter comprises of research design, types and sources of data, sampling techniques and data
collection procedure, data analysis and limitation of data sources.
3.2 Research Design
Specifically, this study was a cross-sectional survey of respondents who live around mining areas in Oke-
Ogun Region.
3.3 Types and Sources of Data
The types and sources of data collection used for this work are primary and secondary data.
3.3.1 Primary Data
The primary source involves collection of information through the field survey by administering
questionnaire and to an extent oral interview. The data required is related to information on
environmental and socio-economic impacts of mining in Oke-Ogun Region. These include demographic
characteristics of respondents amongst others.
3.3.2 Secondary Data
Secondary data such as the information about the study area, history of mining in the area, geographic
and population characteristics etc. were sourced from the internet and other relevant materials like
journals, thesis, textbooks etc.
3.4 Sampling Techniques and Data Collection Procedure
The actual survey spanned two days and covered some parts of Oke-Ogun. These are Komu and Igbetti.
A total of 290 questionaires were administered randomly.
30
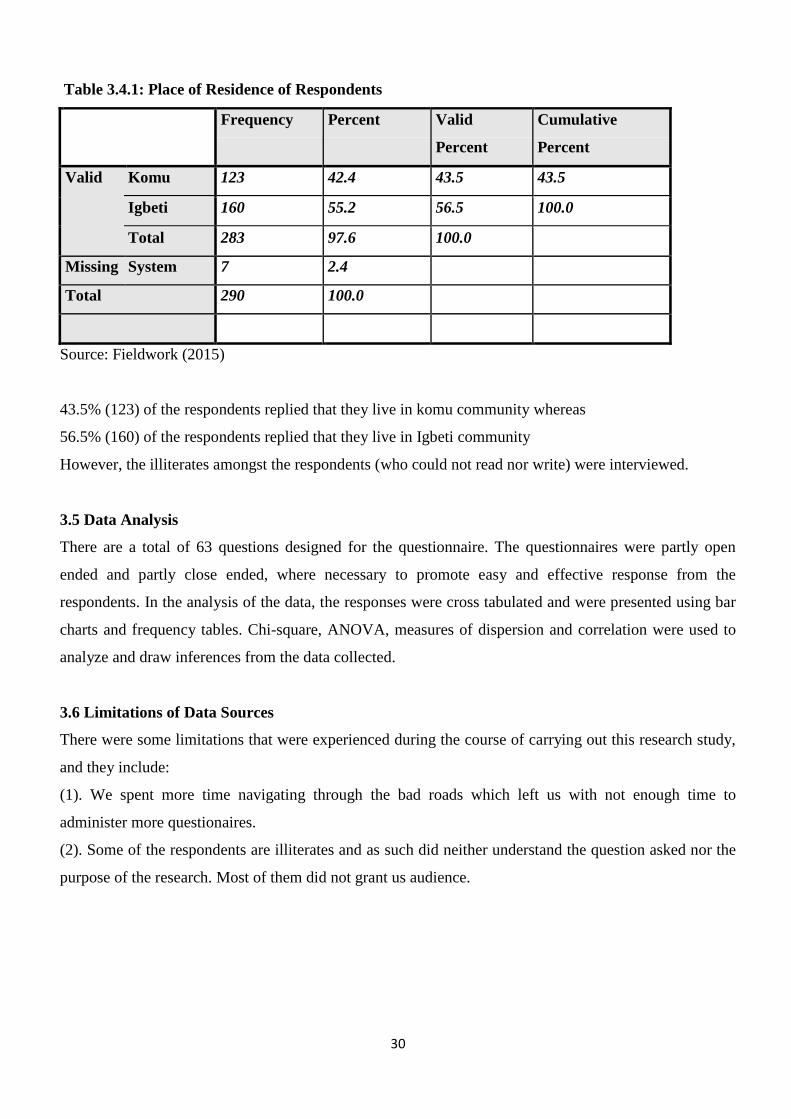
Table 3.4.1: Place of Residence of Respondents
Frequency Percent Valid
Percent
Cumulative
Percent
Valid Komu 123 42.4 43.5 43.5
Igbeti 160 55.2 56.5 100.0
Total 283 97.6 100.0
Missing System 7 2.4
Total 290 100.0
Source: Fieldwork (2015)
43.5% (123) of the respondents replied that they live in komu community whereas
56.5% (160) of the respondents replied that they live in Igbeti community
However, the illiterates amongst the respondents (who could not read nor write) were interviewed.
3.5 Data Analysis
There are a total of 63 questions designed for the questionnaire. The questionnaires were partly open
ended and partly close ended, where necessary to promote easy and effective response from the
respondents. In the analysis of the data, the responses were cross tabulated and were presented using bar
charts and frequency tables. Chi-square, ANOVA, measures of dispersion and correlation were used to
analyze and draw inferences from the data collected.
3.6 Limitations of Data Sources
There were some limitations that were experienced during the course of carrying out this research study,
and they include:
(1). We spent more time navigating through the bad roads which left us with not enough time to
administer more questionaires.
(2). Some of the respondents are illiterates and as such did neither understand the question asked nor the
purpose of the research. Most of them did not grant us audience.
31
CHAPTER FOUR
RESULTS AND DISCUSSIONS
4.1 Introduction
This chapter is divided into four sections. The first section shows the demographic characteristic of the
respondents like their place of residence, gender, marital status, community type, educational status,
occupation etc.
The second section deals with the socio-economic impact of artisanal mining in Oke-Ogun region, and
these are; level of employment, dress sense of the people, conflict between indigenes and mine workers,
electricity supply, crime rate, standard of living, health related diseases, price of land, price of rent,
agricultural productivity amongst others.
The third section examines the environmental impact of artisanal mining on the livelihood of the people
living in Oke-Ogun region. These include dust release, air pollution, water pollution, threat to farmland
and crops, damage to buildings, noise from blasted, deforestation, land degradation amongst others.
Finally, the last section is all about hypothesis testing.
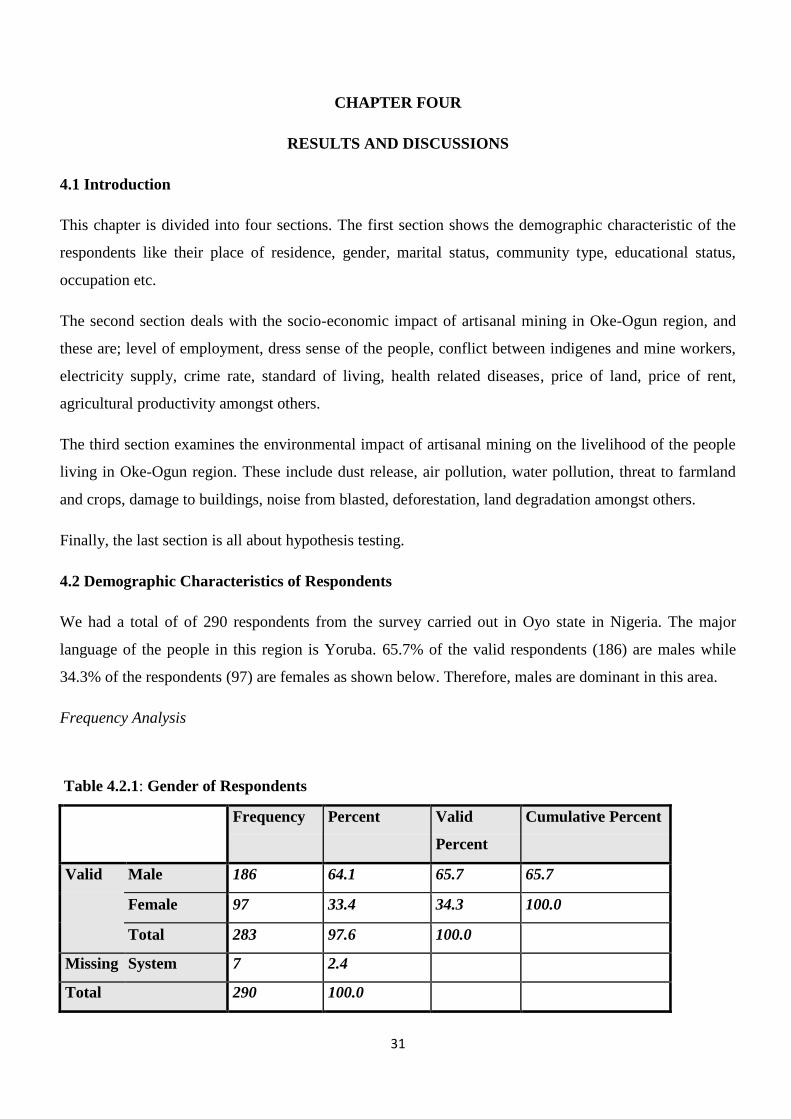
4.2 Demographic Characteristics of Respondents
We had a total of of 290 respondents from the survey carried out in Oyo state in Nigeria. The major
language of the people in this region is Yoruba. 65.7% of the valid respondents (186) are males while
34.3% of the respondents (97) are females as shown below. Therefore, males are dominant in this area.
Frequency Analysis
Table 4.2.1: Gender of Respondents
Frequency Percent Valid
Percent
Cumulative Percent
Valid Male 186 64.1 65.7 65.7
Female 97 33.4 34.3 100.0
Total 283 97.6 100.0
Missing System 7 2.4
Total 290 100.0
32
Source: Fieldwork (2015).
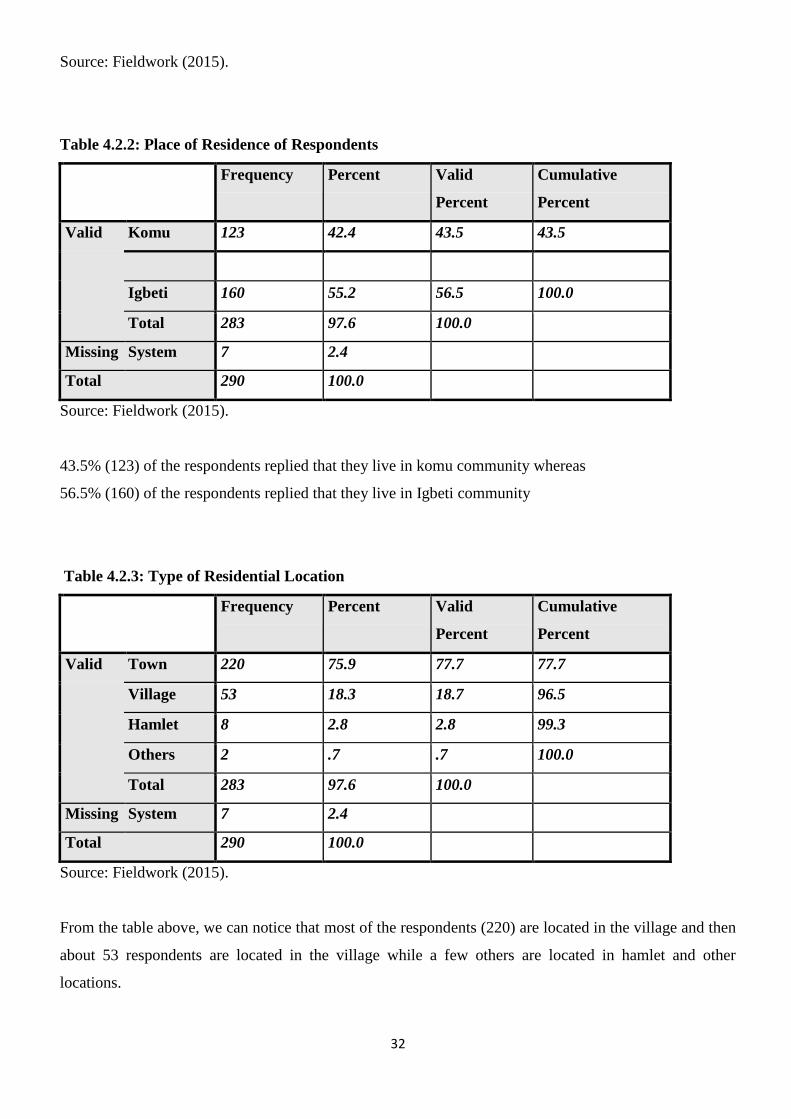
Table 4.2.2: Place of Residence of Respondents
Frequency Percent Valid
Percent
Cumulative
Percent
Valid Komu 123 42.4 43.5 43.5
Igbeti 160 55.2 56.5 100.0
Total 283 97.6 100.0
Missing System 7 2.4
Total 290 100.0
Source: Fieldwork (2015).
43.5% (123) of the respondents replied that they live in komu community whereas
56.5% (160) of the respondents replied that they live in Igbeti community
Table 4.2.3: Type of Residential Location
Frequency Percent Valid
Percent
Cumulative
Percent
Valid Town 220 75.9 77.7 77.7
Village 53 18.3 18.7 96.5
Hamlet 8 2.8 2.8 99.3
Others 2 .7 .7 100.0
Total 283 97.6 100.0
Missing System 7 2.4
Total 290 100.0
Source: Fieldwork (2015).
From the table above, we can notice that most of the respondents (220) are located in the village and then
about 53 respondents are located in the village while a few others are located in hamlet and other
locations.
33
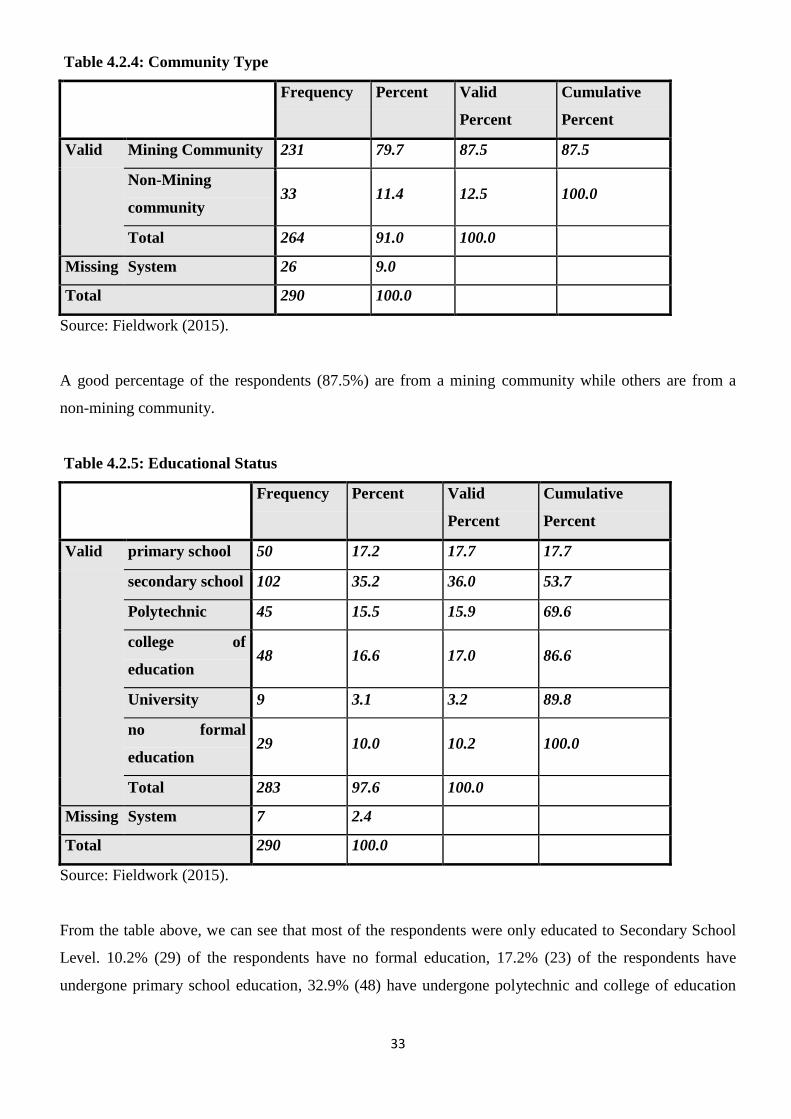
Table 4.2.4: Community Type
Frequency Percent Valid
Percent
Cumulative
Percent
Valid Mining Community 231 79.7 87.5 87.5
Non-Mining
community 33 11.4 12.5 100.0
Total 264 91.0 100.0
Missing System 26 9.0
Total 290 100.0
Source: Fieldwork (2015).
A good percentage of the respondents (87.5%) are from a mining community while others are from a
non-mining community.
Table 4.2.5: Educational Status
Frequency Percent Valid
Percent
Cumulative
Percent
Valid primary school 50 17.2 17.7 17.7
secondary school 102 35.2 36.0 53.7
Polytechnic 45 15.5 15.9 69.6
college of
education 48 16.6 17.0 86.6
University 9 3.1 3.2 89.8
no formal
education 29 10.0 10.2 100.0
Total 283 97.6 100.0
Missing System 7 2.4
Total 290 100.0
Source: Fieldwork (2015).
From the table above, we can see that most of the respondents were only educated to Secondary School
Level. 10.2% (29) of the respondents have no formal education, 17.2% (23) of the respondents have
undergone primary school education, 32.9% (48) have undergone polytechnic and college of education
34
and 3.2% (9) have a university education. From this we can conclude that a major percentage of the
respondents (84.5%) are Literates therefore responding to the questionnaire was quite easy.
Table 4.2.6: Type of Mine Workers
Frequency Percent Valid
Percent
Cumulative
Percent
Valid mine owner 9 3.1 12.3 12.3
Digger 27 9.3 37.0 49.3
Security 11 3.8 15.1 64.4
mine
intermediary 11 3.8 15.1 79.5
mineral buyer 15 5.2 20.5 100.0
Total 73 25.2 100.0
Missing System 217 74.8
Total 290 100.0
Source: Fieldwork (2015).
Out of the respondents who are mine workers, 12.3% (9) of the respondents are mine owners, 37%(27) of
the respondents are diggers, 15.1%(11) of the respondents are security workers, 15.1% of the respondents
are mine intermediary and the remaining 20.5%(15) are mineral buyers.
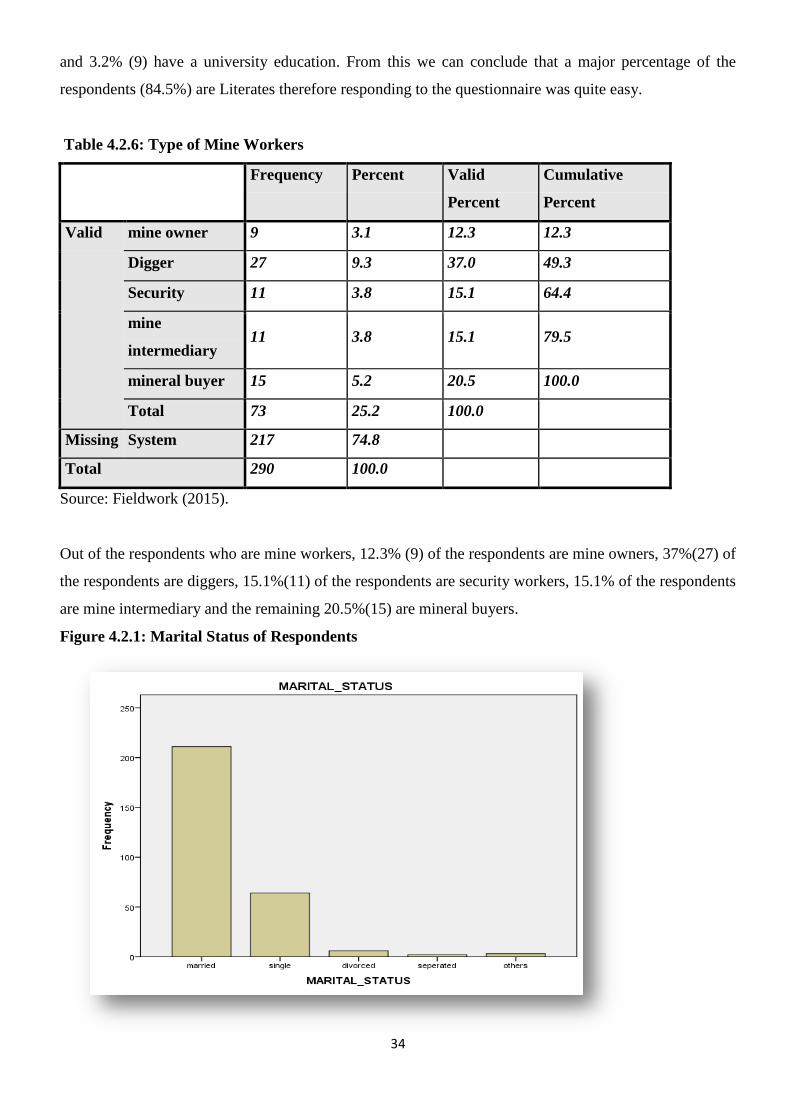
Figure 4.2.1: Marital Status of Respondents
35
Source: Fieldwork (2015).
From the chart above, we can see that most of the respondents are married, followed by being single and
a few others divorced, separated and so on.
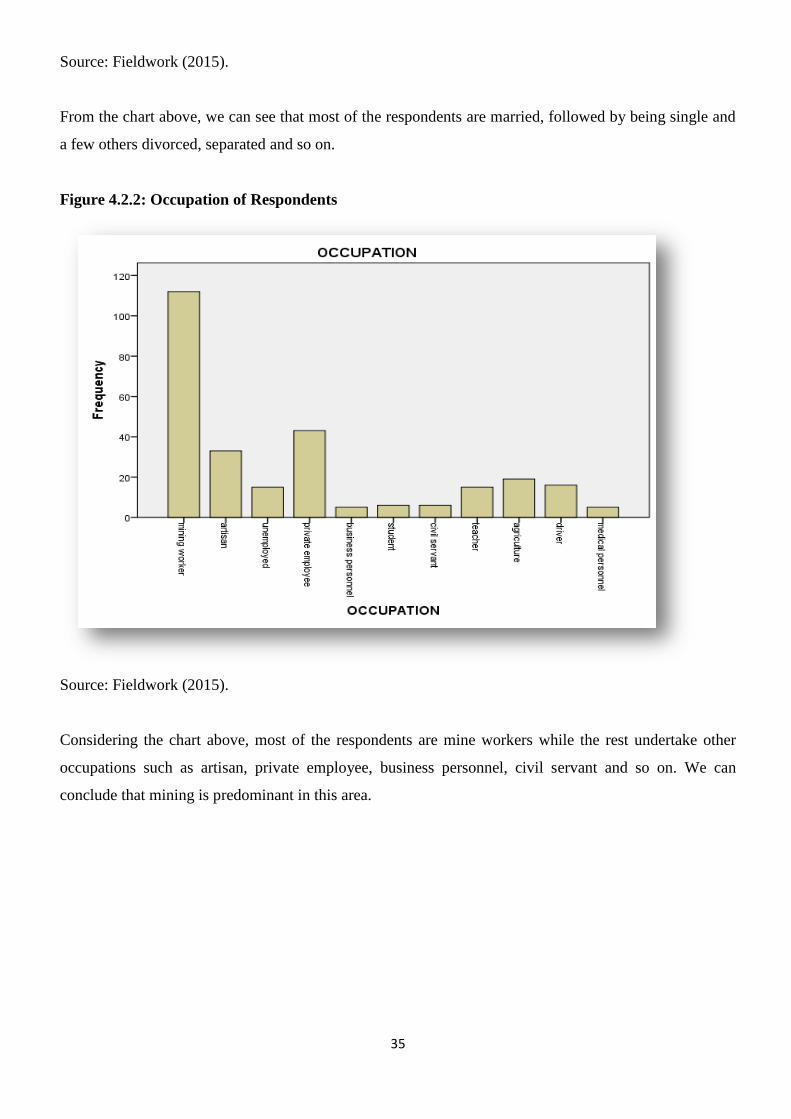
Figure 4.2.2: Occupation of Respondents
Source: Fieldwork (2015).
Considering the chart above, most of the respondents are mine workers while the rest undertake other
occupations such as artisan, private employee, business personnel, civil servant and so on. We can
conclude that mining is predominant in this area.
36
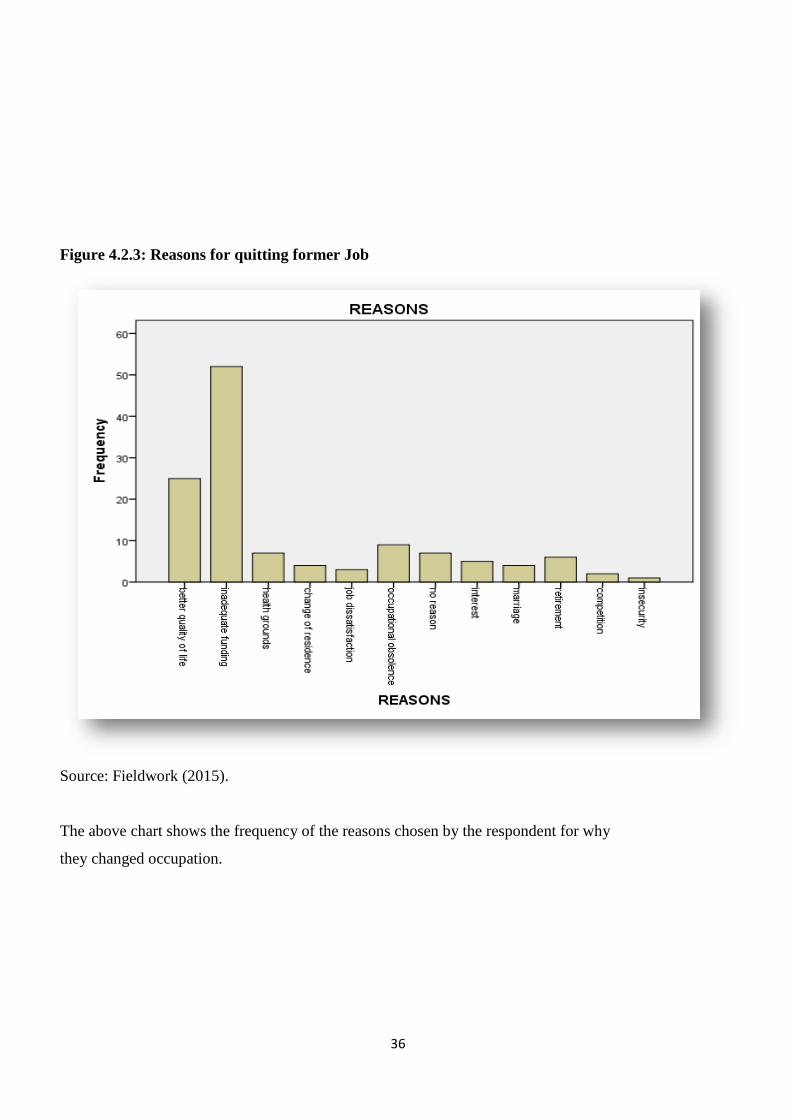
Figure 4.2.3: Reasons for quitting former Job
Source: Fieldwork (2015).
The above chart shows the frequency of the reasons chosen by the respondent for why
they changed occupation.
37
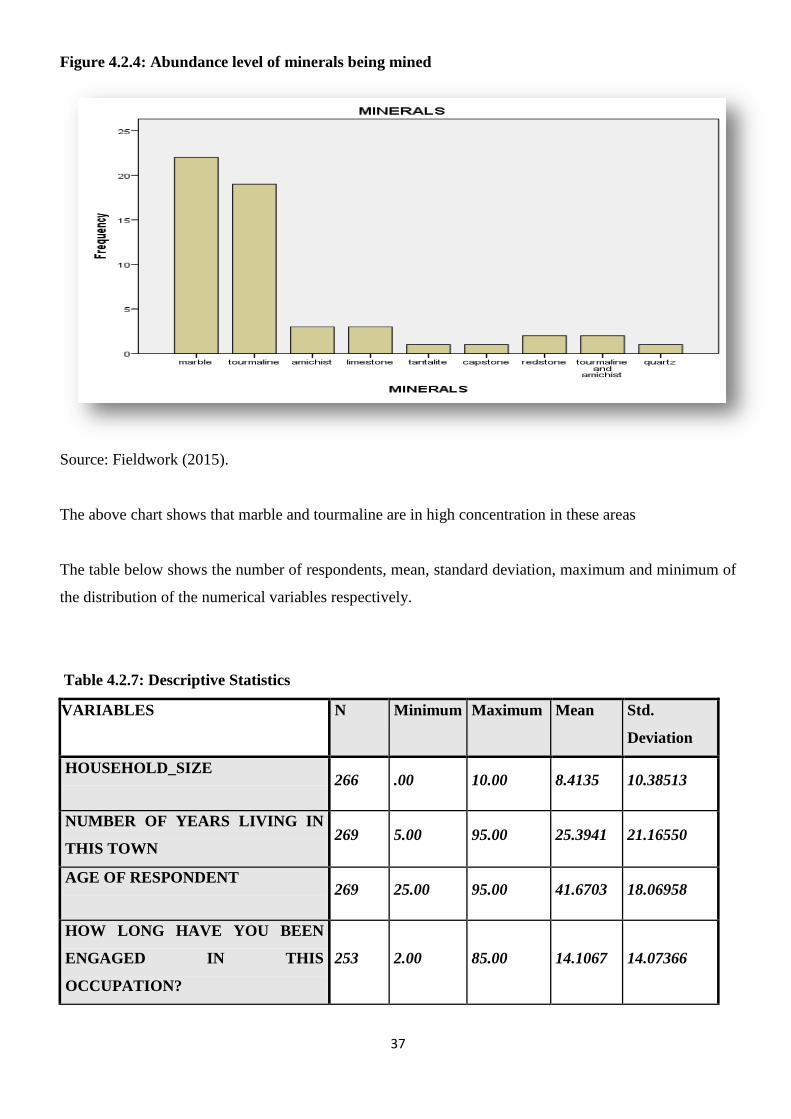
Figure 4.2.4: Abundance level of minerals being mined
Source: Fieldwork (2015).
The above chart shows that marble and tourmaline are in high concentration in these areas
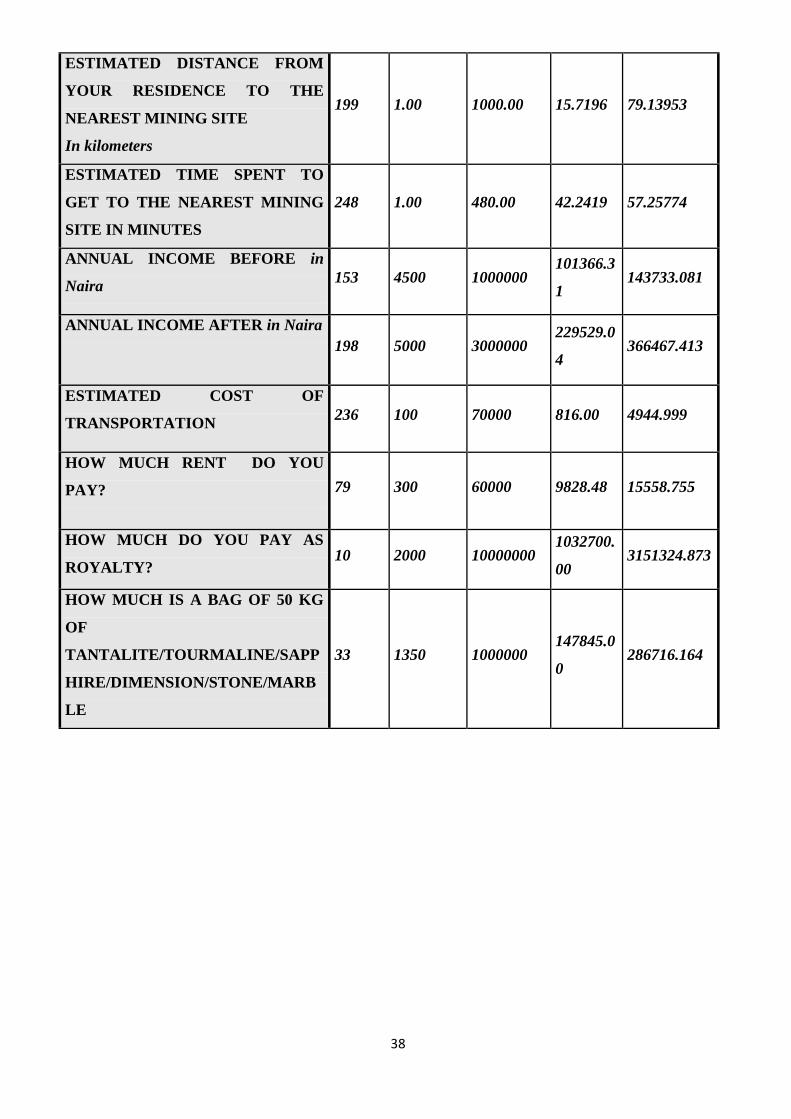
The table below shows the number of respondents, mean, standard deviation, maximum and minimum of
the distribution of the numerical variables respectively.
Table 4.2.7: Descriptive Statistics
VARIABLES N Minimum Maximum Mean Std.
Deviation
HOUSEHOLD_SIZE 266 .00 10.00 8.4135 10.38513
NUMBER OF YEARS LIVING IN
THIS TOWN 269 5.00 95.00 25.3941 21.16550
AGE OF RESPONDENT 269 25.00 95.00 41.6703 18.06958
HOW LONG HAVE YOU BEEN
ENGAGED IN THIS
OCCUPATION?
253 2.00 85.00 14.1067 14.07366
38
ESTIMATED DISTANCE FROM
YOUR RESIDENCE TO THE
NEAREST MINING SITE
In kilometers
199 1.00 1000.00 15.7196 79.13953
ESTIMATED TIME SPENT TO
GET TO THE NEAREST MINING
SITE IN MINUTES
248 1.00 480.00 42.2419 57.25774
ANNUAL INCOME BEFORE in
Naira 153 4500 1000000
101366.3
1 143733.081
ANNUAL INCOME AFTER in Naira
198 5000 3000000 229529.0
4 366467.413
ESTIMATED COST OF
TRANSPORTATION 236 100 70000 816.00 4944.999
HOW MUCH RENT DO YOU
PAY? 79 300 60000 9828.48 15558.755
HOW MUCH DO YOU PAY AS
ROYALTY? 10 2000 10000000
1032700.
00 3151324.873
HOW MUCH IS A BAG OF 50 KG
OF
TANTALITE/TOURMALINE/SAPP
HIRE/DIMENSION/STONE/MARB
LE
33 1350 1000000 147845.0
0 286716.164
39
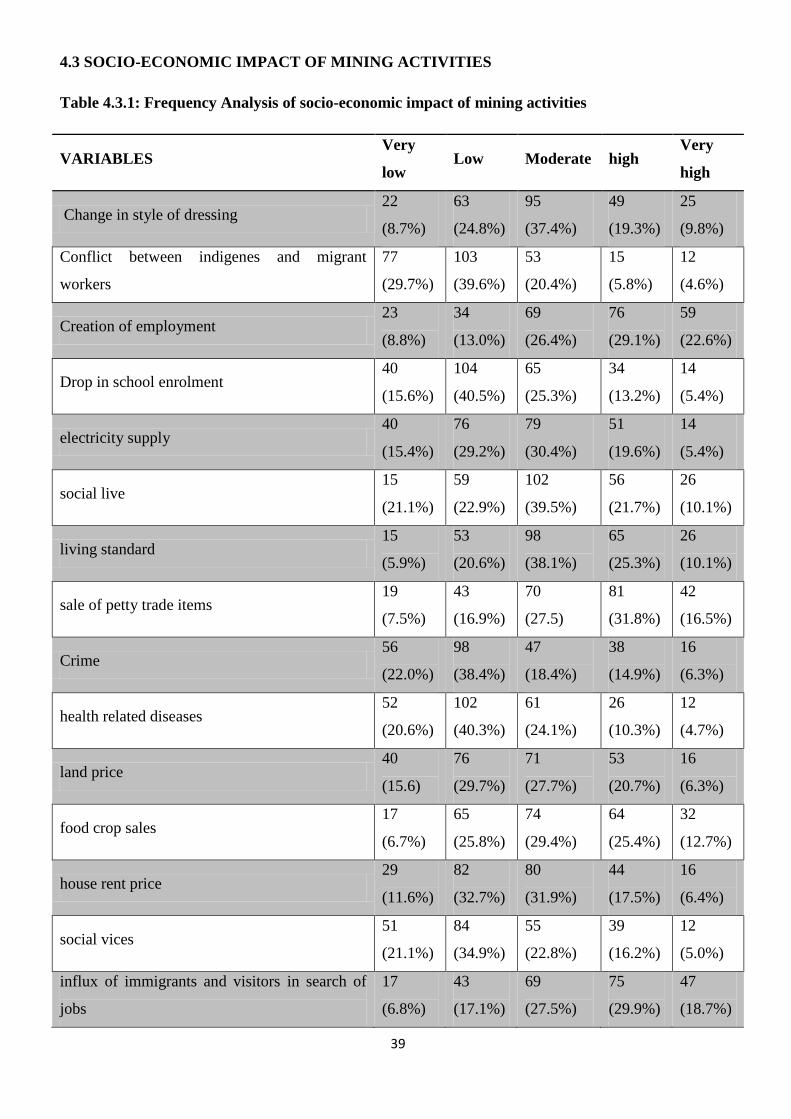
4.3 SOCIO-ECONOMIC IMPACT OF MINING ACTIVITIES
Table 4.3.1: Frequency Analysis of socio-economic impact of mining activities
VARIABLES Very
low Low Moderate high
Very
high
Change in style of dressing 22
(8.7%)
63
(24.8%)
95
(37.4%)
49
(19.3%)
25
(9.8%)
Conflict between indigenes and migrant
workers
77
(29.7%)
103
(39.6%)
53
(20.4%)
15
(5.8%)
12
(4.6%)
Creation of employment 23
(8.8%)
34
(13.0%)
69
(26.4%)
76
(29.1%)
59
(22.6%)
Drop in school enrolment 40
(15.6%)
104
(40.5%)
65
(25.3%)
34
(13.2%)
14
(5.4%)
electricity supply 40
(15.4%)
76
(29.2%)
79
(30.4%)
51
(19.6%)
14
(5.4%)
social live 15
(21.1%)
59
(22.9%)
102
(39.5%)
56
(21.7%)
26
(10.1%)
living standard 15
(5.9%)
53
(20.6%)
98
(38.1%)
65
(25.3%)
26
(10.1%)
sale of petty trade items 19
(7.5%)
43
(16.9%)
70
(27.5)
81
(31.8%)
42
(16.5%)
Crime 56
(22.0%)
98
(38.4%)
47
(18.4%)
38
(14.9%)
16
(6.3%)
health related diseases 52
(20.6%)
102
(40.3%)
61
(24.1%)
26
(10.3%)
12
(4.7%)
land price 40
(15.6)
76
(29.7%)
71
(27.7%)
53
(20.7%)
16
(6.3%)
food crop sales 17
(6.7%)
65
(25.8%)
74
(29.4%)
64
(25.4%)
32
(12.7%)
house rent price 29
(11.6%)
82
(32.7%)
80
(31.9%)
44
(17.5%)
16
(6.4%)
social vices 51
(21.1%)
84
(34.9%)
55
(22.8%)
39
(16.2%)
12
(5.0%)
influx of immigrants and visitors in search of
jobs
17
(6.8%)
43
(17.1%)
69
(27.5%)
75
(29.9%)
47
(18.7%)
40
Agricultural productivity 39
(15.5%)
85
(33.7%)
74
(29.4%)
38
(15.1%)
16
(6.3%)
Security threat 59
(23.9%)
103
(41.7%)
49
(19.8%)
25
(10.1%)
11
(4.5%)
Truancy 56
(24.3%)
102
(44.2%)
40
(17.3%)
27
(11.7%)
6
(2.6%)
Source: Fieldwork (2015).
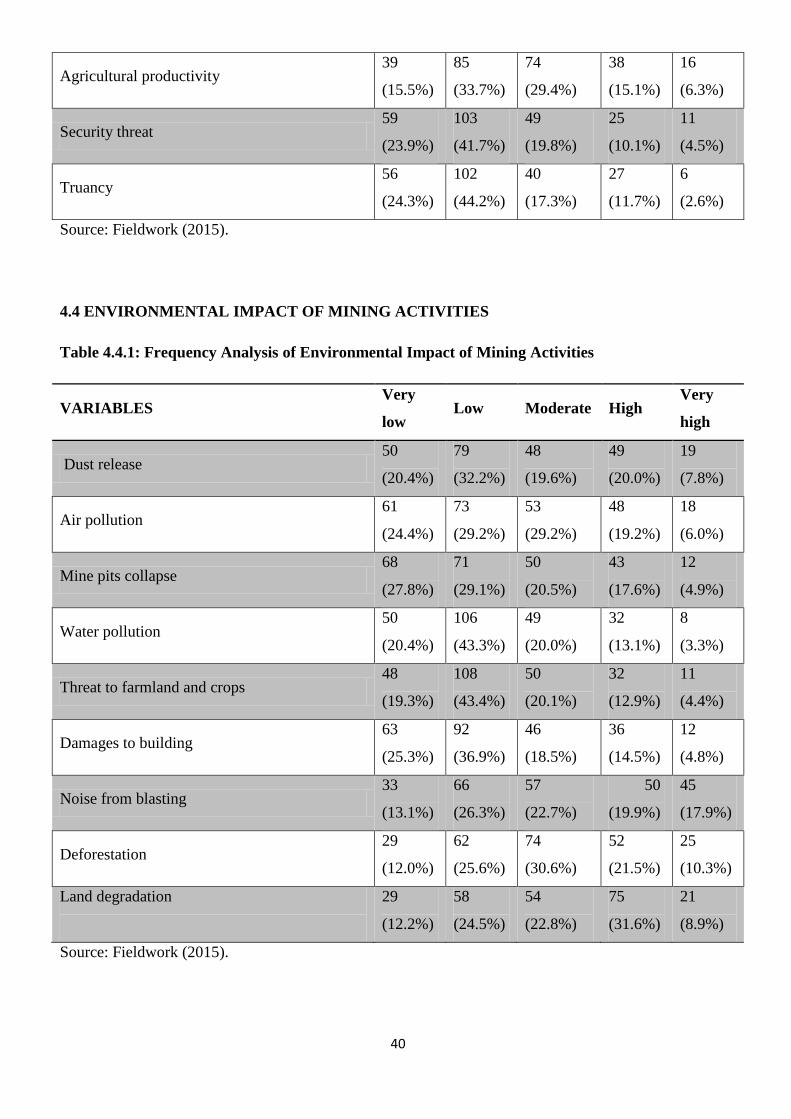
4.4 ENVIRONMENTAL IMPACT OF MINING ACTIVITIES
Table 4.4.1: Frequency Analysis of Environmental Impact of Mining Activities
VARIABLES Very
low Low Moderate High
Very
high
Dust release 50
(20.4%)
79
(32.2%)
48
(19.6%)
49
(20.0%)
19
(7.8%)
Air pollution 61
(24.4%)
73
(29.2%)
53
(29.2%)
48
(19.2%)
18
(6.0%)
Mine pits collapse 68
(27.8%)
71
(29.1%)
50
(20.5%)
43
(17.6%)
12
(4.9%)
Water pollution 50
(20.4%)
106
(43.3%)
49
(20.0%)
32
(13.1%)
8
(3.3%)
Threat to farmland and crops 48
(19.3%)
108
(43.4%)
50
(20.1%)
32
(12.9%)
11
(4.4%)
Damages to building 63
(25.3%)
92
(36.9%)
46
(18.5%)
36
(14.5%)
12
(4.8%)
Noise from blasting 33
(13.1%)
66
(26.3%)
57
(22.7%)
50
(19.9%)
45
(17.9%)
Deforestation 29
(12.0%)
62
(25.6%)
74
(30.6%)
52
(21.5%)
25
(10.3%)
Land degradation
29
(12.2%)
58
(24.5%)
54
(22.8%)
75
(31.6%)
21
(8.9%)
Source: Fieldwork (2015).
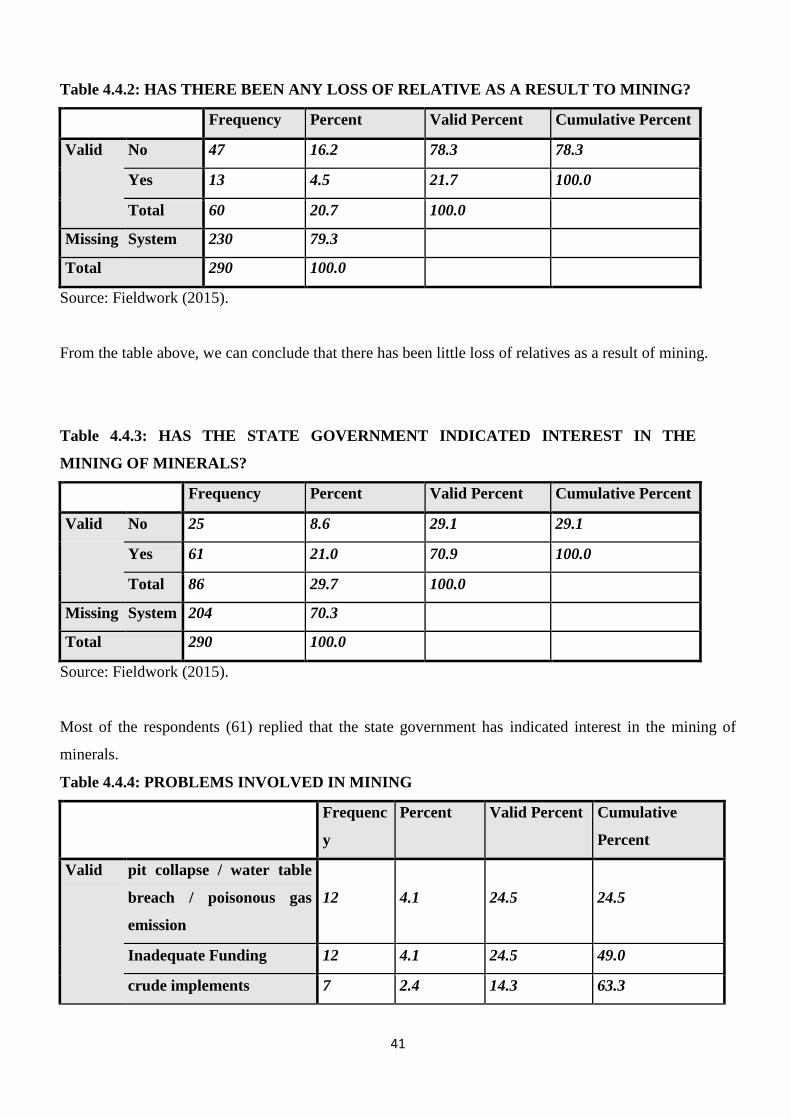
41
Table 4.4.2: HAS THERE BEEN ANY LOSS OF RELATIVE AS A RESULT TO MINING?
Frequency Percent Valid Percent Cumulative Percent
Valid No 47 16.2 78.3 78.3
Yes 13 4.5 21.7 100.0
Total 60 20.7 100.0
Missing System 230 79.3
Total 290 100.0
Source: Fieldwork (2015).
From the table above, we can conclude that there has been little loss of relatives as a result of mining.
Table 4.4.3: HAS THE STATE GOVERNMENT INDICATED INTEREST IN THE
MINING OF MINERALS?
Frequency Percent Valid Percent Cumulative Percent
Valid No 25 8.6 29.1 29.1
Yes 61 21.0 70.9 100.0
Total 86 29.7 100.0
Missing System 204 70.3
Total 290 100.0
Source: Fieldwork (2015).
Most of the respondents (61) replied that the state government has indicated interest in the mining of
minerals.
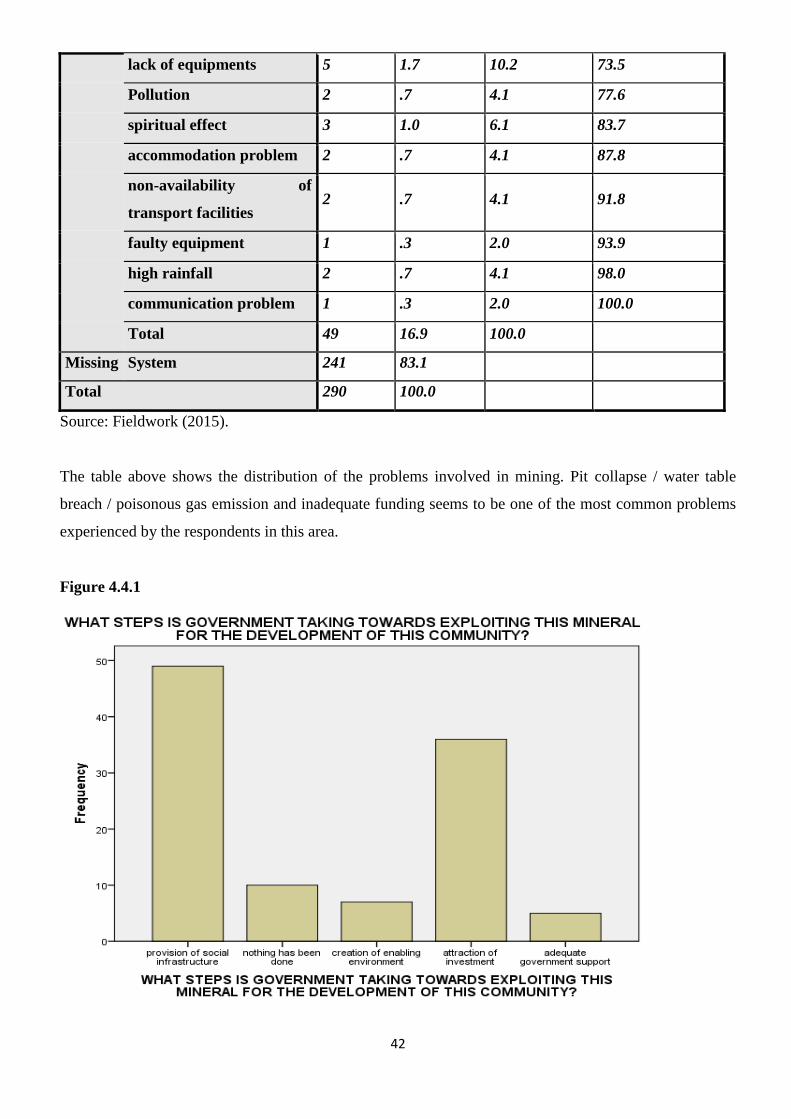
Table 4.4.4: PROBLEMS INVOLVED IN MINING
Frequenc
y
Percent Valid Percent Cumulative
Percent
Valid pit collapse / water table
breach / poisonous gas
emission
12 4.1 24.5 24.5
Inadequate Funding 12 4.1 24.5 49.0
crude implements 7 2.4 14.3 63.3
42
lack of equipments 5 1.7 10.2 73.5
Pollution 2 .7 4.1 77.6
spiritual effect 3 1.0 6.1 83.7
accommodation problem 2 .7 4.1 87.8
non-availability of
transport facilities 2 .7 4.1 91.8
faulty equipment 1 .3 2.0 93.9
high rainfall 2 .7 4.1 98.0
communication problem 1 .3 2.0 100.0
Total 49 16.9 100.0
Missing System 241 83.1
Total 290 100.0
Source: Fieldwork (2015).
The table above shows the distribution of the problems involved in mining. Pit collapse / water table
breach / poisonous gas emission and inadequate funding seems to be one of the most common problems
experienced by the respondents in this area.
Figure 4.4.1
43
Source: Fieldwork (2015).
The government has made more impact towards the provision of social infrastructure and attraction of
investments.
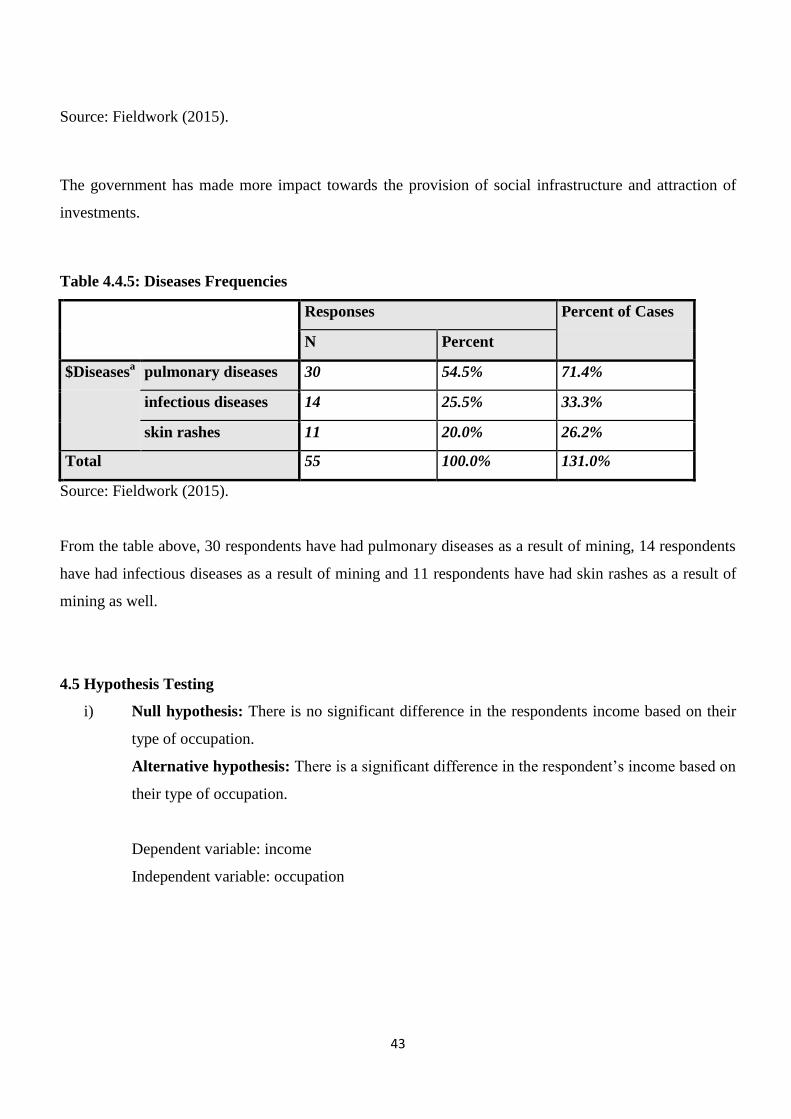
Table 4.4.5: Diseases Frequencies
Responses Percent of Cases
N Percent
$Diseasesa pulmonary diseases 30 54.5% 71.4%
infectious diseases 14 25.5% 33.3%
skin rashes 11 20.0% 26.2%
Total 55 100.0% 131.0%
Source: Fieldwork (2015).
From the table above, 30 respondents have had pulmonary diseases as a result of mining, 14 respondents
have had infectious diseases as a result of mining and 11 respondents have had skin rashes as a result of
mining as well.
4.5 Hypothesis Testing
i) Null hypothesis: There is no significant difference in the respondents income based on their
type of occupation.
Alternative hypothesis: There is a significant difference in the respondent‟s income based on
their type of occupation.
Dependent variable: income
Independent variable: occupation
44
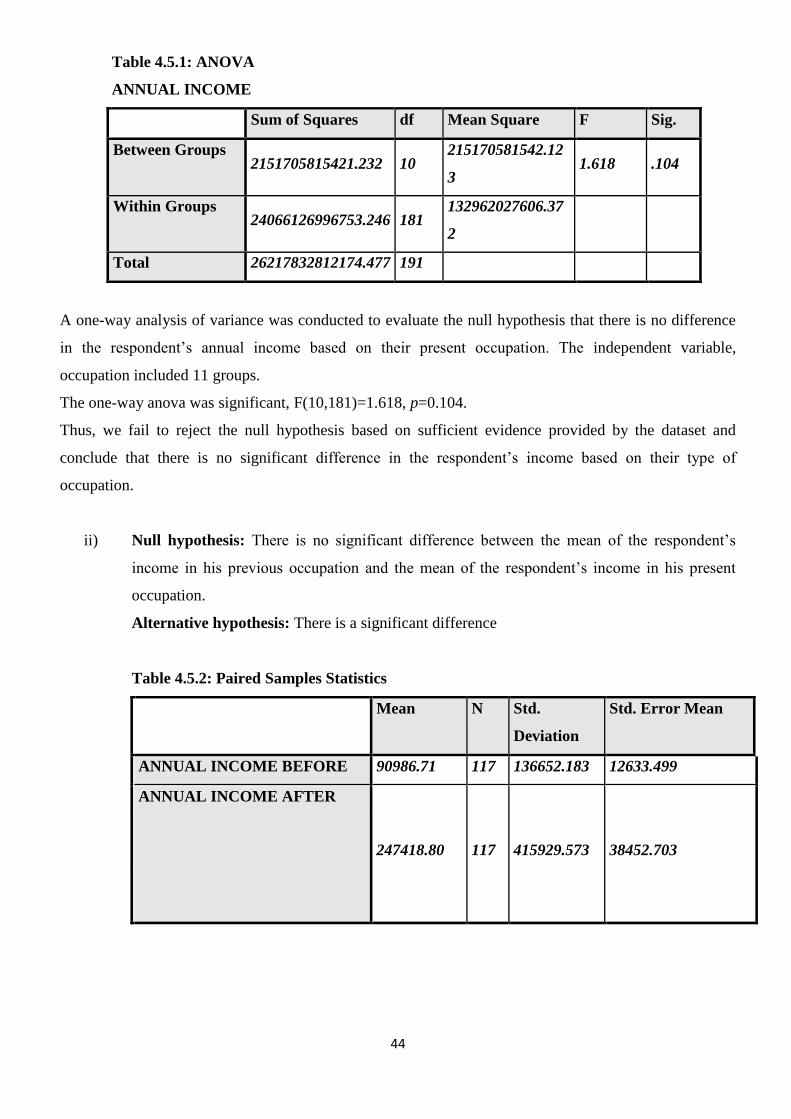
Table 4.5.1: ANOVA
ANNUAL INCOME
Sum of Squares df Mean Square F Sig.
Between Groups 2151705815421.232 10
215170581542.12
3 1.618 .104
Within Groups 24066126996753.246 181
132962027606.37
2
Total 26217832812174.477 191
A one-way analysis of variance was conducted to evaluate the null hypothesis that there is no difference
in the respondent‟s annual income based on their present occupation. The independent variable,
occupation included 11 groups.
The one-way anova was significant, F(10,181)=1.618, p=0.104.
Thus, we fail to reject the null hypothesis based on sufficient evidence provided by the dataset and
conclude that there is no significant difference in the respondent‟s income based on their type of
occupation.
ii) Null hypothesis: There is no significant difference between the mean of the respondent‟s
income in his previous occupation and the mean of the respondent‟s income in his present
occupation.
Alternative hypothesis: There is a significant difference
Table 4.5.2: Paired Samples Statistics
Mean N Std.
Deviation
Std. Error Mean
P
a
i
r
1
ANNUAL INCOME BEFORE 90986.71 117 136652.183 12633.499
ANNUAL INCOME AFTER
247418.80 117 415929.573 38452.703
45
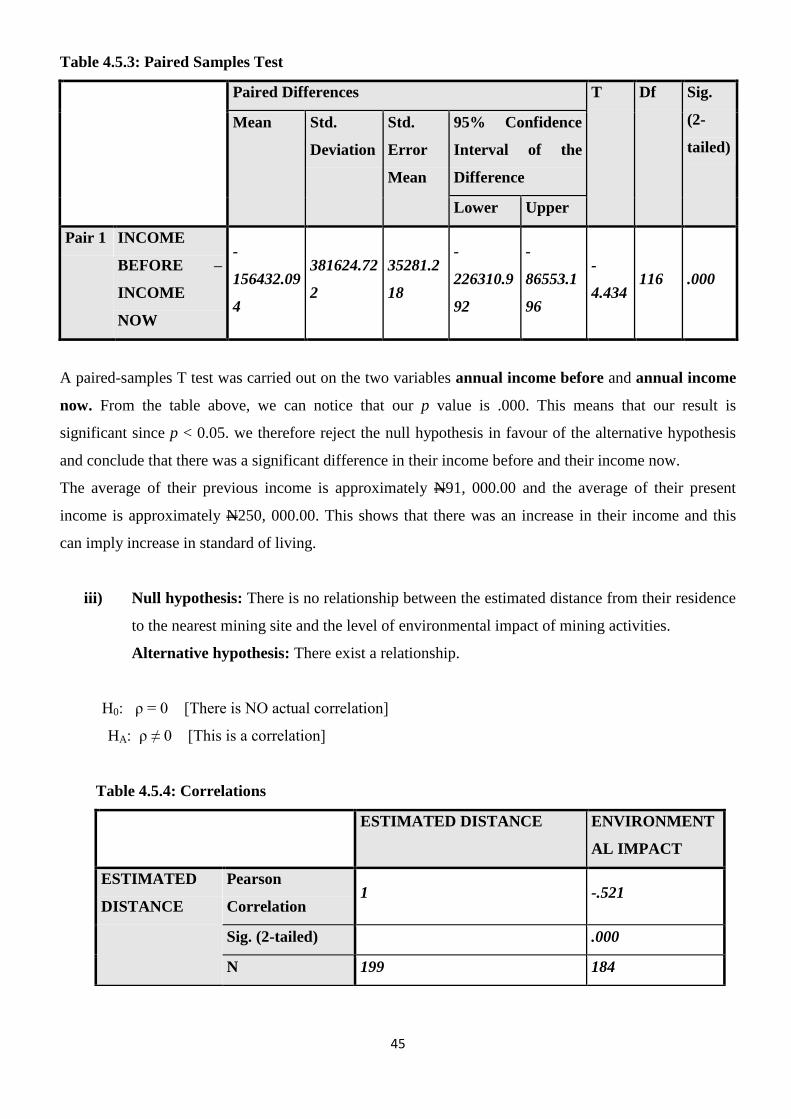
Table 4.5.3: Paired Samples Test
Paired Differences T Df Sig.
(2-
tailed)
Mean Std.
Deviation
Std.
Error
Mean
95% Confidence
Interval of the
Difference
Lower Upper
Pair 1 INCOME
BEFORE –
INCOME
NOW
-
156432.09
4
381624.72
2
35281.2
18
-
226310.9
92
-
86553.1
96
-
4.434 116 .000
A paired-samples T test was carried out on the two variables annual income before and annual income
now. From the table above, we can notice that our p value is .000. This means that our result is
significant since p < 0.05. we therefore reject the null hypothesis in favour of the alternative hypothesis
and conclude that there was a significant difference in their income before and their income now.
The average of their previous income is approximately N91, 000.00 and the average of their present
income is approximately N250, 000.00. This shows that there was an increase in their income and this
can imply increase in standard of living.
iii) Null hypothesis: There is no relationship between the estimated distance from their residence
to the nearest mining site and the level of environmental impact of mining activities.
Alternative hypothesis: There exist a relationship.
H0: ρ = 0 [There is NO actual correlation]
HA: ρ ≠ 0 [This is a correlation]
Table 4.5.4: Correlations
ESTIMATED DISTANCE ENVIRONMENT
AL IMPACT
ESTIMATED
DISTANCE
Pearson
Correlation 1 -.521
Sig. (2-tailed) .000
N 199 184
46
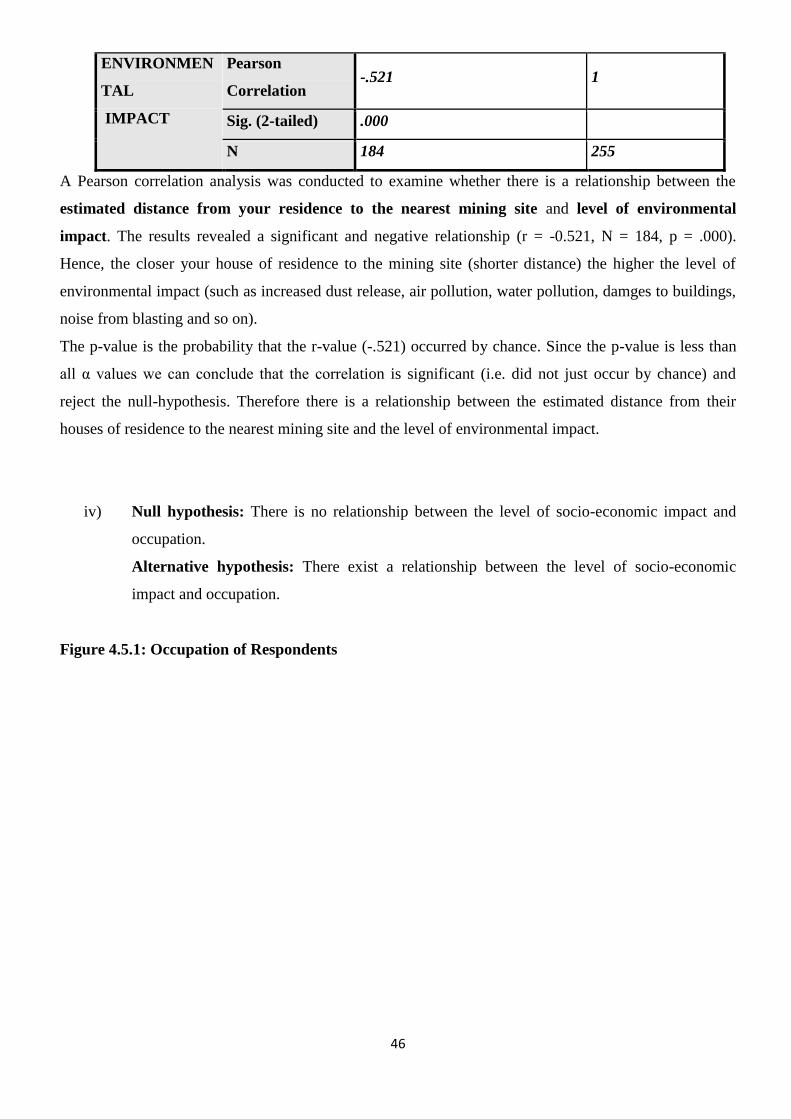
ENVIRONMEN
TAL
IMPACT
Pearson
Correlation -.521 1
Sig. (2-tailed) .000
N 184 255
A Pearson correlation analysis was conducted to examine whether there is a relationship between the
estimated distance from your residence to the nearest mining site and level of environmental
impact. The results revealed a significant and negative relationship (r = -0.521, N = 184, p = .000).
Hence, the closer your house of residence to the mining site (shorter distance) the higher the level of
environmental impact (such as increased dust release, air pollution, water pollution, damges to buildings,
noise from blasting and so on).
The p-value is the probability that the r-value (-.521) occurred by chance. Since the p-value is less than
all α values we can conclude that the correlation is significant (i.e. did not just occur by chance) and
reject the null-hypothesis. Therefore there is a relationship between the estimated distance from their
houses of residence to the nearest mining site and the level of environmental impact.
iv) Null hypothesis: There is no relationship between the level of socio-economic impact and
occupation.
Alternative hypothesis: There exist a relationship between the level of socio-economic
impact and occupation.
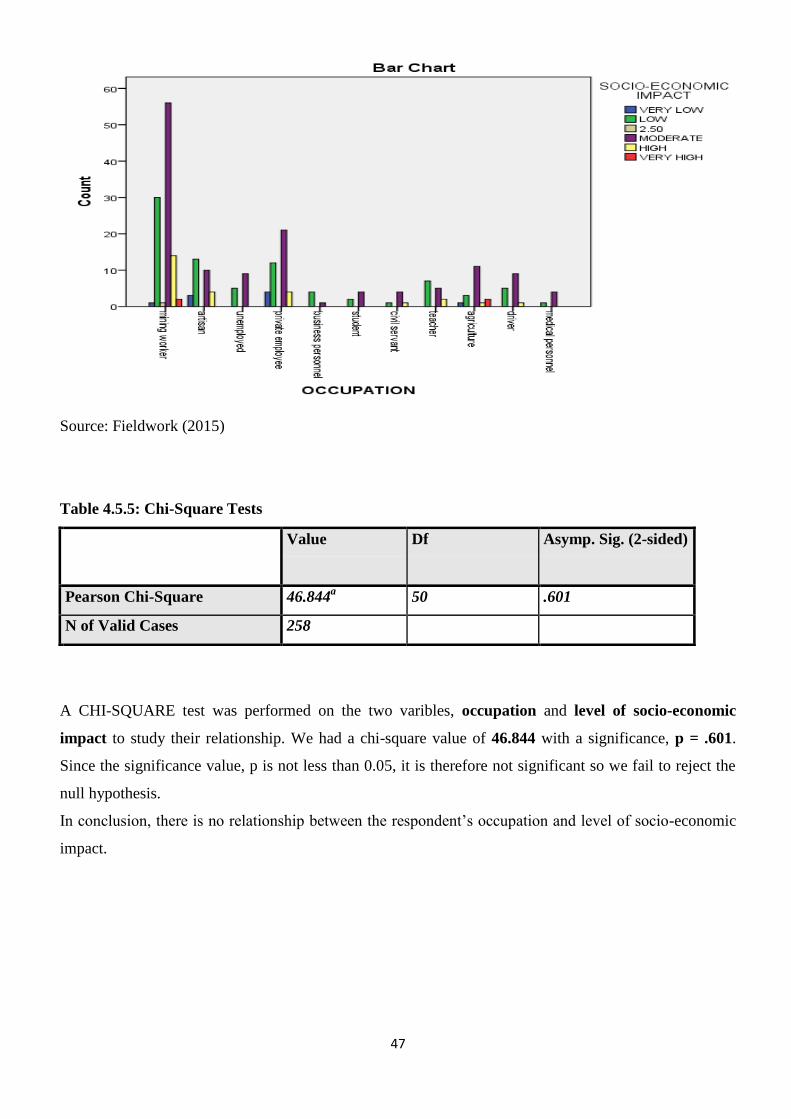
Figure 4.5.1: Occupation of Respondents
47
Source: Fieldwork (2015)
Table 4.5.5: Chi-Square Tests
Value
Df Asymp. Sig. (2-sided)
Pearson Chi-Square 46.844a 50 .601
N of Valid Cases 258
A CHI-SQUARE test was performed on the two varibles, occupation and level of socio-economic
impact to study their relationship. We had a chi-square value of 46.844 with a significance, p = .601.
Since the significance value, p is not less than 0.05, it is therefore not significant so we fail to reject the
null hypothesis.
In conclusion, there is no relationship between the respondent‟s occupation and level of socio-economic
impact.
48
CHAPTER FIVE
SUMMARY, CONCLUSION AND RECOMMENDATIONS
5.1 Summary
The aim of the study was to investigate the environmental and socio-economic effects of artisanal mining
in Oke-Ogun Region on people‟s livelihood. The conceptual framework is on the framework of
environmental sustainability and concept of environmental risk cells. While the literature review was on
the imports of the Nigerian Minerals and Mining Acts 2007, resource-curse phenomenon, the impact of
artisanal mining on the environment and socio-economic impacts of artisanal mining. Four hypothesis
were formulated and tested, and in the end, the following findings were realized;
There is no significant difference in the respondents‟ income based on their type of occupation.
There was a significant difference in their income before and their income now. The average of
their previous income is approximately N91, 000.00 and the average of their present income is
approximately N250, 000.00. This shows that there was an increase in their income and this can
imply increase in standard of living.
There is a relationship between the estimated distance from their house of residence to the nearest
mining site and the level of environmental impact. Therefore the negative impacts of mining is
felt more by people who live closer to mining sites than those who live faraway
There is no relationship between the respondent‟s occupation and level of socio-economic impact.
5.2 Conclusion.
Extraction and processing of mineral resources is the backbone of the national economy in many
developed and developing countries of the world. However, the great danger posed to mining
communities in Oke-Ogun by mineral exploitation such as abandoned sites, biodiversity damage, use of
hazardous chemicals with potential health risk to mine workers and neighboring communities, deserve
urgent attention.
Mining has negatively affected farming in the area by contaminating the soil. Particulates from mineral
mining have degradable effect on soil physicochemical properties and these are added burden to
microvariability of soil properties of the study area.
49
5.3 Recommendations
It is clear that artisanal miners have been operating in the study area but their activities should not be
ignored because of the impacts on the socio-economy and environment. Though their activities cannot be
monitored by government thus enforcement of regulations on violators is not possible. It is essential to
address the issues of these miners so that their activities are formalized. However, when their positive
socio-economic impacts are considered, opinions favour their retention but with strong laws to guide
their operations. It is therefore now fashionable to suggest ways that these activities can promote
sustainable development.
The government should put in place certain programmes to encourage these miners to operate according
to best practice and standard. The advantages of this are that their activities can be monitored and they
can contribute meaningfully to positive environmental and socio-economic development. The following
actions should be undertaken by government:
• The artisanal operators, land owners, and local authorities need to be urgently organized into
cooperative bodies or shareholders of the ventures with the government being involved in the supervision
of the operations.
• Government must support research and development in the designing and fabrication of necessary
operational facilities and equipment for enhancing productivity and minimizing health hazards and risks.
• There is need to implement comprehensive primary health programmes incorporating effective
and efficient epidemiological units in each district or rural division or local government area. Such units
would undertake periodic survey, monitoring and handling of epidemiological problems in mining
communities. They should also be empowered to enforce the use of safety devices such as mining
helmets, nose dust shields and first aids.
• Government should evolve necessary approach for effective conflicts management and resolution
for a sustainable development of the minerals industry.
• Government should establish special mining development Bank (MDB) to provide investment
facilities for the operators. In addition, all current programmes involving international funding such as
by the World Bank need to be appropriately and efficiently managed.
• For effective and optimal revenue derivation and collection, local or district or divisional
governments should preferably in collaboration with relevant departments/ministries at State and Federal
levels be directly involved in the regulation of artisanal mining activities.
50
REFERENCES
Adewole, M.B and Adesina, M.A (2011), Impact of Marble Mining on Soil Properties in a part f Guinea
Savanna Zone of SouthWestern Nigeria. Ethiopian Journal of Environmental Studies and Management.
Vol 4(2).
Aigbedion, I and Iyayi, S.E (2007), Environmental Effect of Mineral Exploitation in Nigeria.
International Journal of Physical Science. Vol 2 (2) 033-038.
Argau, G.O.,Jr (1978): Conference on the Future of Small-Scale Mining. Important for the Future.
UNTAR, New York.
Down, C.G and Stocks, J.(1997): Environmental Impacts of Mining. John Wiley and Sons, New York.
Jimoh, M.T (2011), Petrochemical Studies of Pegmatite around Awo, SouthWestern Nigeria. Journal of
Environmental Issues and Agriculture in Developing Countries. Vol 3 (2) 19-32.
Murtala, Ibraheem .C. (2011), An Examination of the Socio-Economic and Environmental Impact of
Planned Oil Sands Development in Nigeria. PhD Thesis, University of Leicester.
Oguntoke, Olusegun; Aboaba, Adeniyi and Gbadebo, T. Adeola (2009), Granite Quarrying on the Health
of Workers and Nearby Residents in Abeokuta, Ogun State, Nigeria. Ethiopian Journal of Environmental
Studies and Management. Vol 2 (1).
Okeogun/Home. (n.d.). Retrieved March 1, 2016, from http://the%20craftman%20shop.html
Rasheed, A. Ishola and Amuda, Abdulgafar .K. (2014), Impacts of Artisanal Mining on Some Heavy
Metals Concentration in Surface Water in Kutcheri, Zamfara State, NorthWestern Nigeria. Academic
Journal of Interdisciplinary Studies. Vol 3 (7).
Rasheed, Olaniyi , “West African „Stone Boys‟ and the making of the Ibadan Mining Frontiers since the
1990‟s” Paper presented at the African Development Bank Conference, Accra, Ghana (2013).
Ripley et al. (1996): Environmental effects of mining. Delray Beach, Florida: St Lucie Press.
51
Skelding, F. (1972): Small-Scale Mining in the Developing Countries: United Nations, New York.
Stearns, S. (2009): Illegal Mining Threatens Liberian Rainforest. File://E:/illegal mining threatens
Liberian rainforest.htm
Svotwa, R. and Mtetwa, C. (1997): The Environmental Impact of Small-Scale Mining in Zimbabwe.
ITDC, August 1997.
United Nations Environmental Programme (UNEP) (1996): “Environmental and Safety Incidents
Concerning Tailings Dams and Mines”. Results of a Survey for the years 1980-1996, London: Mining
Journal Research Services.
Warhurst, A. (1999): “Environmental Regulation, Innovation and Sustainable Development”: In
Warhurst, A. (ed). Mining and the Environment: Case studies from the Americas (Ottawa, Canada).
International Development Research Center.
Warhurst, A and Insor, R. (1996): Environmental Issues for Developing Countries arising from
Liberalized trade in the mining industry. Natural Resources Forum, 20 (1): 27-35.
Wojciechowski, M.J. (1979): Junior Mining in Canada: The problem of Investment and securing fair
returns. Proceedings 6. Centre for Resources Studiers, Queen‟s University, Kingston, Ontario, Canada.
52
APPENDIX: Questionaire
UNIVERSITY OF IBADAN
DEPARTMENT OF GEOGRAPHY
ENVIRONMENTAL AND SOCIO-ECONOMIC EFFECTS OF ARTISANAL MINING IN OKE-
OGUN REGION
Sir/Ma,
This study aims at investigating the environmental and socio-economic effects of artisanal mining in
Oke-Ogun Region on people‟s livelihood. This survey is purely an academic exercise. We assured you
that any information provided shall be treated as strictly confidential.
SECTION A: DEMOGRAPHIC CHARACTERISTICS OF RESPONDENTS
1. Name of Community/Settlement…………………………………………………………
2. Type of Location (a) Town (b) Village (c) Hamlet (d) Others (Specify)…………………..
3. Community type (a) Mining Community (b) Non-Mining Community
4. Local Government Area ……………………………………………………………………
5. Nationality ………………………………………………………………………………….
6. Gender (a) Male (b) Female
7. Marital status (a) Married (b) Single (c) Divorced (d) Separated (f) Others
8. Household size of respondents……………………………………………………………...
9. How long have you been living in this town/village?............................................................
10. Age of respondent.........................................
11. Highest educational level attained (a) Primary School (b) Secondary School (c) Polytechnic (d)
College of Education (e) University (f) No formal Education
12. Present occupation of respondents (a) Agriculture (b) Mining (c) Petty Trading (d) Agriculture
and mining (e) Agriculture and livestock (f) Charcoal producer (g) Charcoal trader (h)
Government employee (i) Construction worker (j) Agriculture and petty trade (k) Others
(Specify)……………….
13. What was your initial occupation before you switch to the present occupation (a) Agriculture (b)
Mining (c) Petty Trading (d) Agriculture and mining (e) Agriculture and livestock (f) Charcoal
producer (g) Charcoal trader (h) Government employee (i) Construction worker (j) Agriculture
and petty trade (k) Others (Specify)……………….
14. How long have you been engage in this present occupation? ............................................
15. How many years did you spent on the previous occupation………………………………
16. What is your annual income then? .......................................................
17. What is your annual income now? ……………………………………
18. Do you own or rent house here?..........................................................
19. How much do you pay as rent?.............................
20. Estimate distance from your residence to the nearest mining site in Kilometers…………………
21. Estimate time spent to get to the nearest mining site in minutes from your
residence…………………
22. Estimate cost of transportation to the nearest mining site from your residence
……………………………………………
23. List some of the reasons for the occupational change …………………………………….
………………………………………………………………………………………………
24. If you are a mining worker, which aspect of mining do you work
a) Mine owner/ Proprietor of mine shaft
b) Digger
c) Security
d) Mine intermediary.
53
e) Mineral buyer.
f) Please give names of minerals mined here ………………………………………
25. If you are mine owner, how much do you pay as royalty? ………………………………..
SECTION B: SOCIO-ECONOMIC IMPACT OF MINING ACTIVITIES
26. How much is a bag of 50 kilogram of tantalite/tourmaline/sapphire/dimension stone/marble
………………………………………………..
27. Where are these stones washed? ………………………………………………………
TABLE 1: SOCIO-ECONOMIC IMPACT OF MINING ACTIVITIES
Benefits Very
high
(5)
High
(4)
Moderate
(3)
Low
(2)
Very
low
(1)
Changed in style of dressing
Conflict between indigenes and migrant workers
Creation of employment
Drop in school enrollment
Improved electricity supply
Improved social life
Improvement in living standards
Improvement in sale of petty trade items
Increase in crime
Increase in health related diseases
Increase in land price
Increased food crop sales
Increased house rent price
Increases social vices, specify
Large scale influx of immigrants and visitors in
search of jobs
Low agricultural productivity
Security threat
Truancy
Others (Specify)
SECTION C: ENVIRONMENTAL IMPACT OF MINING ACTIVITIES
28. Kindly rate the environmental effects of mining on this community as indicated in table (Please
tick as appropriate)
Table 2: ENVIRONMENTAL IMPACT OF MINING ACTIVITIES
Disadvantages Very
high
(5)
High
(4)
Moderate
(3)
Low
(2)
Very
low
(1)
Increased dust release
Air pollution
Increase in mine pits collapse
Water pollution
54
Threat to farmland and crops
Damages to buildings
Noise from blasting
Deforestation
Land Degradation
Others (Specify)
29. How many members of your family are in the business of mining? …………………….
30. Please indicate any of the under listed diseases you might have had as a result of mining of
tantalite/tourmaline/sapphire/dimension stone/marble;
a) Pulmonary diseases e.g asthma, lung inflammation etc. please indicate……….......
b) Infectious diseases (please indicate …………………
c) Skin rashes
d) Others
31. Has there been any loss of relative as a result mining and processing of
tantalite/tourmaline/sapphire/dimension stone/marble …………………………………
32. What are problem confronting the mining of tantalite/tourmaline/sapphire/dimension
stone/marble …………………………………
33. Has state government indicated interest in the mining of tantalite/tourmaline/sapphire/dimension
stone/marble in this town/village? ……………
34. What steps is government taking towards exploiting this mineral for the development of this
community…………………………………………………………………………….
……………………………………………………………………………………………..
……………………………………………………………………………………………..
35. What other relevant information do you have in respect of mining in this
community?.........................................................................................................................................
.............................................................................................................................................................
....................................................................................................................
Thank you.