Embed Size (px)
Citation preview
Do you think that the lifestyle ofthe inhabitants of your town orcity reflects behavior that is inline with the concept ofsustainable development? Inyour opinion, what should beyour opinion, what should beimproved?
Carlos Guijarro BenitoCarlos Guijarro Benito
Inhabitants of my city: which city?
• My home town is Madrid, where I lived until 2009.• My current city has been Paris for 4 years.
Different countries and languages
• 2.23 million inhabitants in a 105 km2 surface.• Densest city in Europe and 6th worldwide: 21,238 inhabitants/km2.
463 green spaces.
Paris in a few numbers
Similar cultures and issues
Densest city in Europe and 6 worldwide: 21,238 inhabitants/km .• 463 green spaces.• 19,612 taxis, 347 bus lines and 16 metro lines (384 stations).• 6,365 L/s of water consumption.• 35 kg/s of garbage consumption.
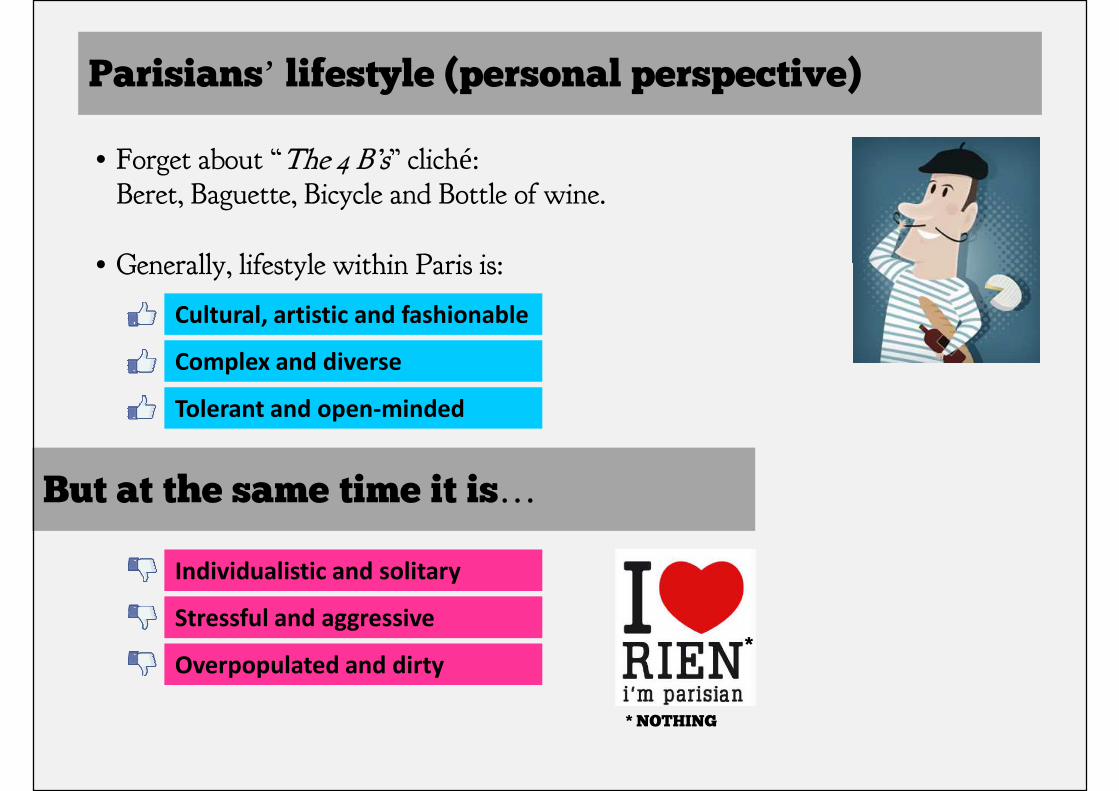
Parisians’ lifestyle (personal perspective)
• Forget about “The 4 B’s” cliché:Beret, Baguette, Bicycle and Bottle of wine.
• Generally, lifestyle within Paris is:• Generally, lifestyle within Paris is:
Cultural, artistic and fashionable
Complex and diverse
Tolerant and open-minded
But at the same time it is…
Individualistic and solitary
Stressful and aggressive
Overpopulated and dirty
* NOTHING
*
What about Parisians’ lifestyle regarding sustainable development?sustainable development?
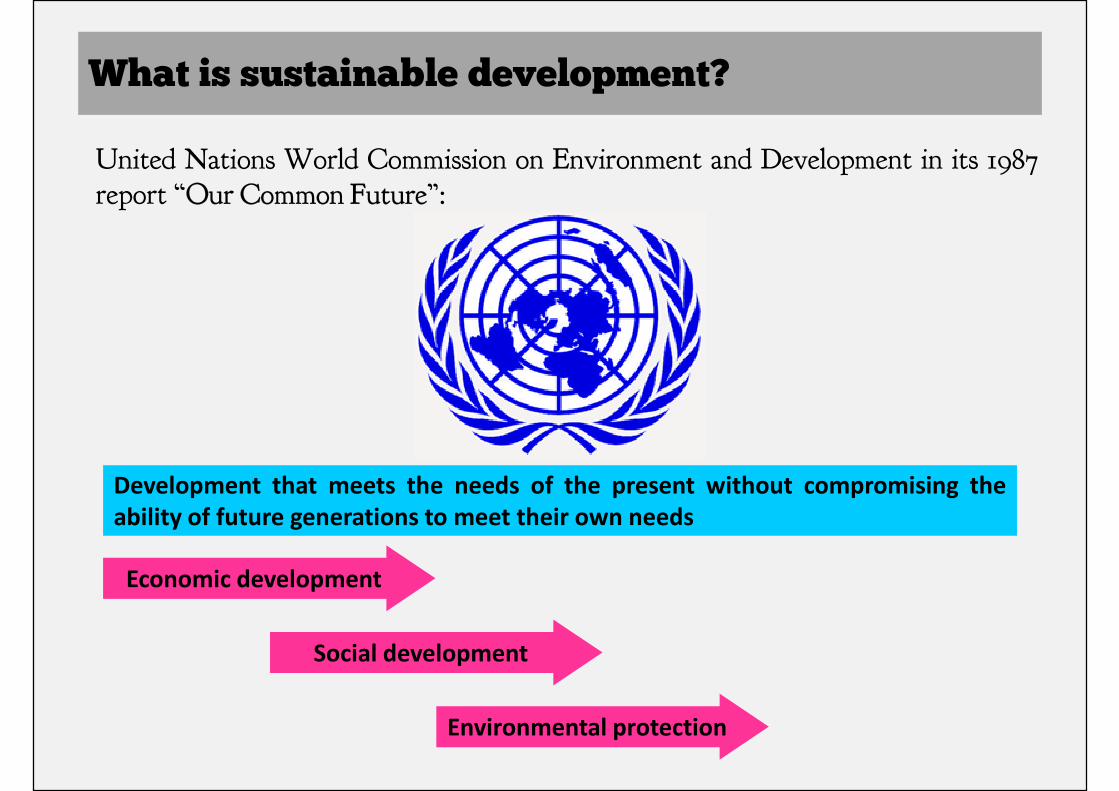
What is sustainable development?
United Nations World Commission on Environment and Development in its 1987report “Our Common Future”:
Development that meets the needs of the present without compromising the
ability of future generations to meet their own needsability of future generations to meet their own needs
Economic development
Social development
Environmental protection
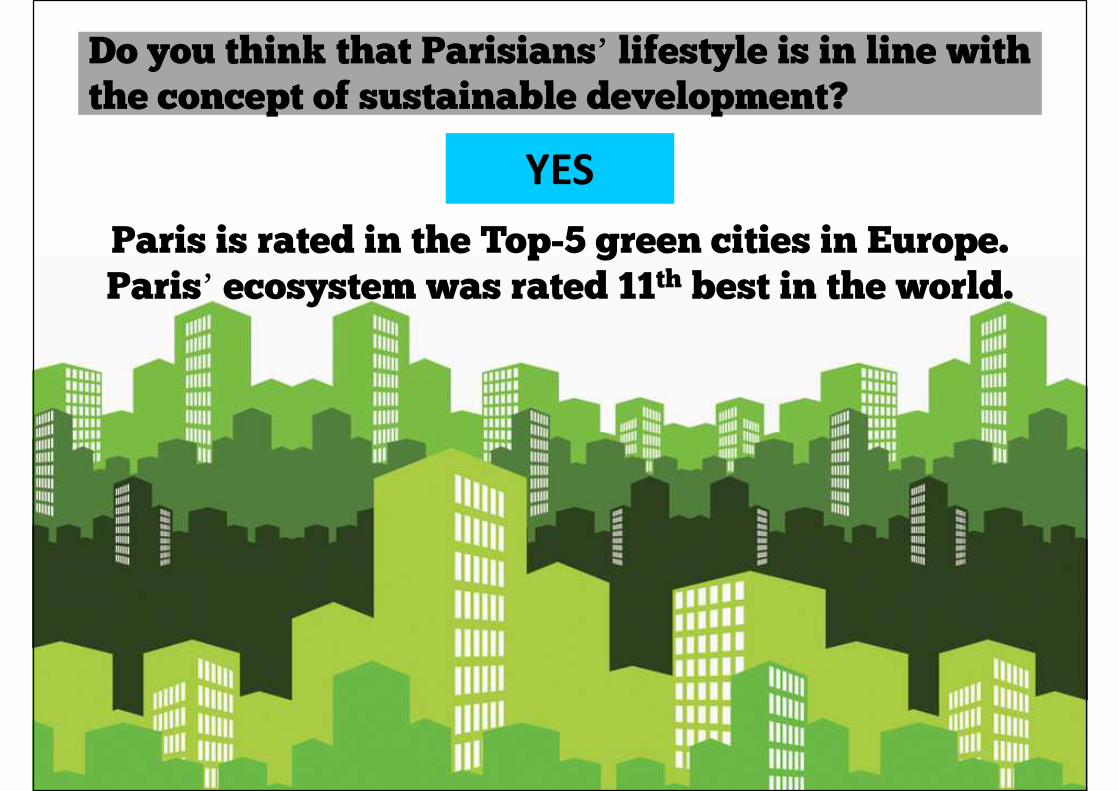
Paris is rated in the Top-5 green cities in Europe.
Do you think that Parisians’ lifestyle is in line withthe concept of sustainable development?
YES
Paris’ ecosystem was rated 11th best in the world.
Parisians’ lifestyle & sustainable development
Daily commute
60 min or more
45 to 60 min
30 to 45 min
On foot
Bicycle
Motorbike
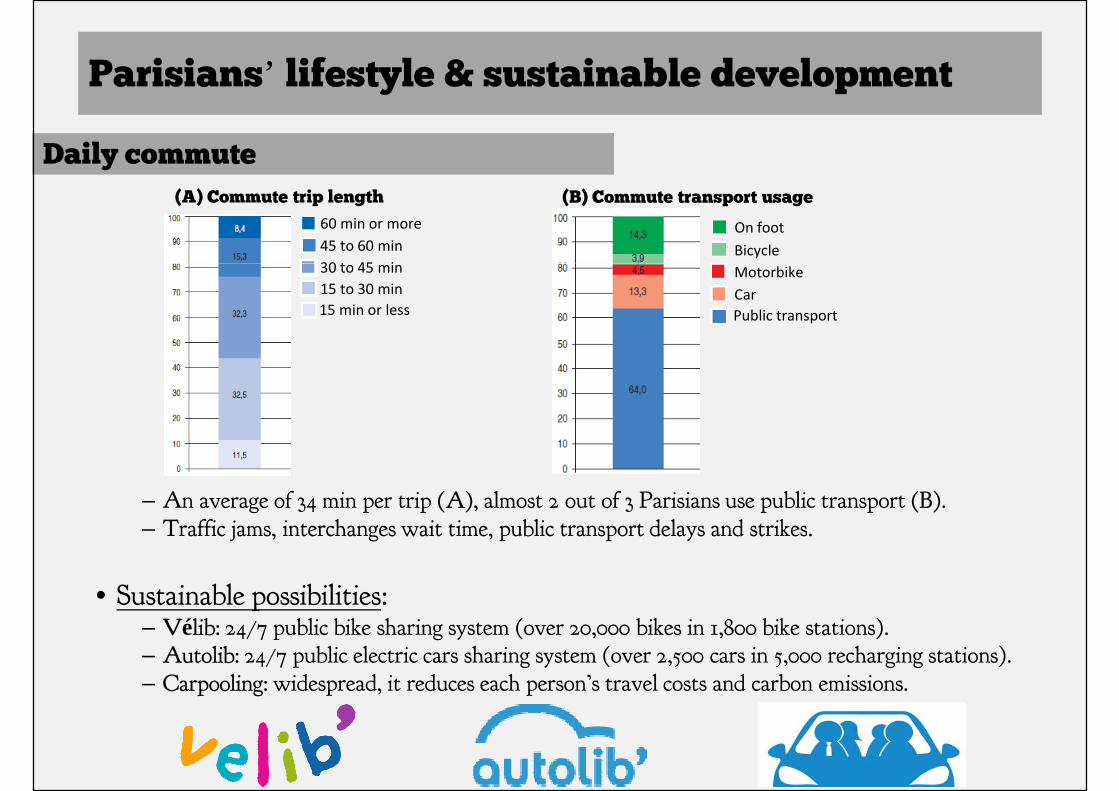
(A) Commute trip length (B) Commute transport usage
– An average of 34 min per trip (A), almost 2 out of 3 Parisians use public transport (B).– Traffic jams, interchanges wait time, public transport delays and strikes.
30 to 45 min
15 to 30 min
15 min or less
Motorbike
Car
Public transport
– Traffic jams, interchanges wait time, public transport delays and strikes.
• Sustainable possibilities:– Vélib: 24/7 public bike sharing system (over 20,000 bikes in 1,800 bike stations).– Autolib: 24/7 public electric cars sharing system (over 2,500 cars in 5,000 recharging stations).– Carpooling: widespread, it reduces each person’s travel costs and carbon emissions.
Parisians’ lifestyle & sustainable development
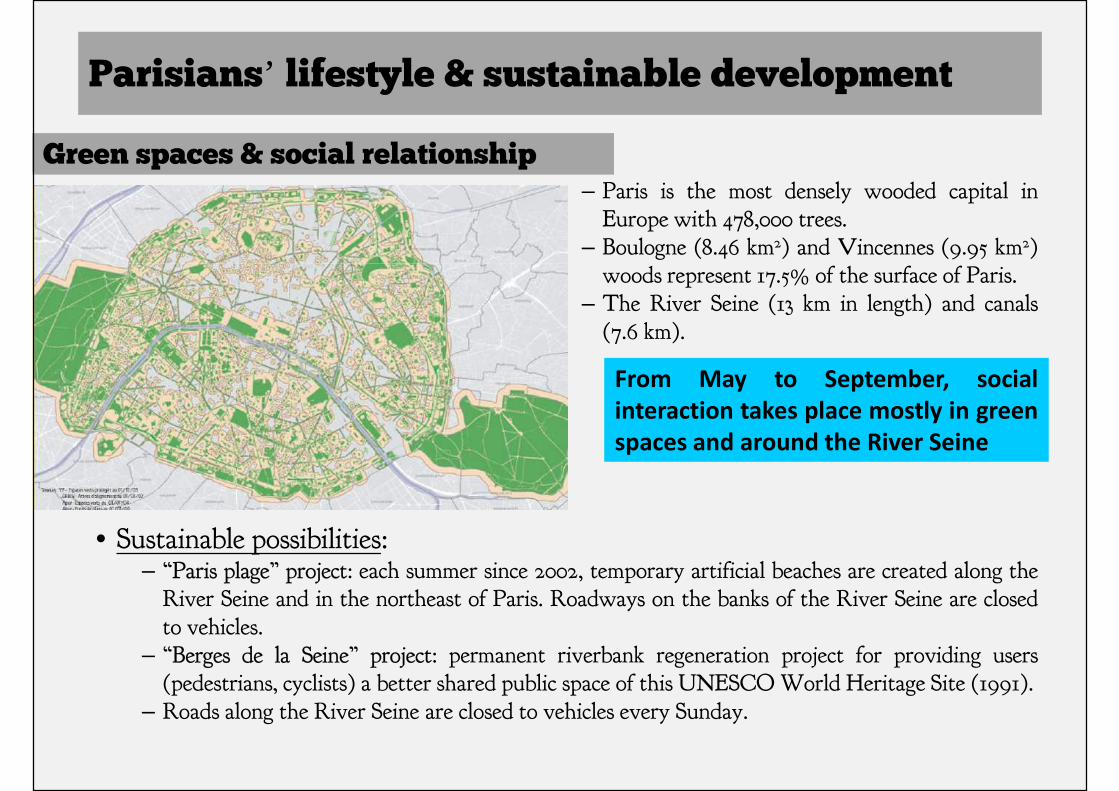
– Paris is the most densely wooded capital inEurope with 478,000 trees.
– Boulogne (8.46 km2) and Vincennes (9.95 km2)woods represent 17.5% of the surface of Paris.
Green spaces & social relationship
woods represent 17.5% of the surface of Paris.
– The River Seine (13 km in length) and canals(7.6 km).
• Sustainable possibilities:
From May to September, social
interaction takes place mostly in green
spaces and around the River Seine
• Sustainable possibilities:– “Paris plage” project: each summer since 2002, temporary artificial beaches are created along the
River Seine and in the northeast of Paris. Roadways on the banks of the River Seine are closed
to vehicles.– “Berges de la Seine” project: permanent riverbank regeneration project for providing users
(pedestrians, cyclists) a better shared public space of this UNESCO World Heritage Site (1991).
– Roads along the River Seine are closed to vehicles every Sunday.
Parisians’ lifestyle & sustainable development
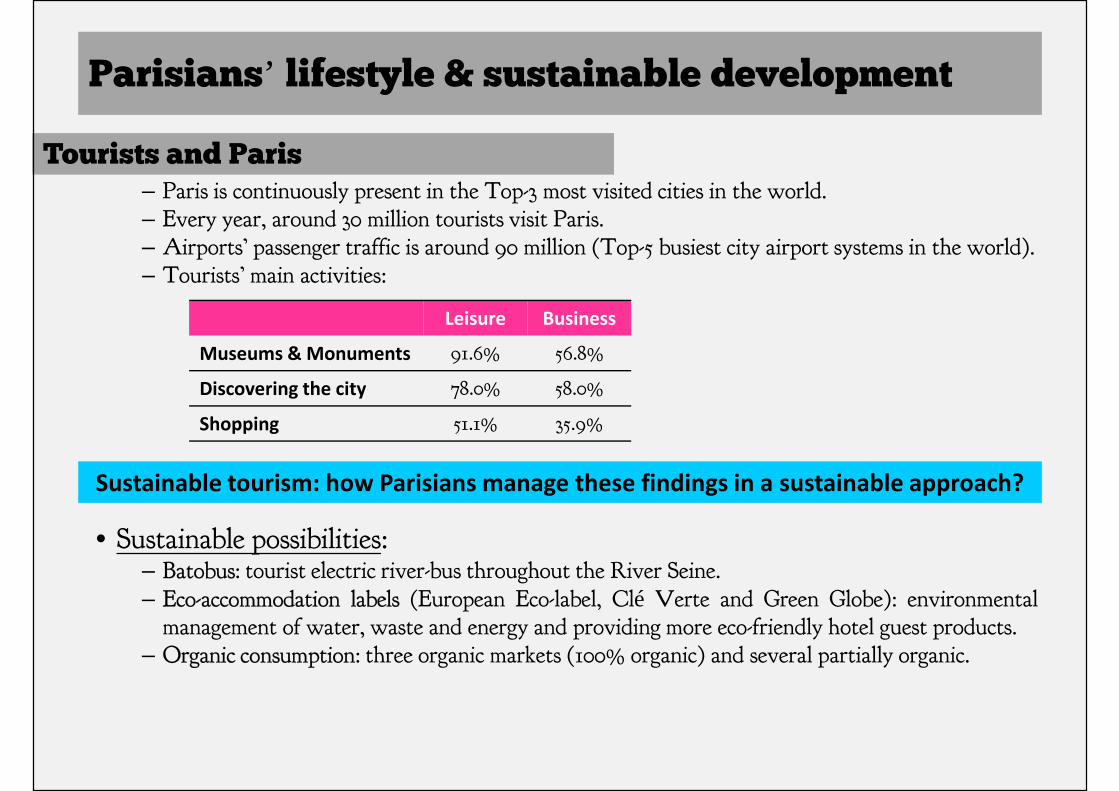
– Paris is continuously present in the Top-3 most visited cities in the world.– Every year, around 30 million tourists visit Paris.– Airports’ passenger traffic is around 90 million (Top-5 busiest city airport systems in the world).– Tourists’ main activities:
Tourists and Paris
– Tourists’ main activities:
• Sustainable possibilities:
Sustainable tourism: how Parisians manage these findings in a sustainable approach?
Leisure Business
Museums & Monuments 91.6% 56.8%
Discovering the city 78.0% 58.0%
Shopping 51.1% 35.9%
• Sustainable possibilities:– Batobus: tourist electric river-bus throughout the River Seine.
– Eco-accommodation labels (European Eco-label, Clé Verte and Green Globe): environmentalmanagement of water, waste and energy and providing more eco-friendly hotel guest products.
– Organic consumption: three organic markets (100% organic) and several partially organic.
In your opinion, what should be improved?
Proposed improvements
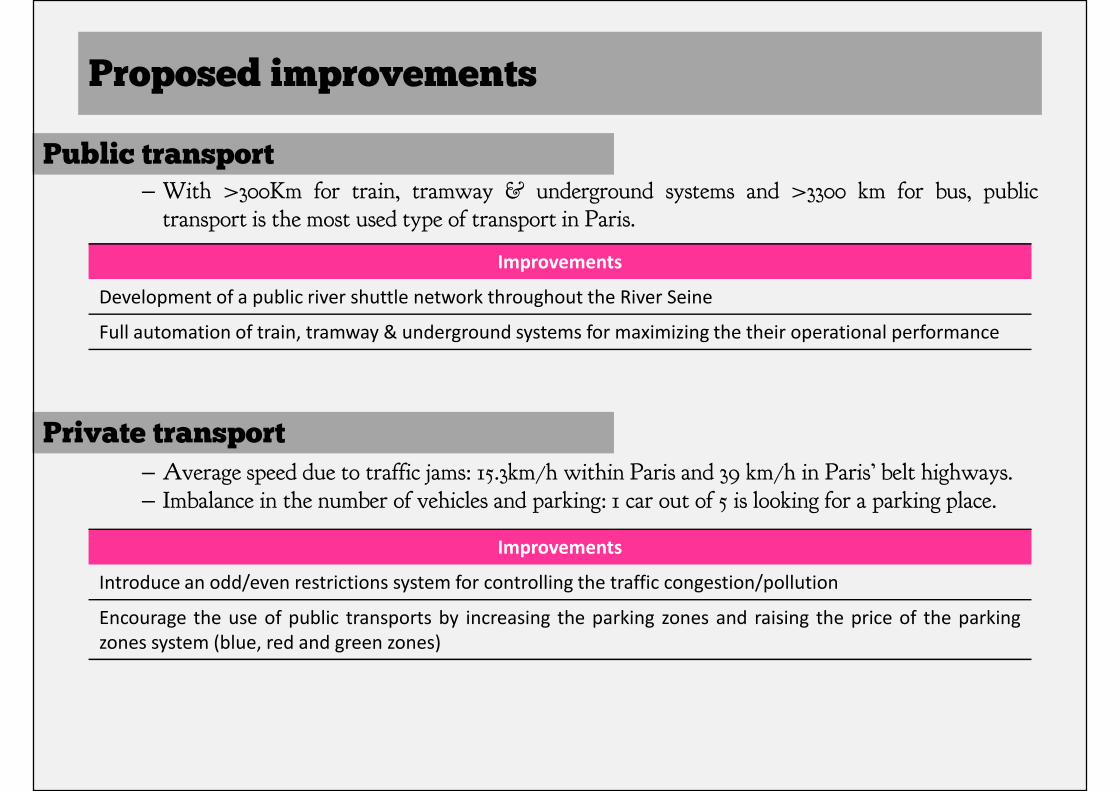
– With >300Km for train, tramway & underground systems and >3300 km for bus, publictransport is the most used type of transport in Paris.
Public transport
Improvements
– Average speed due to traffic jams: 15.3km/h within Paris and 39 km/h in Paris’ belt highways.
– Imbalance in the number of vehicles and parking: 1 car out of 5 is looking for a parking place.
Improvements
Development of a public river shuttle network throughout the River Seine
Full automation of train, tramway & underground systems for maximizing the their operational performance
Private transport
Improvements
Introduce an odd/even restrictions system for controlling the traffic congestion/pollution
Encourage the use of public transports by increasing the parking zones and raising the price of the parking
zones system (blue, red and green zones)
Proposed improvements
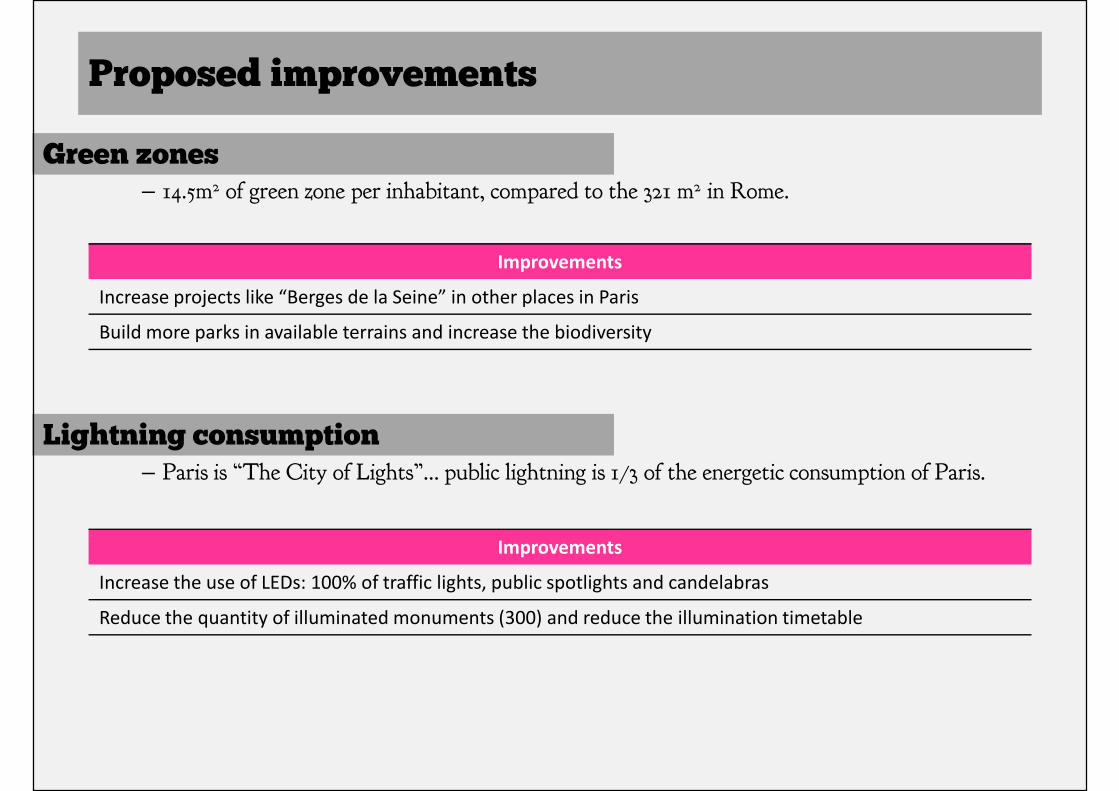
– 14.5m2 of green zone per inhabitant, compared to the 321 m2 in Rome.
Green zones
Improvements
– Paris is “The City of Lights”… public lightning is 1/3 of the energetic consumption of Paris.
Improvements
Increase projects like “Berges de la Seine” in other places in Paris
Build more parks in available terrains and increase the biodiversity
Lightning consumption
Improvements
Increase the use of LEDs: 100% of traffic lights, public spotlights and candelabras
Reduce the quantity of illuminated monuments (300) and reduce the illumination timetable
Proposed improvements
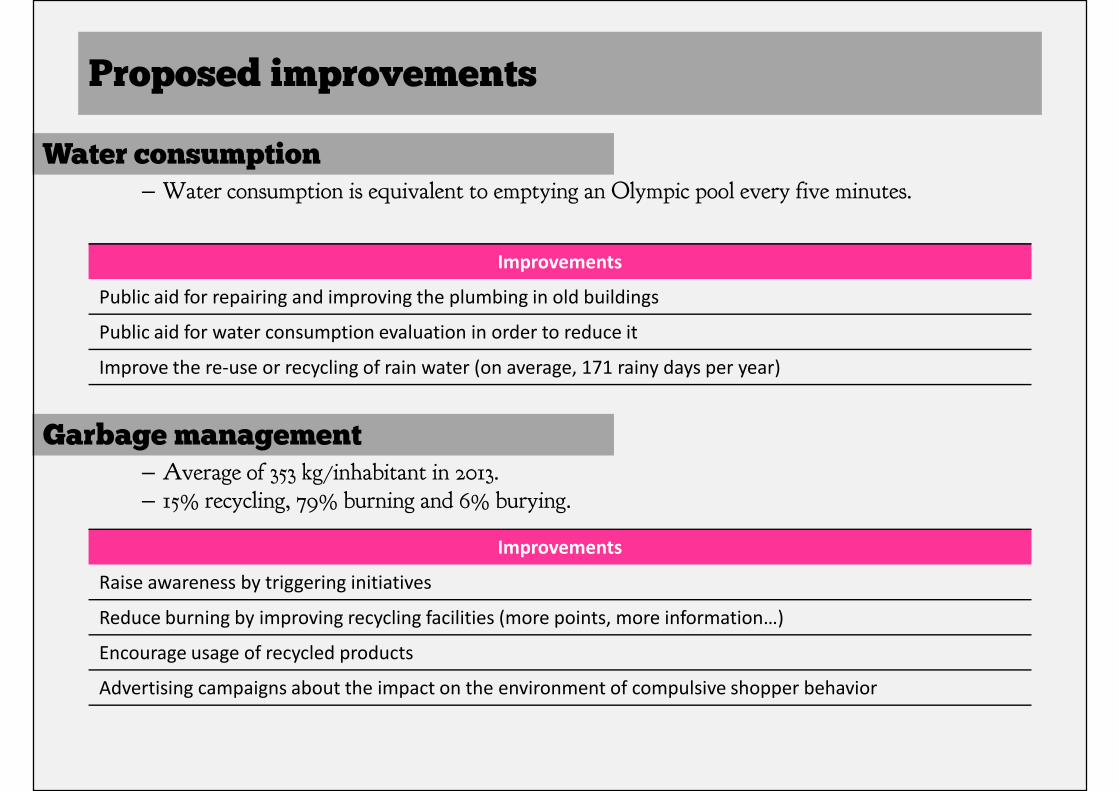
– Water consumption is equivalent to emptying an Olympic pool every five minutes.
Water consumption
Improvements
– Average of 353 kg/inhabitant in 2013.
– 15% recycling, 79% burning and 6% burying.
Improvements
Public aid for repairing and improving the plumbing in old buildings
Public aid for water consumption evaluation in order to reduce it
Improve the re-use or recycling of rain water (on average, 171 rainy days per year)
Garbage management
Improvements
Raise awareness by triggering initiatives
Reduce burning by improving recycling facilities (more points, more information…)
Encourage usage of recycled products
Advertising campaigns about the impact on the environment of compulsive shopper behavior

THANK YOU