Embed Size (px)
Citation preview
1
Assessing Student Self-Assessment:
learning analytics to support student
success and teaching practice in HE
Fabio R. Aricò
#design4learning
26-27 Nov 2014

ACKNOWLEDGEMENTS
UEA-HEFCE Widening Participation Teaching Fellowship
HEA – Teaching Development Grant Scheme
2
PROJECT DEVELOPMENTS
Project Resources: https://sites.google.com/site/fabioarico/hea_tdg
Project Workshop: Wednesday 3 Sep 2014 - University of East Anglia
3
ETHICAL REMARK
You will be presented with data collected during teaching sessions.
Students involved have given informed consent for me to analyse their responses and present the results of this analysis.
I can assist with ethical queries as well, please ask me.
4
OUTLINE
1. Overview of the “When Student Confidence Clicks Project”
2. Introduction to 2 learning environments to be compared:seminars and workshops
Learning analytics:the relationship between attainment & self-assessment
4. Final remarks: assessing self-assessment
5. Further research
5
1. When Student Confidence Clicks: the role of Academic Self-Efficacy in Learning
6
BLENDED LEARNING ENVIRONMENT
• Intense use of Student Response Systems (clickers).
• Focus on increasing students’ Academic Self-Efficacy beliefs Self-Assessment is a fundamental component.
• Intense use of SRS + VLE dialogue with the students – closing feedback loop blended learning, but also blended surveying!
• Learning analytics to disentangle relationship between different aspects of the learning experience.
7
8
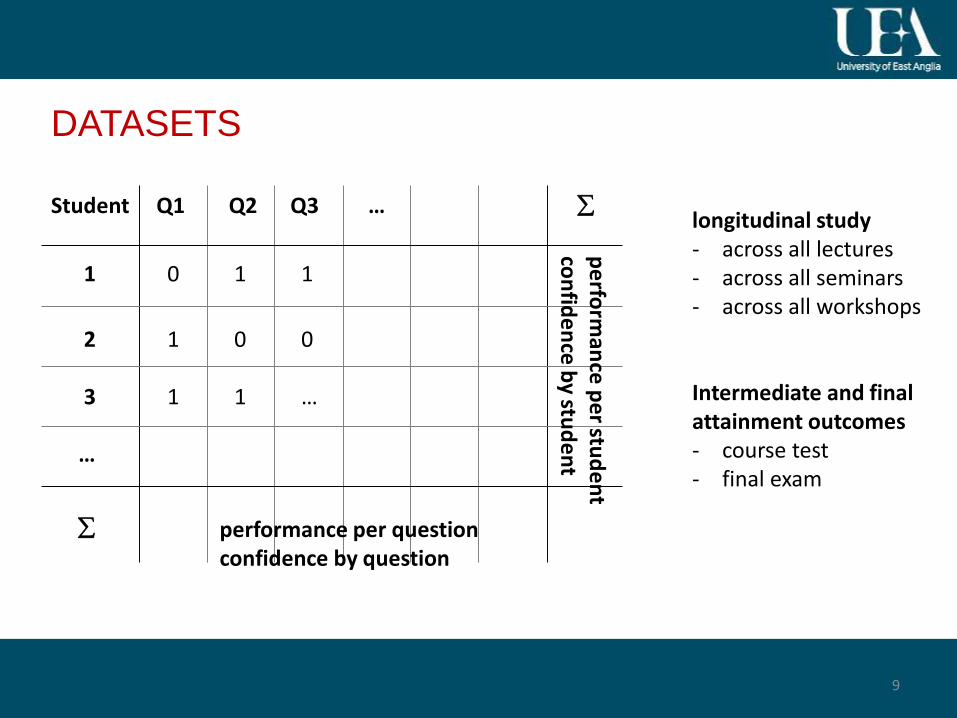
DATASETS
Student Q1 Q2 Q3 …
1 0 1 1
2 1 0 0
3 1 1 …
…
performance per questionconfidence by question
pe
rform
ance
pe
r stud
en
tco
nfid
en
ce by stu
de
nt
9
longitudinal study- across all lectures- across all seminars- across all workshops
Intermediate and final attainment outcomes- course test- final exam
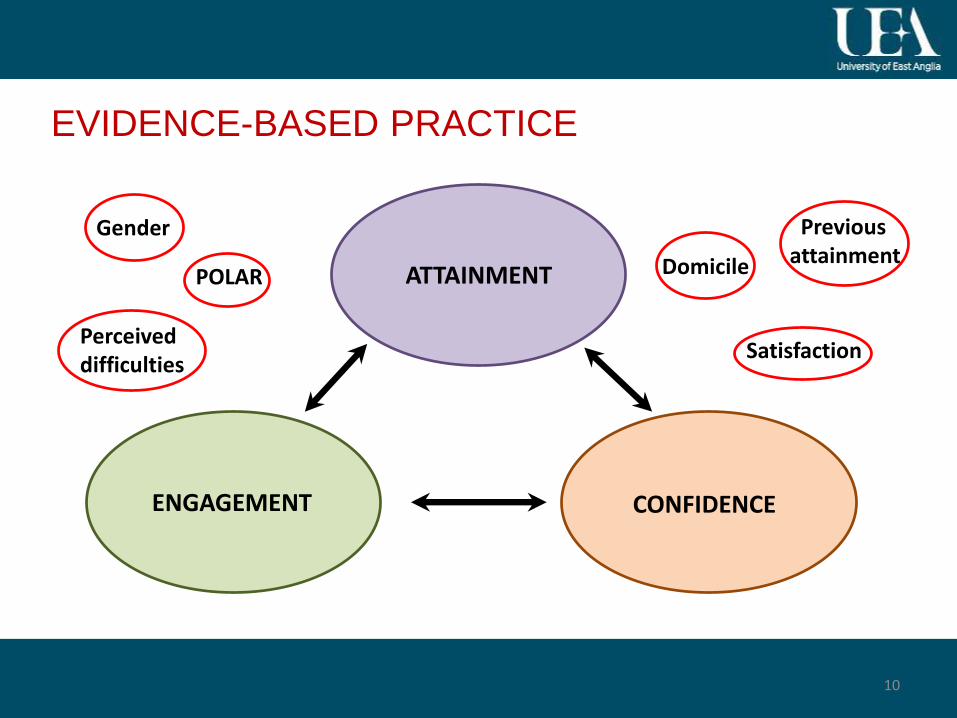
EVIDENCE-BASED PRACTICE
10
ATTAINMENT
ENGAGEMENT CONFIDENCE
Gender
Satisfaction
Previous attainmentDomicilePOLAR
Perceived difficulties
2. Workshops and Seminars
Attainment & Self-Assessment
11
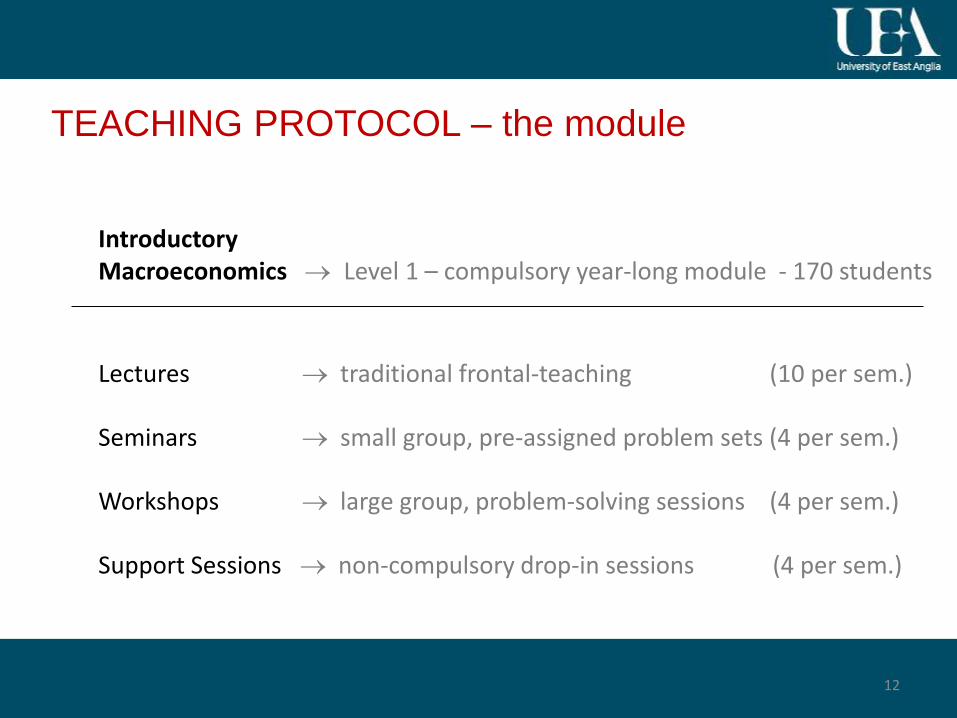
TEACHING PROTOCOL – the module
Introductory Macroeconomics Level 1 – compulsory year-long module - 170 students
Lectures traditional frontal-teaching (10 per sem.)
Seminars small group, pre-assigned problem sets (4 per sem.)
Workshops large group, problem-solving sessions (4 per sem.)
Support Sessions non-compulsory drop-in sessions (4 per sem.)
12
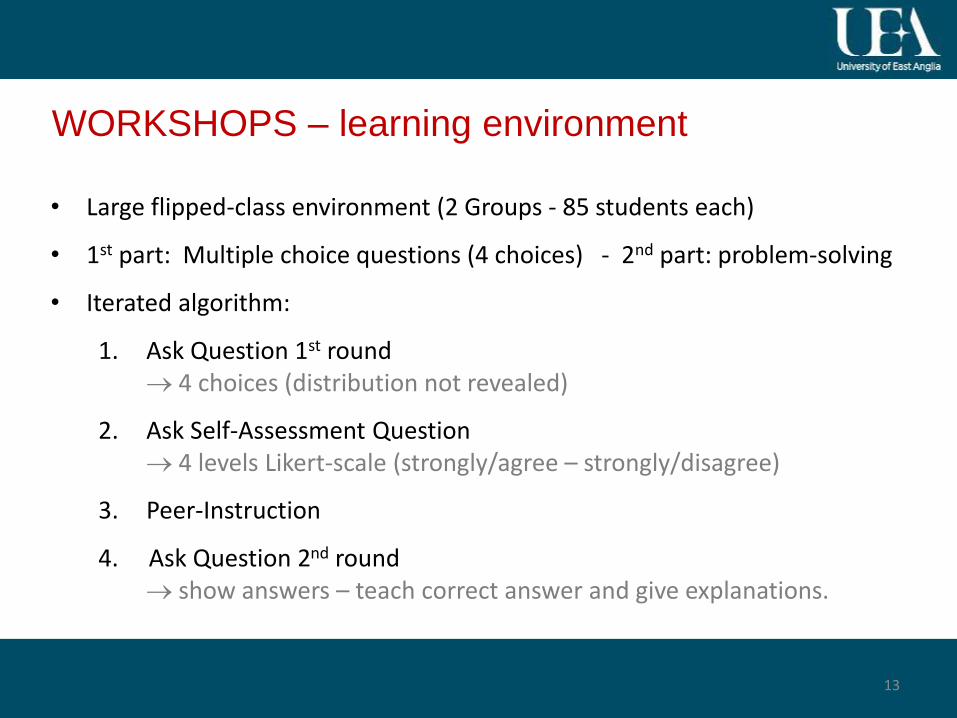
WORKSHOPS – learning environment
• Large flipped-class environment (2 Groups - 85 students each)
• 1st part: Multiple choice questions (4 choices) - 2nd part: problem-solving
• Iterated algorithm:
1. Ask Question 1st round 4 choices (distribution not revealed)
2. Ask Self-Assessment Question 4 levels Likert-scale (strongly/agree – strongly/disagree)
3. Peer-Instruction
4. Ask Question 2nd round show answers – teach correct answer and give explanations.
13
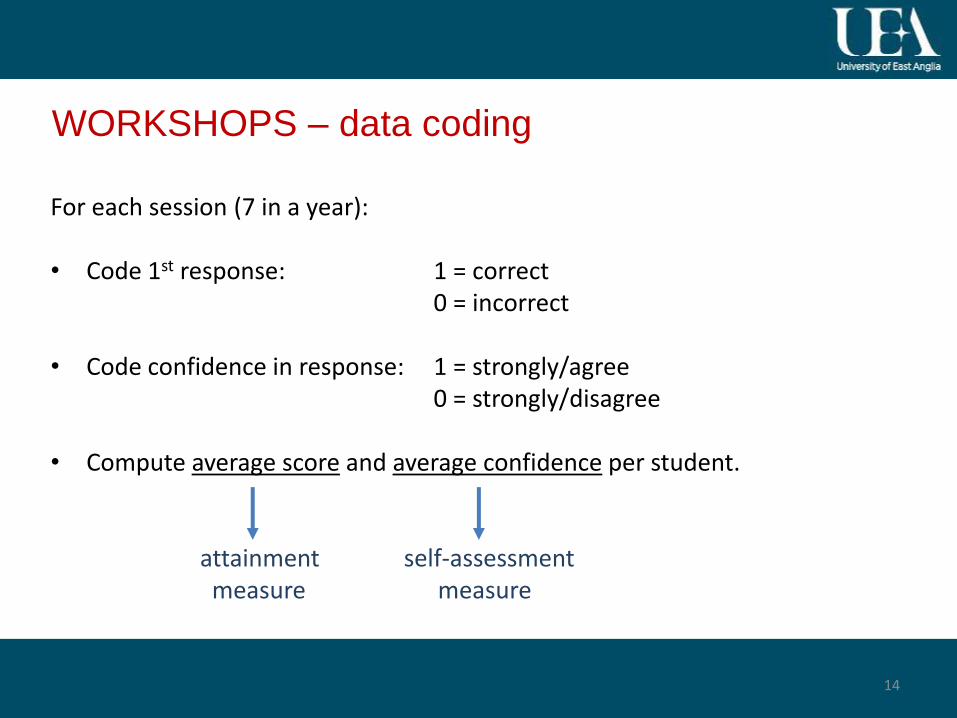
WORKSHOPS – data coding
For each session (7 in a year):
• Code 1st response: 1 = correct 0 = incorrect
• Code confidence in response: 1 = strongly/agree0 = strongly/disagree
• Compute average score and average confidence per student.
attainment self-assessmentmeasure measure
14
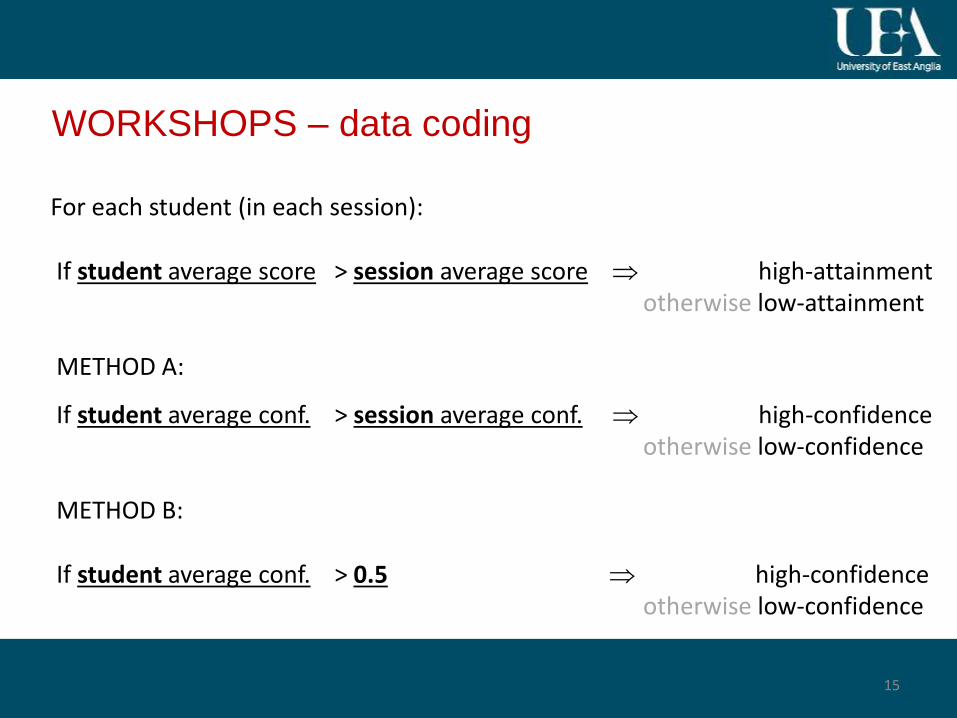
WORKSHOPS – data coding
For each student (in each session):
If student average score > session average score high-attainmentotherwise low-attainment
METHOD A:
If student average conf. > session average conf. high-confidenceotherwise low-confidence
METHOD B:
If student average conf. > 0.5 high-confidenceotherwise low-confidence
15
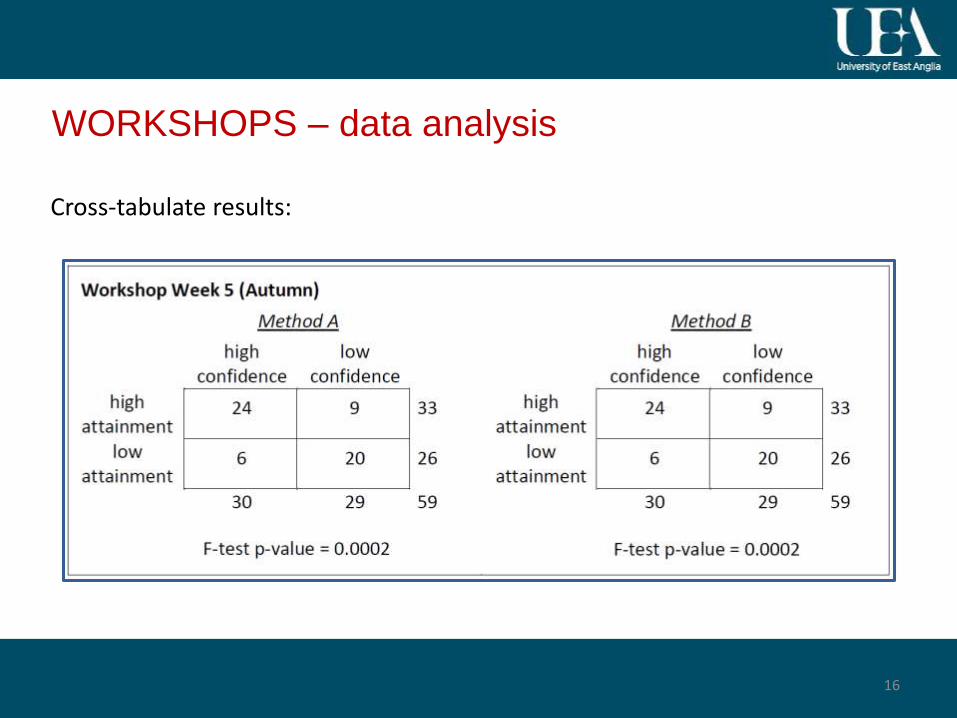
WORKSHOPS – data analysis
Cross-tabulate results:
16
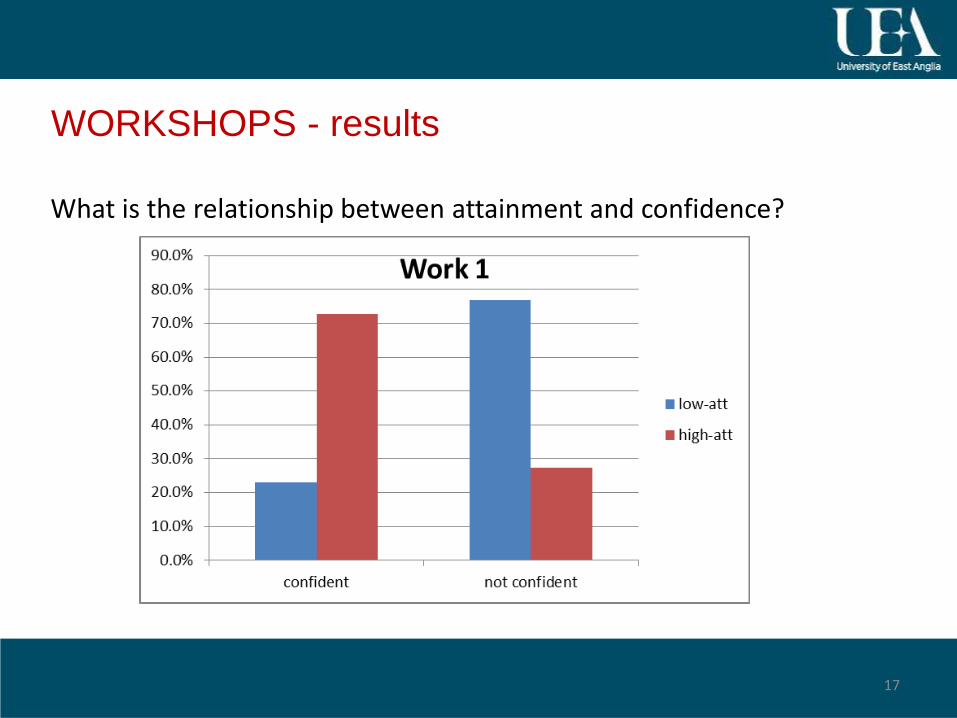
WORKSHOPS - results
What is the relationship between attainment and confidence?
17
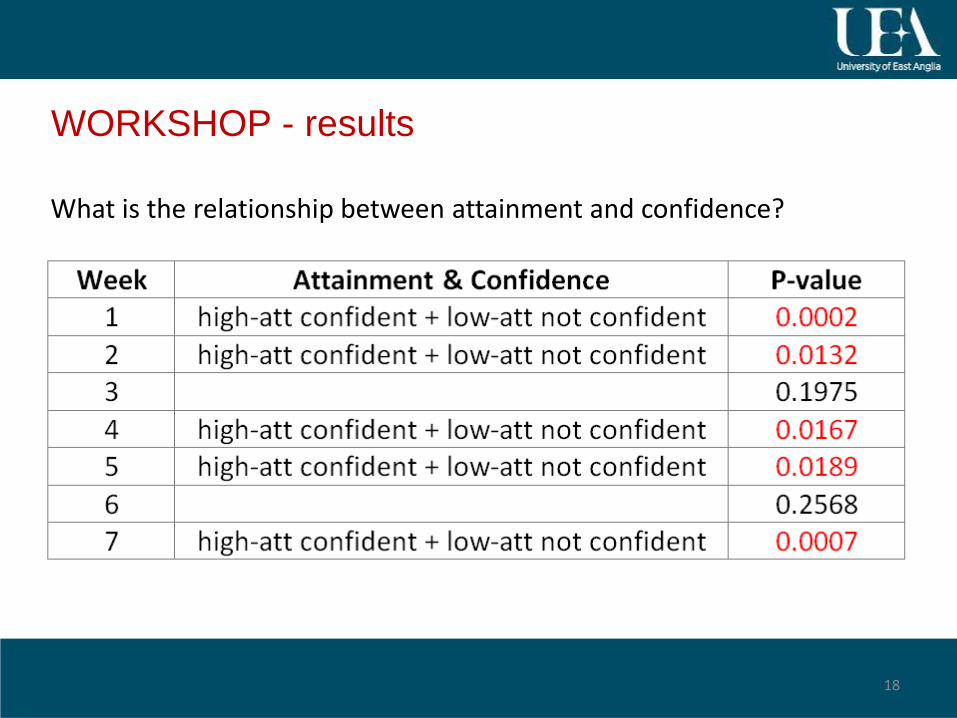
WORKSHOP - results
What is the relationship between attainment and confidence?
18
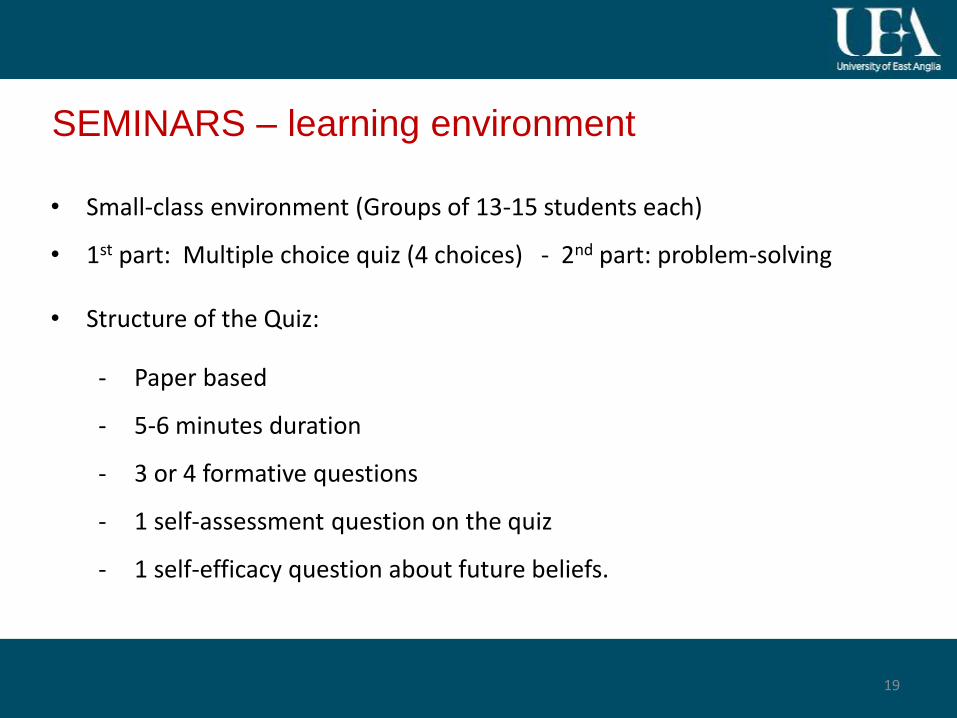
SEMINARS – learning environment
• Small-class environment (Groups of 13-15 students each)
• 1st part: Multiple choice quiz (4 choices) - 2nd part: problem-solving
• Structure of the Quiz:
- Paper based
- 5-6 minutes duration
- 3 or 4 formative questions
- 1 self-assessment question on the quiz
- 1 self-efficacy question about future beliefs.
19
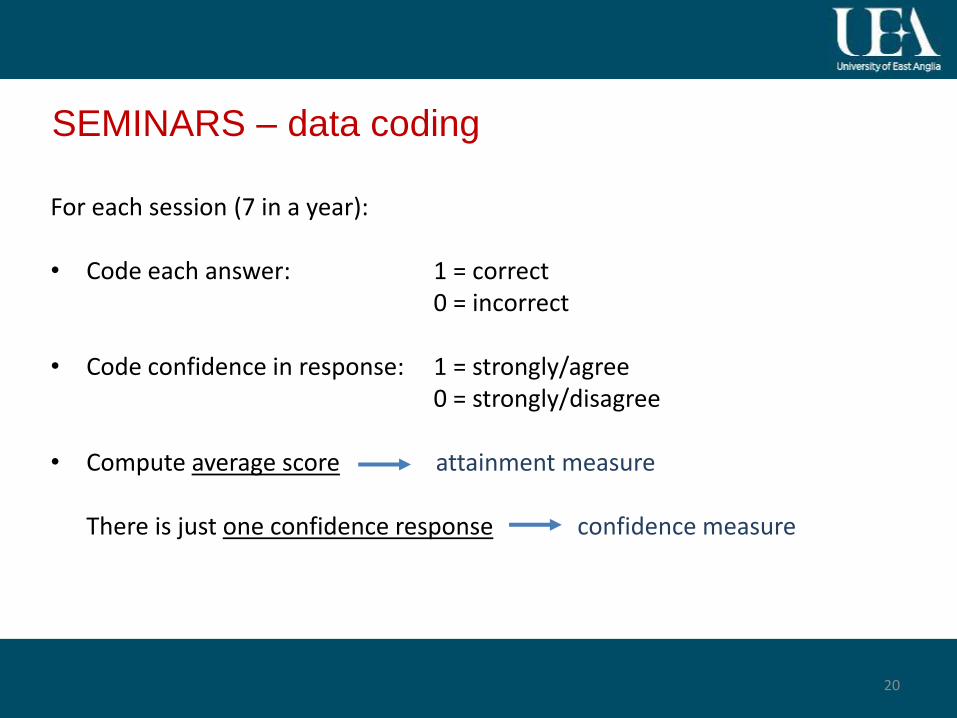
SEMINARS – data coding
For each session (7 in a year):
• Code each answer: 1 = correct 0 = incorrect
• Code confidence in response: 1 = strongly/agree0 = strongly/disagree
• Compute average score attainment measure
There is just one confidence response confidence measure
20
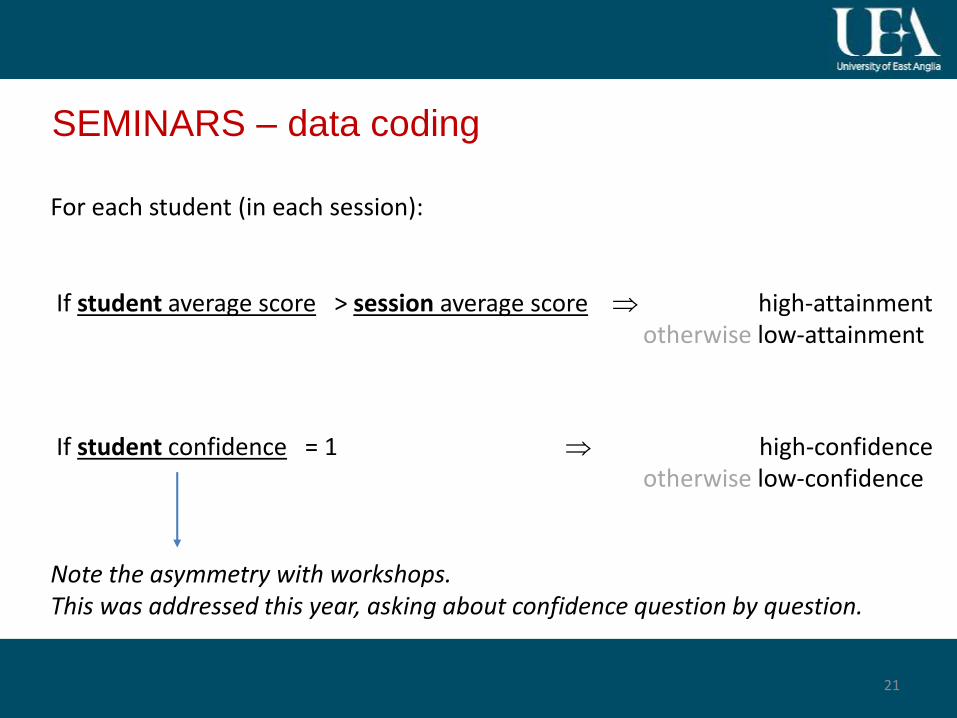
SEMINARS – data coding
For each student (in each session):
If student average score > session average score high-attainmentotherwise low-attainment
If student confidence = 1 high-confidenceotherwise low-confidence
Note the asymmetry with workshops.This was addressed this year, asking about confidence question by question.
21
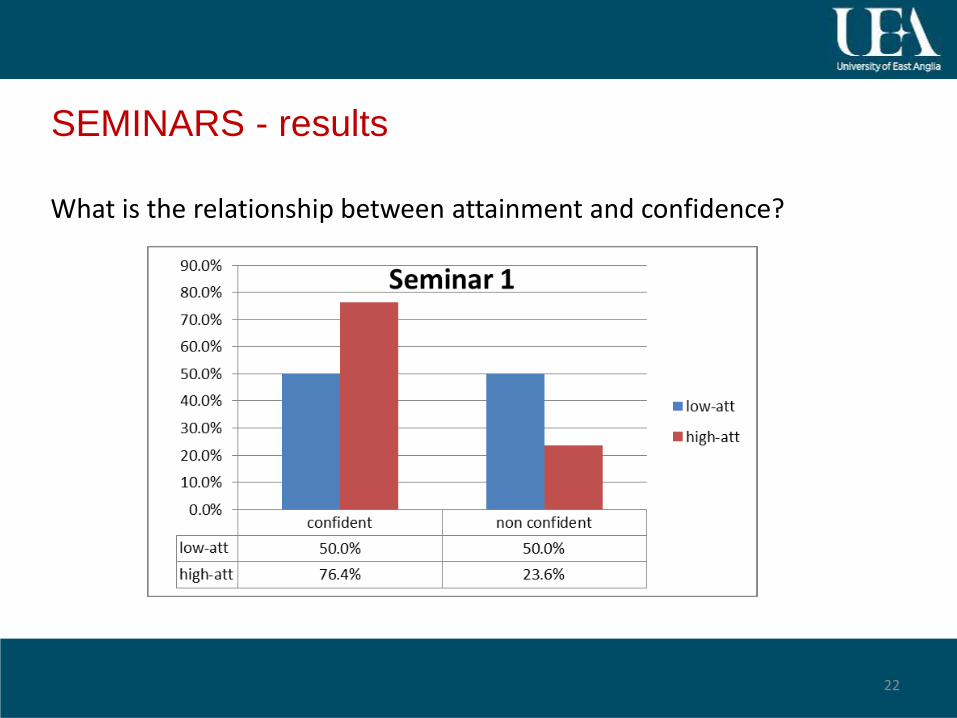
SEMINARS - results
What is the relationship between attainment and confidence?
22
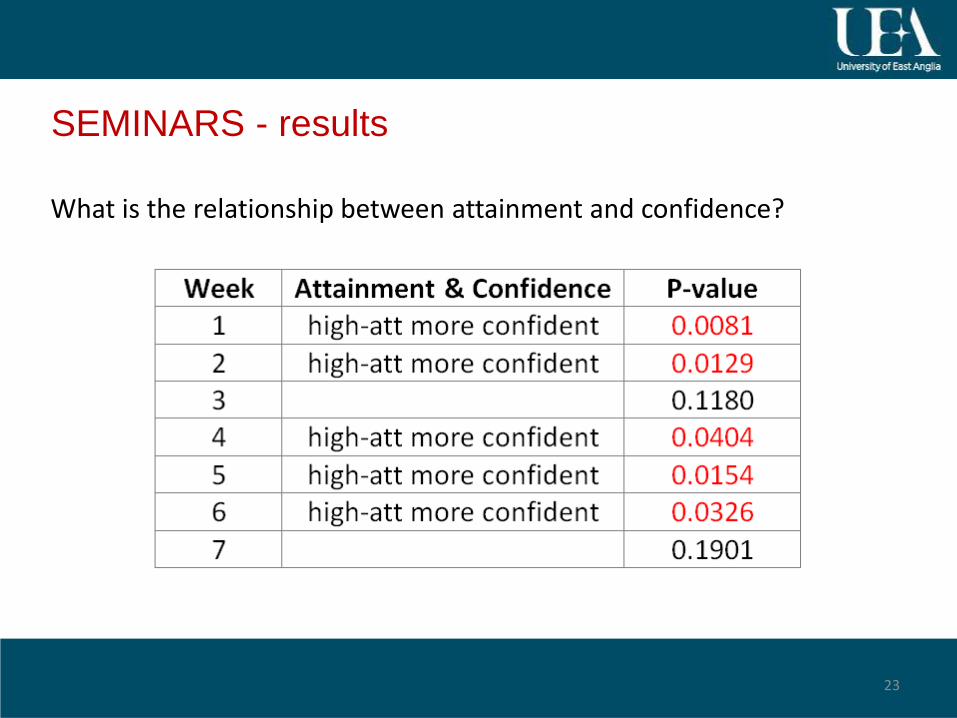
SEMINARS - results
What is the relationship between attainment and confidence?
23
3. Final Remarks
Assessing Self-Assessment
24
PREVIOUS LITERATURE
• In literature there is a prevailing idea:
low-attainment students are not able to self-assess their performance.
• Dunning, D., Johnson, K., Ehrlinger, J., and Kruger, J., (2003), “Why People Fail
to Recognise their Own Incompetence”, Current Directions in Psychological
Science, 12:83, 83-87.
• But the results find in my research seem to question the learning environment
within which self-assessment is being observed.
the learning environment affects the relationship attainment-confidence.
25
OVERALL RESULTS
• In Seminar Quizzes:
high-attainment students display higher confidence
low-attainment students not able to self-assess their performance.
• In Workshop sessions:
high-attainment students display higher confidence
low-attainment students display lower confidence.
• How to interpret this asymmetry?
26
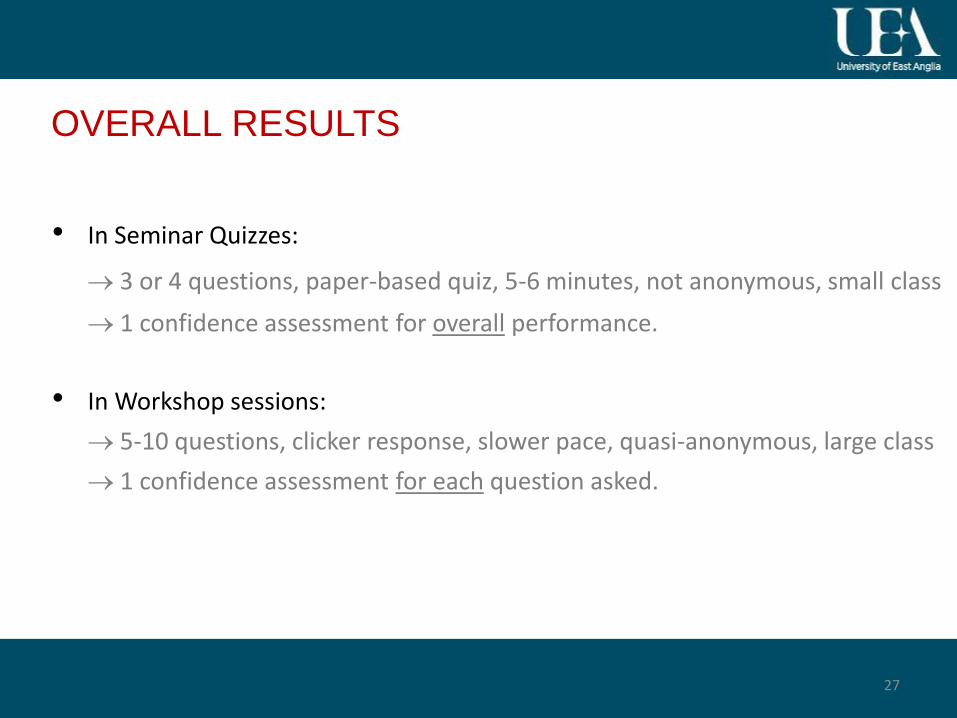
OVERALL RESULTS
• In Seminar Quizzes:
3 or 4 questions, paper-based quiz, 5-6 minutes, not anonymous, small class
1 confidence assessment for overall performance.
• In Workshop sessions:
5-10 questions, clicker response, slower pace, quasi-anonymous, large class
1 confidence assessment for each question asked.
27
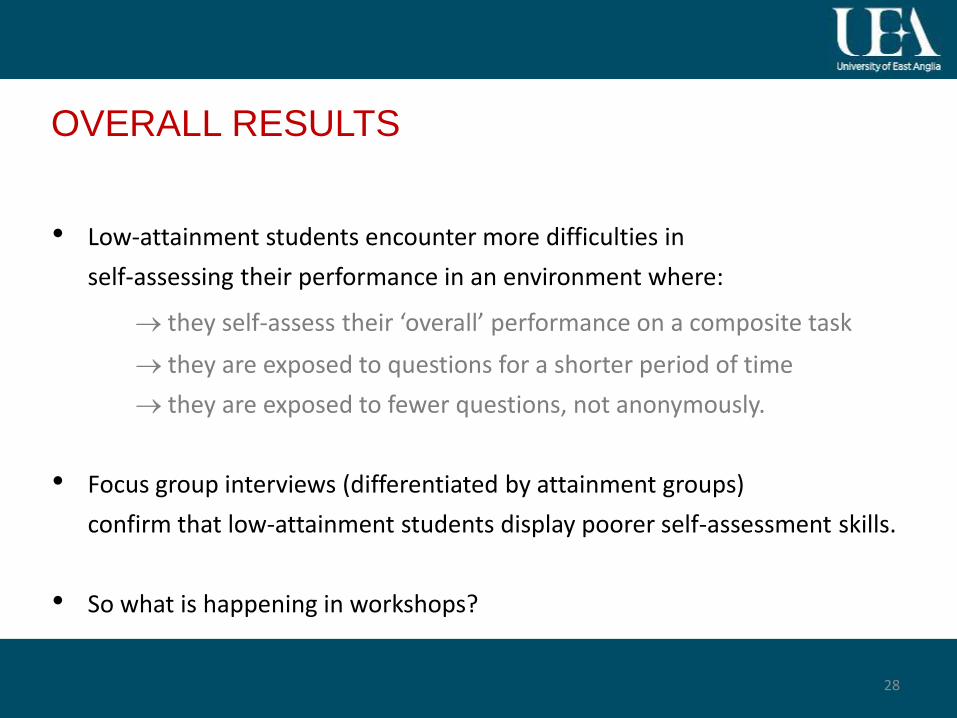
OVERALL RESULTS
• Low-attainment students encounter more difficulties in
self-assessing their performance in an environment where:
they self-assess their ‘overall’ performance on a composite task
they are exposed to questions for a shorter period of time
they are exposed to fewer questions, not anonymously.
• Focus group interviews (differentiated by attainment groups)
confirm that low-attainment students display poorer self-assessment skills.
• So what is happening in workshops?
28
4. Further Research
29
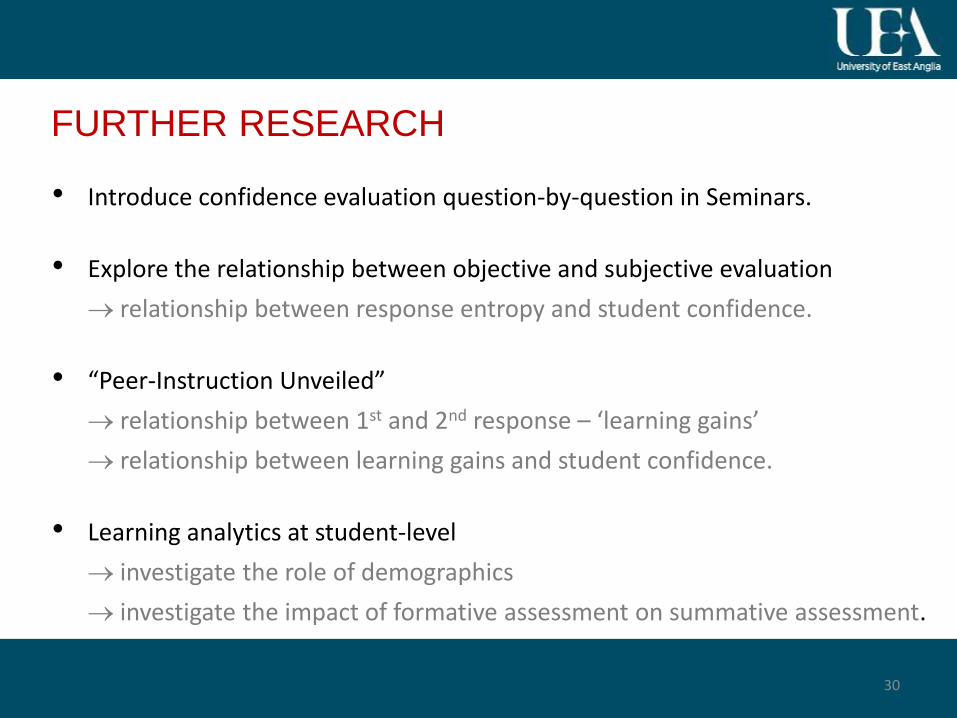
FURTHER RESEARCH
• Introduce confidence evaluation question-by-question in Seminars.
• Explore the relationship between objective and subjective evaluation
relationship between response entropy and student confidence.
• “Peer-Instruction Unveiled”
relationship between 1st and 2nd response – ‘learning gains’
relationship between learning gains and student confidence.
• Learning analytics at student-level
investigate the role of demographics
investigate the impact of formative assessment on summative assessment.
30