Embed Size (px)
Citation preview

Feature Selection Algorithms for Learning to Rank
Andrea Gigli Email
Slides: http://www.slideshare.net/andrgig
March-2016

Outline
Machine Learning for Ranking
Proposed Feature Selection Algorithms (FSA) and Feature Selection Protocol
Application to Public Available Web Search Data

Outline
Machine Learning for Ranking
Proposed Feature Selection Algorithms (FSA) and Feature Selection Protocol
Application to Public Available Web Search Data

Information Retrieval and Ranking Systems
Information Retrieval is the activity of providing information offers relevant to an information need from a collection of information resources.
Ranking consists in sorting the information offers according to some criterion, so that the "best" results appear early in the provided list.

Information Retrieval and Ranking Systems
Ranking System
Information Request
(Query)
Information Offer
(Documents)
Indexed DocumentsInformation
RequestProcessing
(Top) Ranked
Documents

Compute numeric scores on query/document pairs Cosine Similarity, BM25 score, LMIR probabilities…
Use Machine Learning to build a ranking modelLearning to Rank (L2R)
How to Rank
𝑨𝑪
𝑩 GCA
𝑫
Information Offers(Documents) Ranked List
Information Request(Query) 𝑬
𝑮
𝑭
𝑯

…
…
...
...
Learning System
Ranking
SystemIndexed
Documents
...
Training
Prediction
How to Rank using Supervised Learning
...
...
𝑑1,1 𝑑1,2
ℓ1,1
𝑑1,𝑁1
ℓ1,2 ℓ1,𝑁1
…
…
𝑑M,1 𝑑M,2
ℓ𝑀,1
𝑑M,𝑁𝑀
ℓ𝑀,2 ℓ𝑀,𝑁2
𝑞1
𝑞𝑀 𝑓(𝑞, 𝑑)
𝑞𝑀+1
𝑓(𝑞𝑀+1, 𝑑𝑁1)
𝑓(𝑞𝑀+1, 𝑑𝑁𝑀)
𝑞𝑖: i-th query
𝑑𝑖,𝑗: j-th document
associated to the i-thquery
ℓ𝑖,𝑗: observed score
of the j-th document associated to the i-thquery
𝑓(𝒒, 𝒐): scoring function
Machine Learning for Ranking Documents: Application Fields

Machine Learning for Ranking Documents: Business Cases

Outline
Machine Learning for Ranking
Proposed Feature Selection Algorithms (FSA) and Feature Selection Protocol
Application to Public Available Web Search Data

Query & Information Offer Features
𝑑𝑖,1 𝑑𝑖,2 𝑑𝑖,𝑁𝑖𝑞𝑖… …ℓ𝑖,1 ℓ𝑖,2 ℓ𝑖,𝑁𝑖
𝑥𝑖,1(1)
𝑥𝑖,1(2)
𝑥𝑖,1(3)
⋮
𝑥𝑖,1(𝐹)
𝑥𝑖,2(1)
𝑥𝑖,2(2)
𝑥𝑖,2(3)
⋮
𝑥𝑖,2(𝐹)
𝑥𝑖,𝑁𝑖
(1)
𝑥𝑖,𝑁𝑖
(2)
𝑥𝑖,𝑁𝑖
(3)
⋮
𝑥𝑖,𝑁𝑖
(𝐹)
…
Documents Query/Documents LabelsQuery
𝑓 𝒒, 𝒐 → 𝑓(𝒙)
F is of the order of hundreds, thousands
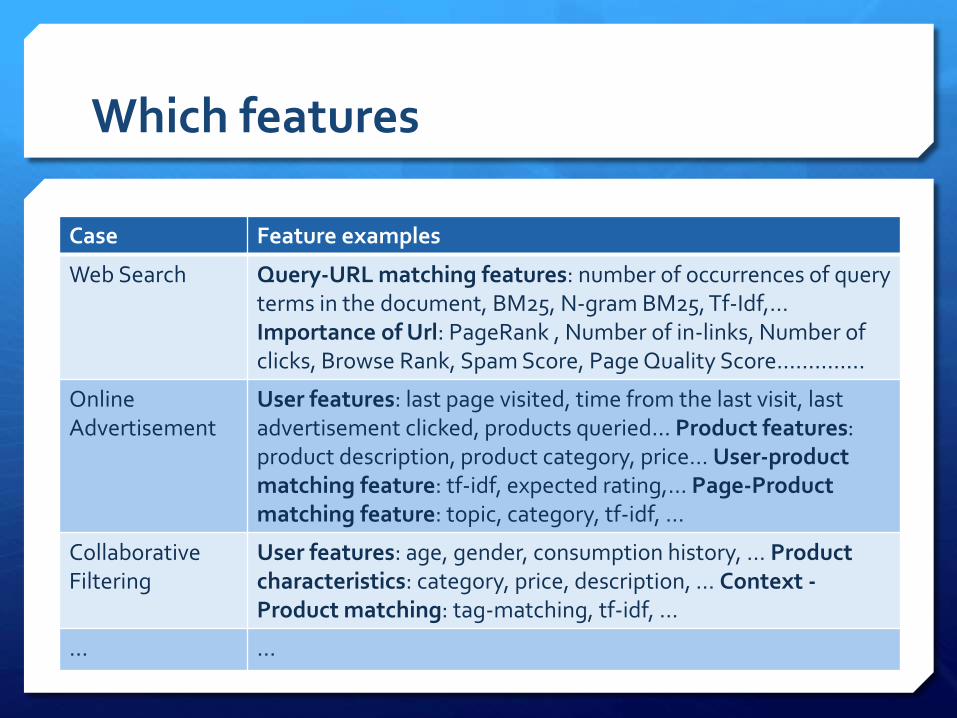
Which features
Case Feature examples
Web Search Query-URL matching features: number of occurrences of query terms in the document, BM25, N-gram BM25, Tf-Idf,… Importance of Url: PageRank , Number of in-links, Number of clicks, Browse Rank, Spam Score, Page Quality Score…………..
Online Advertisement
User features: last page visited, time from the last visit, last advertisement clicked, products queried… Product features: product description, product category, price… User-productmatching feature: tf-idf, expected rating,… Page-Product matching feature: topic, category, tf-idf, …
Collaborative Filtering
User features: age, gender, consumption history, … Product characteristics: category, price, description, … Context -Product matching: tag-matching, tf-idf, …
… …

How to select features in L2R
The main goal of any feature selection process is to select a subset of n elements from a set of N measurement, with n<N, without significantly degrading the performance of the system
The search for the optimal subset require to search among
2N possible subsets

How to select features in L2R
0
1,000,000
2,000,000
3,000,000
4,000,000
5,000,000
6,000,000
7,000,000
8,000,000
9,000,000
0 5 10 15 20 25
Number of possible
feature subsets
Number of Features
A suboptimalcriteria isneeded

Proposed Protocol for Comparing Feature Selection Algorithms
Measure the Relevance of each Feature
Measure the Similarity of each pair of
features
Select a Feature Subset using a
Feature Selector
Train the L2R Model
Measure the L2R Model Performance
on the Test Set
Compare Feature
Selection Algorithms
Repeat for different Subset Size
1 2 3 4 5 6
Repeat from 3 for every Feature
Selection Algorithm

Competing Algorithms for feature selection
We developed the following algorithms
Naïve Greedy search Algorithm for feature Selection (NGAS)
Naïve Greedy search Algorithm for feature Selection -Extended (NGAS-E)
Hierarchical Clustering search Algorithm for feature Selection (HCAS)

Competing Algorithms for feature selection
We developed the following algorithms
Naïve Greedy search Algorithm for feature Selection (NGAS)
Naïve Greedy search Algorithm for feature Selection -Extended (NGAS-E)
Hierarchical Clustering search Algorithm for feature Selection (HCAS)

Competing Algorithm for feature selection #1: NGAS
The undirect graph is built and the set S of selected features is initialized.

Competing Algorithm for feature selection #1: NGAS
Assuming node 1 has the highest relevance, add it to S.

Competing Algorithm for feature selection #1: NGAS
Select the node with the lowest similarity to Node 1, say Node 7, and the one with the highest
similarity to Node 7, say Node 5.

Competing Algorithm for feature selection #1: NGAS
Remove Node 1. Node 5 is the one with the highest relevance between 5 and 7, add it to S.
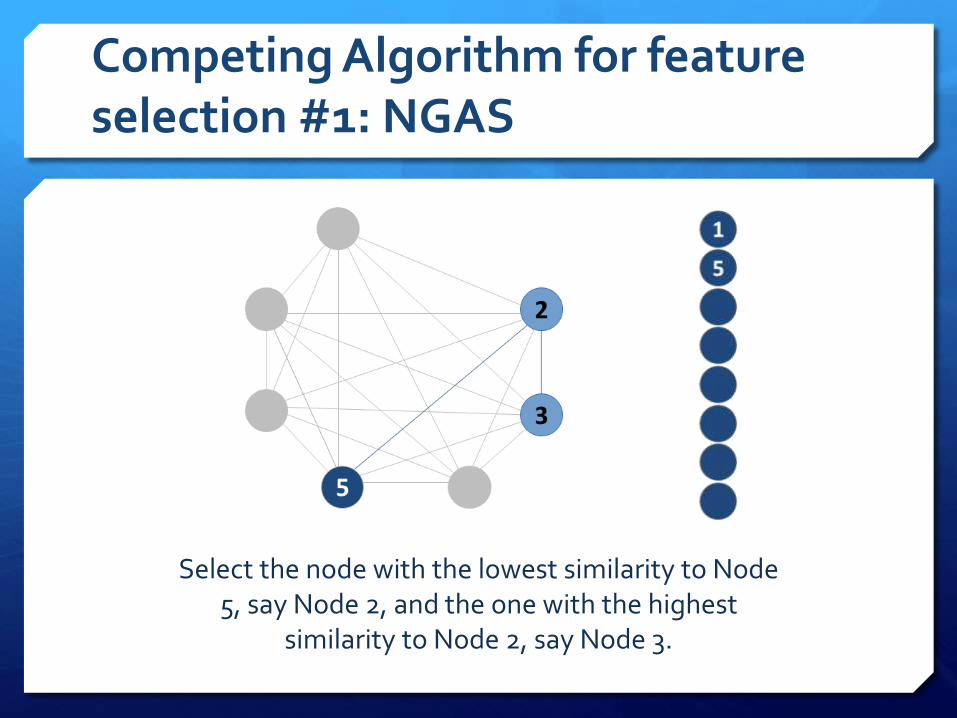
Competing Algorithm for feature selection #1: NGAS
Select the node with the lowest similarity to Node 5, say Node 2, and the one with the highest
similarity to Node 2, say Node 3.

Competing Algorithm for feature selection #1: NGAS
Remove Node 5. Assuming Node 2 is the one with highest relevance between 2 and 3, add it to S.
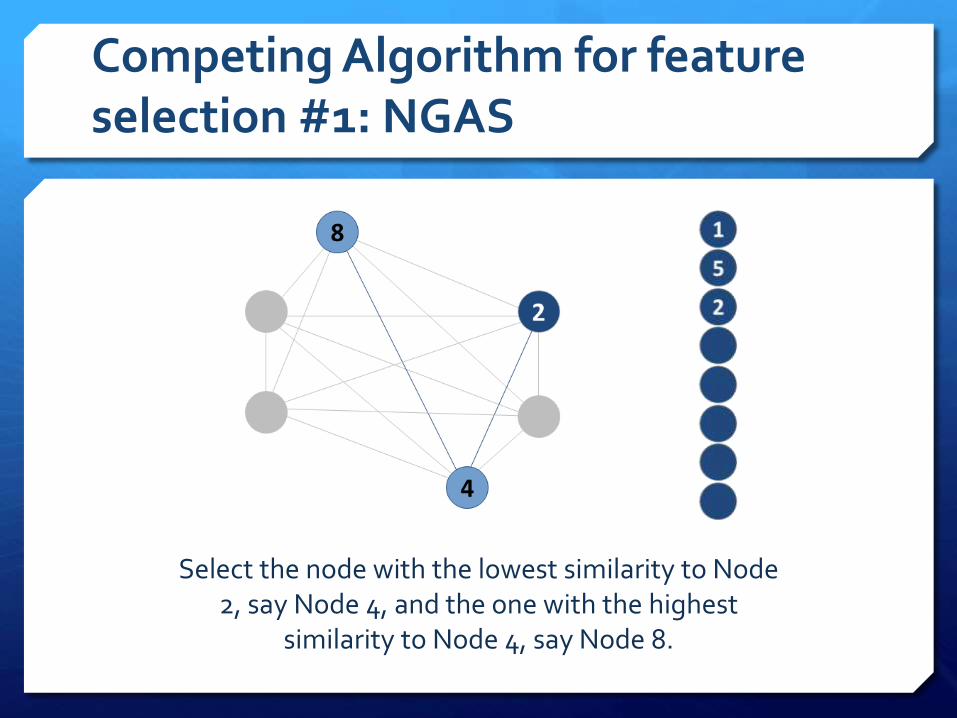
Competing Algorithm for feature selection #1: NGAS
Select the node with the lowest similarity to Node 2, say Node 4, and the one with the highest
similarity to Node 4, say Node 8.

Competing Algorithm for feature selection #1: NGAS
Remove Node 2. Assuming Node 4 is the one with highest relevance between 4 and 8, add it to S.

Competing Algorithm for feature selection #1: NGAS
Select the node with the lowest similarity to Node 4, say Node 6, and the one with the highest
similarity to Node 6, say Node 7.
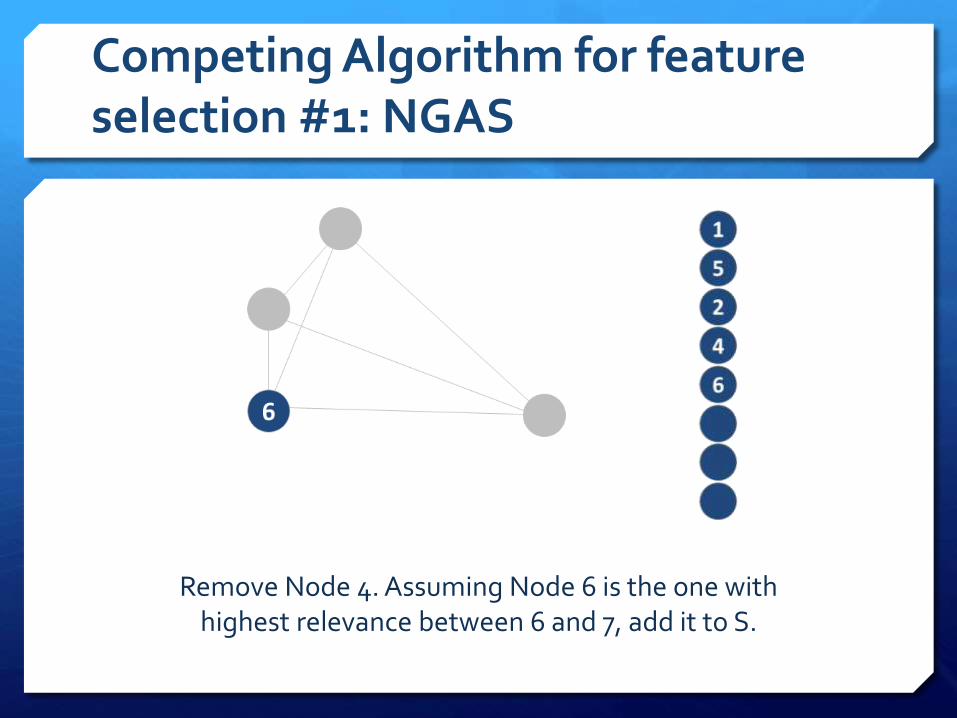
Competing Algorithm for feature selection #1: NGAS
Remove Node 4. Assuming Node 6 is the one with highest relevance between 6 and 7, add it to S.

Competing Algorithm for feature selection #1: NGAS
Select the node with the lowest similarity to Node 6, say Node 3, and the one with the highest
similarity to Node 3, say Node 8.

Competing Algorithm for feature selection #1: NGAS
Remove Node 6. Assuming Node 3 is the one with highest relevance between 3 and 8, add it to S.

Competing Algorithm for feature selection #1: NGAS
Select the node with the lowest similarity to Node 3, say Node 8, and the one with the highest
similarity to Node 8, say Node 7.

Competing Algorithm for feature selection #1: NGAS
Remove Node 3. Assuming Node 8 is the one with highest relevance between 8 and 7, add it to S.

Competing Algorithm for feature selection #1: NGAS
Add the last node, 7, to S.

We developed the following algorithms
Naïve Greedy search Algorithm for feature Selection (NGAS)
Naïve Greedy search Algorithm for feature Selection -Extended (NGAS-E)
Hierarchical Clustering search Algorithm for feature Selection (HCAS)
Competing Algorithms for feature selection

Competing Algorithm for feature selection #2: NGAS-E (p=50%)
The undirect graph is built and the set S of selected features is initialized.

Competing Algorithm for feature selection #2: NGAS-E (p=50%)
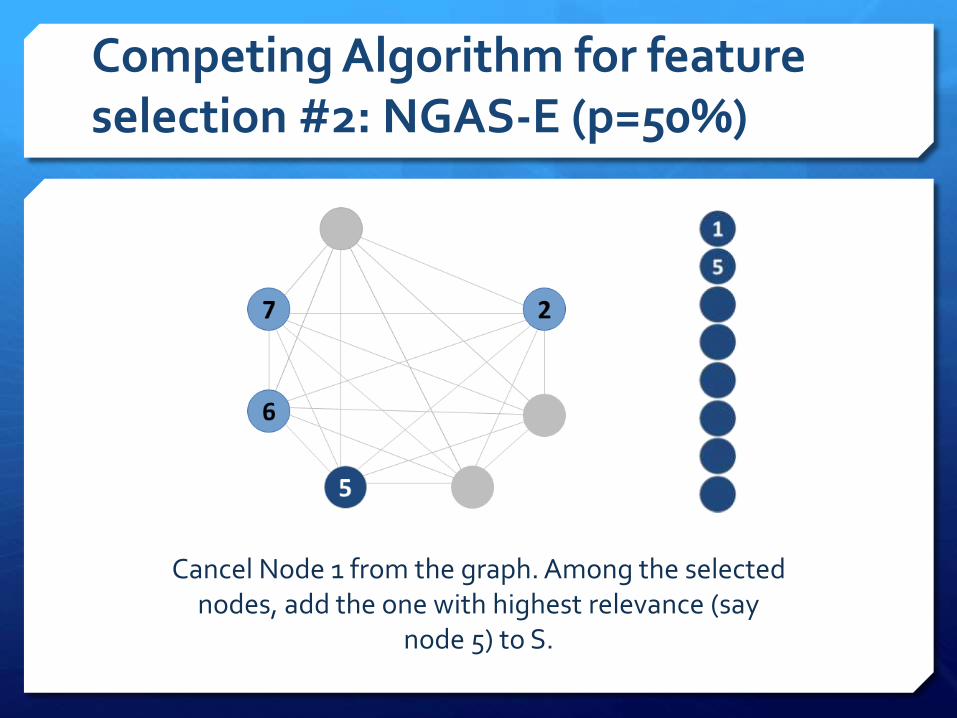
Assuming node 1 has the highest relevance, add it to S.

Competing Algorithm for feature selection #2: NGAS-E (p=50%)
Select 7 ∗ 50% nodes less similar to 1.
Competing Algorithm for feature selection #2: NGAS-E (p=50%)
Cancel Node 1 from the graph. Among the selected nodes, add the one with highest relevance (say
node 5) to S.

Competing Algorithm for feature selection #2: NGAS-E (p=50%)
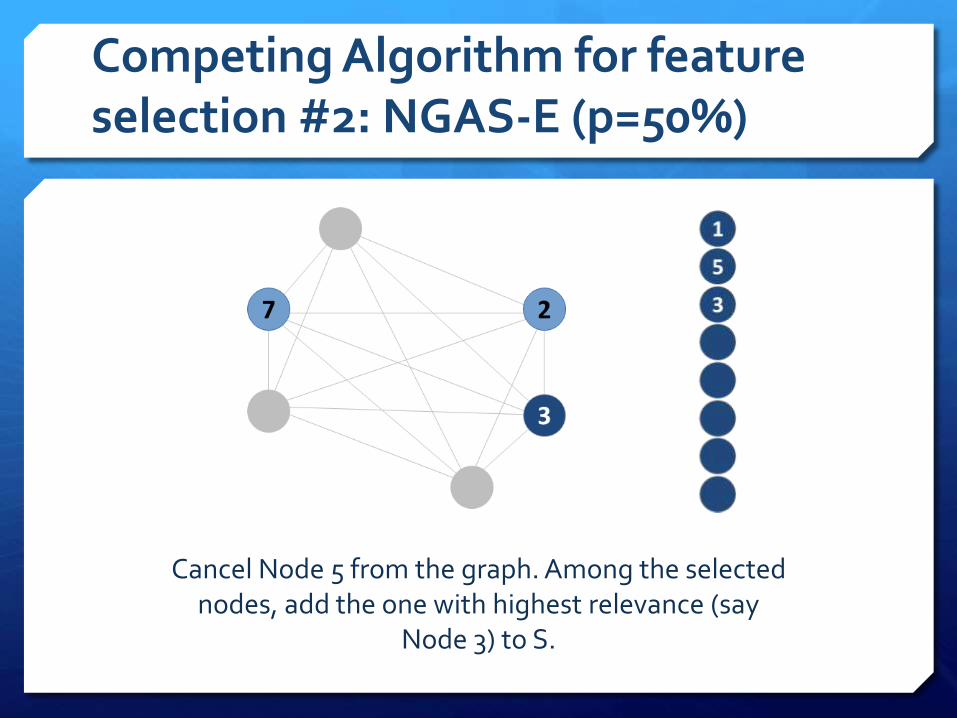
Select ⌈6*50% ⌉ nodes less similar to node 5.
Competing Algorithm for feature selection #2: NGAS-E (p=50%)
Cancel Node 5 from the graph. Among the selected nodes, add the one with highest relevance (say
Node 3) to S.
Competing Algorithm for feature selection #2: NGAS-E (p=50%)
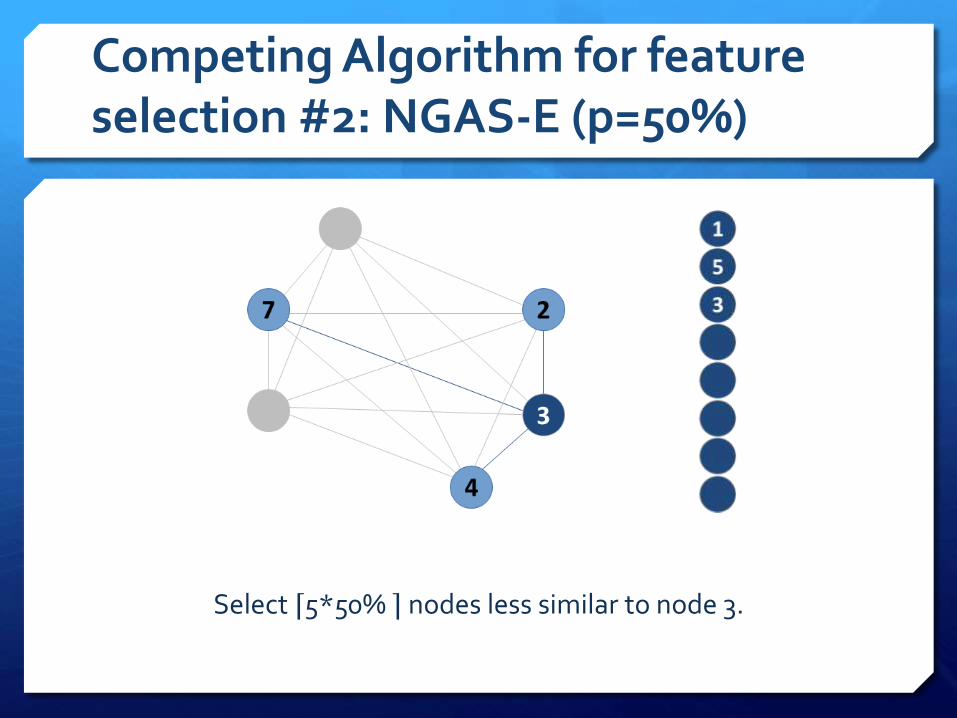
Select ⌈5*50% ⌉ nodes less similar to node 3.

Competing Algorithm for feature selection #2: NGAS-E (p=50%)
Cancel node 3 from the graph. Among the selected nodes, add the one with highest relevance (say
node 4) to S.

Competing Algorithm for feature selection #2: NGAS-E (p=50%)
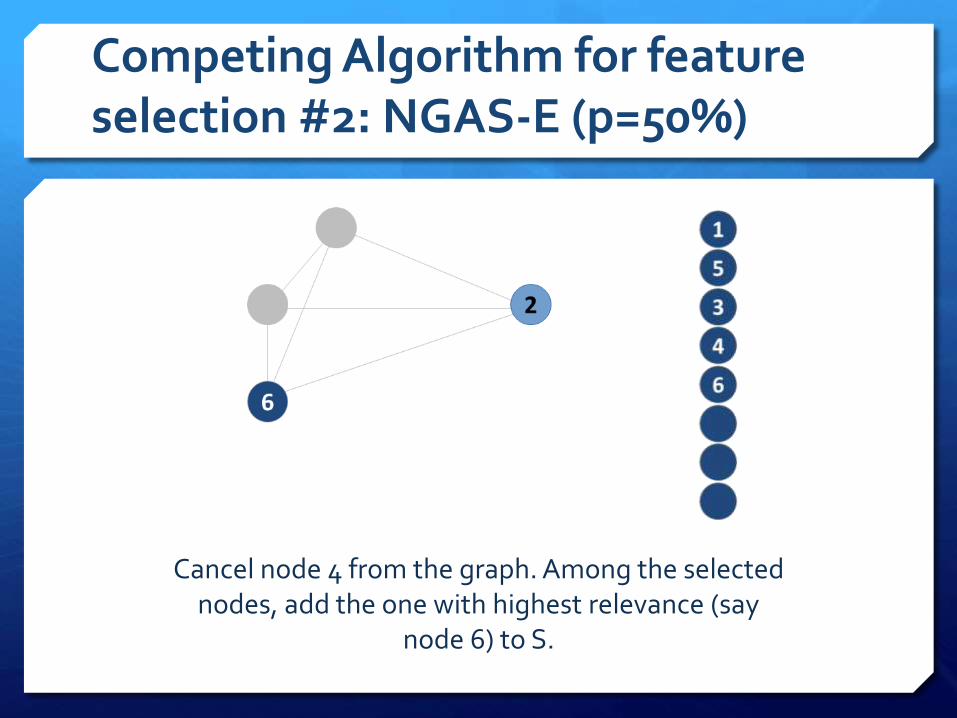
Select ⌈4*50% ⌉ nodes less similar to node 4.
Competing Algorithm for feature selection #2: NGAS-E (p=50%)
Cancel node 4 from the graph. Among the selected nodes, add the one with highest relevance (say
node 6) to S.

Competing Algorithm for feature selection #2: NGAS-E (p=50%)
Select ⌈3*50% ⌉ nodes less similar to node 6.

Competing Algorithm for feature selection #2: NGAS-E (p=50%)
Cancel node 6 from the graph. Among the selected nodes, add the one with highest relevance (say
node 2) to S.

Competing Algorithm for feature selection #2: NGAS-E (p=50%)
Select ⌈2*50% ⌉nodes less similar to node 2.

Competing Algorithm for feature selection #2: NGAS-E (p=50%)
Node 2 is cancelled from the graph and node 8 is added to S.
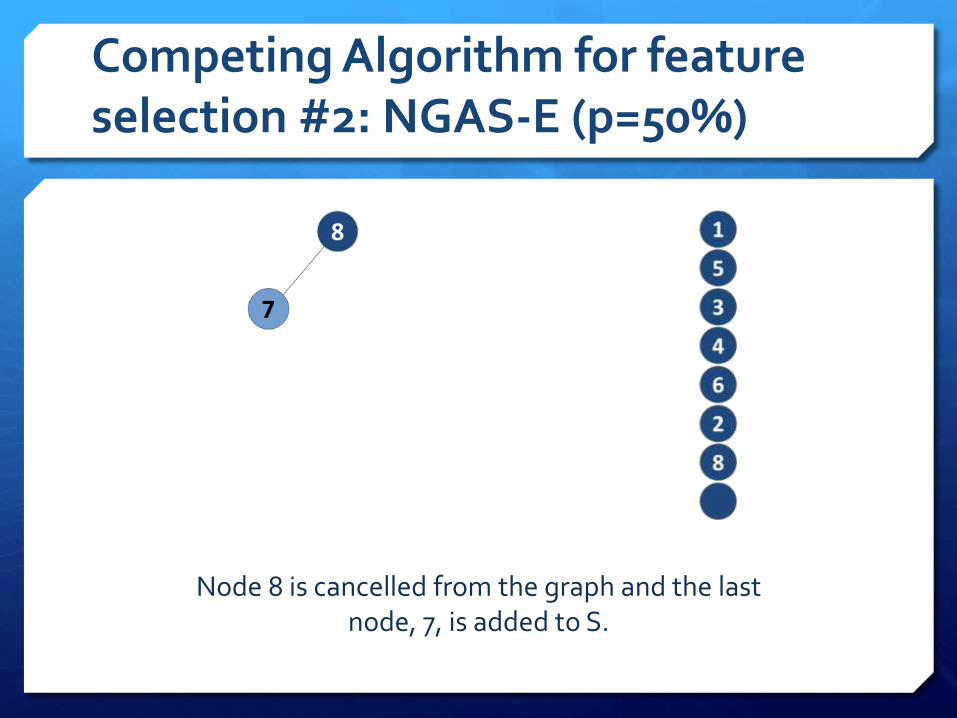
Competing Algorithm for feature selection #2: NGAS-E (p=50%)
Node 8 is cancelled from the graph and the last node, 7, is added to S.

Competing Algorithm for feature selection #2: NGAS-E (p=50%)
Node 8 is cancelled from the graph and the last node, 7, is added to S.

We developed the following algorithms
Naïve Greedy search Algorithm for feature Selection (NGAS)
Naïve Greedy search Algorithm for feature Selection -Extended (NGAS-E)
Hierarchical Clustering search Algorithm for feature Selection (HCAS)
Competing Algorithms for feature selection
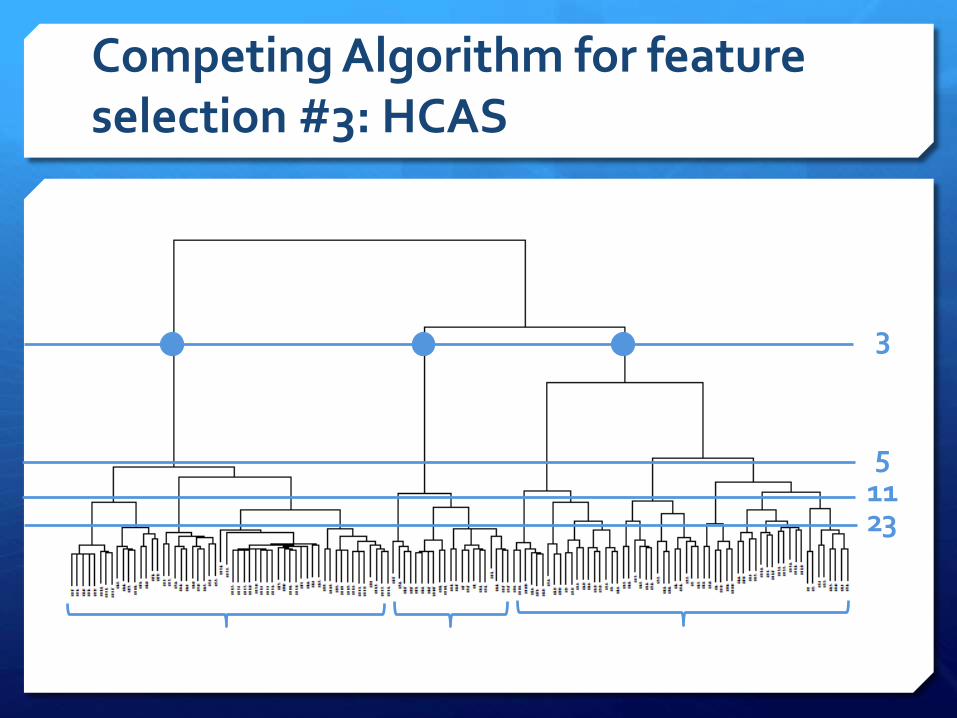
Competing Algorithm for feature selection #3: HCAS
23115
3
Outline
Machine Learning for Ranking
Proposed Feature Selection Algorithms (FSA) and Feature Selection Protocol
Application to Public Available Web SearchData

Application to Web SearchEngine Data
Bing Data http://research.microsoft.com/en-us/projects/mslr/
Yahoo! Data http://webscope.sandbox.yahoo.com
Train Validation Test
#queries 19,944 2,994 6,983
#urls 473,134 71,083 165,660
# features 519
Train Validation Test
#queries 18,919 6,306 6,306
#urls 723,412 235,259 241,521
# features 136

Proposed Protocol for Comparing Feature Selection Algorithms
Measure the Relevance of each Feature
Measure the Similarity of each pair of
features
Select a Feature Subset using a
Feature Selector
Train the L2R Model
Measure the L2R Model Performance
on the Test Set
Compare Feature
Selection Algorithms
Repeat for different Subset Size
1 2 3 4 5 6
Repeat from 3 for every Feature
Selection Algorithm
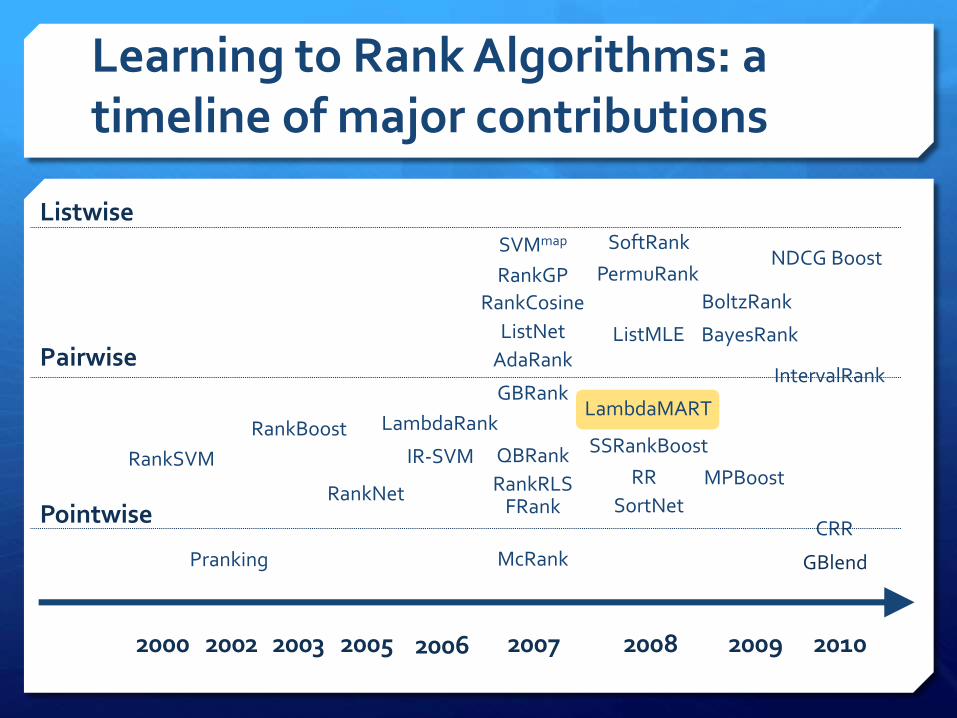
Learning to Rank Algorithms: a timeline of major contributions
LambdaMARTLambdaRank
CRR
IntervalRank
GBlend
NDCG Boost
BayesRank
BoltzRank
MPBoost
SortNet
SSRankBoost
RR
SoftRank
PermuRank
ListMLE
SVMmap
RankRLS
RankGP
RankCosine
QBRank
McRank
ListNet
GBRank
AdaRank
IR-SVM
RankNet
RankBoost
Pranking
RankSVM
2000 2002 2003 2005 2006 2007
FRank
2008 2009 2010
Pointwise
Pairwise
Listwise
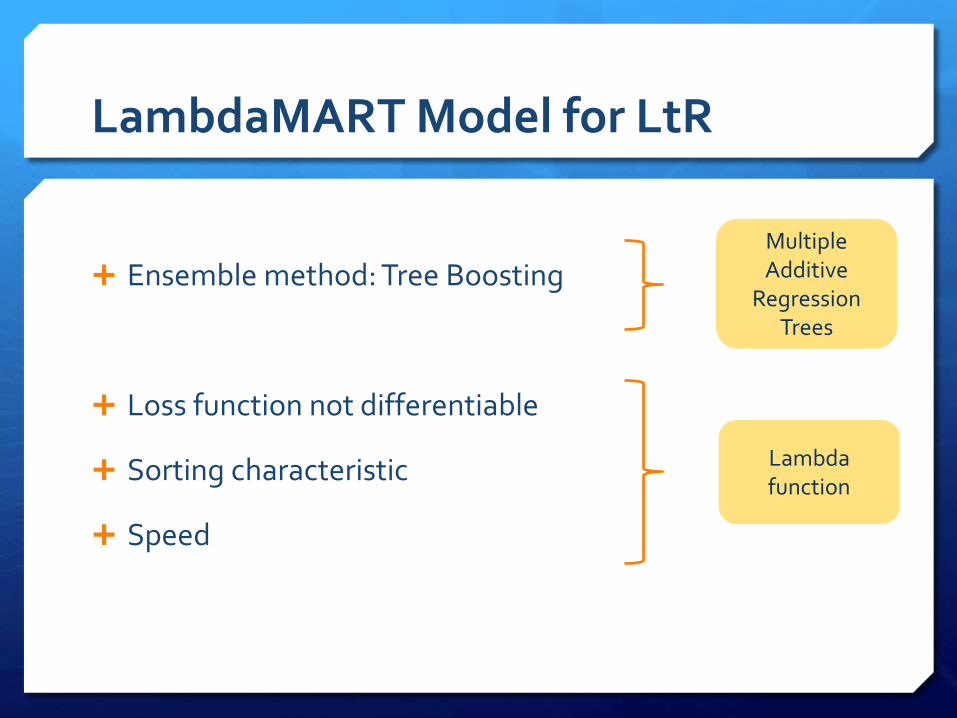
Multiple Additive
Regression Trees
LambdaMART Model for LtR
Lambda function
Ensemble method: Tree Boosting
Loss function not differentiable
Sorting characteristic
Speed

Proposed Protocol for Comparing Feature Selection Algorithms
Measure the Relevance of each Feature
Measure the Similarity of each pair of
features
Select a Feature Subset using a
Feature Selector
Train the L2R Model
Measure the L2R Model Performance
on the Test Set
Compare Feature
Selection Algorithms
Repeat for different Subset Size
1 2 3 4 5 6
Repeat from 3 for every Feature
Selection Algorithm

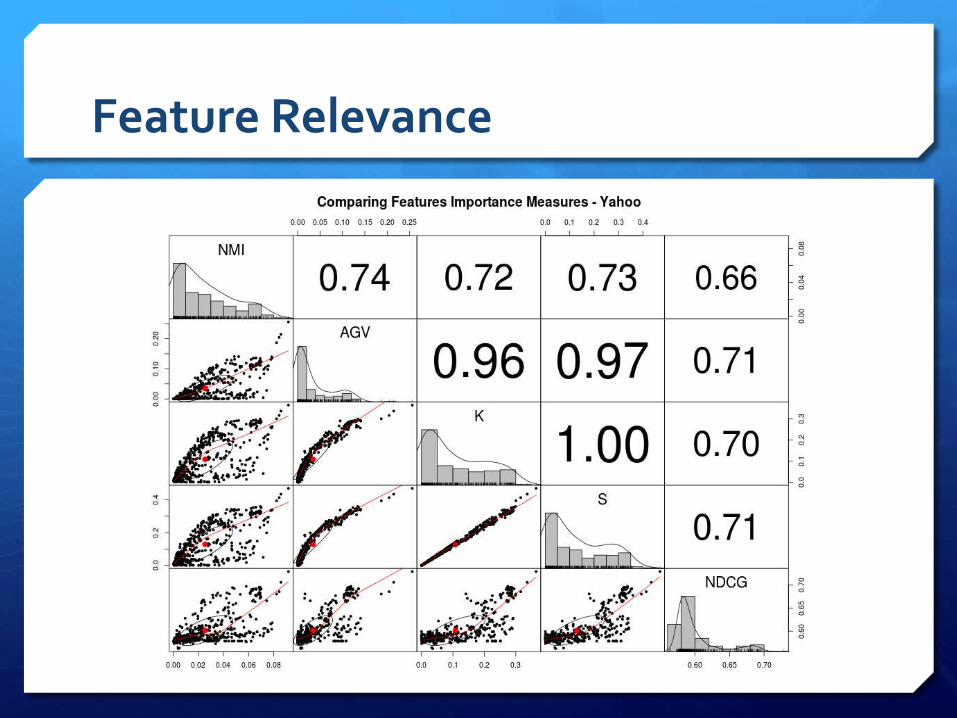
Feature Relevance
The relevance of a document is measured with a categorical variable (0,1,2,3,4) we need to use metrics good at measuring «dependence» between discrete/continuous feature variables and a categorical label variable.
In the following we use Normalized Mutual Information (NMI):
Spearman coefficient (S)
Kendall’s tau (K)
Average Group Variance (AGV)
One Variable NDCG@10 (1VNDCG)
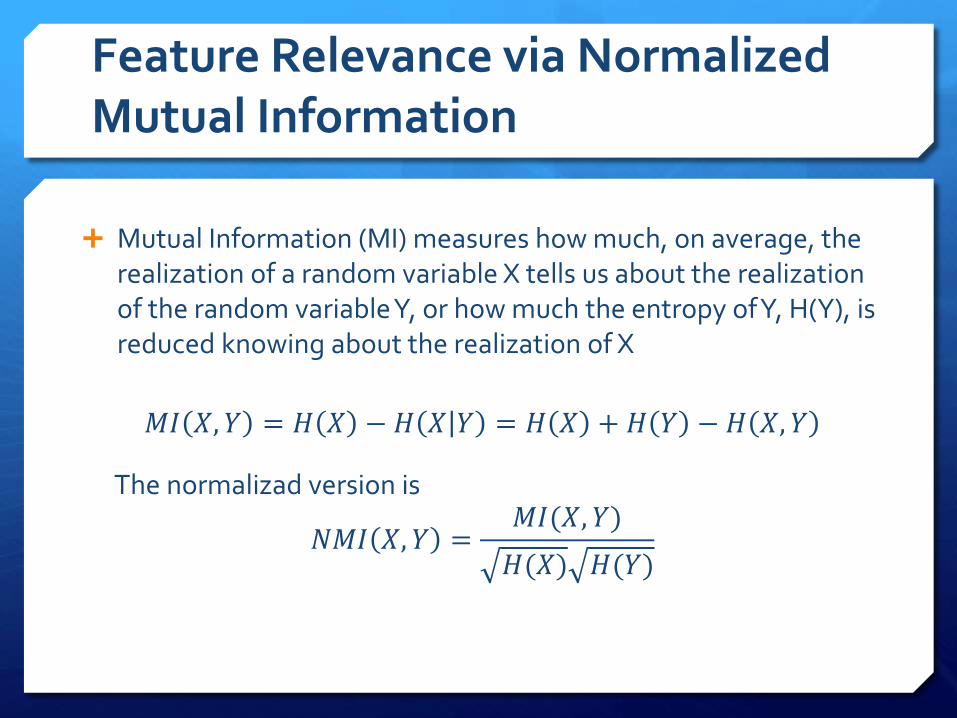
Feature Relevance via Normalized Mutual Information
Mutual Information (MI) measures how much, on average, the realization of a random variable X tells us about the realization of the random variableY, or how much the entropy of Y, H(Y), isreduced knowing about the realization of X
𝑀𝐼 𝑋, 𝑌 = 𝐻 𝑋 − 𝐻 𝑋 𝑌 = 𝐻 𝑋 + 𝐻 𝑌 − 𝐻 𝑋, 𝑌
The normalizad version is
𝑁𝑀𝐼 𝑋, 𝑌 =𝑀𝐼(𝑋, 𝑌)
𝐻(𝑋) 𝐻(𝑌)

Feature Relevance via Spearman’s coefficient
Spearman’s rank correlation coefficient is a non-parametric measure of statistical dependence between two random variables.
It is given by
𝜌 = 1 −6 𝑑𝑖
2
𝑛(𝑛2 − 1)
where n is the sample size and
𝑑𝑖 = 𝑟𝑎𝑛𝑘 𝑥𝑖 − 𝑟𝑎𝑛𝑘 𝑦𝑖

Feature Relevance via Kendall’s tau
Kendall’s Tau is a measure of association defined on two ranking lists of length n. It is defined as
τ =𝑛𝑐 − 𝑛𝑑
𝑛(𝑛 − 1)2
− 𝑛1𝑛(𝑛 − 1)
2− 𝑛2
where 𝑛𝑐 denotes the number of concordant pairs between the two lists, 𝑛𝑑 denotes the number of discordant pairs, 𝑛1 = 𝑡𝑖(𝑡𝑖 − 1)/2, 𝑛2 = 𝑢𝑗(𝑢𝑗 − 1)/2, 𝑡𝑖 is the number of tied
values in the i-th group of ties for the first list and 𝑢𝑗 is the
number of tied values in the j-th group of ties for the second list.
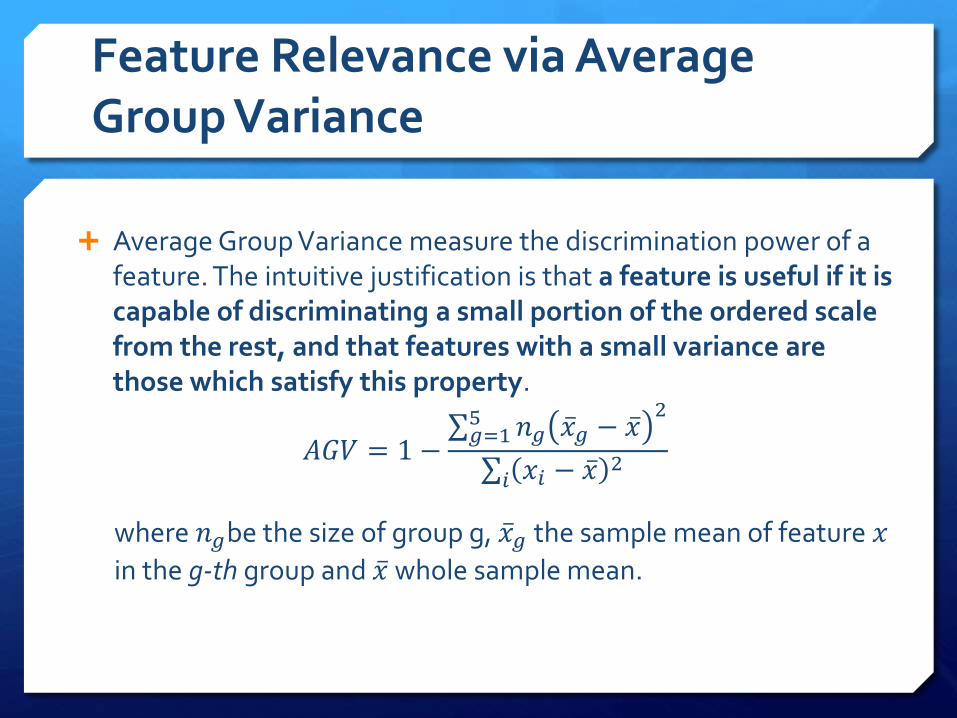
Feature Relevance via Average Group Variance
Average Group Variance measure the discrimination power of a feature. The intuitive justification is that a feature is useful if it is capable of discriminating a small portion of the ordered scale from the rest, and that features with a small variance are those which satisfy this property.
𝐴𝐺𝑉 = 1 − 𝑔=1
5 𝑛𝑔 𝑥𝑔 − 𝑥2
𝑖 𝑥𝑖 − 𝑥 2
where 𝑛𝑔be the size of group g, 𝑥𝑔 the sample mean of feature 𝑥
in the g-th group and 𝑥 whole sample mean.

Feature Relevance via single feature LambdaMART scoring
For each feature i we run LambdaMART and compute the 𝑁𝐷𝐶𝐺𝑖,𝑞@10 for each query q
The i-th feature relevance is measured averaging𝑁𝐷𝐶𝐺𝑖,𝑞@10 over the whole query set
𝑁𝐷𝐶𝐺𝑖@10 =1
𝑄
𝑞∈𝑄
𝑁𝐷𝐶𝐺𝑖,𝑞@10

Precision at k:
𝑃𝑖@𝑘 =# 𝑟𝑒𝑙𝑒𝑣𝑎𝑛𝑡 𝑑𝑜𝑐𝑢𝑚𝑒𝑛𝑡𝑠 𝑖𝑛 𝑡𝑜𝑝 𝑘 𝑟𝑒𝑠𝑢𝑙𝑡𝑠
𝑘
Average precision:
1
𝐷
𝑘=1
𝐷𝑃𝑖@𝑘 ∙ 𝕀 𝑑𝑜𝑐𝑢𝑚𝑒𝑛𝑡 𝑘 𝑖𝑠 𝑟𝑒𝑙𝑒𝑣𝑎𝑛𝑡
# 𝑟𝑒𝑙𝑒𝑣𝑎𝑛𝑡 𝑑𝑜𝑐𝑢𝑚𝑒𝑛𝑡𝑠
Discounted Cumulative Gain
𝐷𝐶𝐺𝑖 =
𝑗=1
𝑘2𝑟𝑒𝑙𝑖,𝑗 − 1
𝑙𝑜𝑔2 1 + 𝑟𝑎𝑛𝑘𝑗
How to Measure Ranking Performance on query i
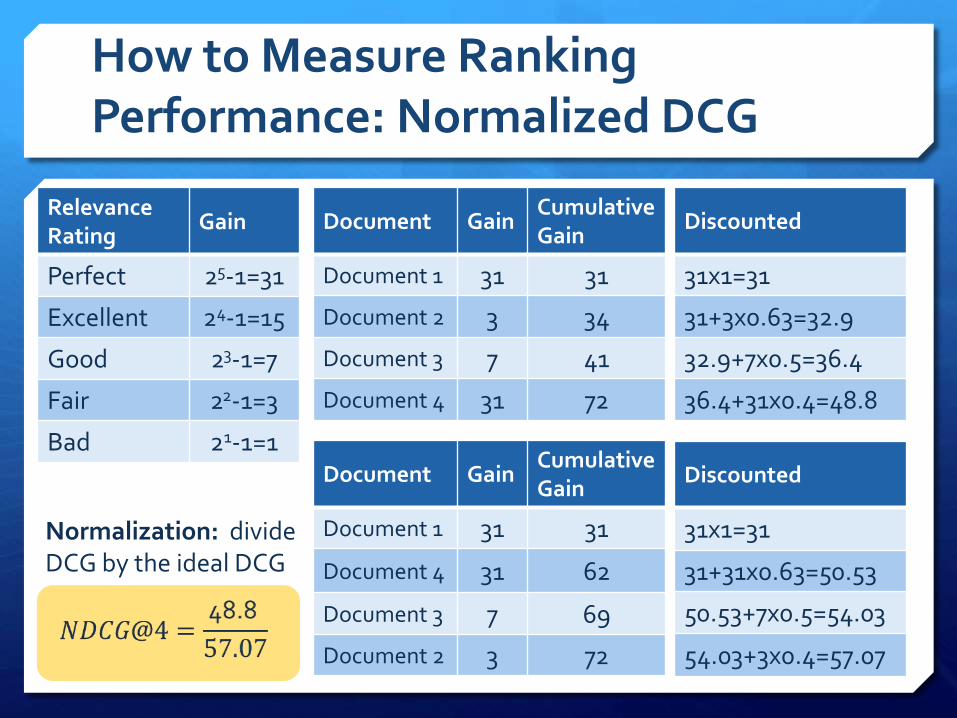
How to Measure Ranking Performance: Normalized DCG
Document GainCumulative Gain
Document 1 31 31
Document 2 3 34
Document 3 7 41
Document 4 31 72
Discounted
31x1=31
31+3x0.63=32.9
32.9+7x0.5=36.4
36.4+31x0.4=48.8
Normalization: divide DCG by the ideal DCG
Document GainCumulative Gain
Document 1 31 31
Document 4 31 62
Document 3 7 69
Document 2 3 72
Discounted
31x1=31
31+31x0.63=50.53
50.53+7x0.5=54.03
54.03+3x0.4=57.07
RelevanceRating
Gain
Perfect 25-1=31
Excellent 24-1=15
Good 23-1=7
Fair 22-1=3
Bad 21-1=1

Feature Relevance
Feature Relevance

Choosing the Relevance Measure (1/2)
FSA performance is measured using the Average NDCG@10 obtaind from LambdaMART on the test set.
NDCG@10 on Yahoo Test Set
Feature Subset Dimension
5% 10% 20% 30% 40% 50% 75% 100%
NMI 0.73398 0.75952 0.76241 0.7678 0.76912 0.769 0.77015 0.76935
AVG 0.7524 0.7548 0.76168 0.76493 0.76498 0.76717 0.76971 0.76935
S 0.74963 0.75396 0.76099 0.76398 0.7649 0.76753 0.77002 0.76935
K 0.75225 0.75291 0.76145 0.76304 0.7648 0.76673 0.76972 0.76935
1VNDCG 0.75246 0.75768 0.76452 0.76672 0.76823 0.77008 0.77027 0.76935
NDCG@10 on Bing Test Set
Feature Subset Dimension
5% 10% 20% 30% 40% 50% 75% 100%
NMI 0.38927 0.3978 0.41347 0.41539 0.44785 0.44966 0.45083 0.46336
AVG 0.32682 0.33168 0.36043 0.36976 0.37383 0.37612 0.43444 0.46336
S 0.32969 0.3346 0.3428 0.34592 0.36711 0.42475 0.42809 0.46336
K 0.32917 0.3346 0.34356 0.42124 0.42071 0.4245 0.42706 0.46336
1VNDCG 0.41633 0.42571 0.42413 0.42601 0.42757 0.43795 0.46222 0.46336
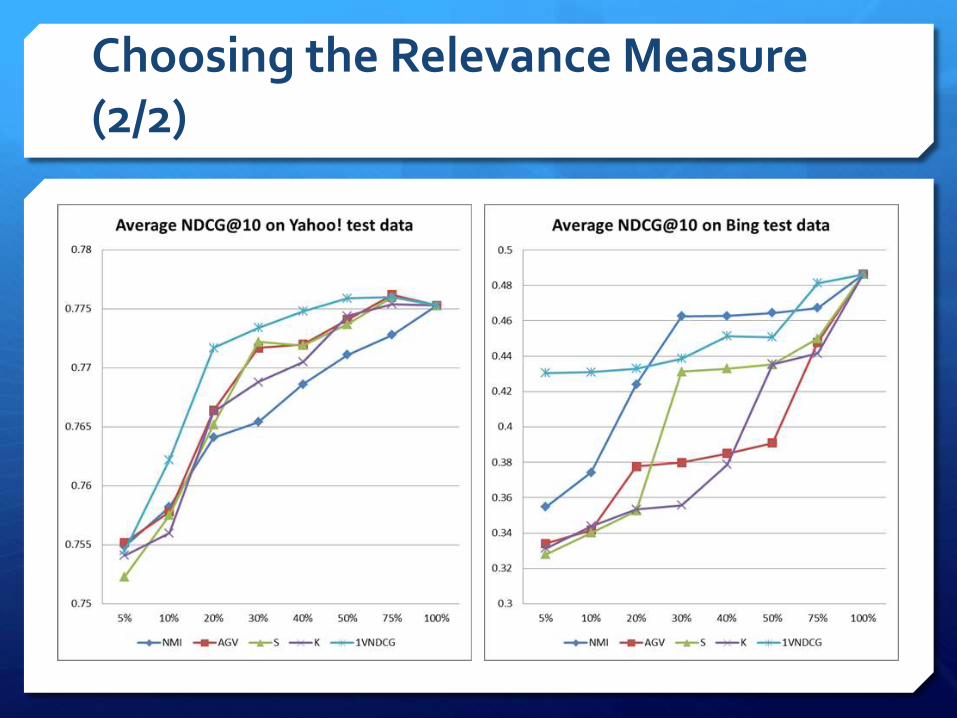
Choosing the Relevance Measure (2/2)

Proposed Protocol for Comparing Feature Selection Algorithms
Measure the Relevance of each Feature
Measure the Similarity of each pair of
features
Select a Feature Subset using a
Feature Selector
Train the L2R Model
Measure the Model Performance on
the Test Set
Compare Feature
Selection Algorithms
Repeat for different Subset Size
1 2 3 4 5 6
Repeat from 3 for every Feature
Selection Algorithm

Feature Similarity
We used Spearman’s Rank coefficient for measuring features similarity.
Spearman’s Rank is faster to be computed than NMI, Kendall’s tau and 1VNDCG.
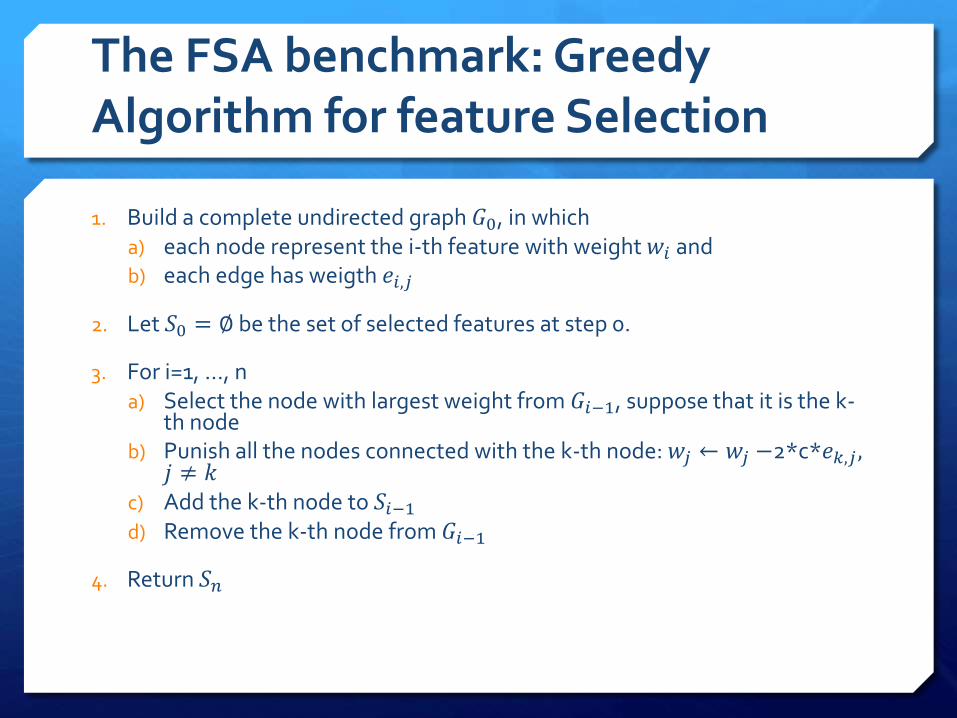
The FSA benchmark: Greedy Algorithm for feature Selection
1. Build a complete undirected graph 𝐺0, in which a) each node represent the i-th feature with weight 𝑤𝑖 and b) each edge has weigth 𝑒𝑖,𝑗
2. Let 𝑆0 = ∅ be the set of selected features at step 0.
3. For i=1, …, na) Select the node with largest weight from 𝐺𝑖−1, suppose that it is the k-
th nodeb) Punish all the nodes connected with the k-th node: 𝑤𝑗 ← 𝑤𝑗 −2*c*𝑒𝑘,𝑗 ,
𝑗 ≠ 𝑘c) Add the k-th node to 𝑆𝑖−1
d) Remove the k-th node from 𝐺𝑖−1
4. Return 𝑆𝑛

Train the L2R Model
Proposed Protocol for Comparing Feature Selection Algorithms
Measure the Relevance of each Feature
Measure the Similarity of each pair of
features
Select a Feature Subset using a
Feature Selector
Compare Feature
Selection Algorithms
Repeat for different Subset Size
1 2 3 4 5 6
Repeat from 3 for every Feature
Selection Algorithm
Measure the L2R Model Performance
on the Test Set

Proposed Protocol for Comparing Feature Selection Algorithms
Measure the Relevance of each Feature
Measure the Similarity of each pair of
features
Select a Feature Subset using a
Feature Selector
Train the L2R Model
Measure the L2R Model Performance
on the Test Set
Compare Feature
Selection Algorithms
1 2 3 4 5 6
Repeat from 3 for every Feature
Selection AlgorithmRepeat for different
Subset Size

Proposed Protocol for Comparing Feature Selection Algorithms
Measure the Relevance of each Feature
Measure the Similarity of each pair of
features
Select a Feature Subset using a
Feature Selector
Train the L2R Model
Compare Feature
Selection Algorithms
Repeat for different Subset Size
1 2 3 4 5 6
Repeat from 3 for every Feature
Selection Algorithm
Measure the Model Performance on
the Test Set

LambdaMART Performance

Significance Test using Randomization Test
NDCG@10 on Yahoo Test Set
Feature Subset Dimension
5% 10% 20% 30% 40% 50% 75% 100%
NGAS 0.7430▼ 0.7601 0.7672 0.7717 0.7724 0.7759 0.7766 0.7753
NGAS-E, p = 0.8 0.7655 0.7666 0.7723 0.7742 0.7751 0.7759 0.776 0.7753
HCAS, "single" 0.7350▼ 0.7635 0.7666 0.7738 0.7742 0.7754 0.7756 0.7753
HCAS, "ward" 0.7570▼ 0.7626 0.7704 0.7743 0.7755 0.7763 0.7757 0.7753
GAS, c = 0.01 0.7628 0.7649 0.7671 0.773 0.7737 0.7737 0.7758 0.7753
NDCG@10 on Bing Test Set
Feature Subset Dimension
5% 10% 20% 30% 40% 50% 75% 100%
NGAS 0.4011▼ 0.4459 0.471 0.4739▼ 0.4813 0.4837 0.4831 0.4863
NGAS-E, p = 0.05 0.4376▲ 0.4528 0.4577▼ 0.4825 0.4834 0.4845 0.4867 0.4863
HCAS, "single" 0.4423▲ 0.4643▲ 0.4870▲ 0.4854 0.4848 0.4847 0.4853 0.4863
HCAS, "ward" 0.4289 0.4434▼ 0.4820 0.4879 0.4853 0.4837 0.4870 0.4863
GAS, c = 0.01 0.4294 0.4515 0.4758 0.4848 0.4863 0.4860 0.4868 0.4863

LambdaMART Performance

Conclusions
We designed 3 FSAs and we applied them to the Web Search Pages Ranking problem.
NGAS-E e HCAS have a performance equal or greater than the benchmark model.
HCAS and NGAS are very
The proposed FSAs can be implemented independently of the L2R model.
The proposed FSAs can be applied to other ML contexts, to Sorting problems and to Model Ensambling.


![Ranking under temporal constraints - UMIACSjimmylin/publications/Wang_etal_CIKM2010.… · ear) ranking functions [21, 13, 5, 19] and feature selection [14, 20]. However, none of](https://img.pdfslide.net/doc/110x75/5f6ba69ac6b5c729fd00e487/ranking-under-temporal-constraints-jimmylinpublicationswangetalcikm2010.jpg)