Embed Size (px)
Citation preview
KAASUYHDISTYS.FI
GAS IN FINLAND
G A S S T A T I S T I C S
May 2016

KAASUYHDISTYS.FI
Source: University of Eastern Finland,
Finnish Gas Association
Gas map – Finland
BIOGAS PLANTS NATURAL GAS PIPELINE NETWORKS
NUMBER OF BIOGAS PLANTS
Landfill plants 40
Reactorplants 43
• municipal wastewater 15
• industrial wastewater 2
• farms 13
• other 13
Total number 83
LENGTH OF THE NATURAL GAS
PIPELINES, km
Transmission 1 288
Distribution 1 955
Total length 3 243
Akaa
Asikkala
Espoo
Hamina
Hattula
Helsinki
Hollola
Hyvinkää
Hämeenkyrö
Hämeenlinna
Iitti
Ikaalinen
Imatra
Janakkala
Järvenpää
Kangasala
Kerava
Kirkkonummi
Kotka
Kouvola
Lahti
Lappeenranta
Espoo
Forssa
Haapajärvi
Haapavesi
Halsua
Hamina
Helsinki
Huittinen
Hyvinkää
Hämeenlinna
Iisalmi
Ilmajoki
Imatra
Joensuu
Joutsa
Juva
Jyväskylä
Järvenpää
Kaarina
Kajaani
Kalajoki
Kerava
Kitee
Kokkola
Kotka
Kouvola
Kuopio
Lahti
Laihia
Lappeenranta
Lapua
Laukaa
Lohja
Maarianhamina
Mikkeli
Mustasaari
Nivala
Nokia
Nurmijärvi
Orivesi
Oulu
Pori
Porvoo
Pudasjärvi
Raisio
Rauma
Rautjärvi
Riihimäki
Rovaniemi
Salo
Savonlinna
Sotkamo
Säkylä
Tampere
Tervola
Turku
Uusikaarlepyy
Uusikaupunki
Vaasa
Vantaa
Vehmaa
Virolahti
Virrat
Ylivieska
Lempäälä
Lohja
Luumäki
Mäntsälä
Nokia
Orimattila
Pirkkala
Porvoo
Riihimäki
Ruokolahti
Sipoo
Siuntio
Taipalsaari
Tampere
Tuusula
Valkeakoski
Vantaa
Vihti
Virolahti
Ylöjärvi

KAASUYHDISTYS.FI
Source: Gasum Oy
Natural gas transmission network 2016

KAASUYHDISTYS.FI
Length of the natural gas
transmission network (2016)
Source: Finnish Gas Association
Material Lenght (km)
Polyethylene 1887
Steel 48
Cast iron 20
Total 1955
Dimension, mm Lenght (km)
DN 1000 1
DN 900 122
DN 800 1
DN 700 262
DN 500 326
DN 400 195
DN 300 104
DN 250 32
DN 200 88
DN 150 58
DN 100 38
DN 80 4
DN 50 1
PEH 315 28
PEH 200 21
PEH 90-180 9
Total 1288
Length of the natural gas
distribution network (2015)

KAASUYHDISTYS.FI
Source: Finnish Gas Association
Natural gas consumption in Finland (1974 – 2015)
0
500
1000
1500
2000
2500
3000
3500
4000
4500
5000m
illio
nm
3
Local distribution
Energy and powercompanies
Manufacturing

KAASUYHDISTYS.FI
Natural gas consumption by market
sectors in Finland (2015)

KAASUYHDISTYS.FI
Natural gas consumption in Finland (2015)
Source: Finnish Gas Association
Consumption 2 606 million m3 = 26,1 TWh

KAASUYHDISTYS.FI
Number of gas consumers in Finland (2015)
Source: Finnish Gas Association
NumberConsumption
(million m3/a)
Average
consumption
(m3/a/consumer)
Households, cooking 21 200 0,5 30
Vehicles 1 900 4 2 100
One-family houses,
heating4 230 11 2 600
Apartment houses 755 18 23 800
Commercial and public
buildings928 33 35 500
Greenhouses 25 2.5 100 000
Small-scale industry 640 136 212 000
Heavy industry 35 1 285 36 700 000
District heating plants 80 177 2 200 000
Power plants 25 939 37 600 000
Total 29 300 2 606 87 000

KAASUYHDISTYS.FI
Source: Finnish Gas Association
Natural gas consumption in manufacturing in Finland (1996 – 2015)
0
500
1000
1500
2000
2500m
ill.
m3
Other manufacturing
Chemical industry
Forest industry

KAASUYHDISTYS.FI
Source: Finnish Gas Association
Natural gas consumption in power and heat production in Finland (1996 – 2015)
0
500
1000
1500
2000
2500
3000m
ill.
m3
Production of electricity
Production of districtheat
Production of CHP

KAASUYHDISTYS.FI
Natural gas consumption in different sectors
in Finland
Source: Finnish Gas Association
0
500
1000
1500
2000
2500
3000
mill
.m3
Manufactoring
Energy companies
Local distribution

KAASUYHDISTYS.FI
Source: Finnish Gas Association
Local distribution of natural gas in Finland (1996 – 2015)
-
50
100
150
200
250
mill
. m
3
Households, cooking
Apartment houses
Commercial and publicservices
District heating
Greenhouses
Manufacturing
Transport

KAASUYHDISTYS.FI
Source: Finnish Gas Association
Local distribution of natural gas in Finland (2015)
2%
65%1%
3%
16%
8%
5%
Transport
Manufacturing
Greenhouses
District heating
Commercial and public services
Apartment houses
Households, cooking

KAASUYHDISTYS.FI
Characteristics in local distribution of gas in
Finland
Source: Finnish Gas Association
0
1000
2000
3000
4000
5000
Subscribers, one-family houses(pieces)
Other subscribers (pieces)
Sales of gas (GWh)
Lenght of the distribution network(km)
Gas vehicles (pieces)

KAASUYHDISTYS.FI
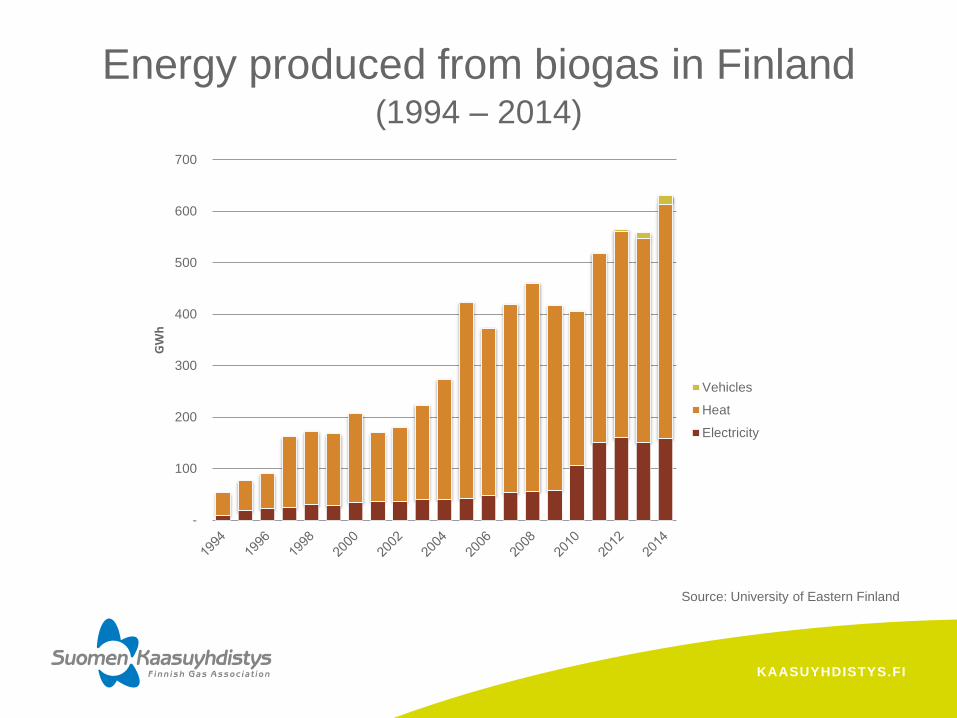
Source: University of Eastern Finland
Biogas productiuon and utilization in Finland (1994 – 2014)
-
20
40
60
80
100
120
140
160
180M
illio
nm
3
Combustion of surplusbiogas
Biogas utilized

KAASUYHDISTYS.FI
Source: University of Eastern Finland
Biogas from landfil gas recovery plants in Finland (1994 – 2014)
-
20
40
60
80
100
120M
illio
nm
3
Combustion of surplusbiogas
Biogas utilized
KAASUYHDISTYS.FI
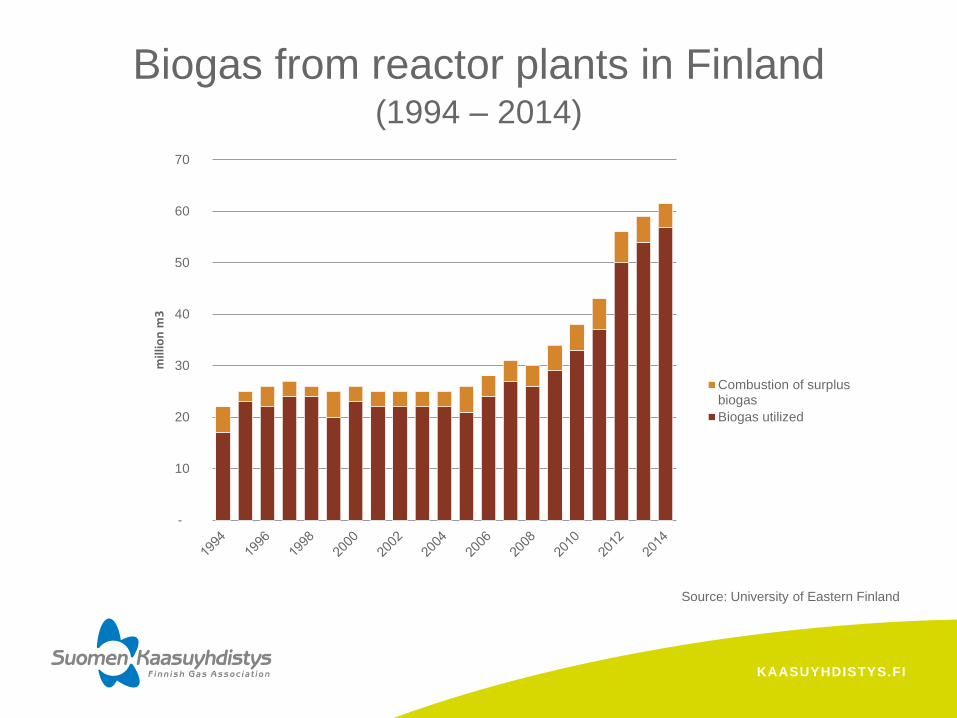
Source: University of Eastern Finland
Biogas from reactor plants in Finland (1994 – 2014)
-
10
20
30
40
50
60
70m
illio
nm
3
Combustion of surplusbiogas
Biogas utilized

KAASUYHDISTYS.FI
Source: University of Eastern Finland
Biogas production by the types of biogasplants in Finland (2014)
Landfills
Municipal wastewater
Other reactor plants
Industrial wastewater
Farms
0 10 20 30 40 50 60 70 80 90 100
million m3
KAASUYHDISTYS.FI
Source: University of Eastern Finland
Energy produced from biogas in Finland (1994 – 2014)
-
100
200
300
400
500
600
700G
Wh
Vehicles
Heat
Electricity