Embed Size (px)
Citation preview
Bio 106
Lecture 3
TOPICS
• Pseudoalleles
• Environmental Influence on Gene Expression
– Definition of Terms
– External Environmental
– Internal Environmental
• Twin Studies: Concordance and Discordance
• Pedigree Analysis
cces2014
PSEUDOALLELES
- a cluster of not fully complementing genes, separable by recombination
- closely linked genes that act usually as if a
single member of an allelic pair but occasionally undergo crossing-over and recombination
cces2014
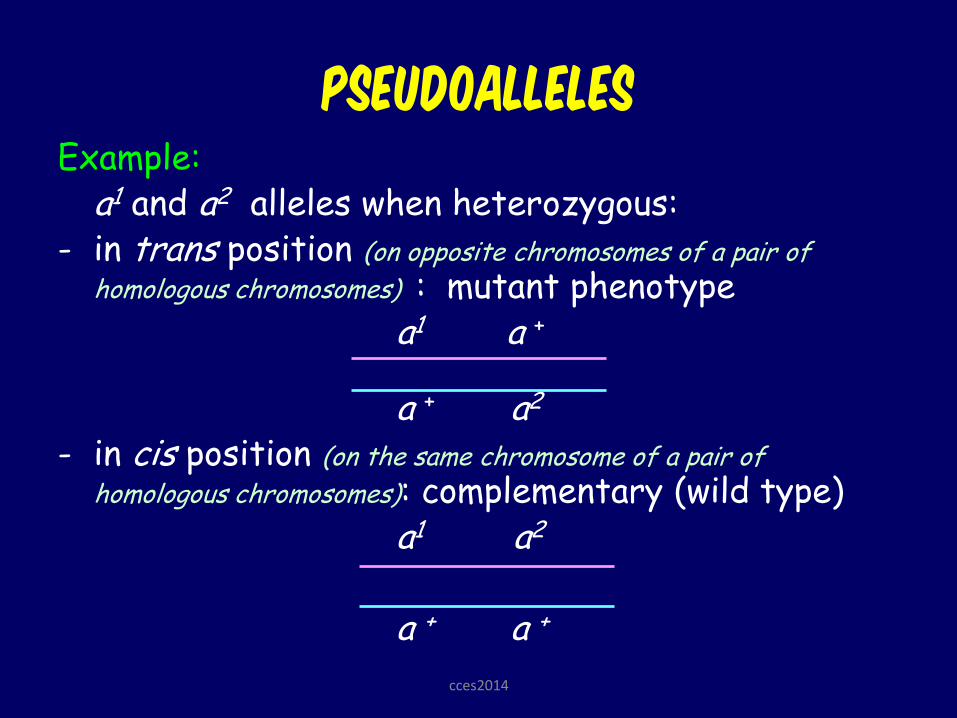
PSEUDOALLELES
Example: a1 and a2 alleles when heterozygous: - in trans position (on opposite chromosomes of a pair of
homologous chromosomes) : mutant phenotype a1 a +
a + a2 - in cis position (on the same chromosome of a pair of
homologous chromosomes): complementary (wild type) a1 a2
a + a +
cces2014
Environmental influence
on gene expression
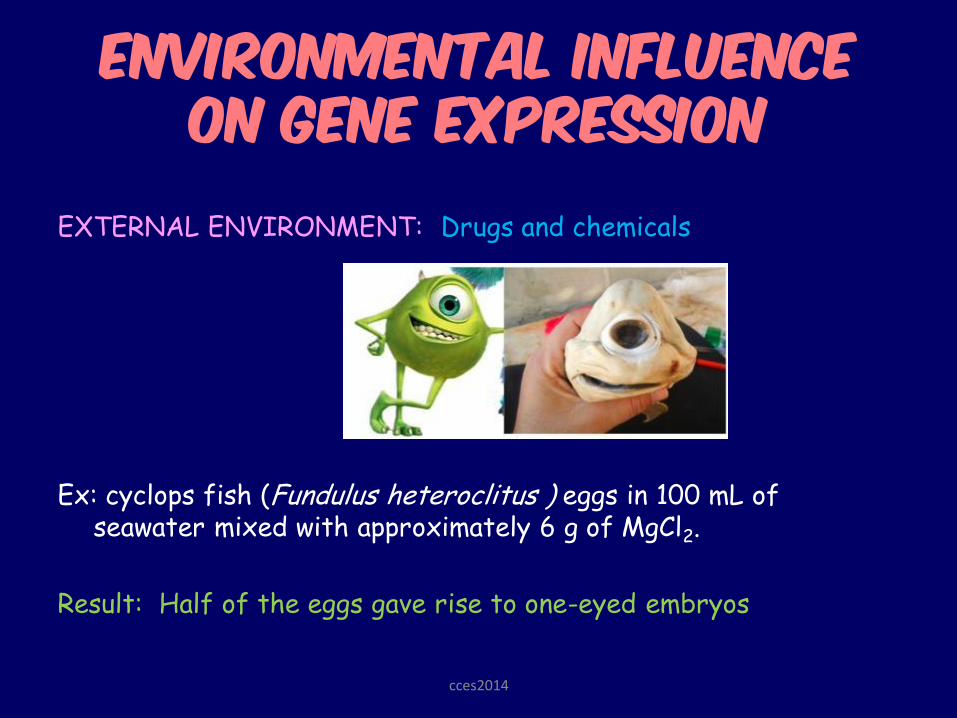
EXTERNAL ENVIRONMENT: Drugs and chemicals
Ex: cyclops fish (Fundulus heteroclitus ) eggs in 100 mL of seawater mixed with approximately 6 g of MgCl2.
Result: Half of the eggs gave rise to one-eyed embryos
cces2014
Environmental influence
on gene expression
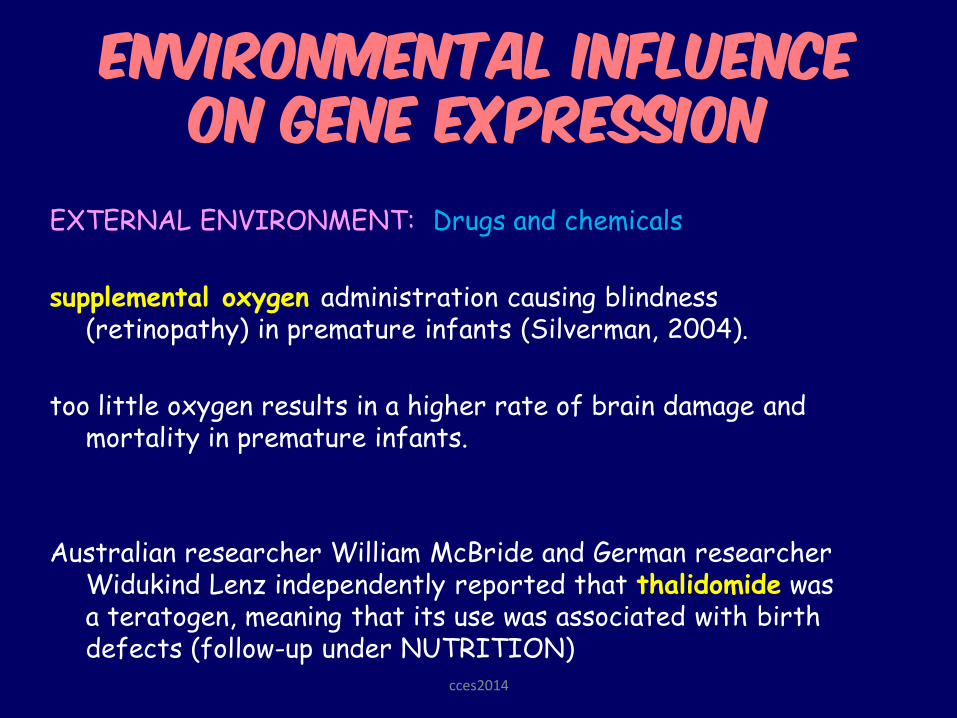
EXTERNAL ENVIRONMENT: Drugs and chemicals
supplemental oxygen administration causing blindness (retinopathy) in premature infants (Silverman, 2004).
too little oxygen results in a higher rate of brain damage and mortality in premature infants.
Australian researcher William McBride and German researcher Widukind Lenz independently reported that thalidomide was a teratogen, meaning that its use was associated with birth defects (follow-up under NUTRITION)
cces2014
Environmental influence
on gene expression
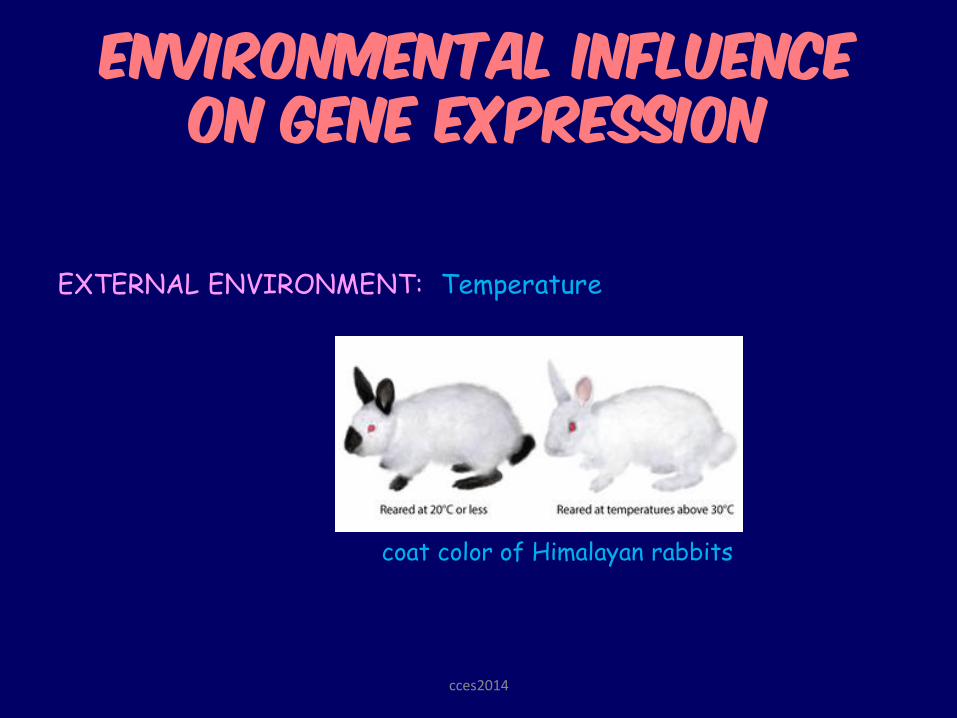
EXTERNAL ENVIRONMENT: Temperature
coat color of Himalayan rabbits
cces2014
Environmental influence
on gene expression
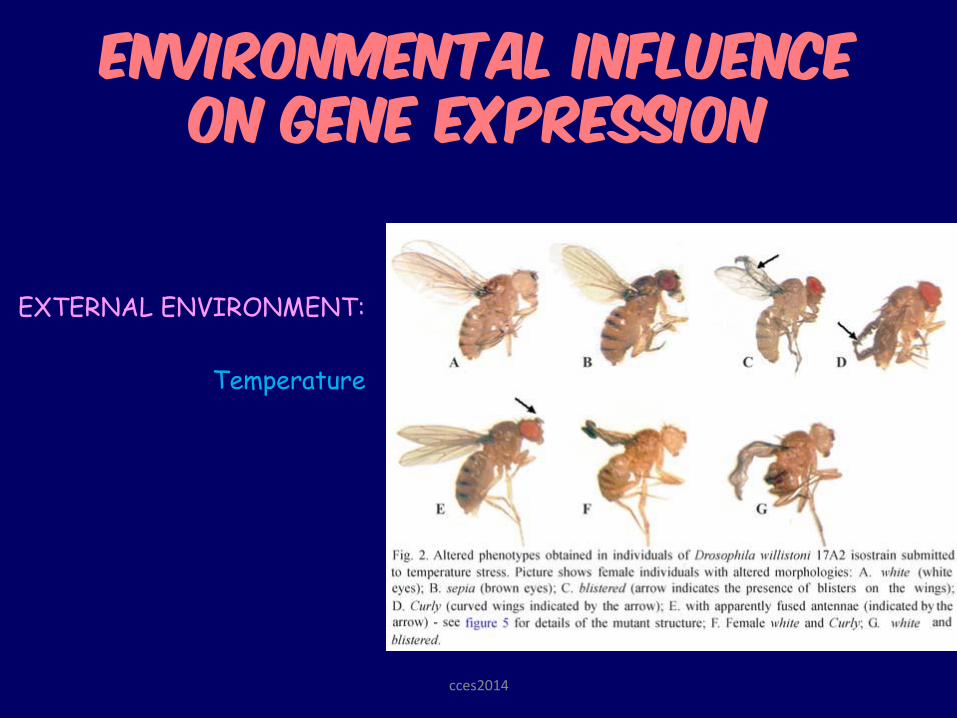
EXTERNAL ENVIRONMENT:
Temperature
cces2014
Environmental influence
on gene expression
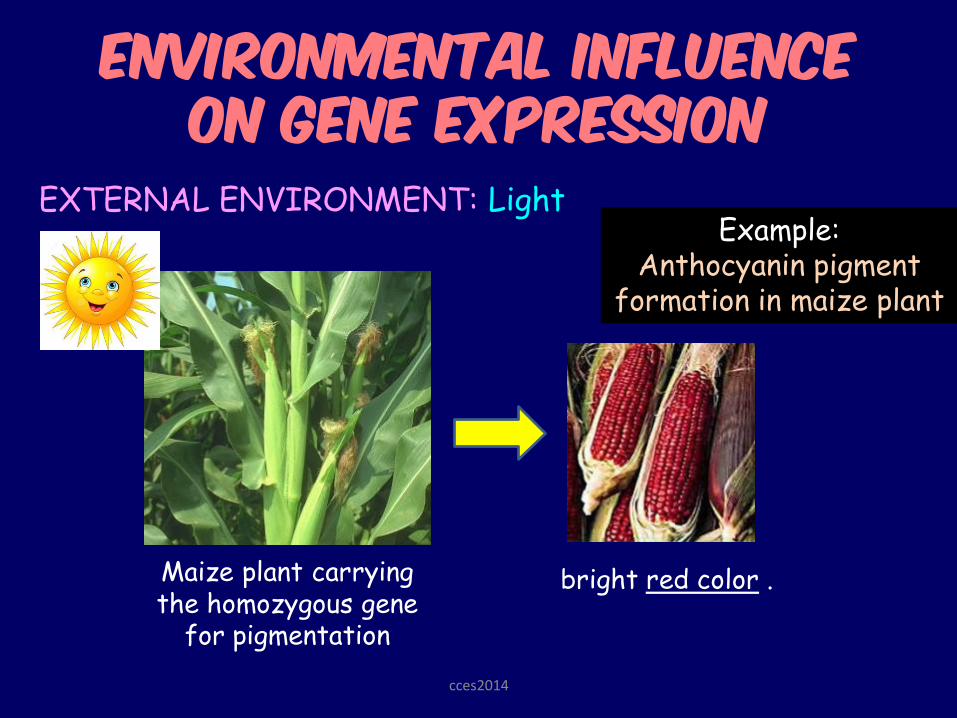
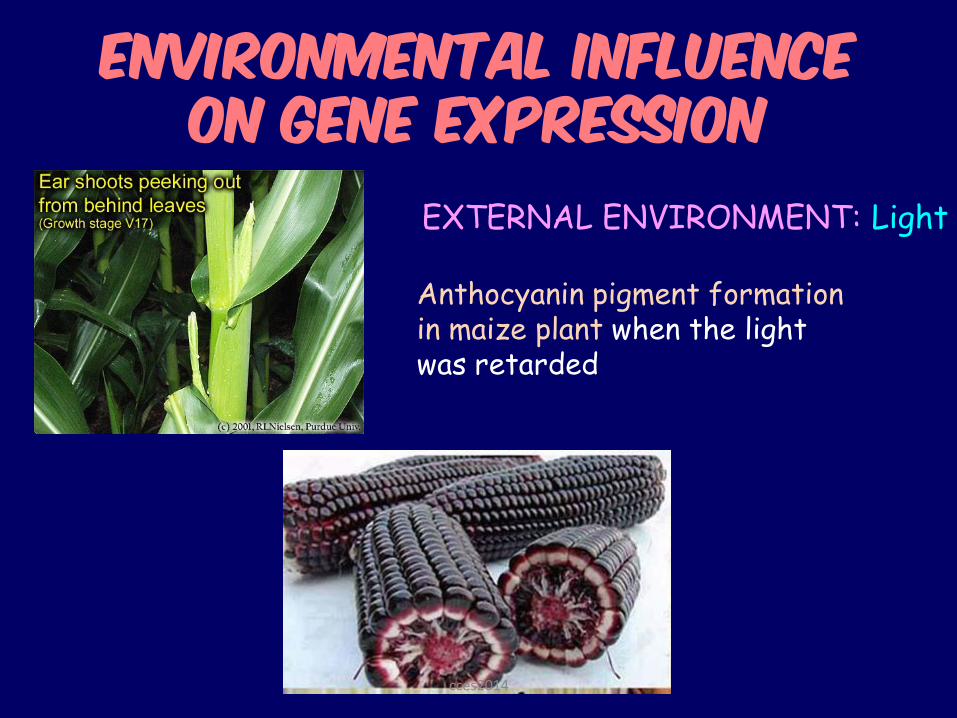
EXTERNAL ENVIRONMENT: Light Example:
Anthocyanin pigment formation in maize plant
bright red color . Maize plant carrying the homozygous gene
for pigmentation
cces2014
Environmental influence
on gene expression
EXTERNAL ENVIRONMENT: Light
Anthocyanin pigment formation in maize plant when the light was retarded
cces2014
Environmental influence
on gene expression
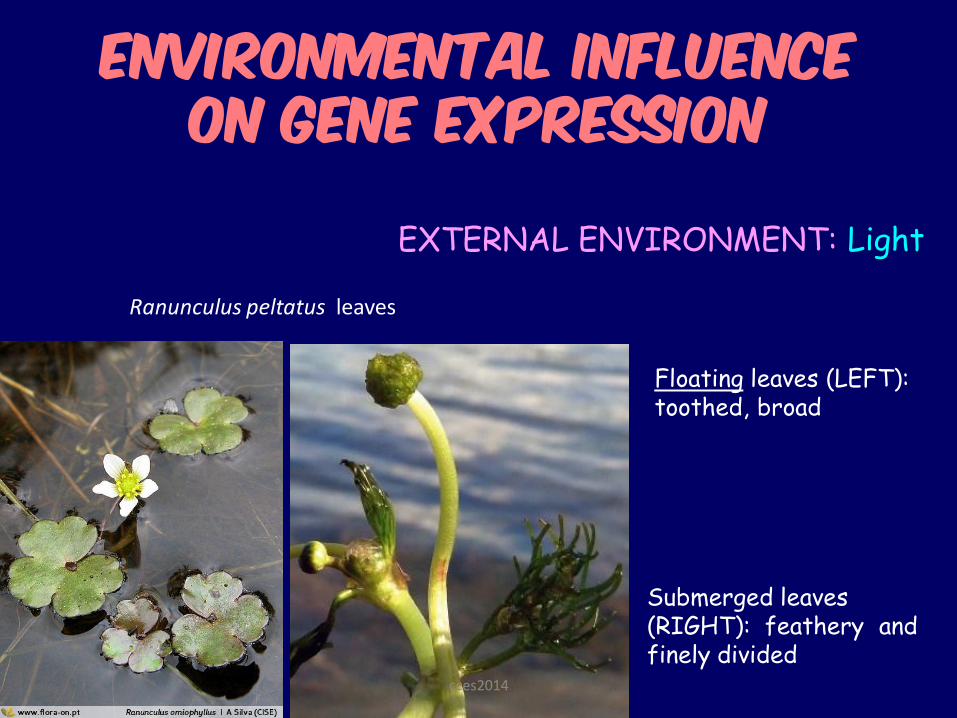
EXTERNAL ENVIRONMENT: Light
Ranunculus peltatus leaves
Floating leaves (LEFT): toothed, broad
Submerged leaves (RIGHT): feathery and finely divided
cces2014
Environmental influence
on gene expression
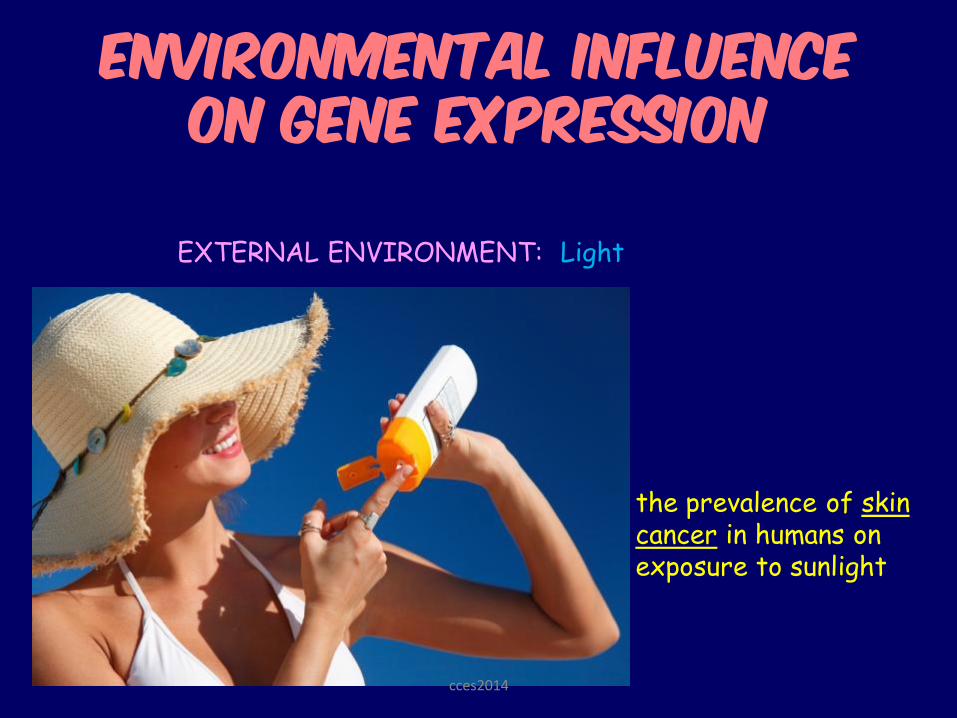
EXTERNAL ENVIRONMENT: Light
the prevalence of skin cancer in humans on exposure to sunlight
cces2014
Environmental influence on
gene expression
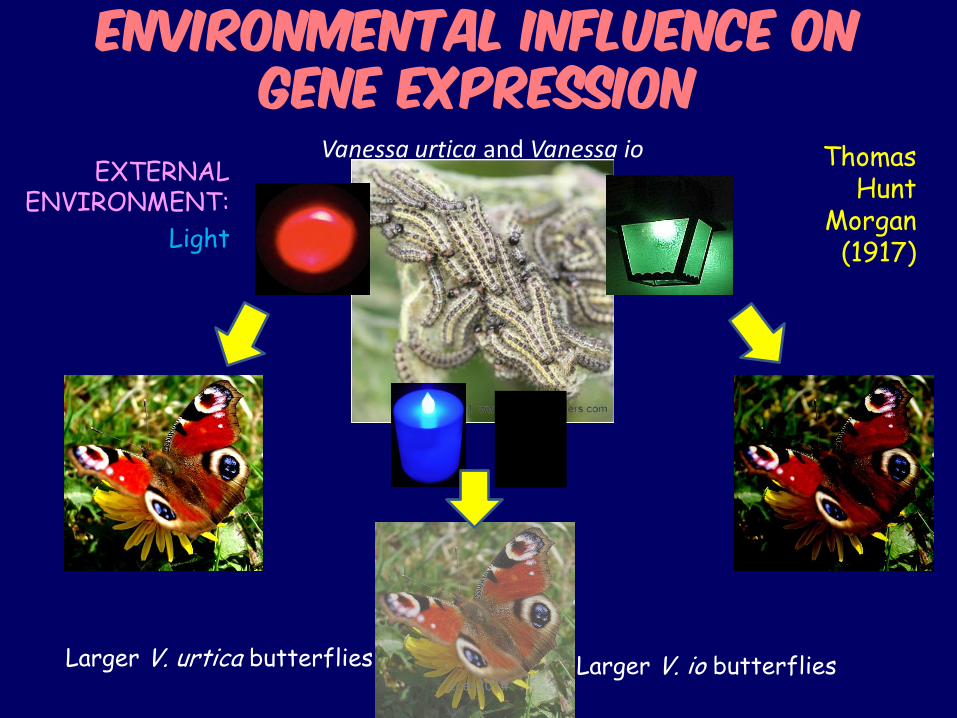
EXTERNAL ENVIRONMENT:
Light
Vanessa urtica and Vanessa io
Larger V. urtica butterflies Larger V. io butterflies
Thomas Hunt
Morgan (1917)
cces2014
Environmental influence
on gene expression
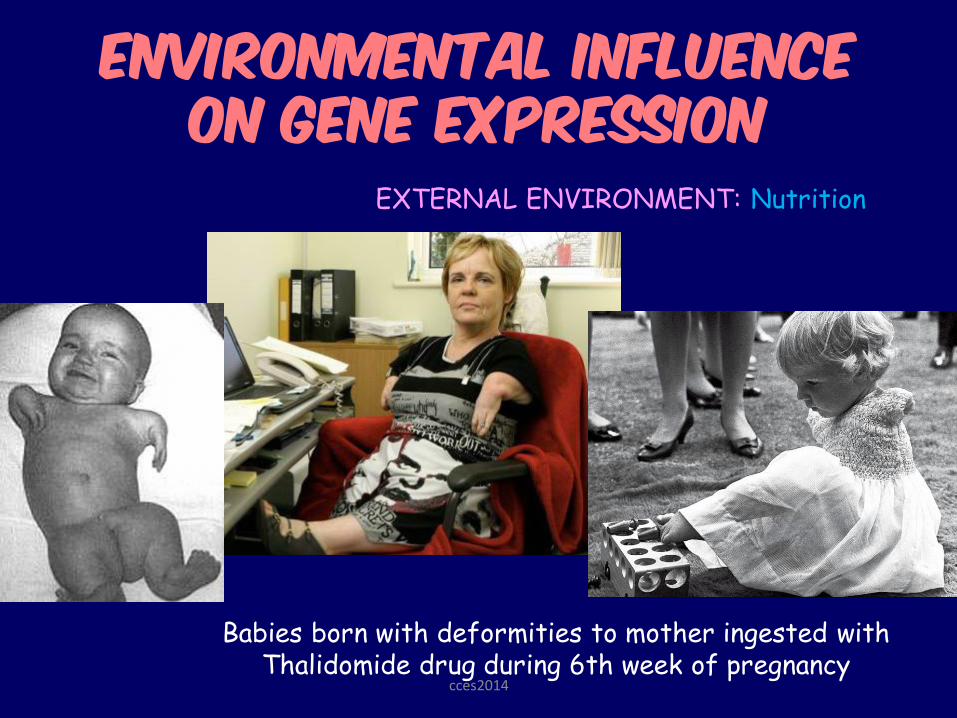
EXTERNAL ENVIRONMENT: Nutrition
Babies born with deformities to mother ingested with Thalidomide drug during 6th week of pregnancy
cces2014
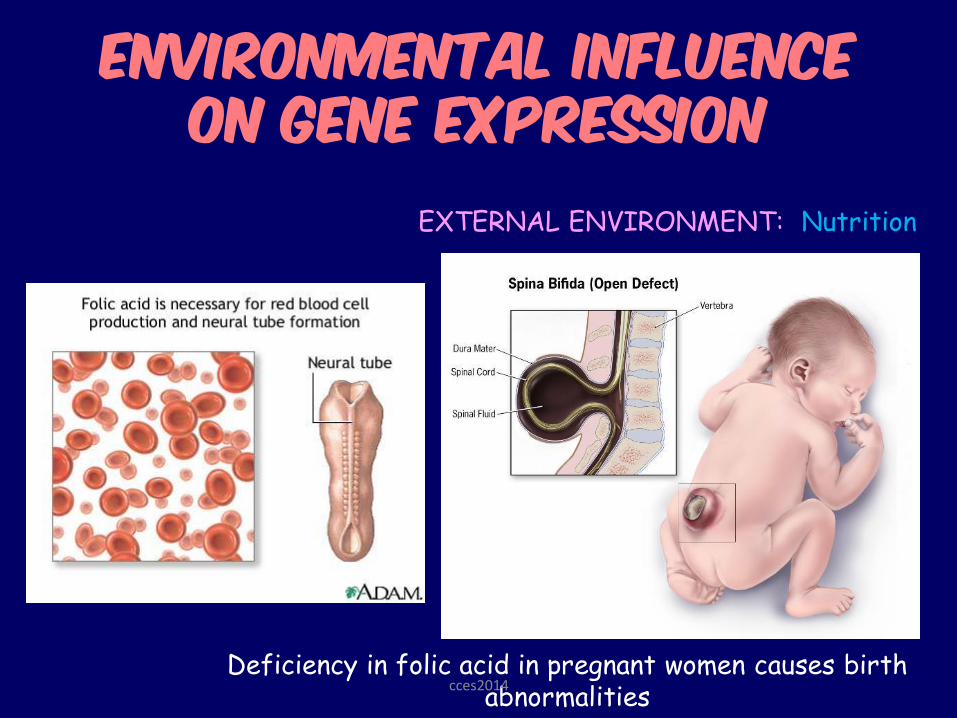
Environmental influence
on gene expression
EXTERNAL ENVIRONMENT: Nutrition
Deficiency in folic acid in pregnant women causes birth
abnormalities cces2014
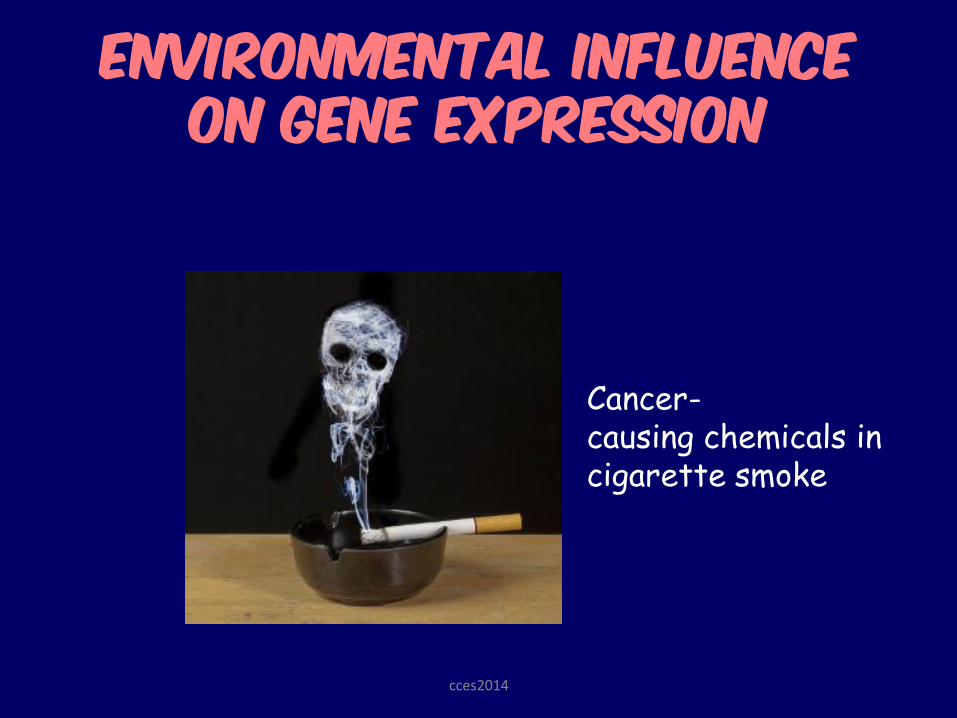
Cancer-causing chemicals in cigarette smoke
Environmental influence
on gene expression
cces2014
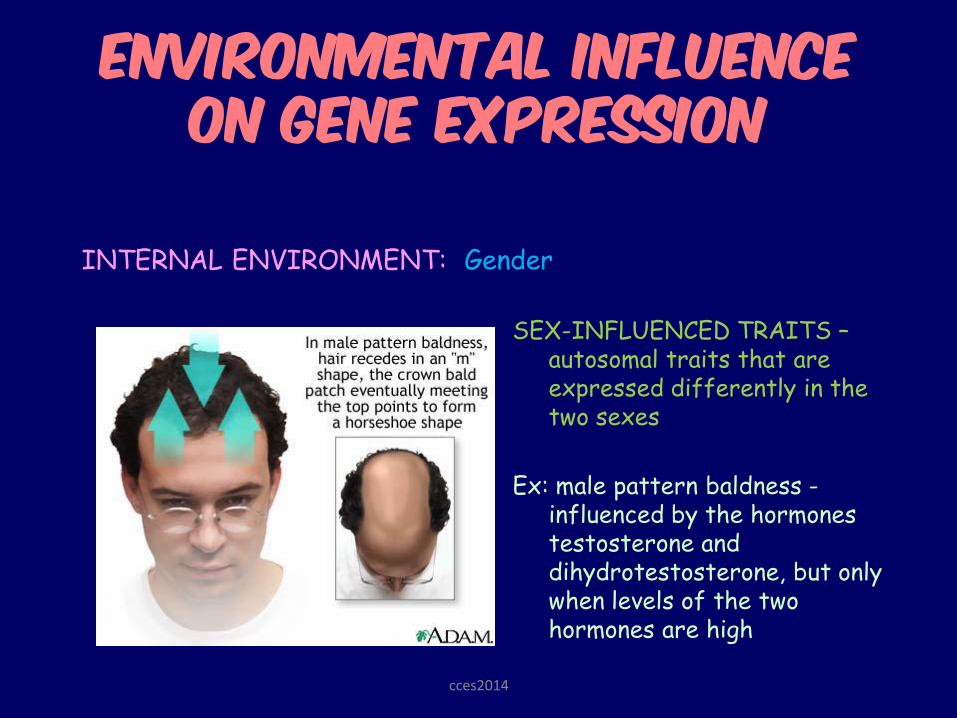
Environmental influence
on gene expression
SEX-INFLUENCED TRAITS – autosomal traits that are expressed differently in the two sexes
Ex: male pattern baldness - influenced by the hormones testosterone and dihydrotestosterone, but only when levels of the two hormones are high
INTERNAL ENVIRONMENT: Gender
cces2014
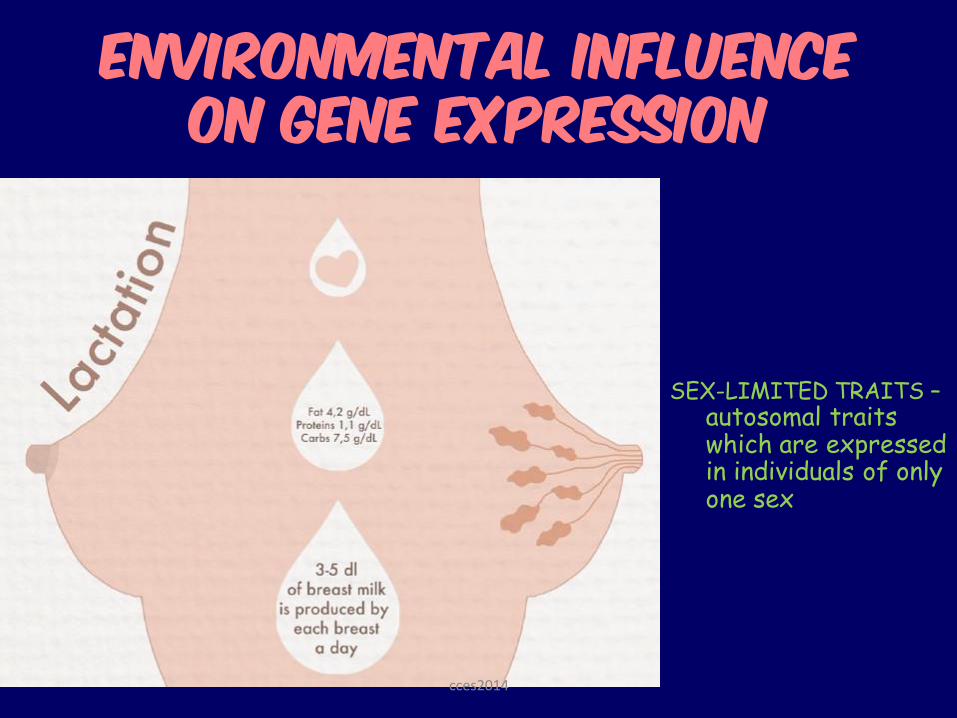
Environmental influence
on gene expression
SEX-LIMITED TRAITS – autosomal traits which are expressed in individuals of only one sex
INTERNAL ENVIRONMENT: GENDER
cces2014
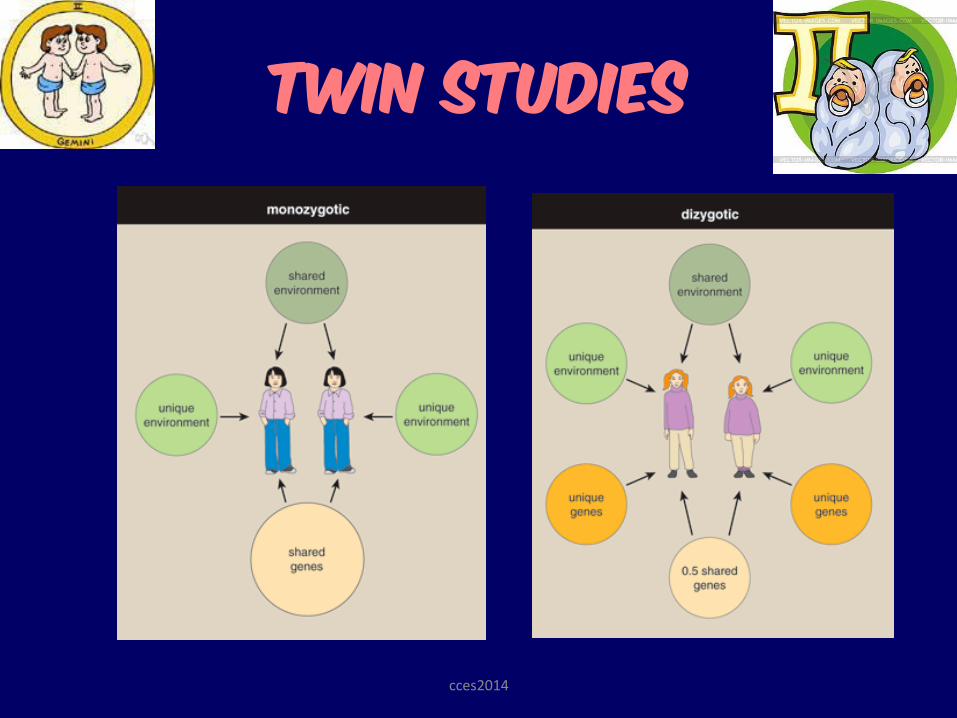
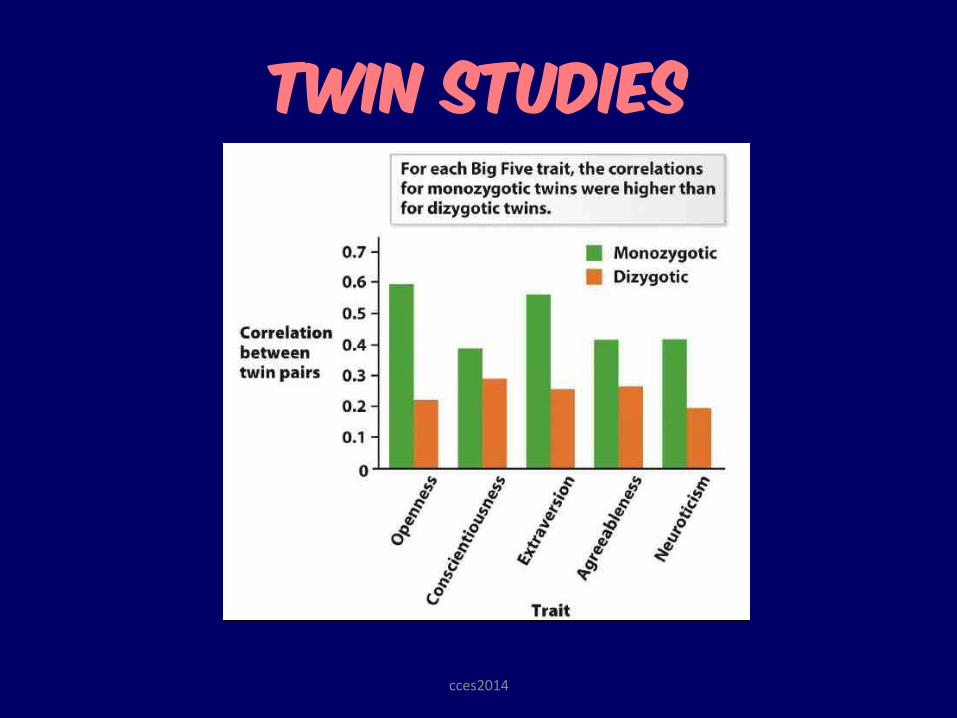
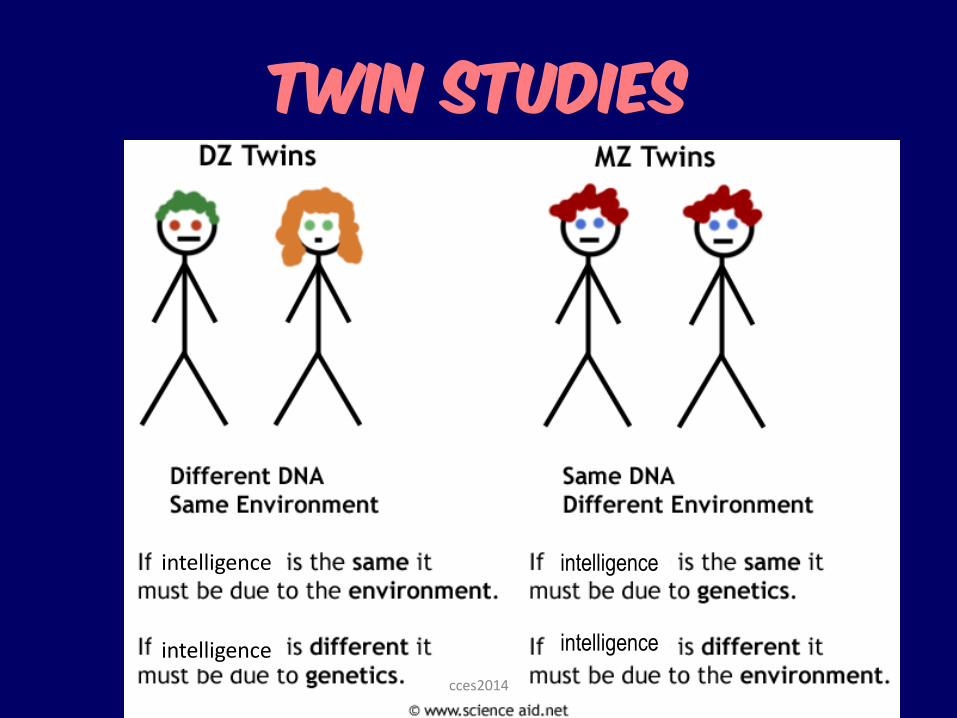
Twin studies
cces2014
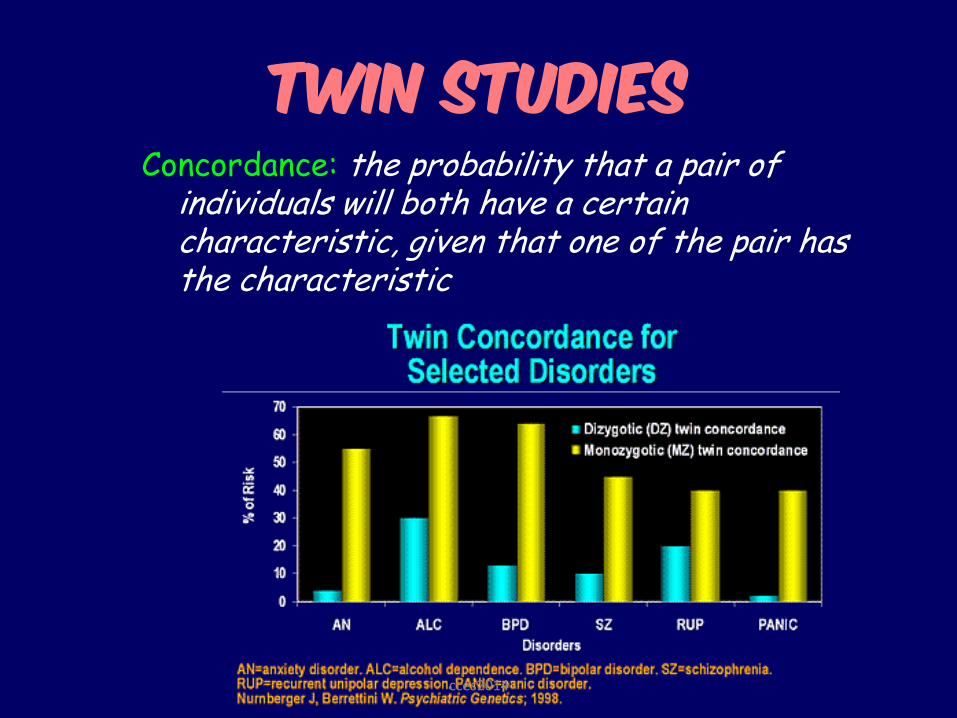
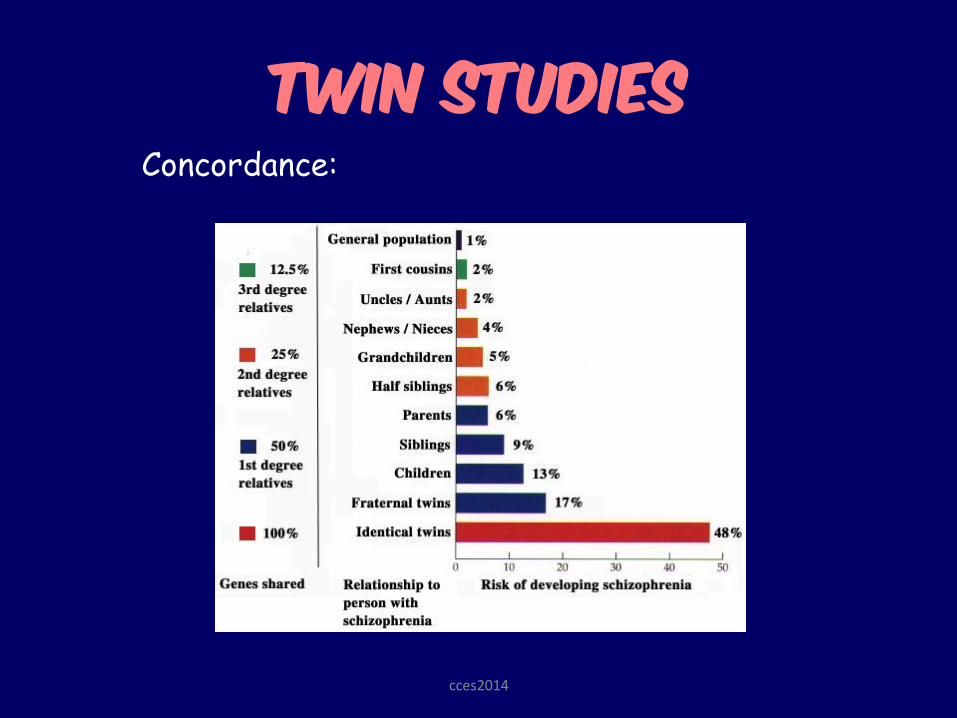
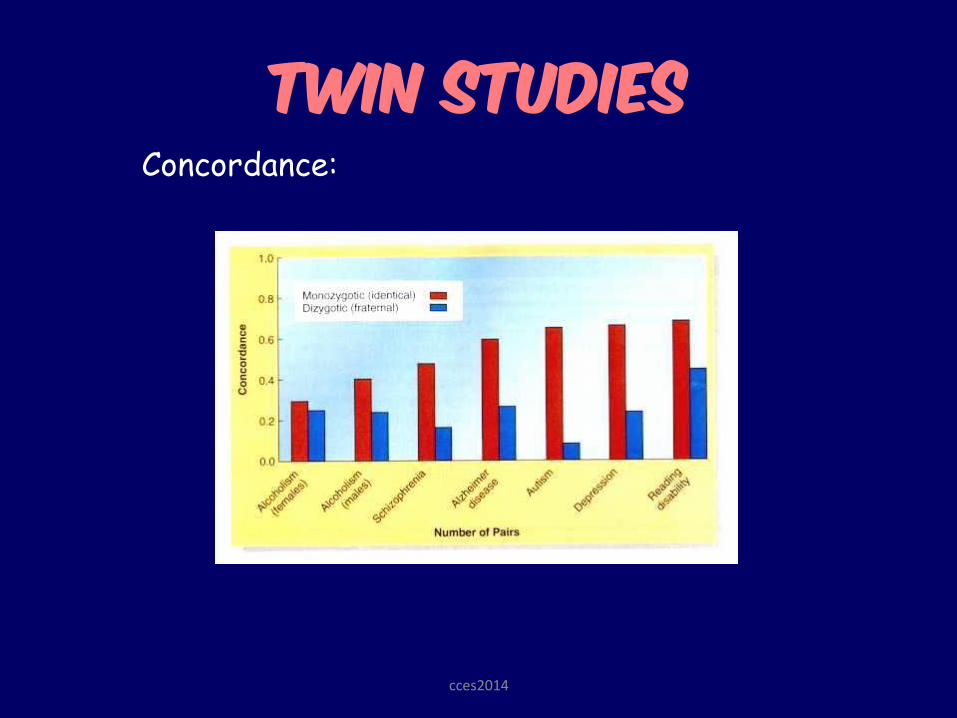
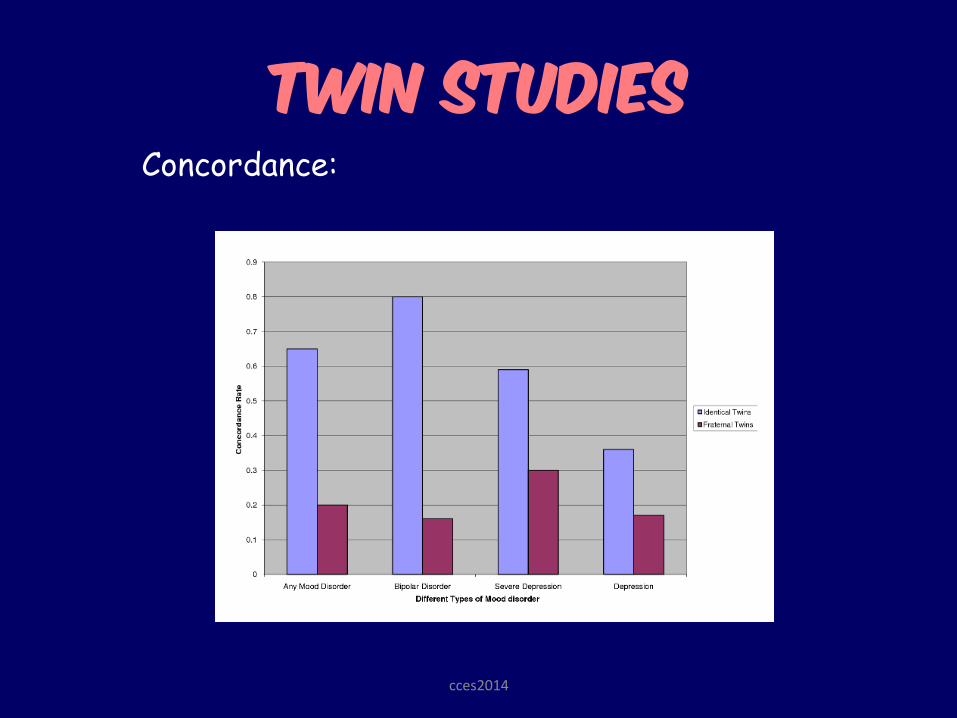
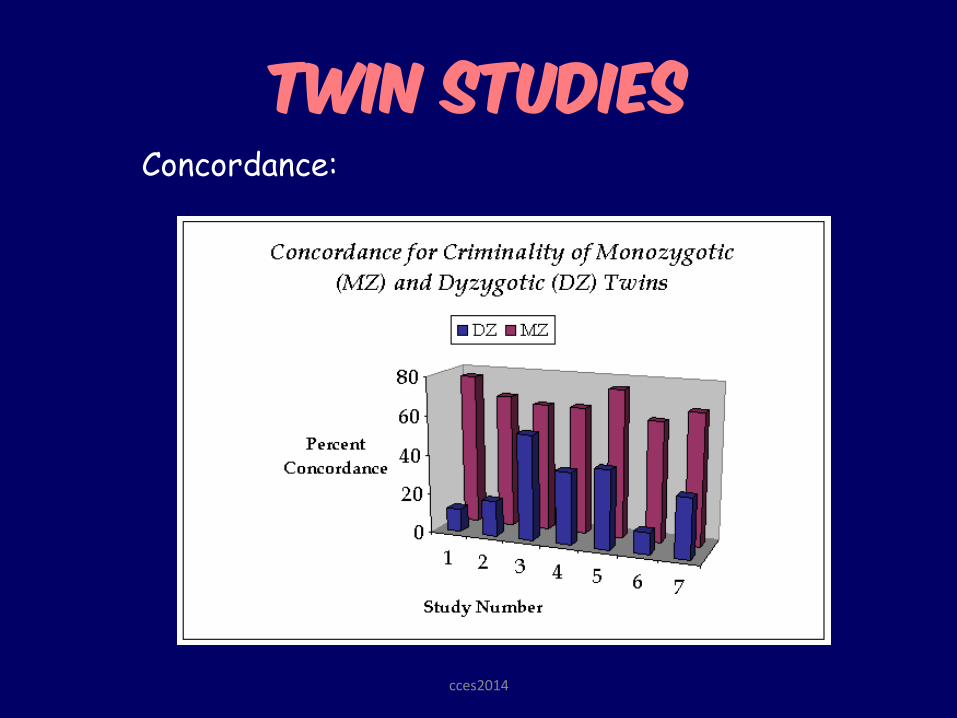
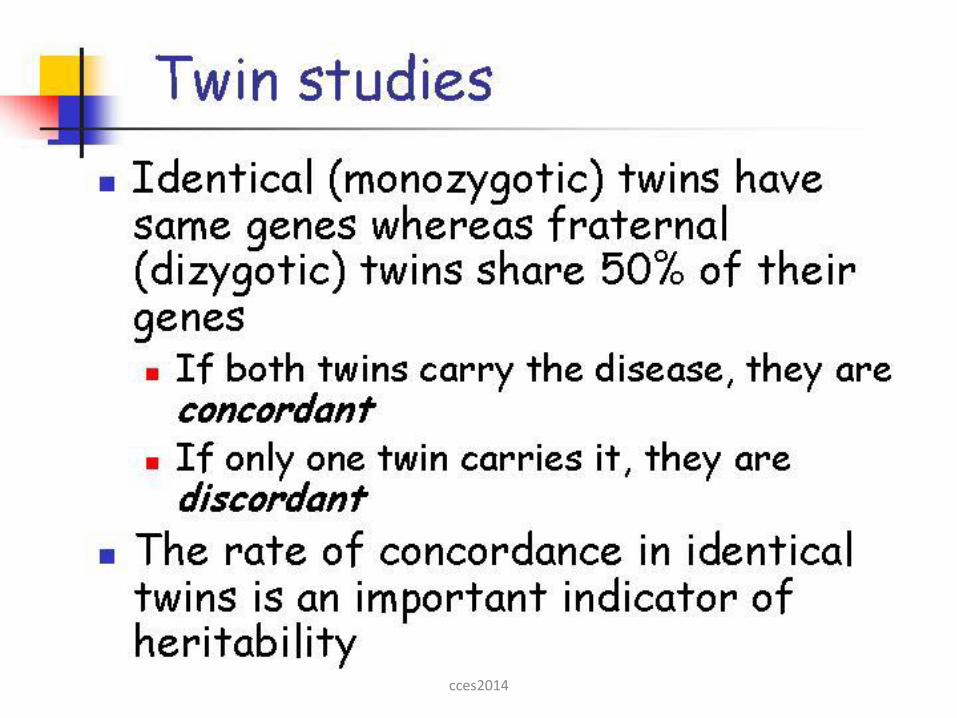
Twin studies Concordance: the probability that a pair of
individuals will both have a certain characteristic, given that one of the pair has the characteristic
cces2014
Twin studies Concordance:
cces2014
Twin studies
cces2014
Twin studies Concordance:
cces2014
Twin studies Concordance:
cces2014
Twin studies Concordance:
cces2014
Twin studies
intelligence
intelligence
intelligence
intelligence
cces2014
cces2014
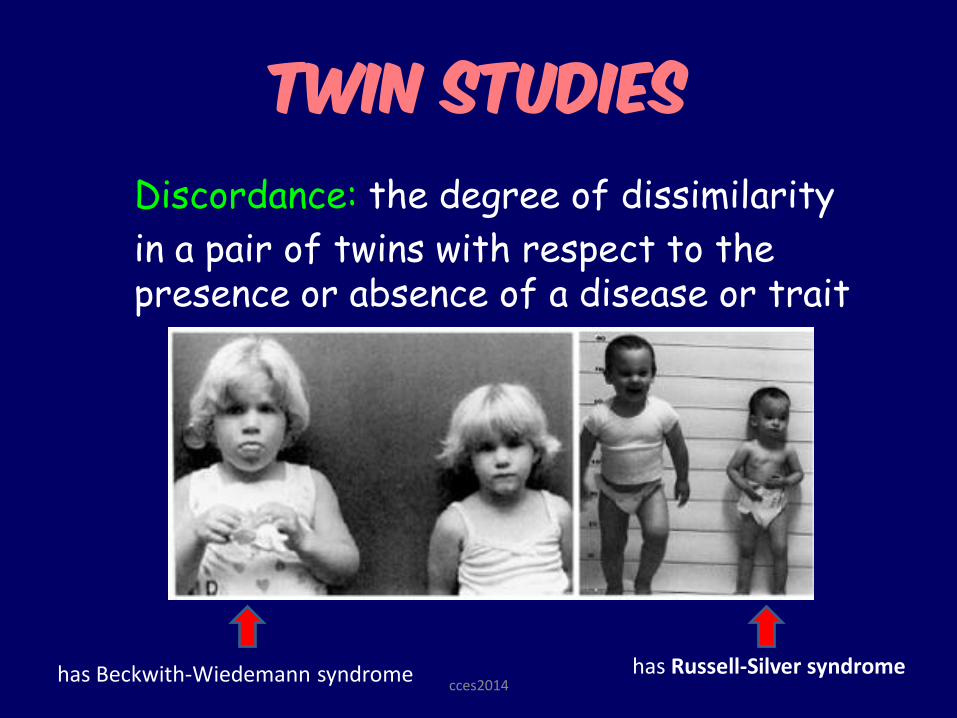
Twin studies
Discordance: the degree of dissimilarity
in a pair of twins with respect to the presence or absence of a disease or trait
has Beckwith-Wiedemann syndrome has Russell-Silver syndrome cces2014
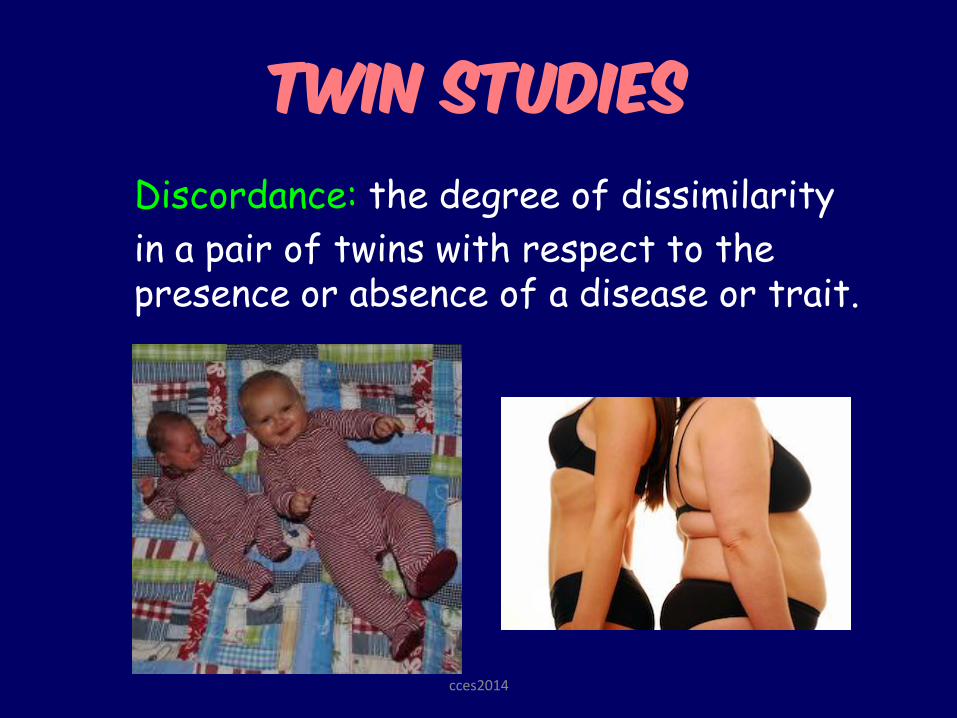
Twin studies
Discordance: the degree of dissimilarity
in a pair of twins with respect to the presence or absence of a disease or trait.
cces2014
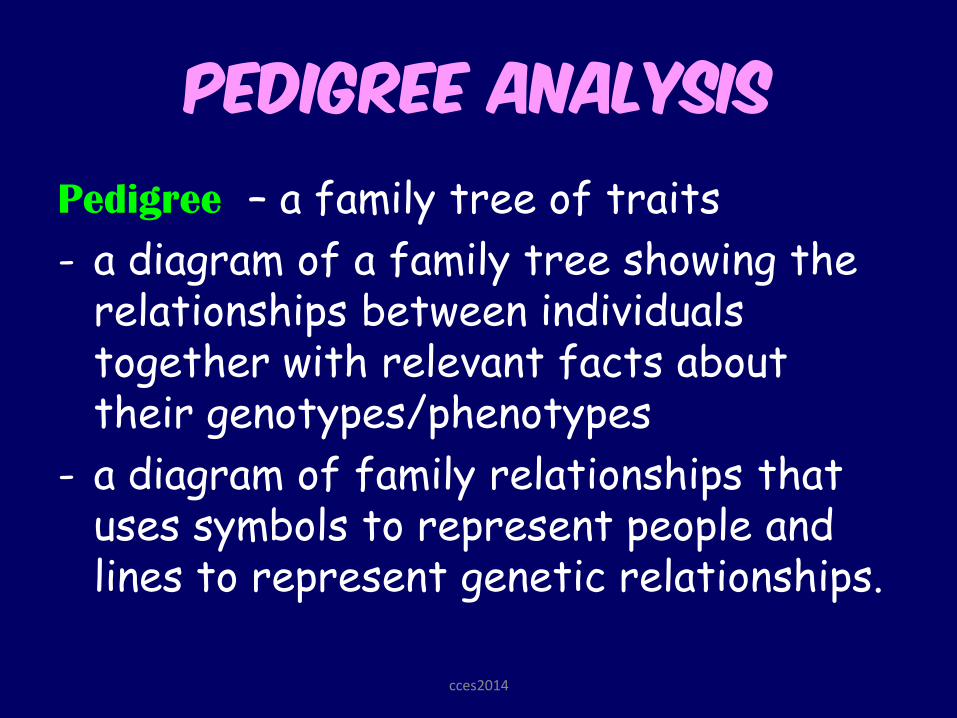
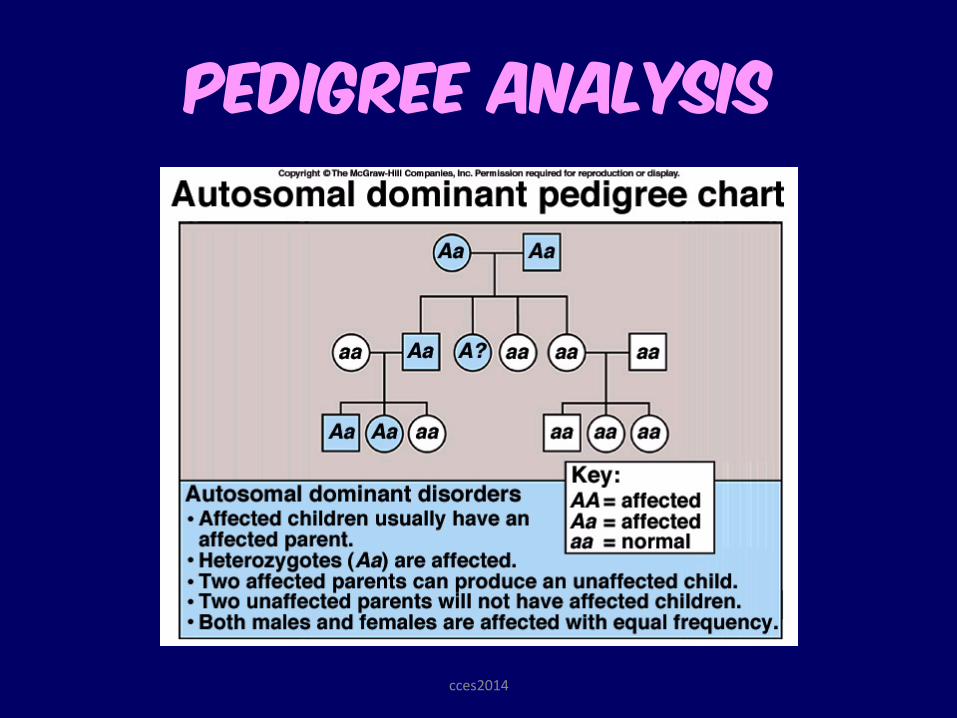
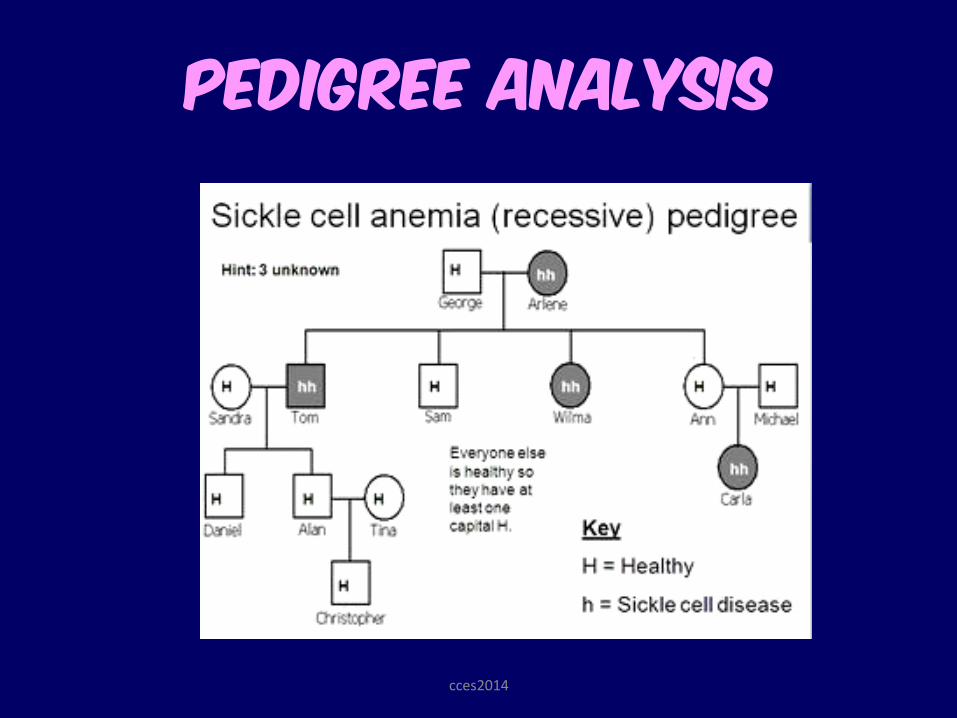
Pedigree analysis
Pedigree – a family tree of traits
- a diagram of a family tree showing the relationships between individuals together with relevant facts about their genotypes/phenotypes
- a diagram of family relationships that uses symbols to represent people and lines to represent genetic relationships. cces2014
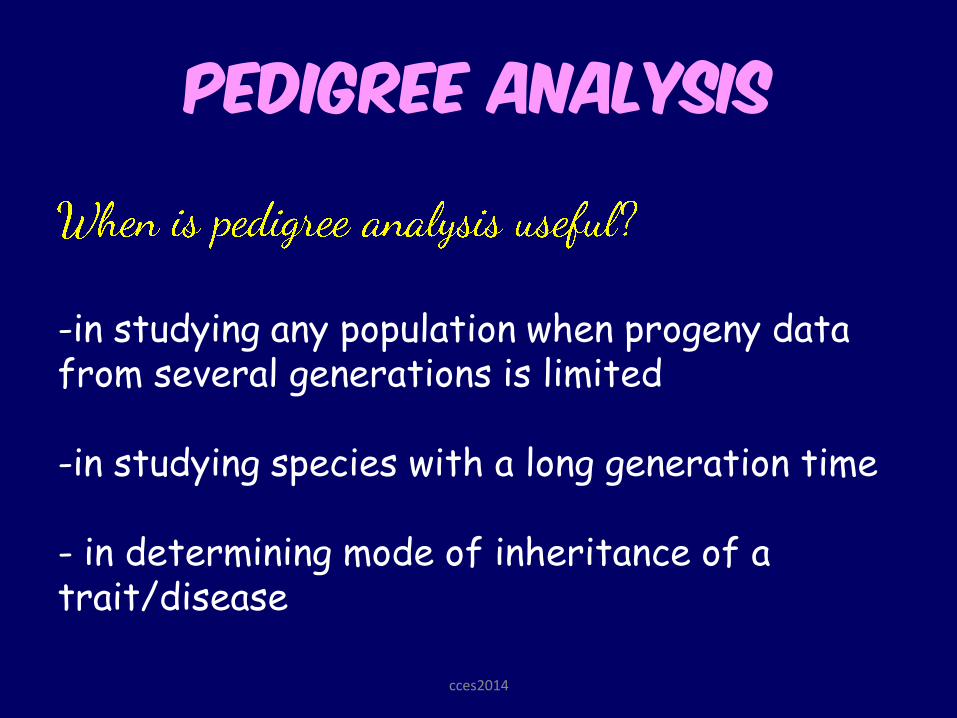
Pedigree analysis
-in studying any population when progeny data from several generations is limited
-in studying species with a long generation time
- in determining mode of inheritance of a trait/disease
cces2014
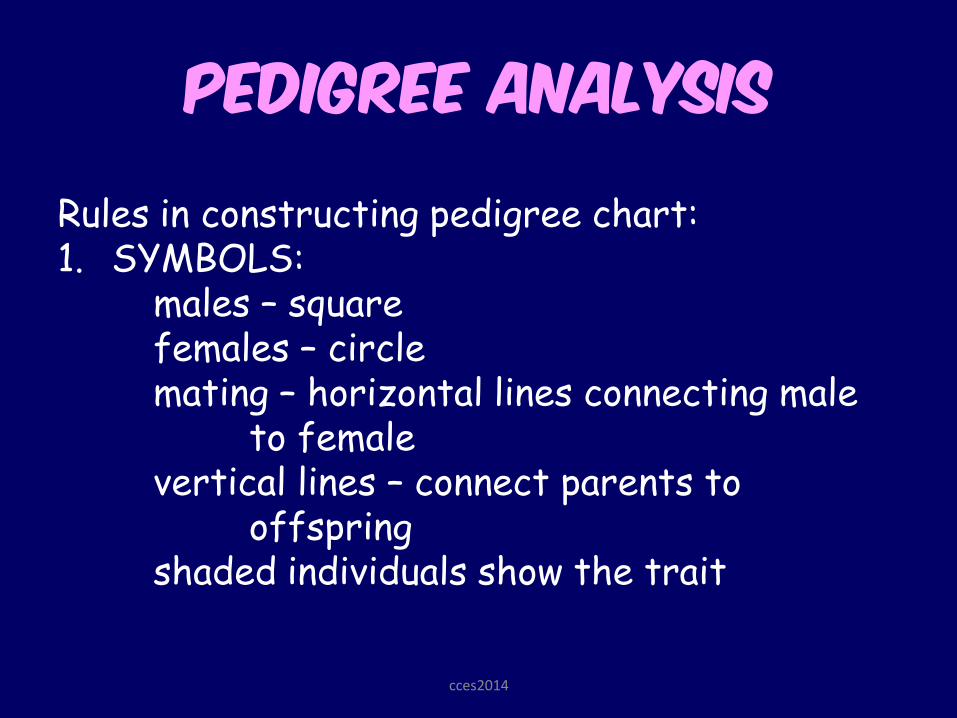
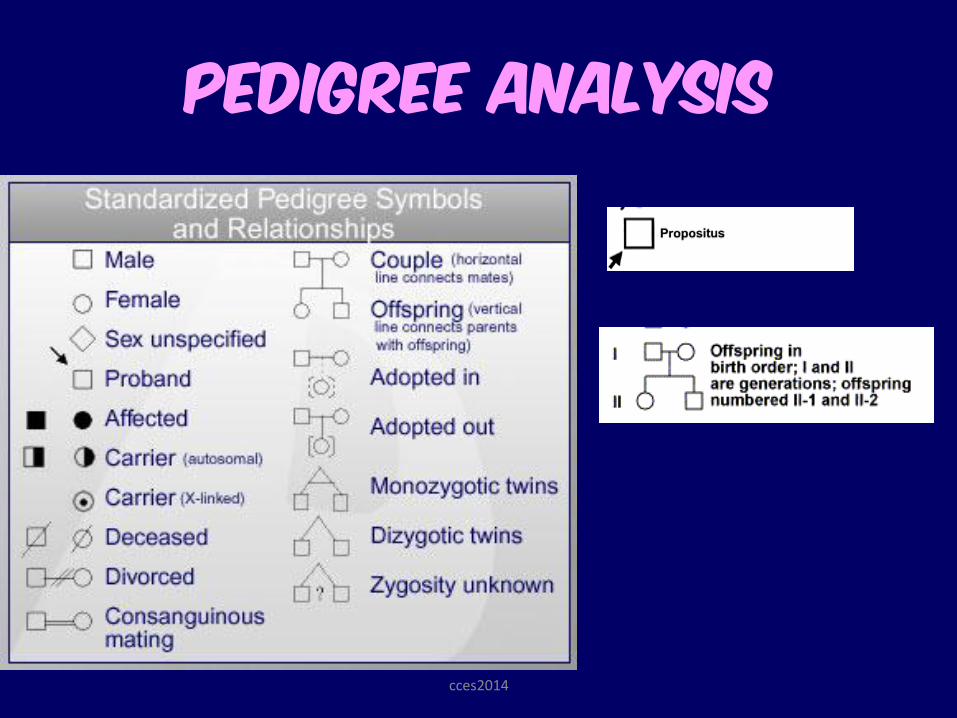
Pedigree analysis
Rules in constructing pedigree chart: 1. SYMBOLS: males – square females – circle mating – horizontal lines connecting male
to female vertical lines – connect parents to
offspring shaded individuals show the trait
cces2014
Pedigree analysis
cces2014
Pedigree analysis
2. Generations are numbered using Roman numerals. In a generation, each individual is numbered from left to right. Left to right also represents the birth order of the offspring.
cces2014
Pedigree analysis
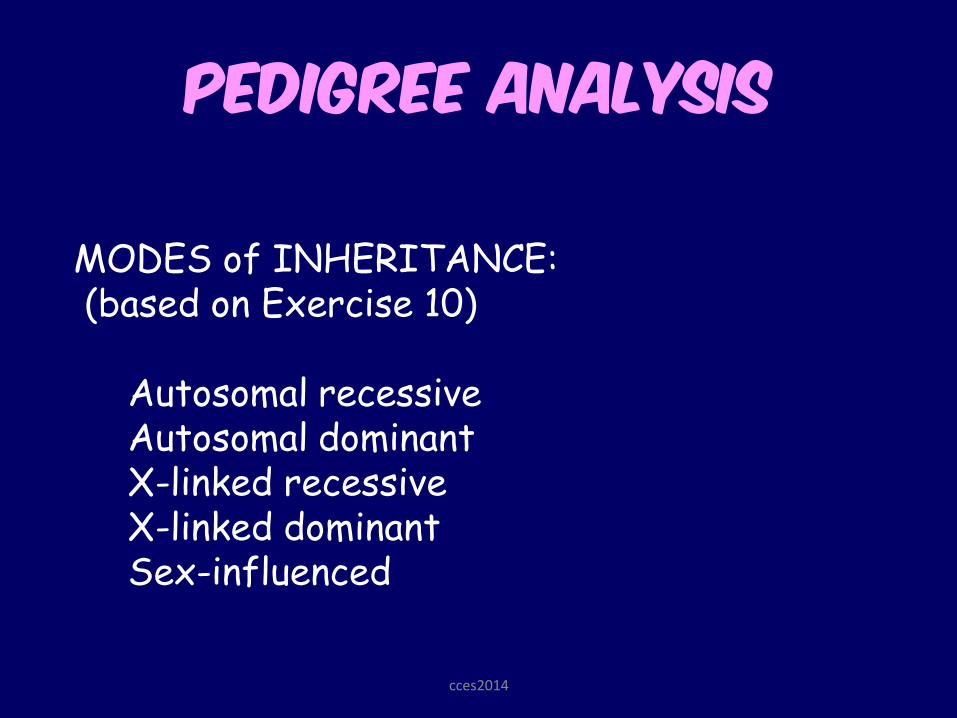
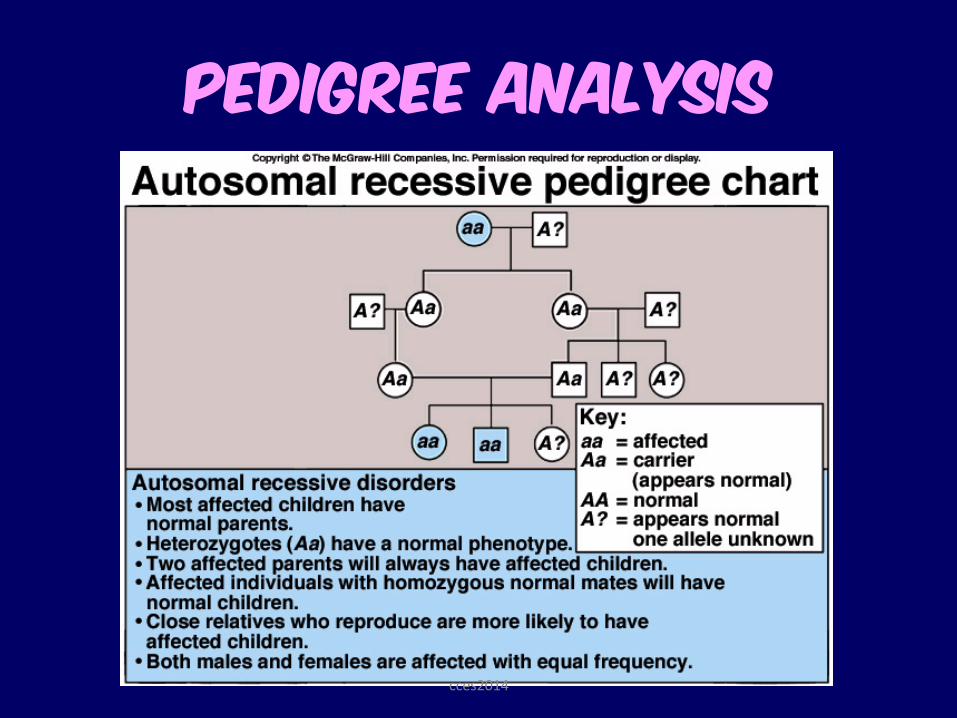
MODES of INHERITANCE: (based on Exercise 10) Autosomal recessive Autosomal dominant X-linked recessive X-linked dominant Sex-influenced
cces2014
Pedigree analysis
cces2014
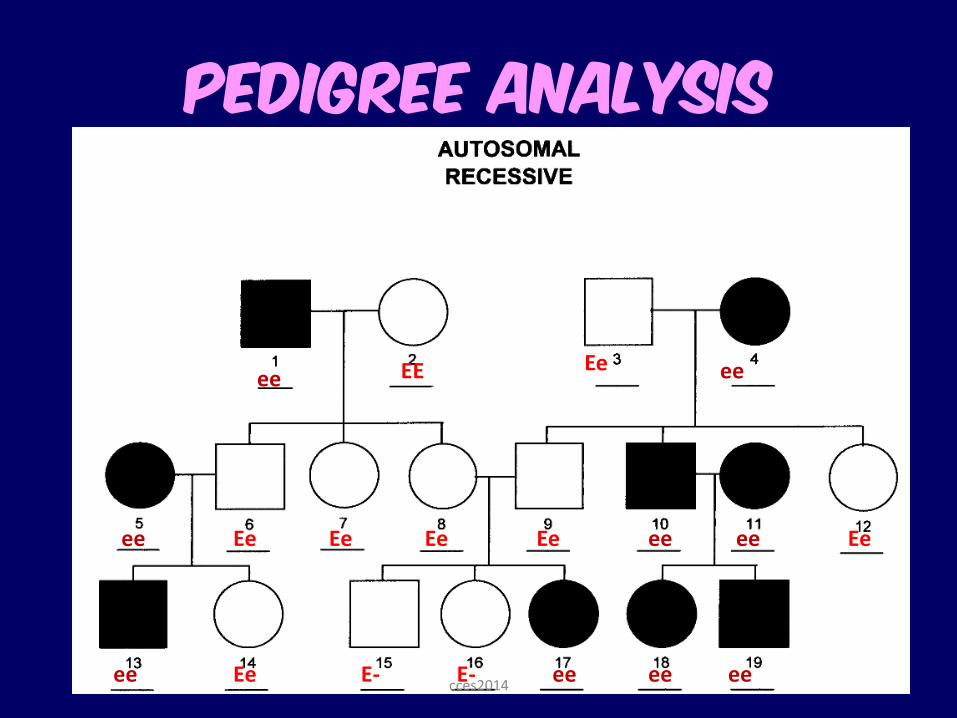
Pedigree analysis
ee ee
ee
ee
ee ee
ee ee ee
EE
Ee Ee Ee
Ee
Ee
Ee
Ee
E- E- cces2014
Pedigree analysis
cces2014
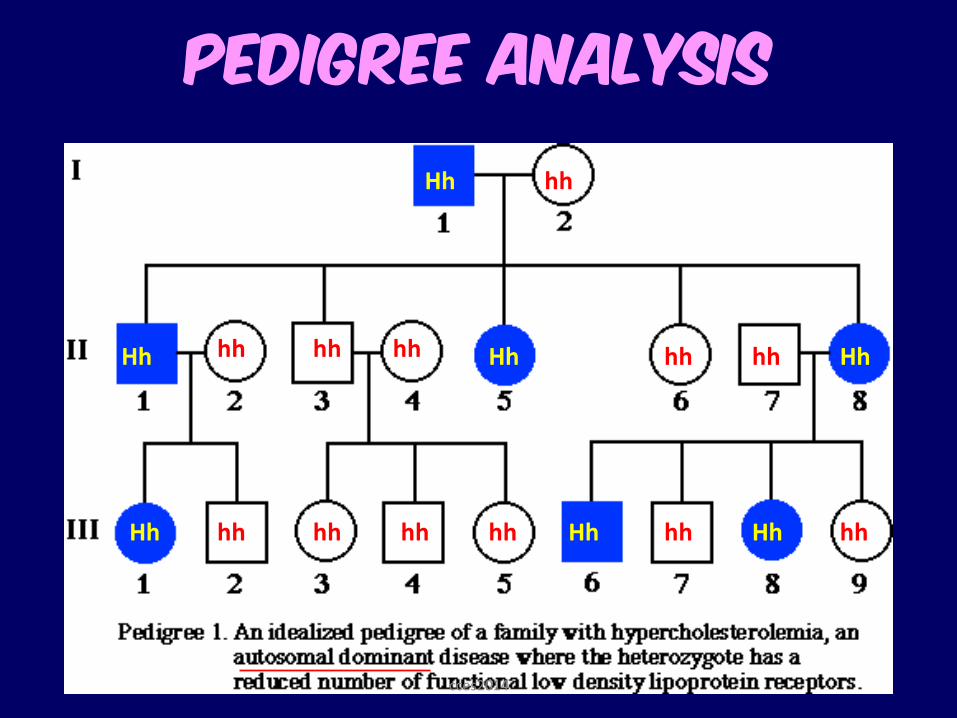
Pedigree analysis
hh
Hh hh hh hh hh hh
hh hh hh hh hh hh
Hh
Hh Hh
Hh Hh Hh
cces2014
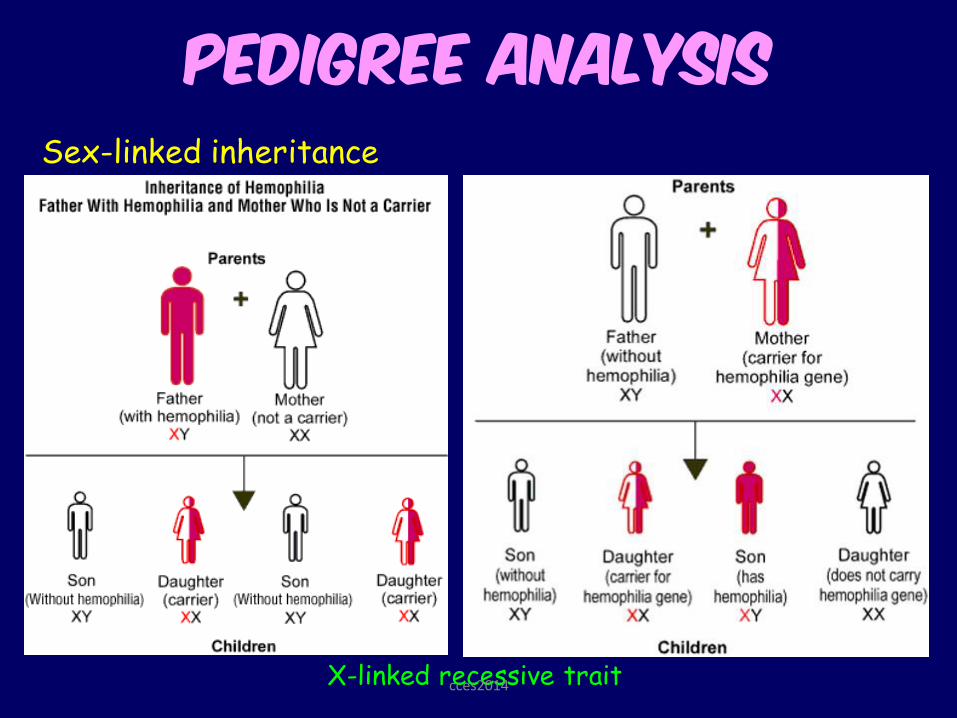
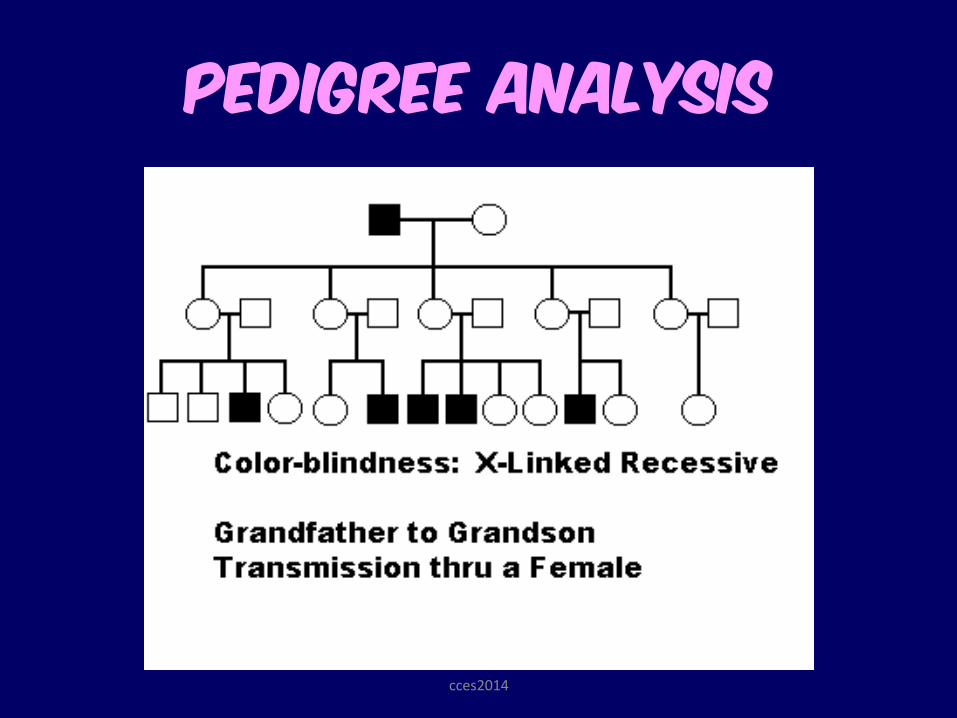
Pedigree analysis
X-linked recessive trait
Sex-linked inheritance
cces2014
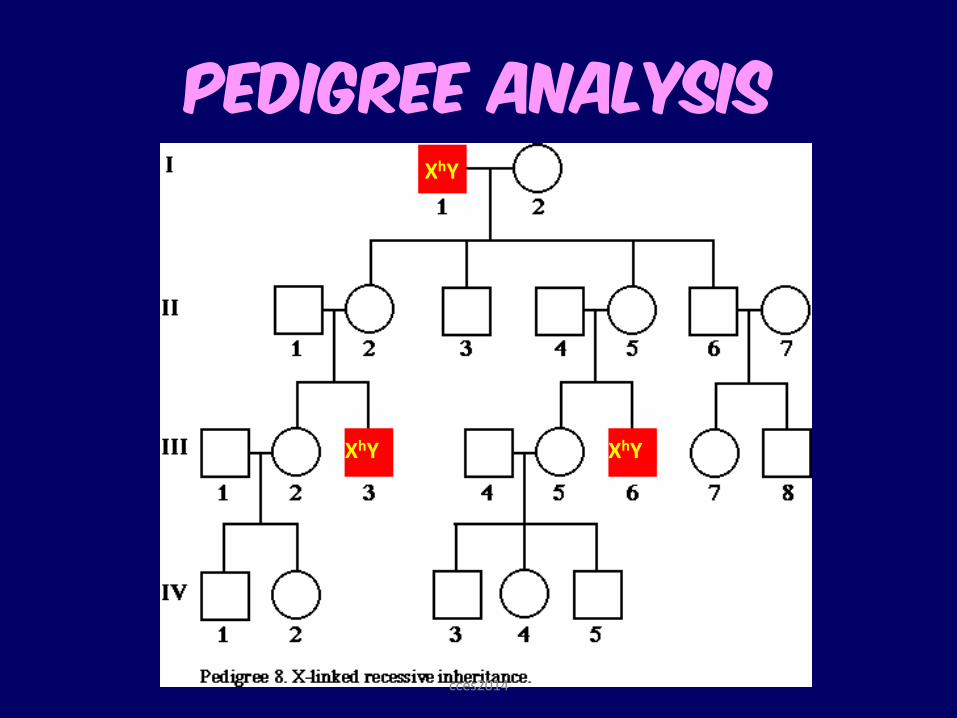
Pedigree analysis XhY
XhY XhY
cces2014
Pedigree analysis
cces2014
Pedigree analysis
cces2014
Pedigree analysis Sex-linked inheritance
cces2014
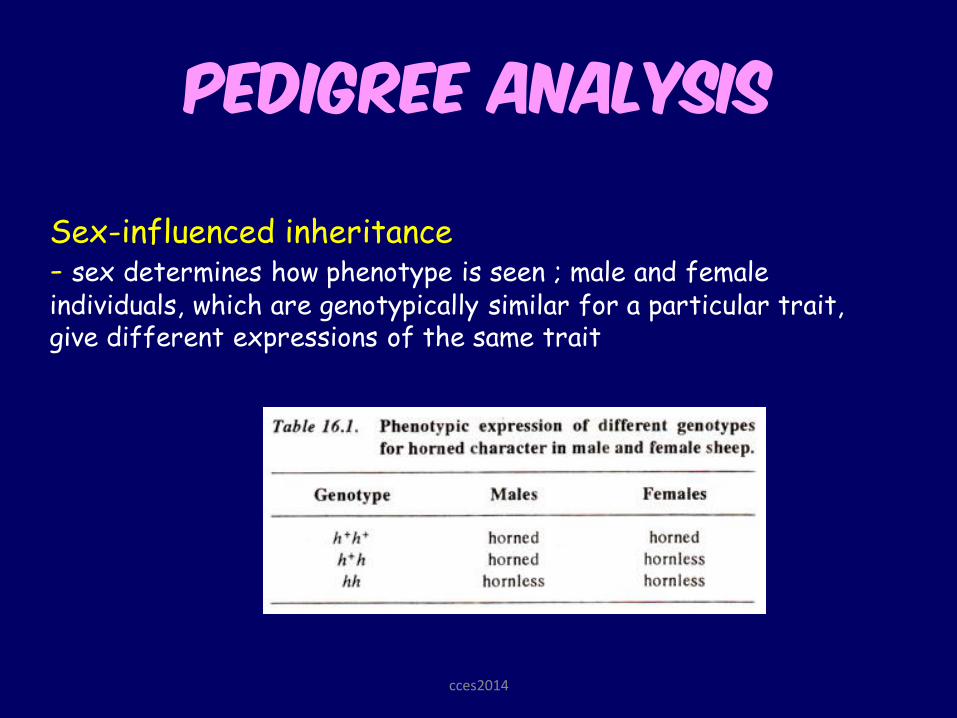
Pedigree analysis
Sex-influenced inheritance - sex determines how phenotype is seen ; male and female individuals, which are genotypically similar for a particular trait, give different expressions of the same trait
cces2014
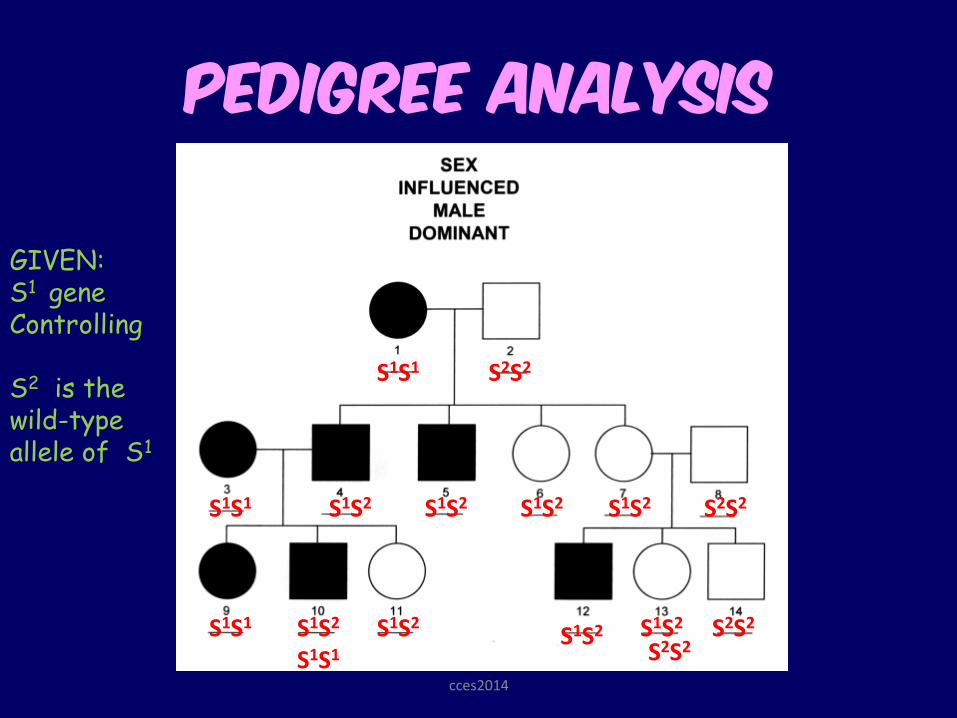
Pedigree analysis
S2S2 S1S1
S1S2 S1S2 S1S2
S1S2
S1S1
S1S1 S1S2
S1S2 S2S2
S2S2 S1S2 S1S2
S1S1 S2S2
GIVEN: S1 gene Controlling S2 is the wild-type allele of S1
cces2014
Probability and Statistical Testing
cces2014
PROBABILITY & TESTING
Basic rules of Probability in solving genetics problems:
Rule of Multiplication
Rule of Addition
cces2014
PROBABILITY & TESTING
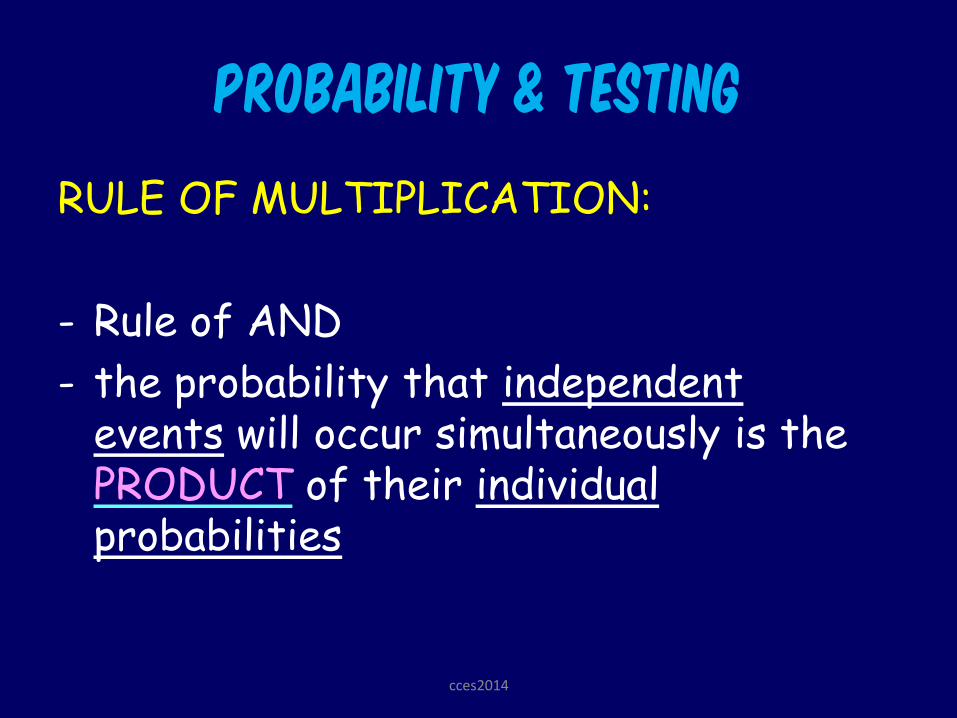
RULE OF MULTIPLICATION:
- Rule of AND
- the probability that independent events will occur simultaneously is the PRODUCT of their individual probabilities
cces2014
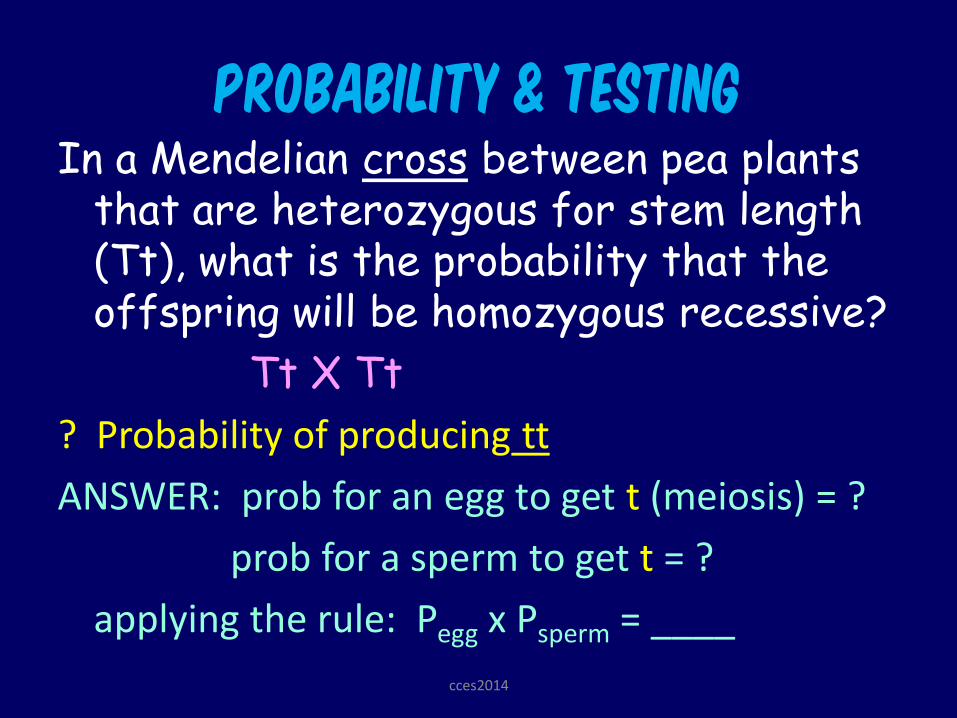
PROBABILITY & TESTING In a Mendelian cross between pea plants
that are heterozygous for stem length (Tt), what is the probability that the offspring will be homozygous recessive?
Tt X Tt
? Probability of producing tt
ANSWER: prob for an egg to get t (meiosis) = ?
prob for a sperm to get t = ?
applying the rule: Pegg x Psperm = ____
cces2014
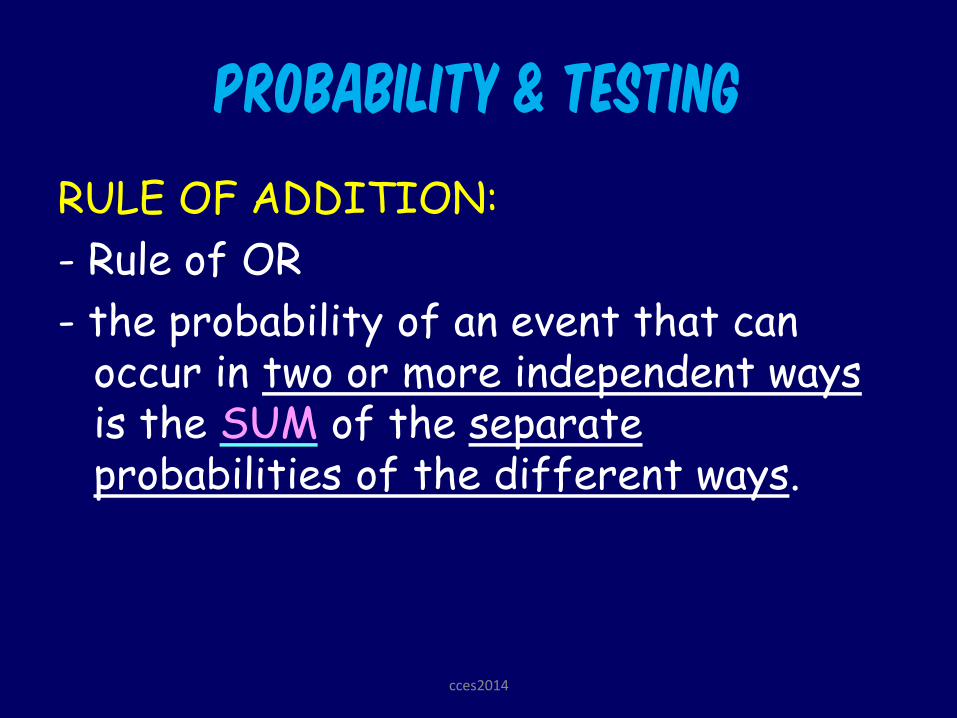
PROBABILITY & TESTING
RULE OF ADDITION:
- Rule of OR
- the probability of an event that can occur in two or more independent ways is the SUM of the separate probabilities of the different ways.
cces2014
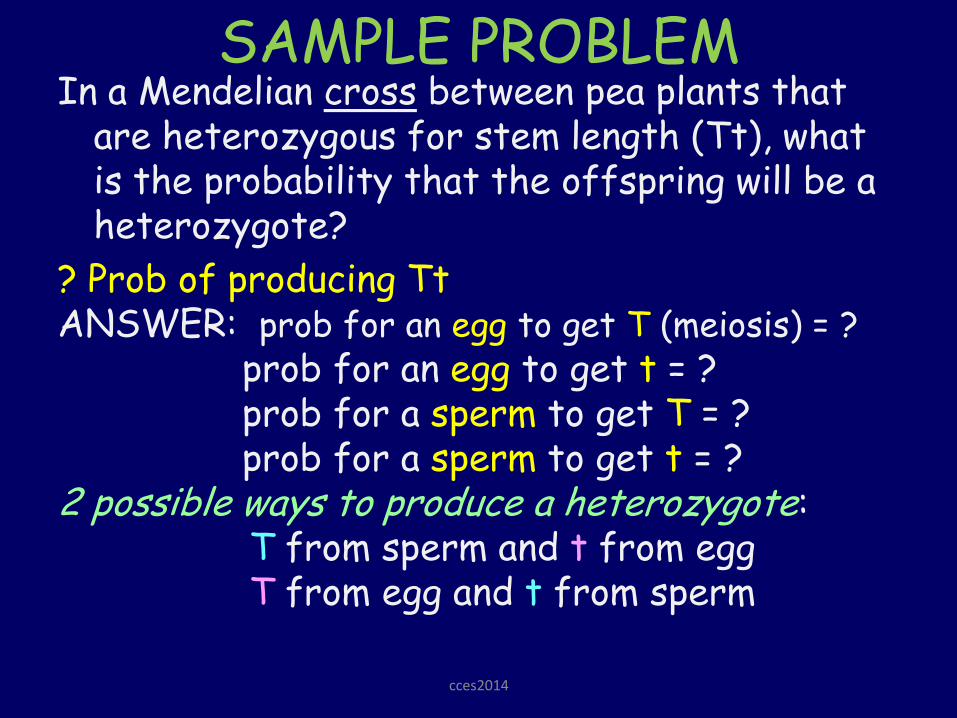
SAMPLE PROBLEM In a Mendelian cross between pea plants that
are heterozygous for stem length (Tt), what is the probability that the offspring will be a heterozygote?
? Prob of producing Tt ANSWER: prob for an egg to get T (meiosis) = ? prob for an egg to get t = ? prob for a sperm to get T = ? prob for a sperm to get t = ? 2 possible ways to produce a heterozygote: T from sperm and t from egg T from egg and t from sperm
cces2014
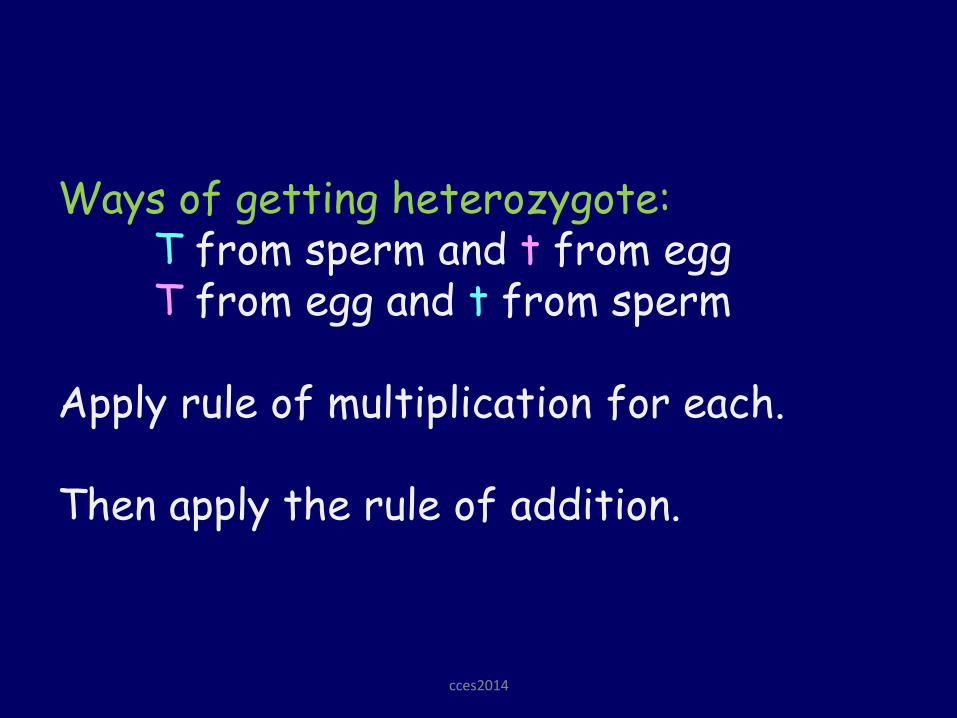
Ways of getting heterozygote: T from sperm and t from egg T from egg and t from sperm Apply rule of multiplication for each. Then apply the rule of addition.
cces2014
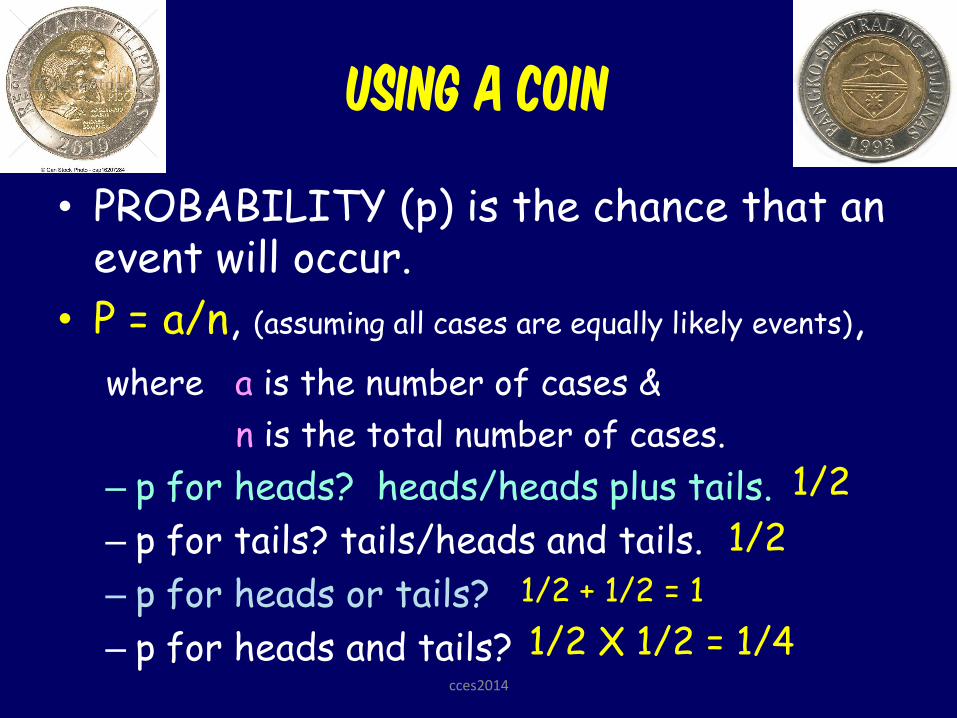
Using a COIN
• PROBABILITY (p) is the chance that an event will occur.
• P = a/n, (assuming all cases are equally likely events),
where a is the number of cases &
n is the total number of cases.
– p for heads? heads/heads plus tails.
– p for tails? tails/heads and tails.
– p for heads or tails?
– p for heads and tails?
1/2
1/2
1/2 + 1/2 = 1
1/2 X 1/2 = 1/4 cces2014
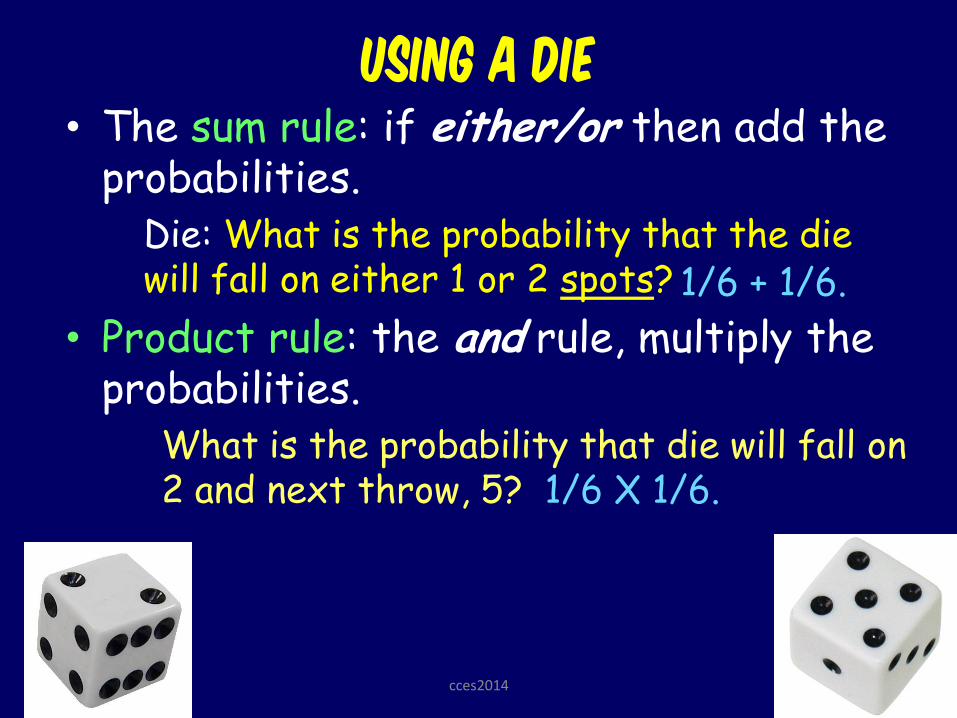
Using a DIE
• The sum rule: if either/or then add the probabilities. Die: What is the probability that the die
will fall on either 1 or 2 spots?
• Product rule: the and rule, multiply the probabilities.
What is the probability that die will fall on 2 and next throw, 5?
1/6 + 1/6.
1/6 X 1/6.
cces2014
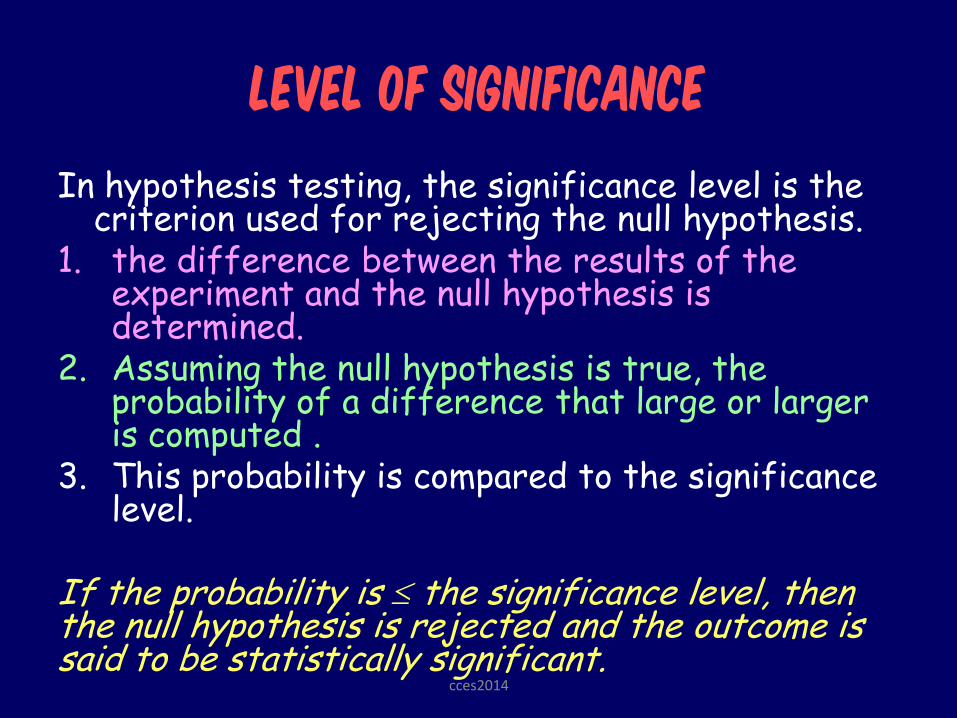
LEVEL OF SIGNIFICANCE
In hypothesis testing, the significance level is the criterion used for rejecting the null hypothesis.
1. the difference between the results of the experiment and the null hypothesis is determined.
2. Assuming the null hypothesis is true, the probability of a difference that large or larger is computed .
3. This probability is compared to the significance level.
If the probability is the significance level, then the null hypothesis is rejected and the outcome is said to be statistically significant.
cces2014
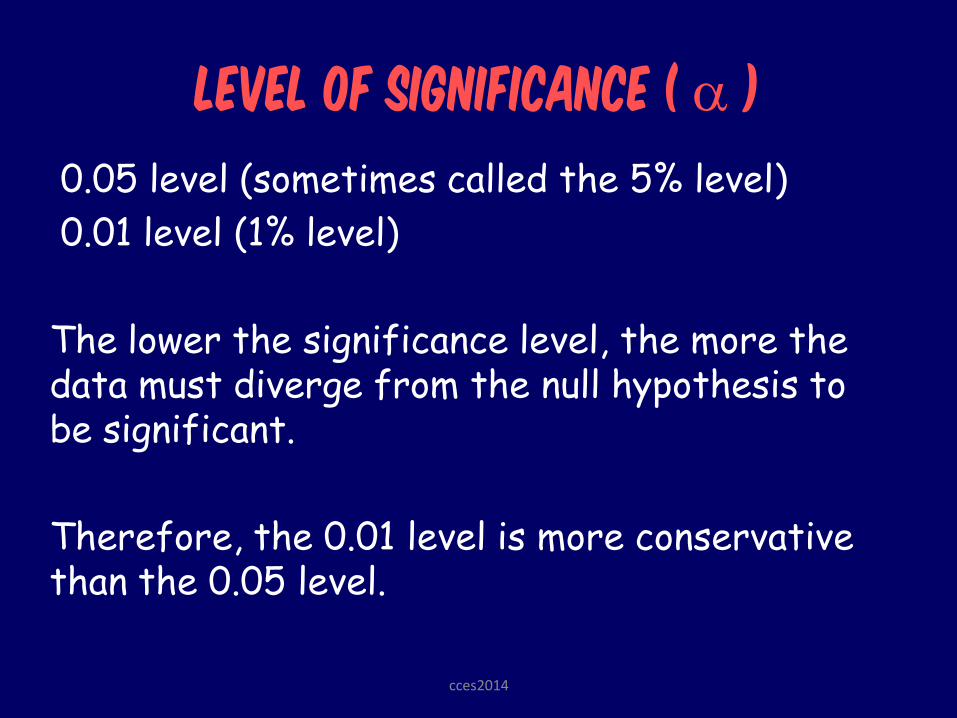
LEVEL OF SIGNIFICANCE ( )
0.05 level (sometimes called the 5% level)
0.01 level (1% level)
The lower the significance level, the more the data must diverge from the null hypothesis to be significant.
Therefore, the 0.01 level is more conservative than the 0.05 level.
cces2014
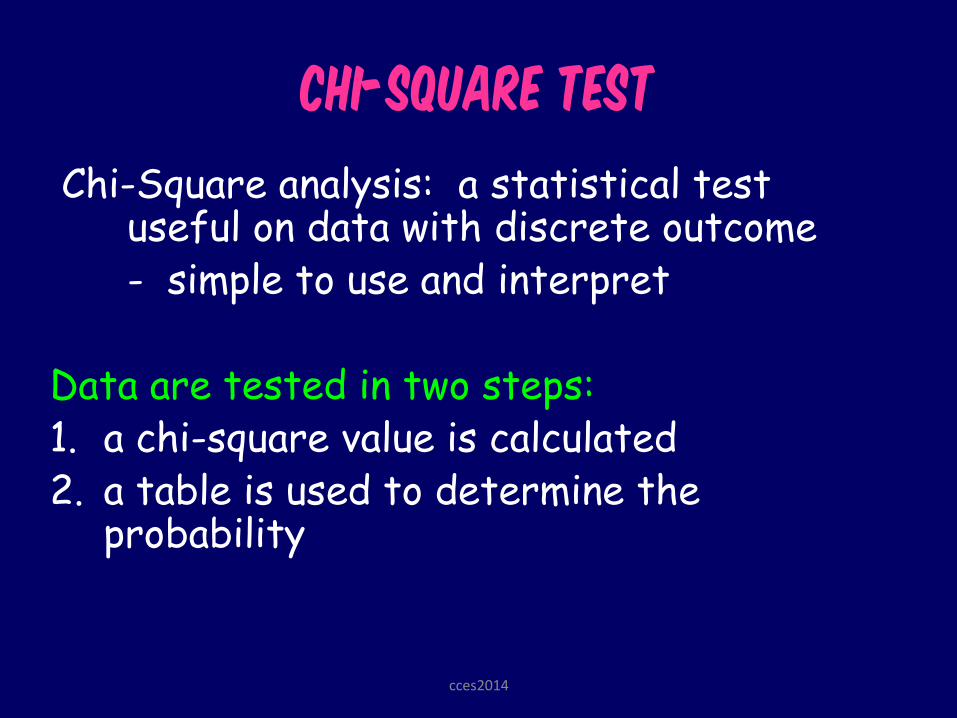
Chi-Square test
Chi-Square analysis: a statistical test useful on data with discrete outcome
- simple to use and interpret Data are tested in two steps: 1. a chi-square value is calculated 2. a table is used to determine the
probability
cces2014
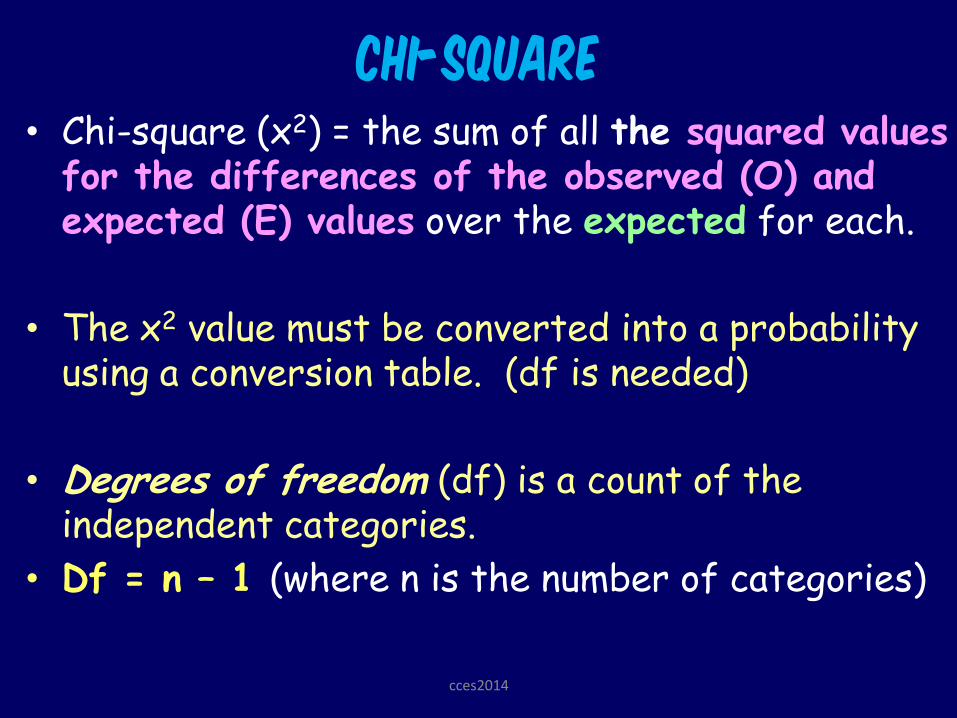
Chi-Square • Chi-square (x2) = the sum of all the squared values
for the differences of the observed (O) and expected (E) values over the expected for each.
• The x2 value must be converted into a probability using a conversion table. (df is needed)
• Degrees of freedom (df) is a count of the independent categories.
• Df = n – 1 (where n is the number of categories)
cces2014

Chi-Square
• Remember that when using statistics you will be testing your hypothesis. Therefore, the number of categories will be determined from your hypothesis, not from the number of categories you observe.
Example:
The expected phenotypic ratio of the outcome is 1:2:1.
How many categories are there?
Degrees of freedom?
cces2014
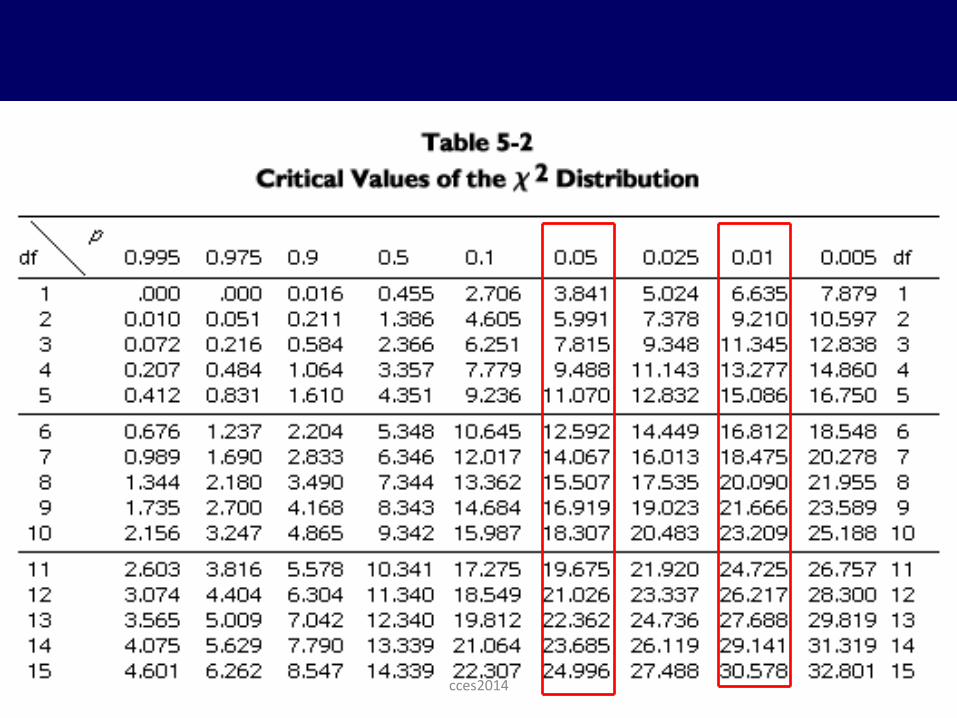
Chi-Square
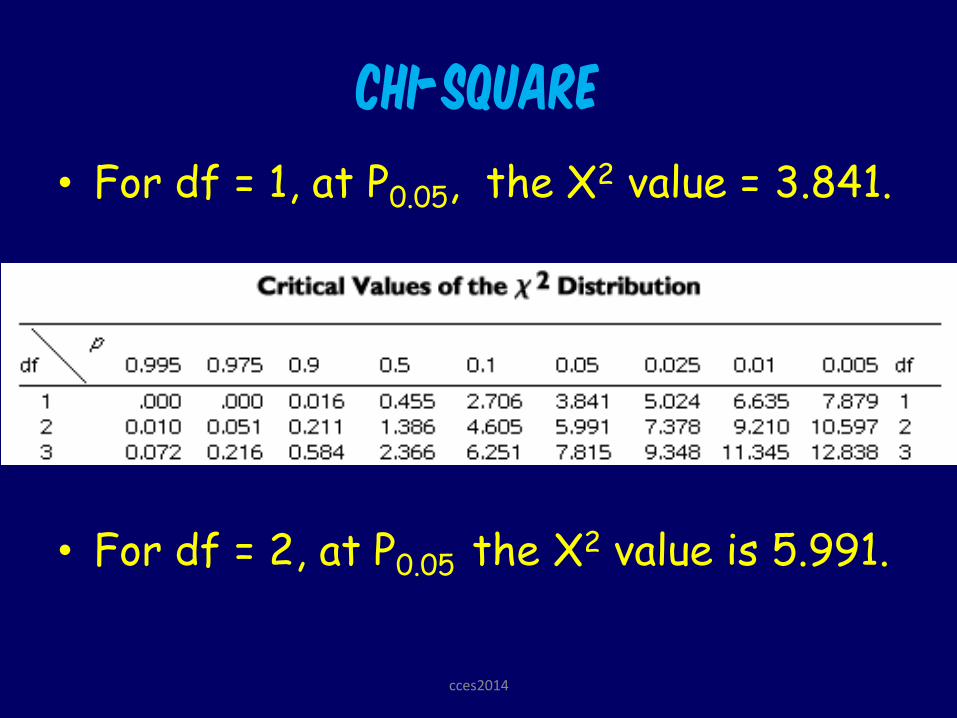
• For df = 1, at P0.05, the X2 value = 3.841.
• For df = 2, at P0.05 the X2 value is 5.991.
cces2014
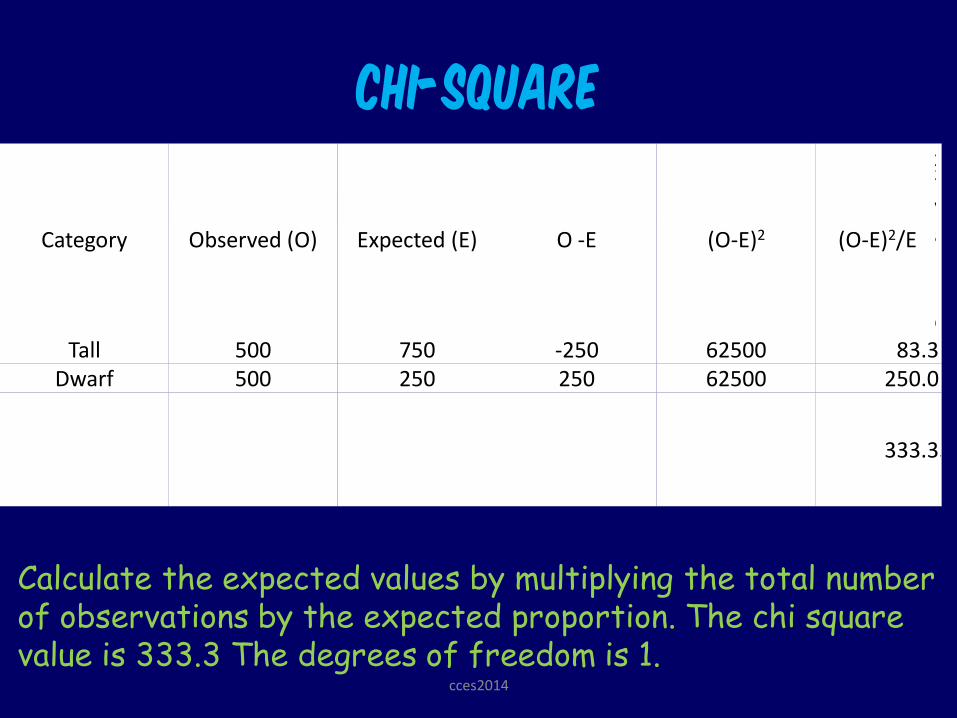
Chi-Square
Chi-Square Analysis of a Mono-hybrid Cross Category Observed (O) Expected (E) O -E (O-E)2 (O-E)2/E
x2
value
Tall 500 750 -250 62500 83.3 Dwarf 500 250 250 62500 250.0
333.3 3
Calculate the expected values by multiplying the total number of observations by the expected proportion. The chi square value is 333.3 The degrees of freedom is 1.
cces2014
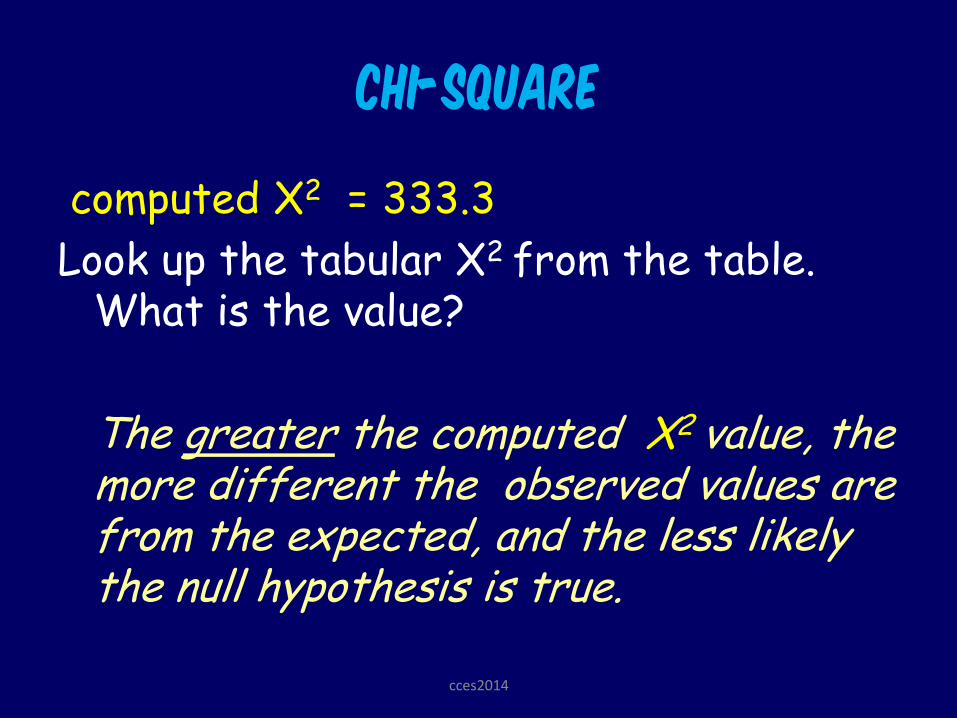
Chi-Square
computed X2 = 333.3
Look up the tabular X2 from the table. What is the value?
The greater the computed X2 value, the more different the observed values are from the expected, and the less likely the null hypothesis is true.
cces2014
cces2014
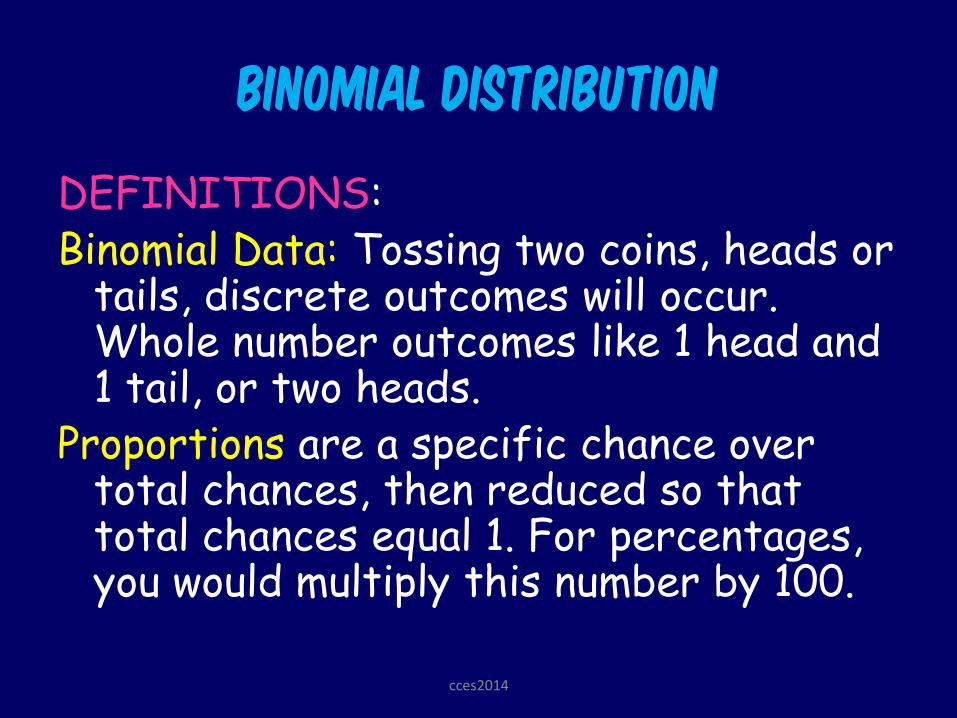
BINOMIAL DISTRIBUTION
DEFINITIONS: Binomial Data: Tossing two coins, heads or
tails, discrete outcomes will occur. Whole number outcomes like 1 head and 1 tail, or two heads.
Proportions are a specific chance over total chances, then reduced so that total chances equal 1. For percentages, you would multiply this number by 100.
cces2014
BINOMIAL DISTRIBUTION
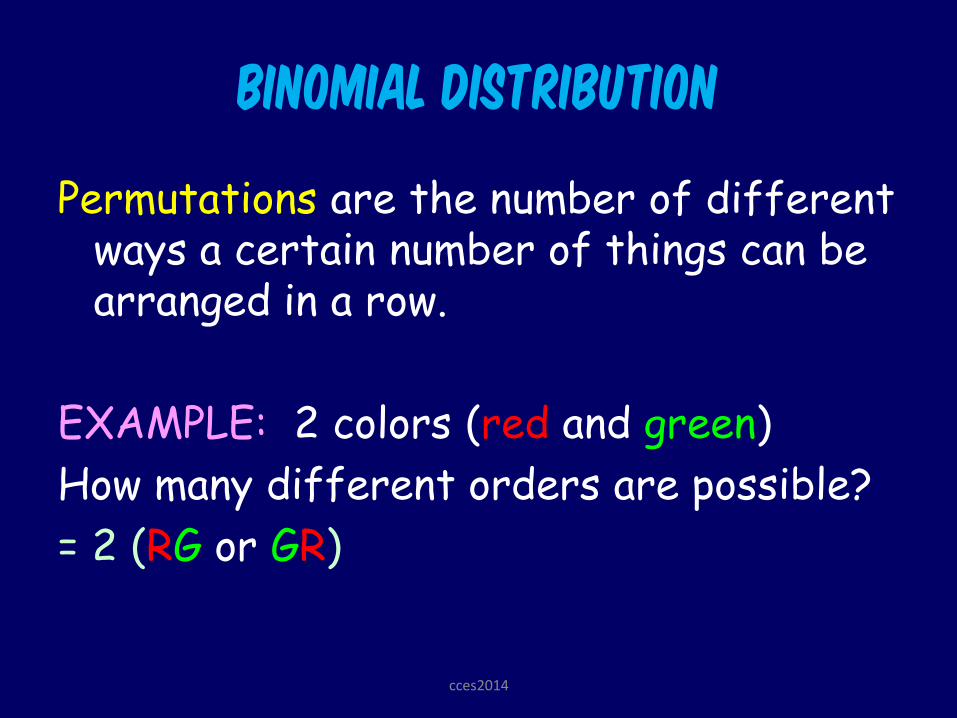
Permutations are the number of different ways a certain number of things can be arranged in a row.
EXAMPLE: 2 colors (red and green)
How many different orders are possible?
= 2 (RG or GR)
cces2014
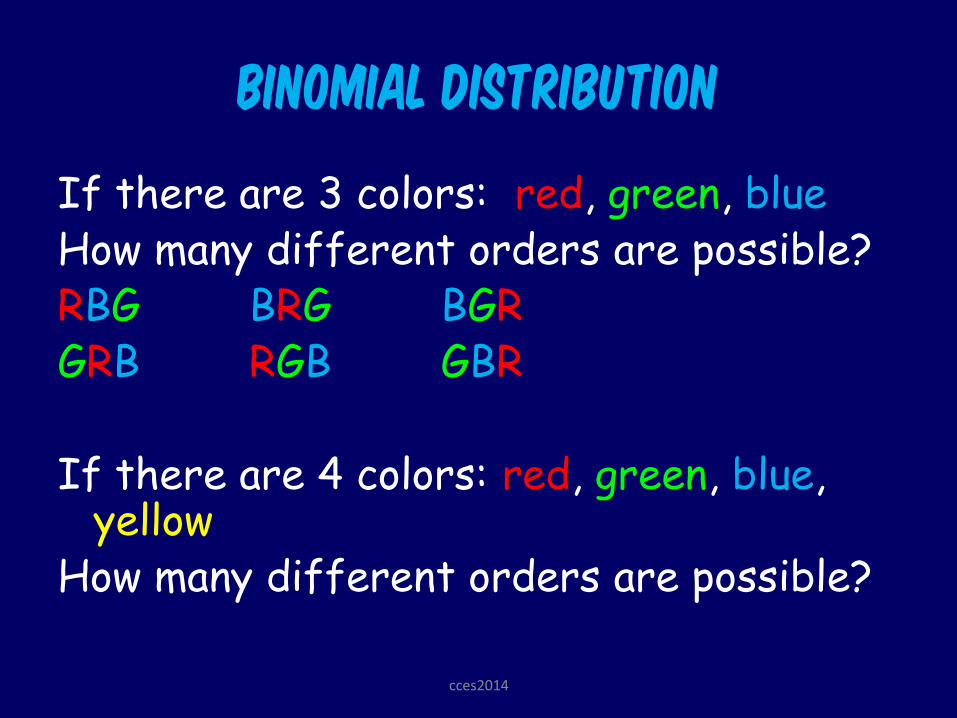
BINOMIAL DISTRIBUTION
If there are 3 colors: red, green, blue How many different orders are possible? RBG BRG BGR GRB RGB GBR If there are 4 colors: red, green, blue,
yellow How many different orders are possible?
cces2014
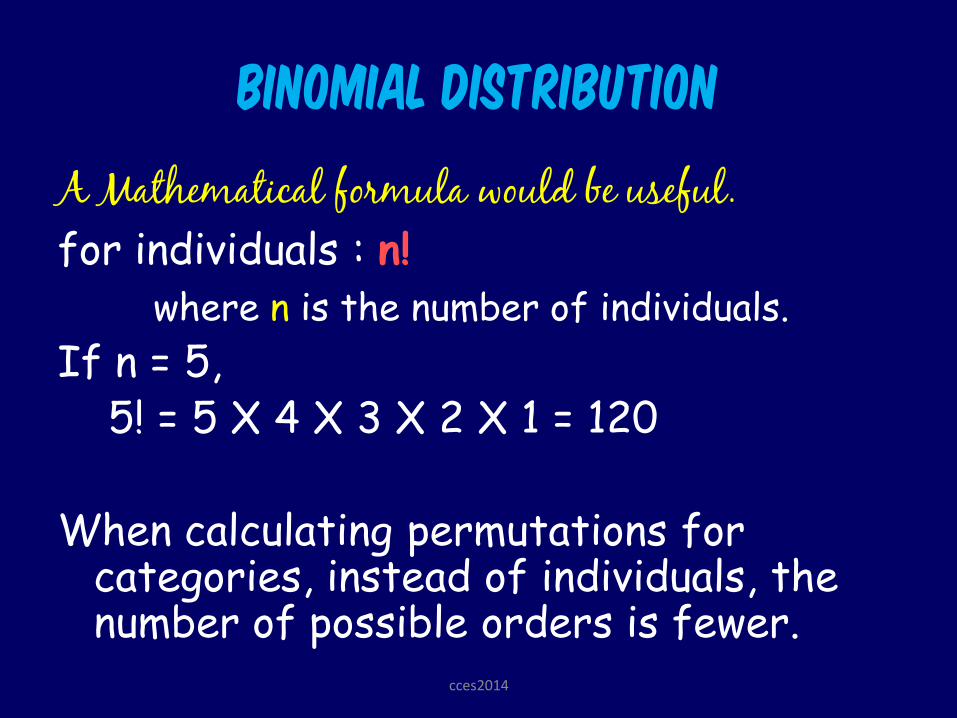
BINOMIAL DISTRIBUTION
A Mathematical formula would be useful.
for individuals : n! where n is the number of individuals. If n = 5, 5! = 5 X 4 X 3 X 2 X 1 = 120 When calculating permutations for
categories, instead of individuals, the number of possible orders is fewer.
cces2014
BINOMIAL DISTRIBUTION
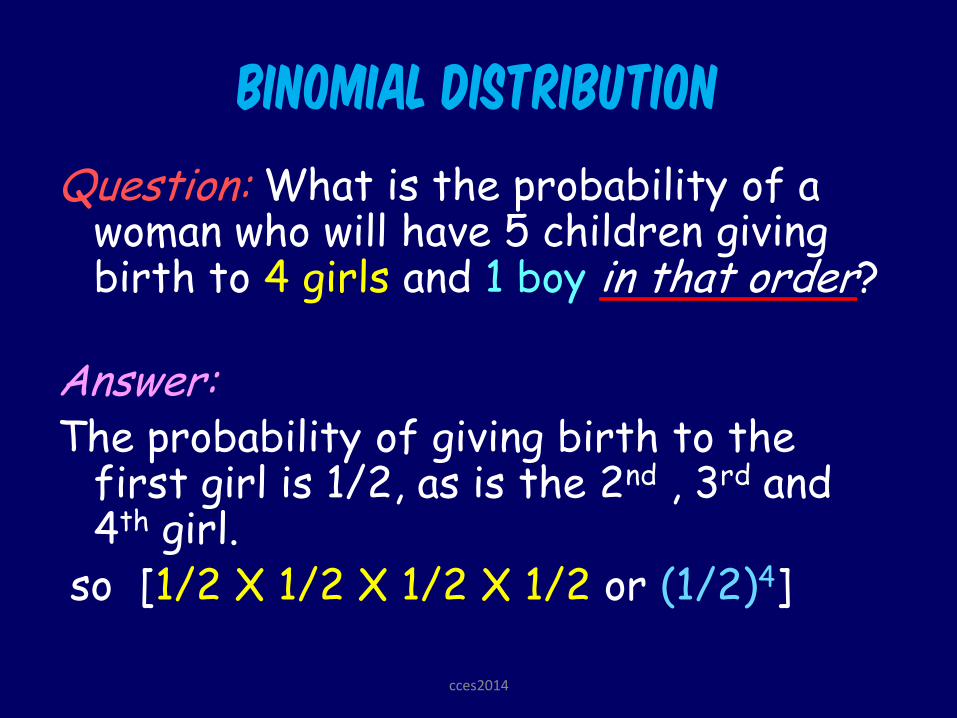
Question: What is the probability of a woman who will have 5 children giving birth to 4 girls and 1 boy in that order?
Answer: The probability of giving birth to the
first girl is 1/2, as is the 2nd , 3rd and 4th girl.
so [1/2 X 1/2 X 1/2 X 1/2 or (1/2)4]
cces2014
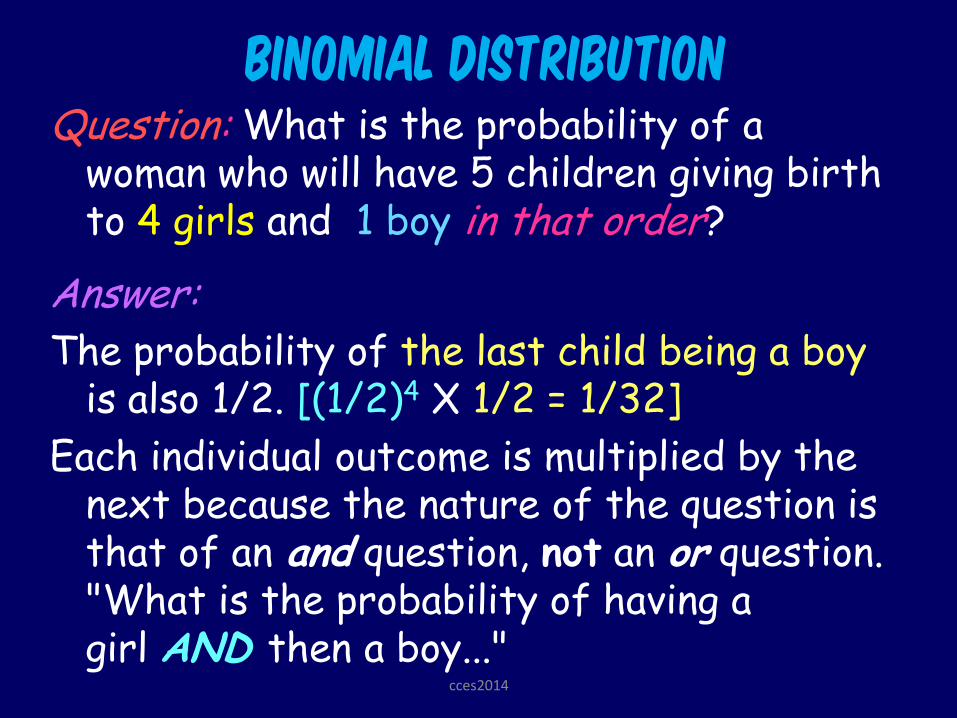
BINOMIAL DISTRIBUTION Question: What is the probability of a
woman who will have 5 children giving birth to 4 girls and 1 boy in that order?
Answer:
The probability of the last child being a boy is also 1/2. [(1/2)4 X 1/2 = 1/32]
Each individual outcome is multiplied by the next because the nature of the question is that of an and question, not an or question. "What is the probability of having a girl AND then a boy..."
cces2014
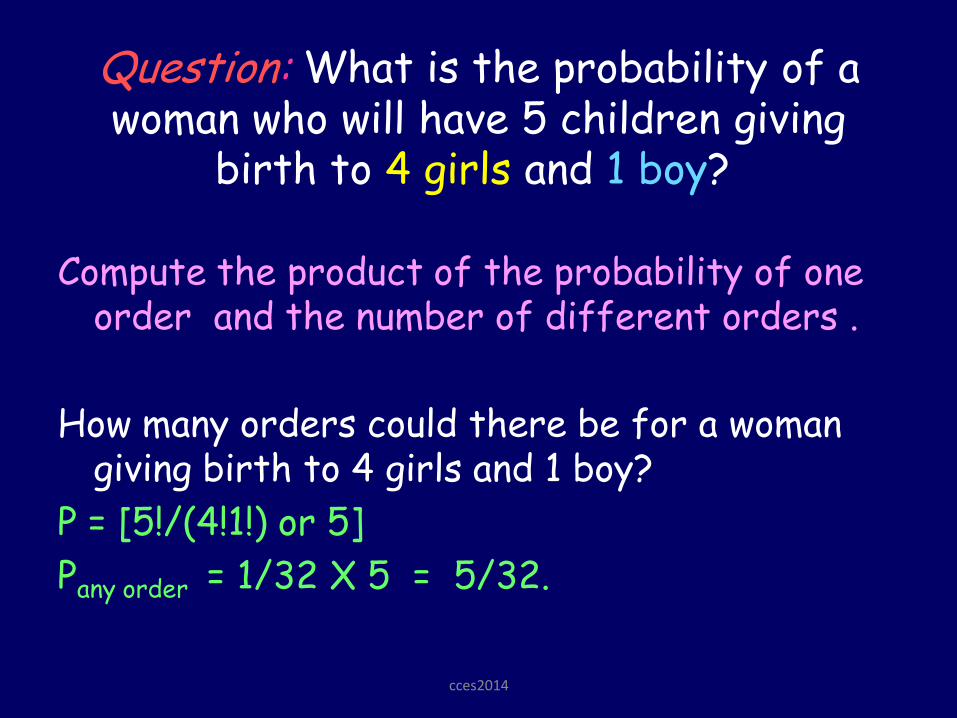
Question: What is the probability of a woman who will have 5 children giving
birth to 4 girls and 1 boy?
Compute the product of the probability of one order and the number of different orders .
How many orders could there be for a woman giving birth to 4 girls and 1 boy?
P = [5!/(4!1!) or 5]
Pany order = 1/32 X 5 = 5/32.
cces2014
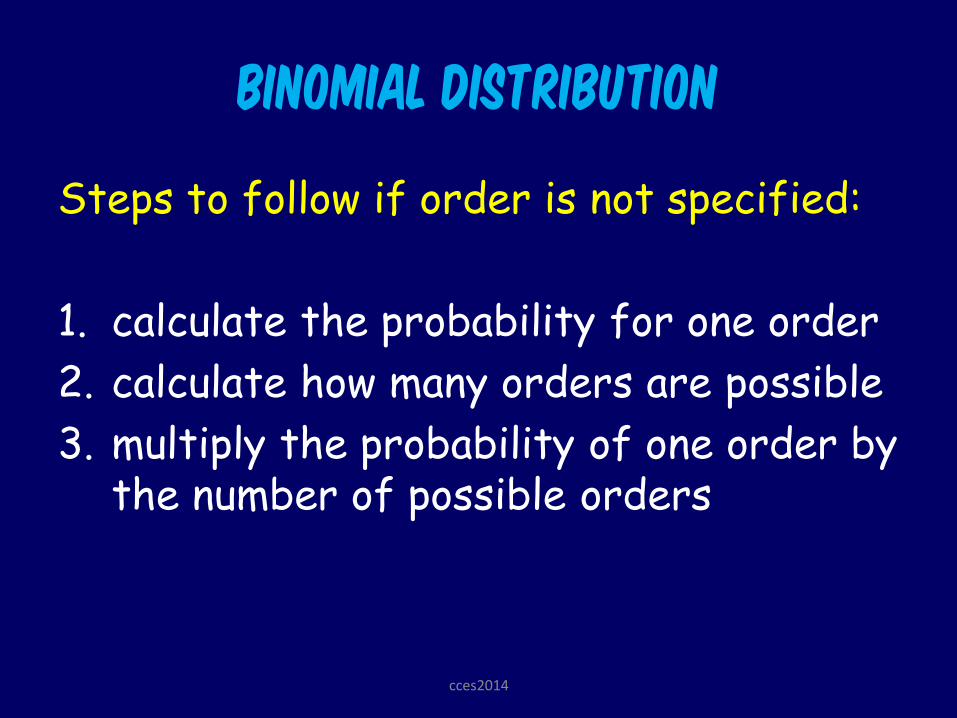
BINOMIAL DISTRIBUTION
Steps to follow if order is not specified:
1. calculate the probability for one order
2. calculate how many orders are possible
3. multiply the probability of one order by the number of possible orders
cces2014
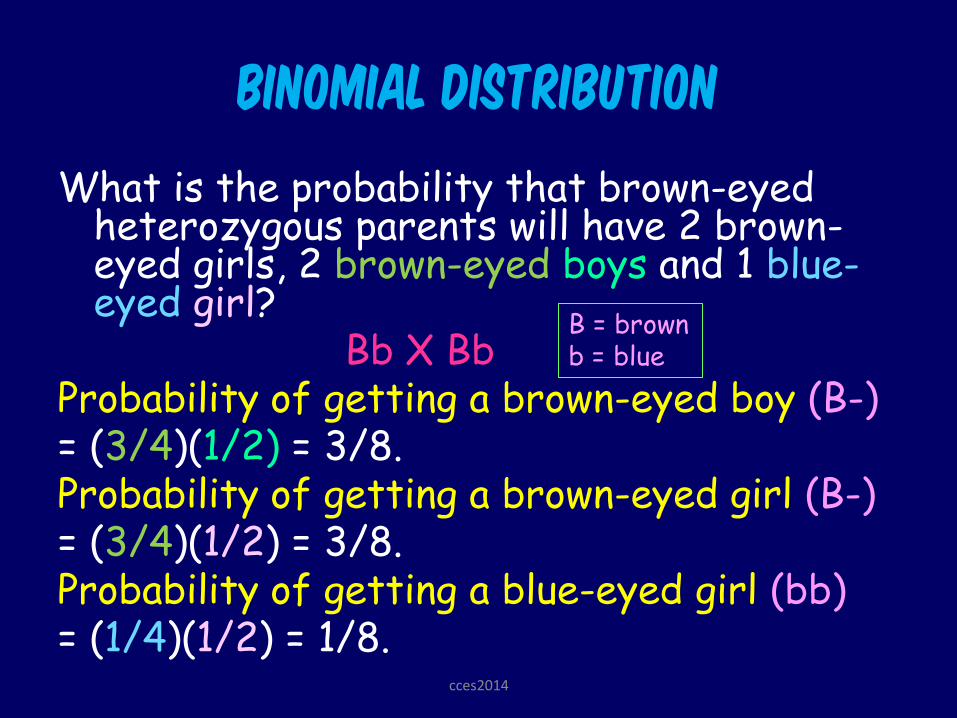
BINOMIAL DISTRIBUTION
What is the probability that brown-eyed heterozygous parents will have 2 brown- eyed girls, 2 brown-eyed boys and 1 blue- eyed girl?
Bb X Bb Probability of getting a brown-eyed boy (B-) = (3/4)(1/2) = 3/8. Probability of getting a brown-eyed girl (B-) = (3/4)(1/2) = 3/8. Probability of getting a blue-eyed girl (bb) = (1/4)(1/2) = 1/8.
B = brown b = blue
cces2014
BINOMIAL DISTRIBUTION
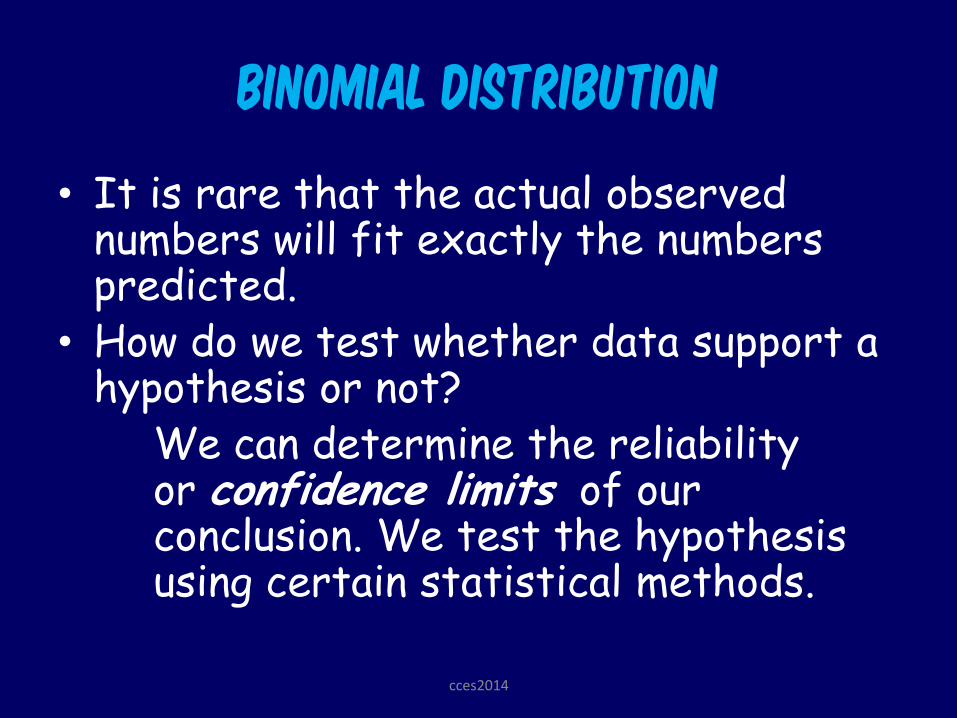
• It is rare that the actual observed numbers will fit exactly the numbers predicted.
• How do we test whether data support a hypothesis or not?
We can determine the reliability or confidence limits of our conclusion. We test the hypothesis using certain statistical methods.
cces2014
BINOMIAL DISTRIBUTION
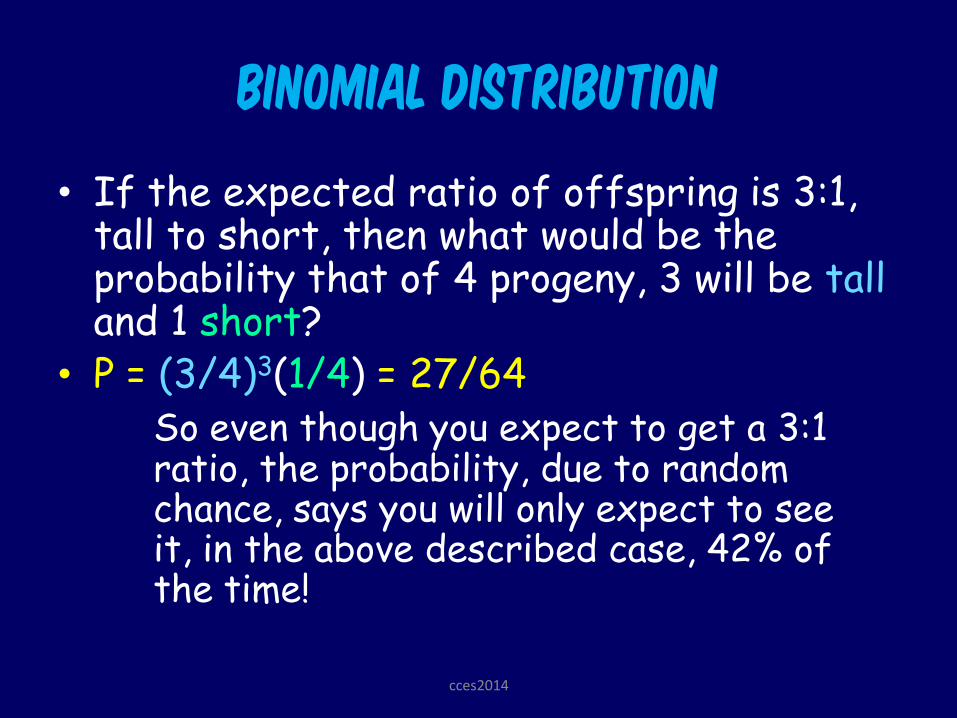
• If the expected ratio of offspring is 3:1, tall to short, then what would be the probability that of 4 progeny, 3 will be tall and 1 short?
• P = (3/4)3(1/4) = 27/64 So even though you expect to get a 3:1
ratio, the probability, due to random chance, says you will only expect to see it, in the above described case, 42% of the time!
cces2014
BINOMIAL DISTRIBUTION
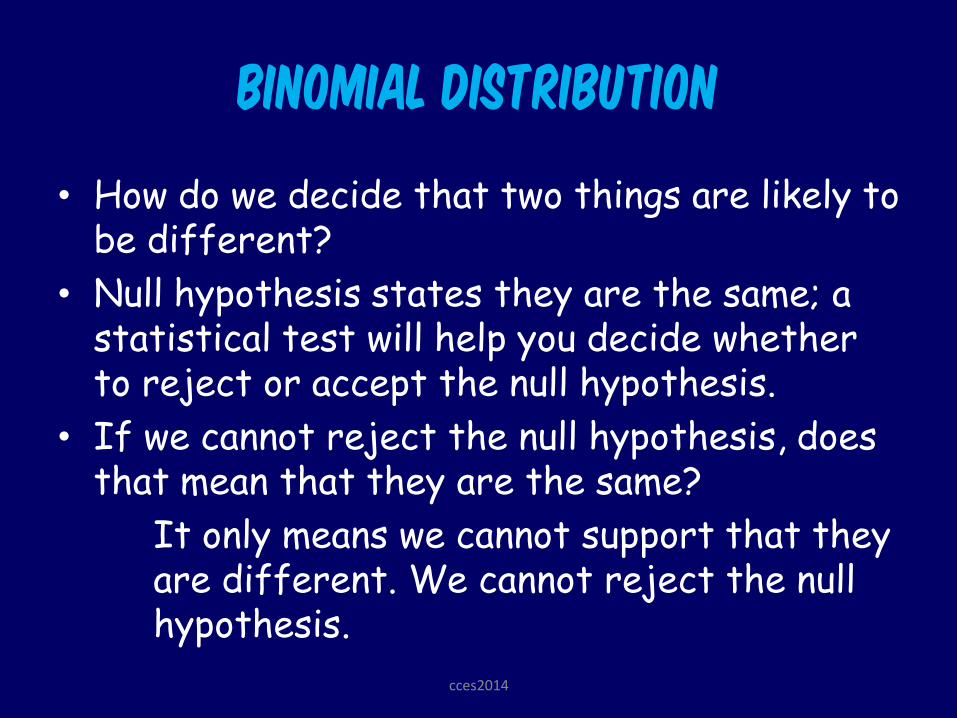
• How do we decide that two things are likely to be different?
• Null hypothesis states they are the same; a statistical test will help you decide whether to reject or accept the null hypothesis.
• If we cannot reject the null hypothesis, does that mean that they are the same?
It only means we cannot support that they are different. We cannot reject the null hypothesis.
cces2014
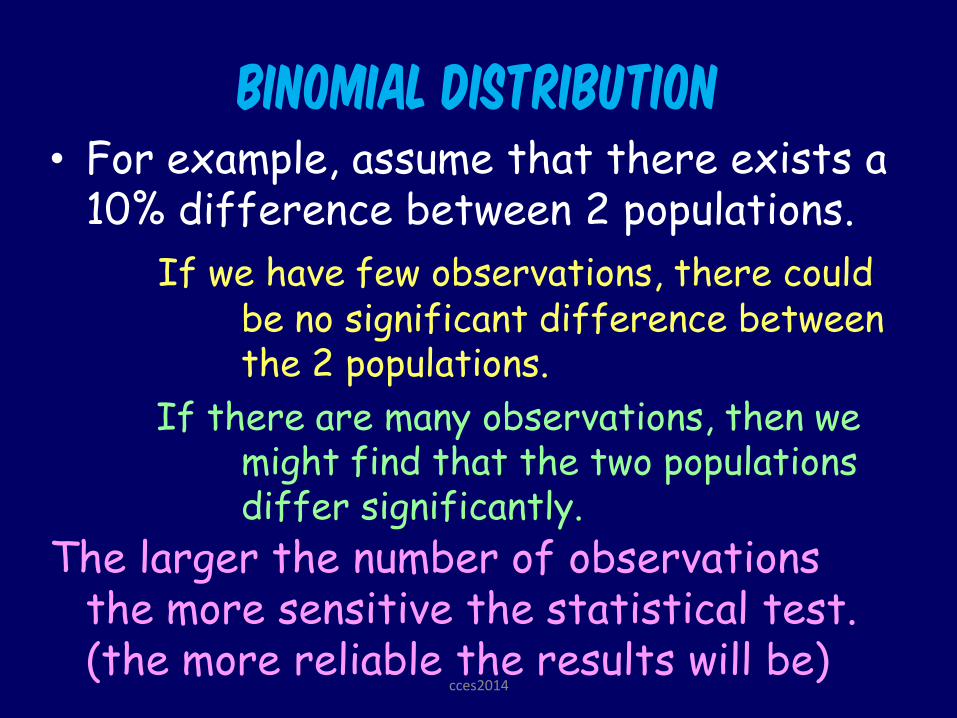
BINOMIAL DISTRIBUTION • For example, assume that there exists a
10% difference between 2 populations.
If we have few observations, there could be no significant difference between the 2 populations.
If there are many observations, then we might find that the two populations differ significantly.
The larger the number of observations the more sensitive the statistical test. (the more reliable the results will be)
cces2014