Embed Size (px)
Citation preview

Government pol icy in f ie ld of
agr icul tura l export promot ion in
Ukra ine
Volodymyr Pugachov
NSC “Institute of agrarian economics”
25th of May 2016

Main research objectives
- analysis of the most significant changes in agricultural export and
government interventions influence on export performance in Ukraine;
- detection of the main factors affecting export and prognosis, using flexible
neural models, on export performance under various circumstances
influence;
- elaboration of proposals to Government Target Program “Agricultural
sector development till 2020” in terms of export promotion.

Data sources
- State Statistics Service of Ukraine;http://www.ukrstat.gov.ua/
- Ministry of Agrarian Policy and Food of Ukraine;http://minagro.gov.ua/
- State Fiscal Service of Ukraine;http://sfs.gov.ua/
- other statistical bodies.

Foreign trade of Ukrainian agricultural products, billion $
0.0
2.0
4.0
6.0
8.0
10.0
12.0
14.0
16.0
18.0
20.0
2005 2009 2010 2011 2012 2013 2014 2015
4.6
9.810.2
13.1
18.2
17.3 17.0
14.8
2.9
5.2
6.16.7
7.98.6
6.4
3.7
1.7
4.64.1
6.4
10.3
8.7
10.611.1
Export Import Balance

Share of agriculture in overall Ukrainian goods foreign trade
46.2
76.9
42.039.538.2
26.8
Export Import2013 2014 2015 2013 2014 2015
27.4%
31.5%
38.7%11.2% 12.2% 10.3%
all goods, billion $
share of agriculture
Place of Ukraine in The World by export of some agricultural products
1st placesunflower oil
3rd placecorn
4th placebarley
6th placewheat
7th placesoybeans
8th placepoultry

Commodity structure of Ukrainian agricultural products
foreign trade balance in 2015, million $
3 026.5
2 899.6
2 237.7
801.6
786.5
767.5
550.5
201.6
189.5
109.0
1 943.5
-85.4
-92.3
-94.9
-99.5
-123.6
-128.1
-128.7
-197.5
-200.0
-263.5
-1 078.9
Sunflower oil
Corn
Wheat
Soybeans
Oil-cake
Barley
Rapeseeds
Cigarettes
Meat and poultry
Rapeseed oil
Other goods
Coffee
Sunflower seeds
Palm oil
Extracts and essences
Bananas
Products for animal feed
Other food products
Frozen fish
Citrus
Raw tobacco
Other goods

Geographical structure of Ukrainian agricultural
products export in 2015
Asia – 46.6%(6 884.8 million $)
includingChina – 1.24 billion $India – 1.08 billion $
Turkey – 761.7 million $
EU – 28.2%(4 174.2 million $)
includingSpain – 855.6 million $Italy – 586.5 million $
Netherlands – 580.1 million $
Africa – 13.6%(2 006.7 million $)
includingEgypt – 1.02 billion $
Tunisia – 247.3 million $
CIS – 10.2%(1 507.4 million $)
includingBelarus – 395.2 million $Russia – 310.4 million $
Kazakhstan – 239.4 million $
North and South America – 0.8%(121.2 million $)
includingMexico – 58.1 million $
USA – 43.2 million $
other countries – 0.6%(87.0 million $)

Dynamics of Ukrainian agricultural products
foreign trade balance with EU, million $1
55
3.3 2
07
6.1
3 5
07
.8
2 2
50
.7
2 1
24
.1
3 4
02
.8
4 9
91
.6
4 7
56
.0
4 7
30
.9
4 1
74
.2
1 2
90
.6
1 5
71
.0
2 6
75
.9
1 9
85
.8
2 3
09
.3
2 6
59
.1 3 0
82
.1
3 3
21
.4
2 6
21
.9
1 6
95
.8
262.7505.1
831.9
264.9
-185.2
743.7
1 909.5
1 434.6
2 109.0
2 478.4
2006 2007 2008 2009 2010 2011 2012 2013 2014 2015
Export Import Balance

4 174.2million $
4 667.0million $
2015 2016(prognosis)
+492.8million $
Impact of DCFTA on Ukraine-EU agricultural trade relations
(flexible neural modeling results)
*optimal scenario

Dynamics of non-tariff measures in the world
Source: WTO. World Trade Report 2012, p. 105.
YearsShare of product lines
under NTM, %
Share of trade value
under NTM, %
1996-2000 0.26 0.29
2001-2004 0.49 0.57
2005-2008 0.53 0.54
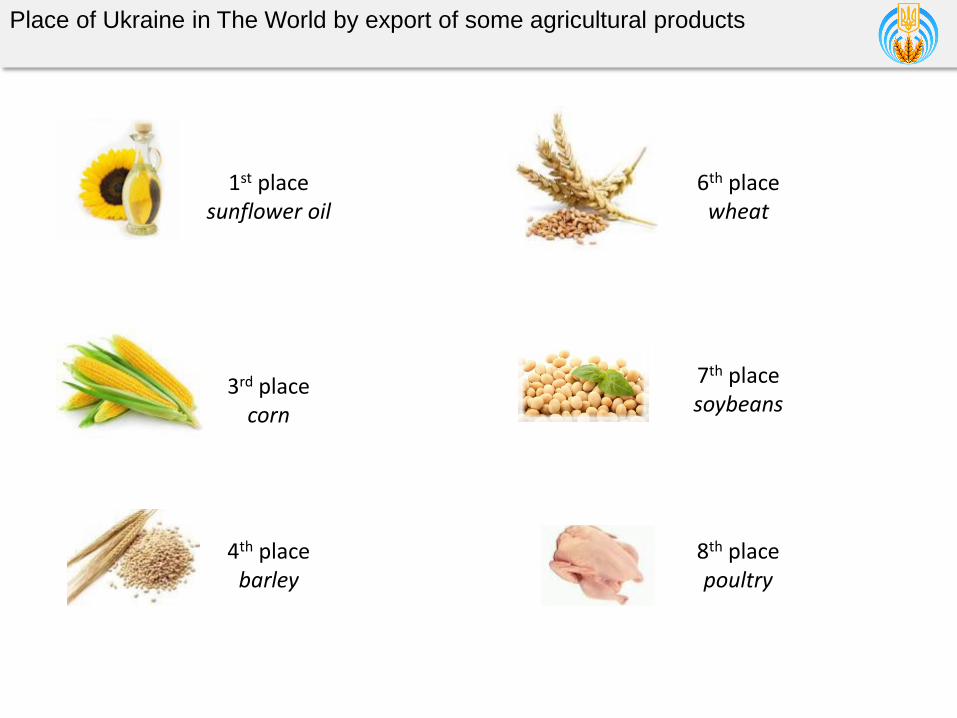
The most problematic factors for export in Ukraine
Source: The Global Enabling Trade Report 2014
Access to trade finance16.0%
Inappropriate production technology and skills
13.7%
Identifying potential markets and buyers
13.6%
Technical requirements and standards abroad
11.1%
Access to imported inputs at competitive prices
9.4%
Difficulties in meeting quality/quantity requirements of
buyers7.5%
Burdensome procedures at foreign borders
6.4%
Tariff barriers abroad4.8%
High cost or delays caused by domestic transportation
4.8%
Corruption at foreign borders4.7%
Rules of origin requirements abroad
4.5%
High cost or delays caused by international transportation
3.7%

Doing Business 2016. Trading across borders
Source: Doing Business 2016
Indicator Ukraine Germany Poland
Overall rank 83 15 25
Trading across borders rank 109 35 1
Documents to export (number) 11 4 4
Time to export: border compliance (hours) 26 36 0
Time to export: document compliance (hours) 96 1 1
Domestic transport (hours) 5 3 14
Cost to export: border compliance, $ 75 345 0
Cost to export: document compliance, $ 292 45 0
Domestic transport, $ 300 500 1 000

Logistics performance index, 2014
Source: http://lpi.worldbank.org/
Country LPI InfrastructureLogistics
competenceTracking &
tracingTimeliness
Germany 1 1 3 1 4
Netherlands 2 3 2 6 6
Belgium 3 8 4 4 2
Great Britain 4 6 5 5 7
Singapore 5 2 8 11 9
Sweden 6 9 6 7 8
Norway 7 4 1 31 5
Luxembourg 8 15 14 22 1
USA 9 5 7 2 14
Japan 10 7 11 9 10
Poland 31 46 33 27 15
Ukraine 61 71 72 45 52

Export, evaluation of NTM, 2015
70.0%
85.0%
59.0%
79.0%
27.0%
34.0%
48.0%
31.0%
83.0%
70.0%
84.0%
59.0%
67.0%
83.0%80.0%
2.7
3.2 3.23.3
3.4
3.63.7
3.8 3.83.9 3.9
4.0 4.04.1
4.2
0.0
1.0
2.0
3.0
4.0
5.0
0.0%
10.0%
20.0%
30.0%
40.0%
50.0%
60.0%
70.0%
80.0%
90.0%
Share of entities, that passed procedure Average rating (1-significant problem, 5-no problem)

Possible main principles of Ukrainian
export strategy (also for agriculture)
Clear roles division between State and business
Dialogue and responsibility
Transparency and predictability of policy (both economic and trade)
Compliance with international obligations
Integrated approach to solve the problem
Fiscal responsibility
Market Approach
Expor t S t ra tegyprinciples

Steps, that already have been done by 2015-2016
1) Export Promotion Council was established
main objectives:
- promotion of Ukrainian producers access to new markets;
- assistance in trade problems solution;
- encourage and support of export activities (ex. information support, trade
protection, etc.)
- improvement of legal framework for trade.
2) State Target Program of Agricultural Sector Development till 2020 is on
final stage of elaboration
proposed measures relating to exports:
- creation of special Ukrainian Export Support Centers;
- conduction of market researches;
- target markets identification;
- consulting of agrarian exporters.