Embed Size (px)
Citation preview
#C2Webinar
Presented by:
Dennis McCarthy, BlackbaudElizabeth Nielsen, Feeding AmericaAshley Hansen, Care2
Current Shifts and Tips
in Online Marketing &
Fundraising
Watch the full presentation here: http://hub.am/17FKU9o
#C2Webinar
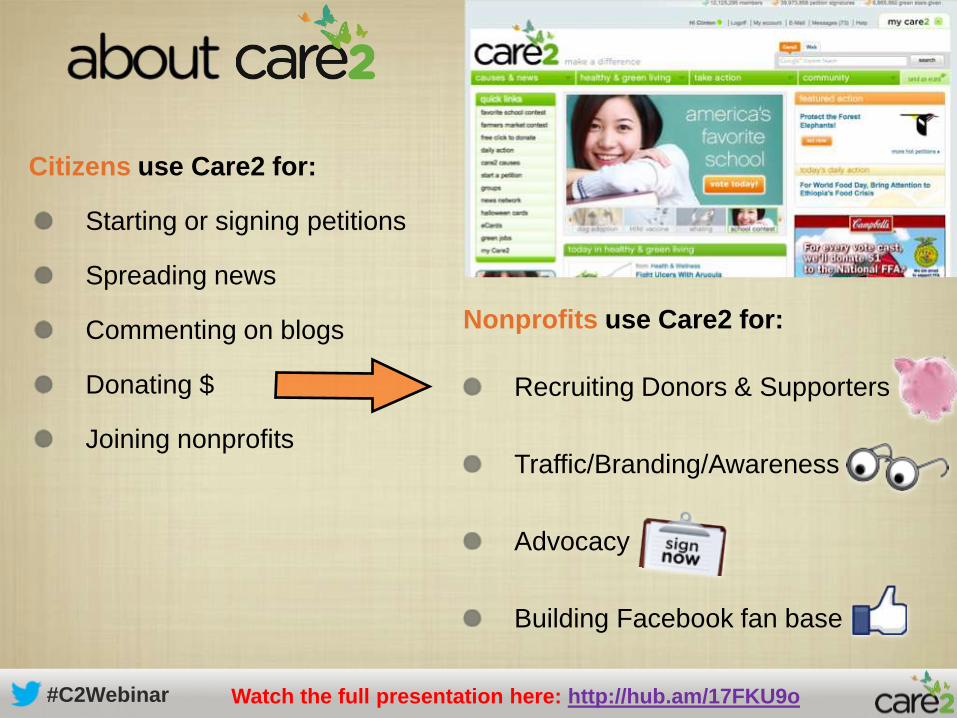
Citizens use Care2 for:
Starting or signing petitions
Spreading news
Commenting on blogs
Donating $
Joining nonprofits
Nonprofits use Care2 for:
Recruiting Donors & Supporters
Traffic/Branding/Awareness
Advocacy
Building Facebook fan base
Watch the full presentation here: http://hub.am/17FKU9o
#C2Webinar
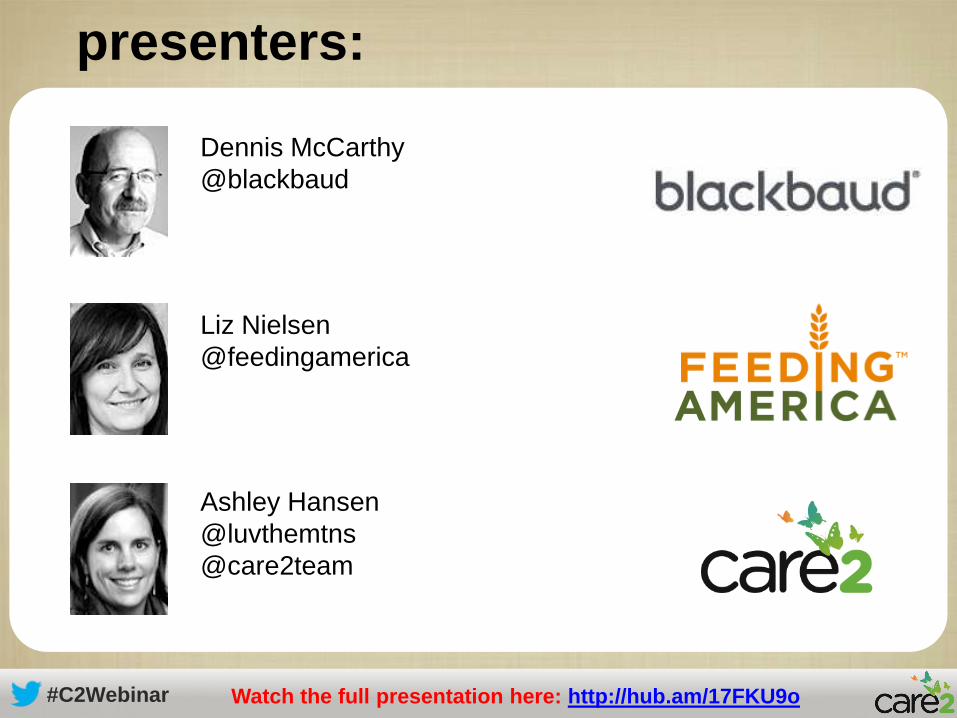
presenters:
Dennis McCarthy
@blackbaud
Liz Nielsen
@feedingamerica
Ashley Hansen
@luvthemtns
@care2team
Watch the full presentation here: http://hub.am/17FKU9o
#C2Webinar
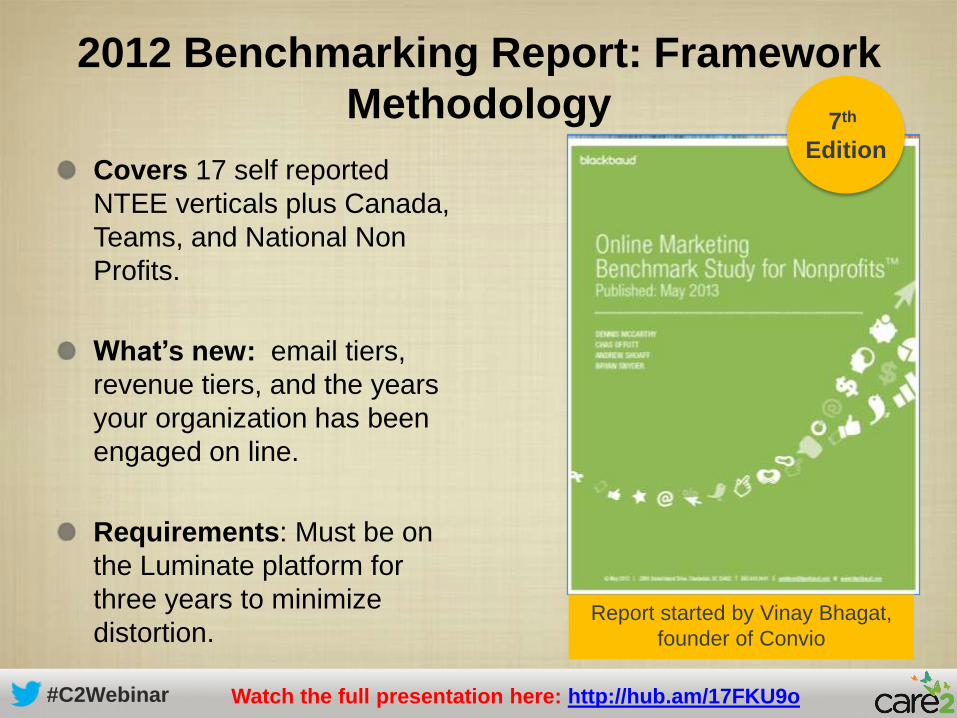
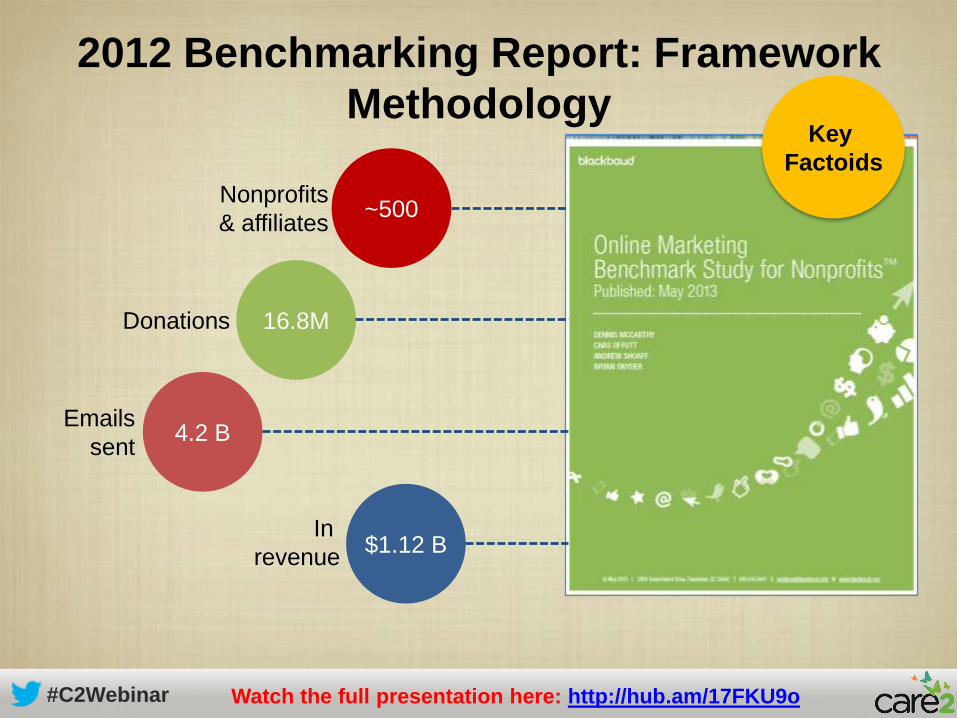
2012 Benchmarking Report: Framework
Methodology
Covers 17 self reported
NTEE verticals plus Canada,
Teams, and National Non
Profits.
What’s new: email tiers,
revenue tiers, and the years
your organization has been
engaged on line.
Requirements: Must be on
the Luminate platform for
three years to minimize
distortion.Report started by Vinay Bhagat,
founder of Convio
7th
Edition
Watch the full presentation here: http://hub.am/17FKU9o
#C2Webinar
2012 Benchmarking Report: Framework
MethodologyKey
Factoids
~500Nonprofits
& affiliates
16.8MDonations
4.2 BEmails
sent
$1.12 BIn
revenue
Watch the full presentation here: http://hub.am/17FKU9o
#C2Webinar
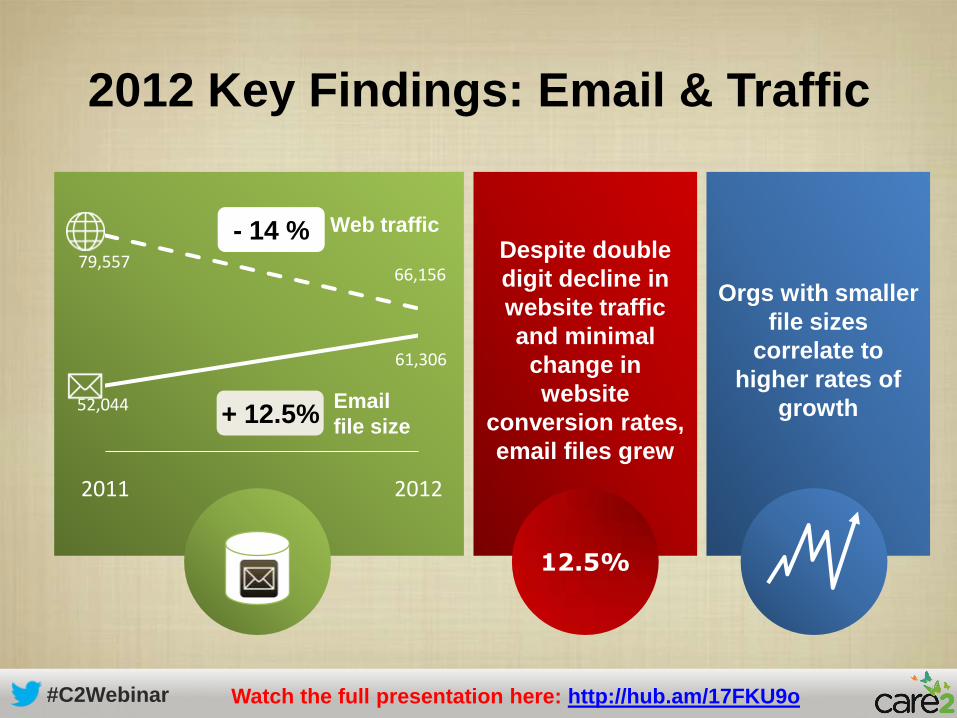
2012 Key Findings: Email & Traffic
Despite double
digit decline in
website traffic
and minimal
change in
website
conversion rates,
email files grew
Orgs with smaller
file sizes
correlate to
higher rates of
growth
12.5%
52,044
61,306
79,55766,156
2011 2012
+ 12.5%
- 14 %
file size
Web traffic
Watch the full presentation here: http://hub.am/17FKU9o
#C2Webinar
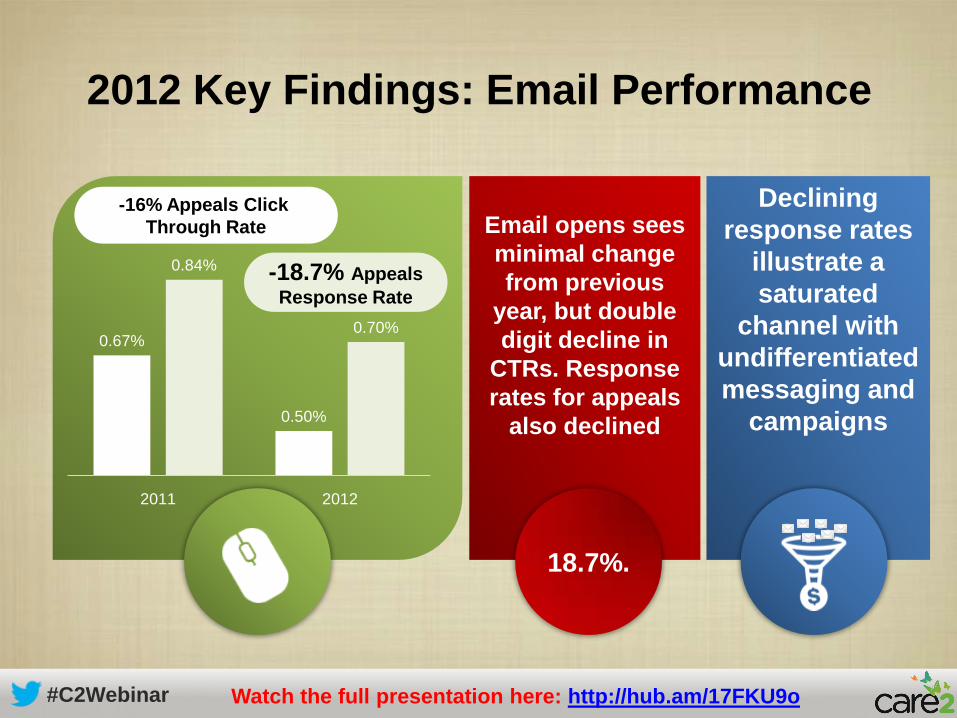
Email opens sees
minimal change
from previous
year, but double
digit decline in
CTRs. Response
rates for appeals
also declined
Declining
response rates
illustrate a
saturated
channel with
undifferentiated
messaging and
campaigns
18.7%.
2012 Key Findings: Email Performance
0.67%
0.50%
0.84%
0.70%
2011 2012
-16% Appeals Click
Through Rate
-18.7% Appeals
Response Rate
Watch the full presentation here: http://hub.am/17FKU9o
#C2Webinar
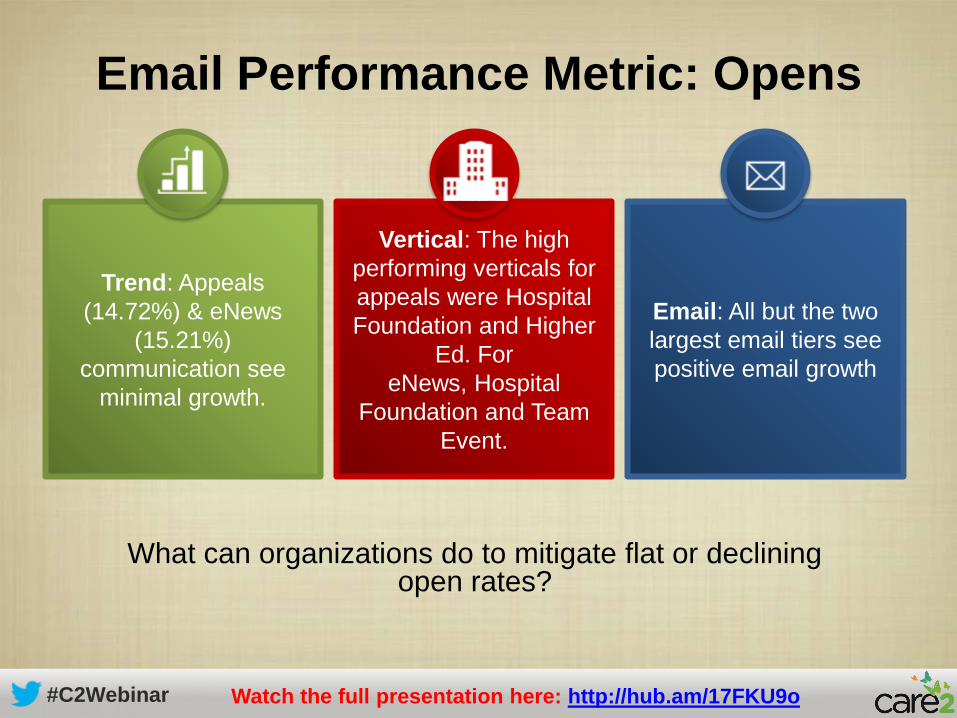
Email Performance Metric: Opens
What can organizations do to mitigate flat or declining open rates?
Trend: Appeals
(14.72%) & eNews
(15.21%)
communication see
minimal growth.
Vertical: The high
performing verticals for
appeals were Hospital
Foundation and Higher
Ed. For
eNews, Hospital
Foundation and Team
Event.
Email: All but the two
largest email tiers see
positive email growth
Watch the full presentation here: http://hub.am/17FKU9o

#C2Webinar
What can organizations do to mitigate flat or declining click-thru rates?
Trend: Appeals (.7%) &
eNews (1.95%) see
decline of 16% and
11.91%, respectively.
Vertical: All verticals
except Hospital
Foundation and Higher
Ed see negative growth
for appeals. All verticals
except Team Event see
negative growth for
eNews.
Email: All tiers except
125,000-199,000 see
positive email growth
for appeals. All tiers
except 750,00-999,999
see negative growth for
eNews.
Email Performance Metric: Clicks
Watch the full presentation here: http://hub.am/17FKU9o
#C2Webinar
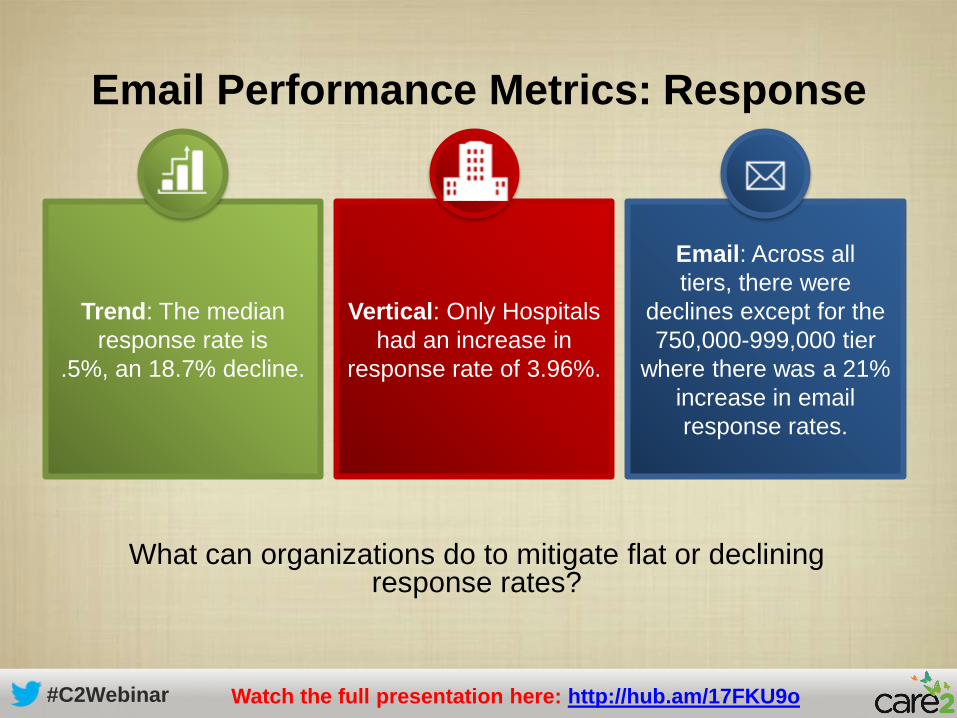
Email Performance Metrics: Response
What can organizations do to mitigate flat or declining response rates?
Trend: The median
response rate is
.5%, an 18.7% decline.
Vertical: Only Hospitals
had an increase in
response rate of 3.96%.
Email: Across all
tiers, there were
declines except for the
750,000-999,000 tier
where there was a 21%
increase in email
response rates.
Watch the full presentation here: http://hub.am/17FKU9o

#C2Webinar
Fundraising
continues double
digit growth as
sustainers and
repeat donors
grew 27% and
20%, respectively
.
Average median
gift $89
2012 Key Findings: Fundraising
20%
27%
11.6%
Repeat Donors
Sustainers Total Fundraising
Watch the full presentation here: http://hub.am/17FKU9o
#C2Webinar
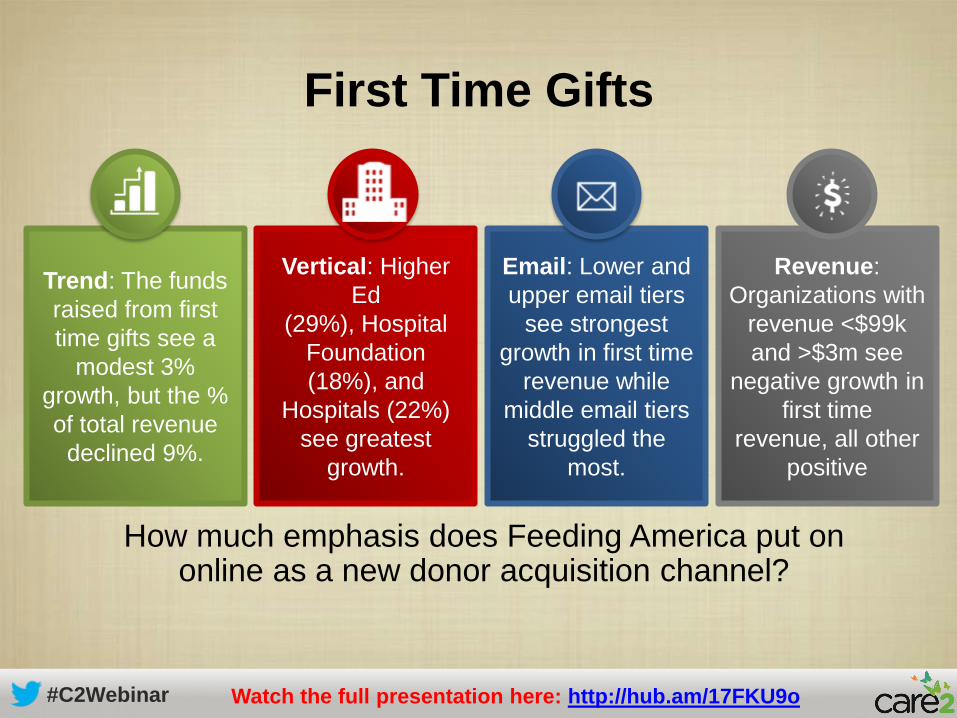
First Time Gifts
How much emphasis does Feeding America put on online as a new donor acquisition channel?
Trend: The funds
raised from first
time gifts see a
modest 3%
growth, but the %
of total revenue
declined 9%.
Vertical: Higher
Ed
(29%), Hospital
Foundation
(18%), and
Hospitals (22%)
see greatest
growth.
Email: Lower and
upper email tiers
see strongest
growth in first time
revenue while
middle email tiers
struggled the
most.
Revenue:
Organizations with
revenue <$99k
and >$3m see
negative growth in
first time
revenue, all other
positive
Watch the full presentation here: http://hub.am/17FKU9o
#C2Webinar
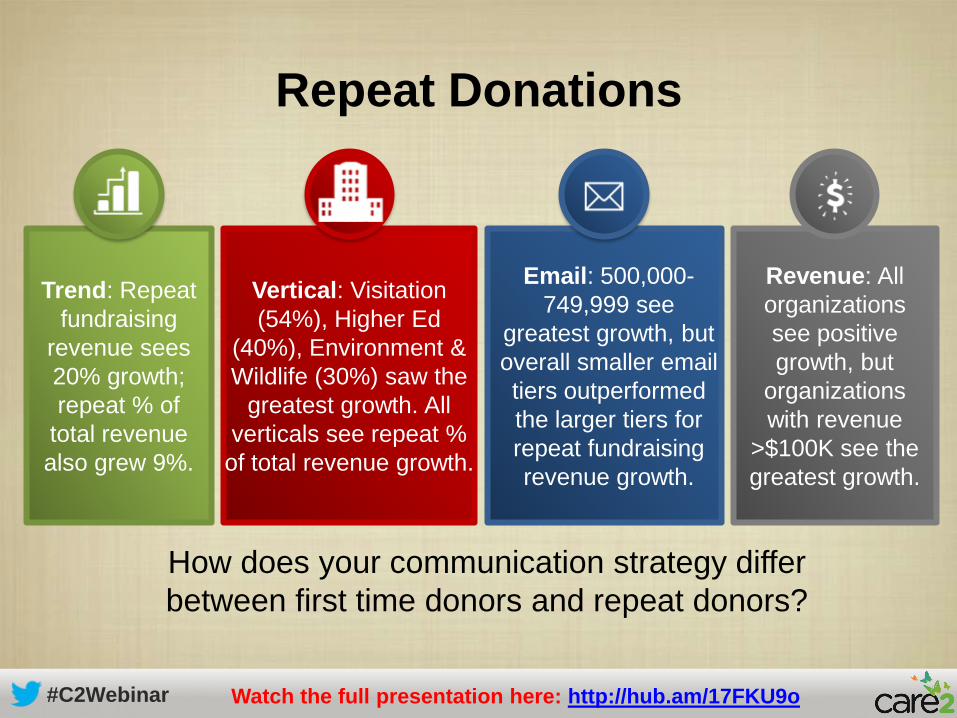
Repeat Donations
How does your communication strategy differ
between first time donors and repeat donors?
Trend: Repeat
fundraising
revenue sees
20% growth;
repeat % of
total revenue
also grew 9%.
Vertical: Visitation
(54%), Higher Ed
(40%), Environment &
Wildlife (30%) saw the
greatest growth. All
verticals see repeat %
of total revenue growth.
Email: 500,000-
749,999 see
greatest growth, but
overall smaller email
tiers outperformed
the larger tiers for
repeat fundraising
revenue growth.
Revenue: All
organizations
see positive
growth, but
organizations
with revenue
>$100K see the
greatest growth.
Watch the full presentation here: http://hub.am/17FKU9o
#C2Webinar
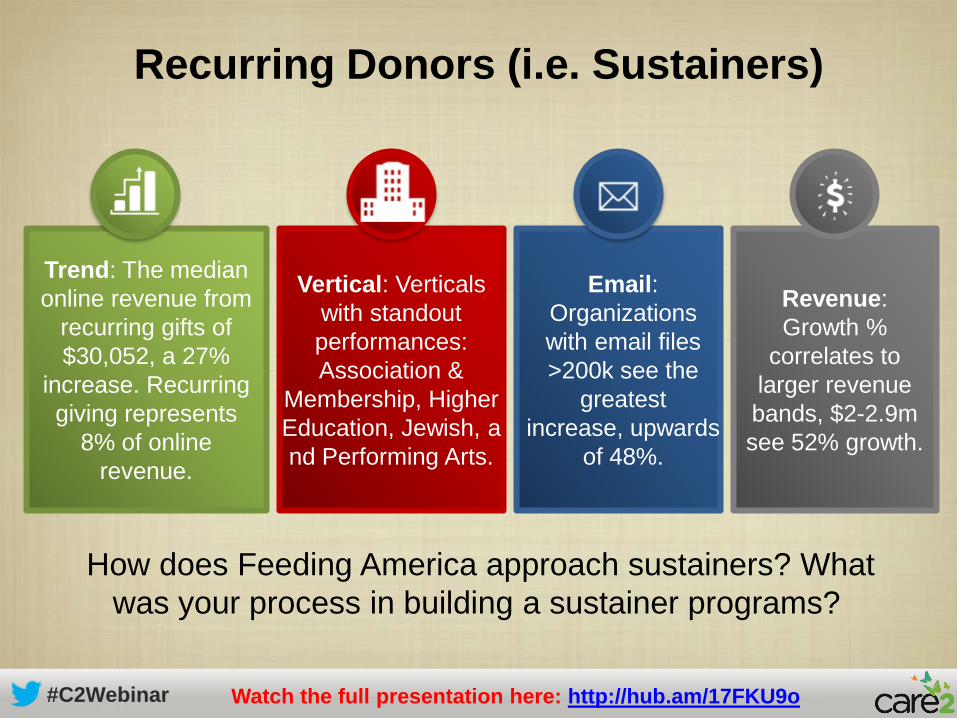
Recurring Donors (i.e. Sustainers)
Trend: The median
online revenue from
recurring gifts of
$30,052, a 27%
increase. Recurring
giving represents
8% of online
revenue.
Vertical: Verticals
with standout
performances:
Association &
Membership, Higher
Education, Jewish, a
nd Performing Arts.
Email:
Organizations
with email files
>200k see the
greatest
increase, upwards
of 48%.
Revenue:
Growth %
correlates to
larger revenue
bands, $2-2.9m
see 52% growth.
How does Feeding America approach sustainers? What
was your process in building a sustainer programs?
Watch the full presentation here: http://hub.am/17FKU9o

#C2Webinar
How is Feeding America using online advocacy to recruit new
constituents or and keep constituents engaged? Are there strategies
to convert advocates to donors and vice versa?
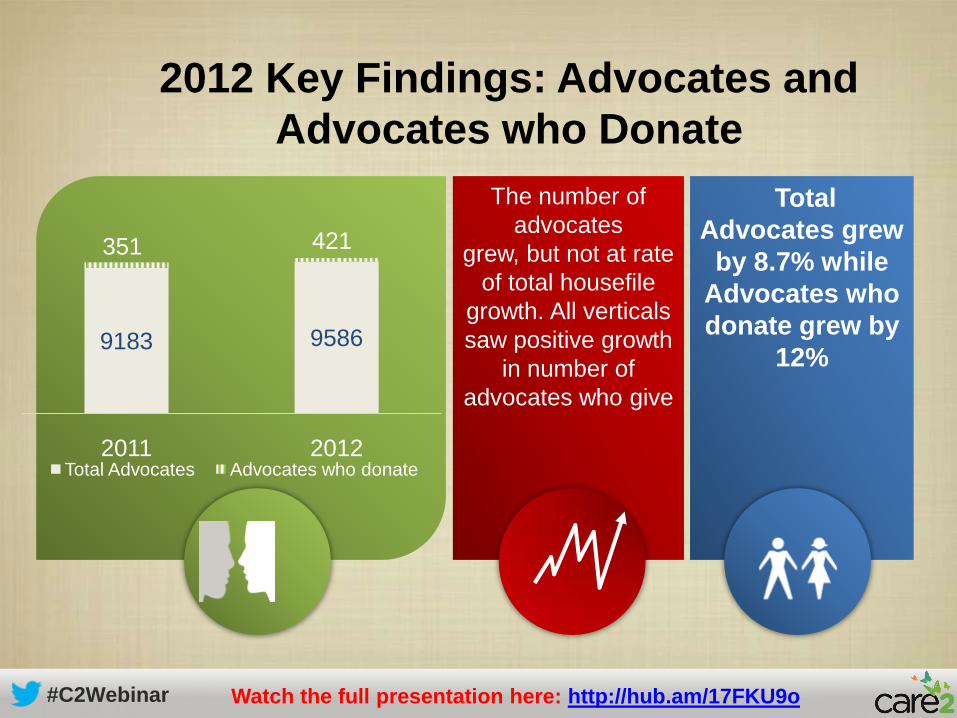
Trend: Though
number of advocates increase 8.7%, the % of advocates on file decreased 1%.
Advocates who donate see a 12%
growth.
Vertical: Jewish
organizations see a
29.2% increase of
advocates who donate
followed by
Environment & Wildlife
and Higher Ed (22.2%
and
21.2%, respectively).
Email: Highest email
tiers see strongest % of
advocates who
donate, upwards of
38%.
Advocacy
Watch the full presentation here: http://hub.am/17FKU9o
#C2Webinar
The number of
advocates
grew, but not at rate
of total housefile
growth. All verticals
saw positive growth
in number of
advocates who give
Total
Advocates grew
by 8.7% while
Advocates who
donate grew by
12%
2012 Key Findings: Advocates and
Advocates who Donate
9183 9586
351 421
2011 2012Total Advocates Advocates who donate
Watch the full presentation here: http://hub.am/17FKU9o
#C2Webinar
Free copy of the full report and upcoming webinars
www.blackbaud.com/benchmark
Additional Resources
Watch the full presentation here: http://hub.am/17FKU9o
#C2Webinar
thank you! questions? contact us!
Dennis McCarthy
@blackbaud
Liz Nielsen
@feedingamerica
Ashley Hansen
@luvthemtns
Watch the full presentation here: http://hub.am/17FKU9o