Embed Size (px)
Citation preview
Improving the Customer ServiceImproving the Customer Service Experience to Achieve Better
Outcomes at a Lower CostOutcomes at a Lower CostPlenary: 1:45 p.m. – 3:15 p.m.
Presented by:
David Lloyd FounderDavid Lloyd, Founder M.T.M. Services, LLCP. O. Box 1027, Holly Springs, NC 27540Ph 919 434 3709 F 919 773 8141Phone: 919-434-3709 Fax: 919-773-8141E-mail: [email protected] Site: mtmservices.org
Presented By: David Lloyd, Founder 1
Disclosure Information“Improving the Customer Service Experience to
Achieve Better Outcomes at a Lower Cost “Achieve Better Outcomes at a Lower Cost David Lloyd
Continuing Medical Education committee members and those ginvolved in the planning of this CME Event have no financial relationships to disclose.
d l dDavid Lloyd
I have no financial relationships to disclose
- and
I will not discuss off label use and/or investigational use in myI will not discuss off label use and/or investigational use in my presentation
2Presented By:
David Lloyd, Founder
Wh t E t l fWhat External forces or opportunities are coming into play th t ill b th f d tthat will both force and support a shift from “Volume of Services”
d l t th “V l f C ”model to the “Value of Care” Model?
Presented By: David Lloyd, Founder 3
Shared Risk/Shared Savings Funding M d lModels
• ACA contains an outcome based “race to the top” requirement for Medicare funding related to the prevalence of potentially avoidable conditions (PACs) that resulted from Medicare eligible persons receiving treatment PACs consist of such avoidablepersons receiving treatment. PACs consist of such avoidable conditions such as postoperative infection rates, high 30 day post discharge readmission rates for the same condition, etc.
• Below is the summary of the two phases of this program and the y p p grespective “bonus” and “penalty” that hospital and medical center providers of Medicare service will experience during each phase:
– October 2011 – Medicare will launch VBP for hospitals - +1% t 1% t dj t t b d litto – 1% rate adjustment based on quality measures
– In 2017 = +2% to – 2% Medicare rate adjustment based on benchmarks that getter higher each year – “race to the top” in hospital qualityhospital quality
4Presented By:
David Lloyd, Founder 4
Shared Risk/Shared Savings Funding M d lModels
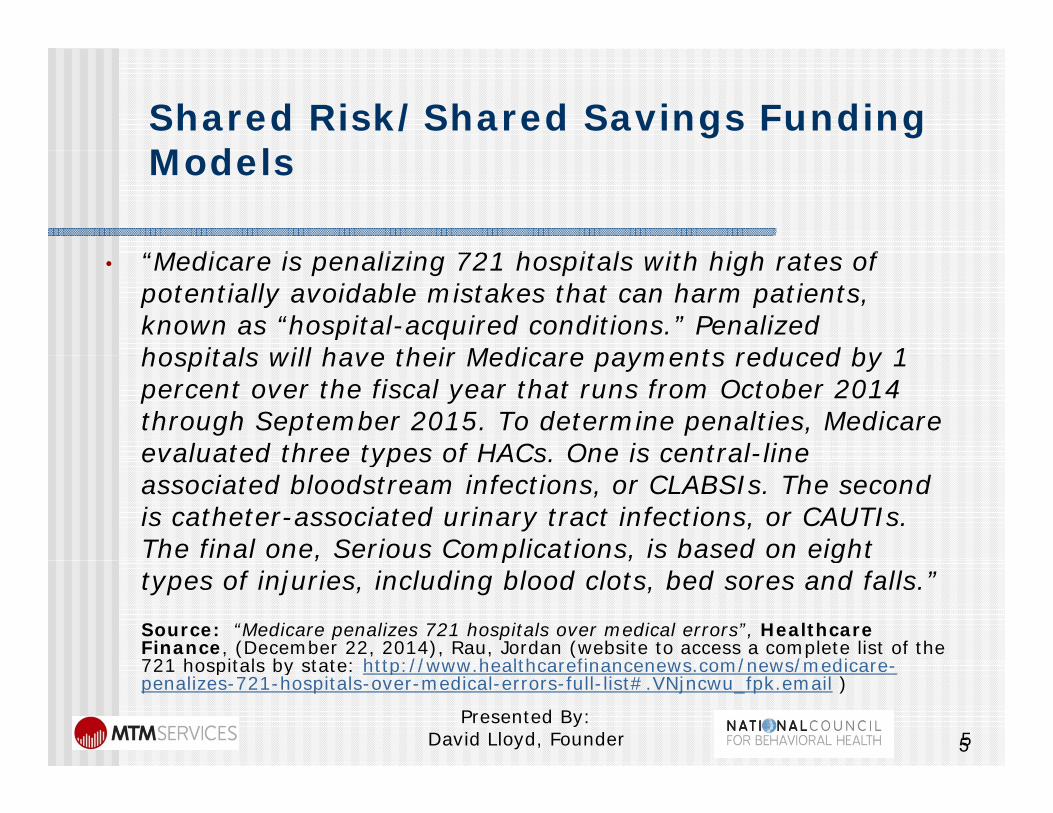
“M di i li i 721 h it l ith hi h t f• “Medicare is penalizing 721 hospitals with high rates of potentially avoidable mistakes that can harm patients, known as “hospital-acquired conditions.” Penalized hospitals will have their Medicare payments reduced by 1hospitals will have their Medicare payments reduced by 1 percent over the fiscal year that runs from October 2014 through September 2015. To determine penalties, Medicare evaluated three types of HACs One is central-lineevaluated three types of HACs. One is central line associated bloodstream infections, or CLABSIs. The second is catheter-associated urinary tract infections, or CAUTIs. The final one, Serious Complications, is based on eight , p , gtypes of injuries, including blood clots, bed sores and falls.”
Source: “Medicare penalizes 721 hospitals over medical errors”, Healthcare Finance, (December 22, 2014), Rau, Jordan (website to access a complete list of the 721 hospitals by state: http://www healthcarefinancenews com/news/medicare721 hospitals by state: http://www.healthcarefinancenews.com/news/medicare-penalizes-721-hospitals-over-medical-errors-full-list#.VNjncwu_fpk.email )
5Presented By:
David Lloyd, Founder 5
Healthcare Reform Shared Risk/Shared Savings Payment Models
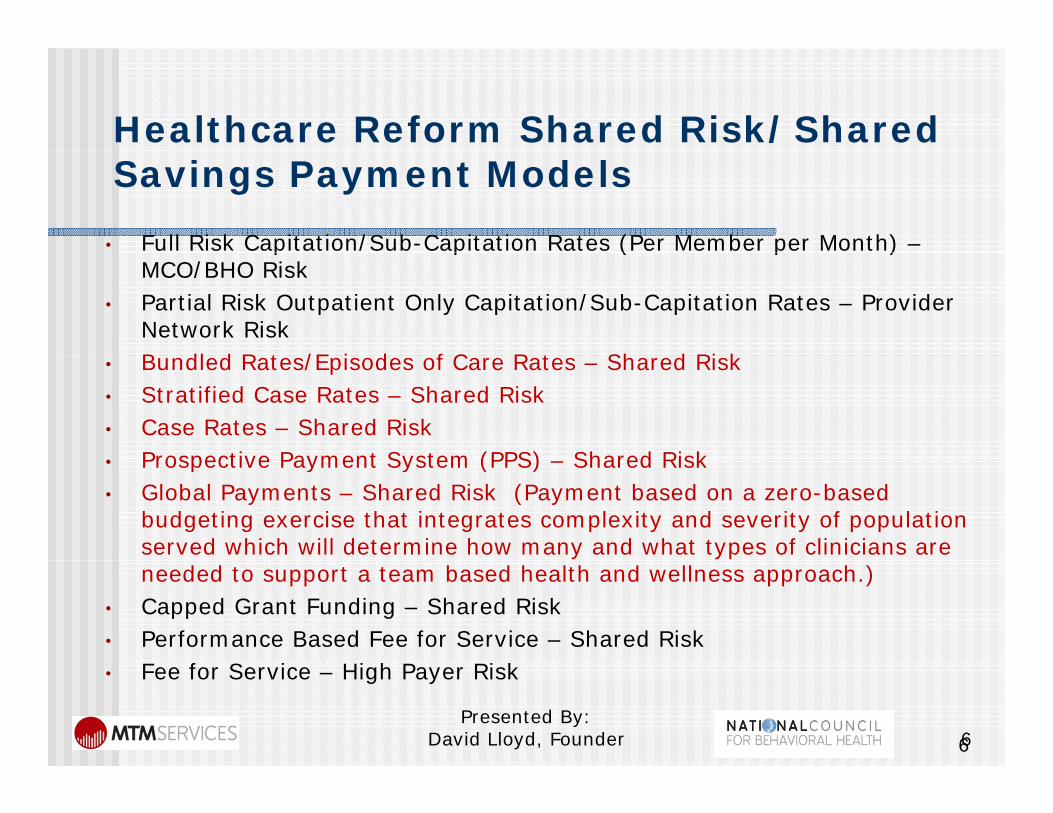
• Full Risk Capitation/Sub-Capitation Rates (Per Member per Month) –p / p ( p )MCO/BHO Risk
• Partial Risk Outpatient Only Capitation/Sub-Capitation Rates – Provider Network RiskB dl d R t /E i d f C R t Sh d Ri k• Bundled Rates/Episodes of Care Rates – Shared Risk
• Stratified Case Rates – Shared Risk • Case Rates – Shared Risk
Prospective Payment System (PPS) Shared Risk• Prospective Payment System (PPS) – Shared Risk • Global Payments – Shared Risk (Payment based on a zero-based
budgeting exercise that integrates complexity and severity of population served which will determine how many and what types of clinicians are needed to support a team based health and wellness approach.)
• Capped Grant Funding – Shared Risk • Performance Based Fee for Service – Shared Risk
F f S i Hi h P Ri k• Fee for Service – High Payer Risk
66Presented By:
David Lloyd, Founder
Shift in Payment ModelShift in Payment Model…
1 As parity and national integrated healthcare1. As parity and national integrated healthcare provided under the Affordable Care Act (ACA) are implemented, new models of “shared risk “funding are being introducedare being introduced.
2. A shift by payers such as Medicaid, Medicare and Third Party Insurance from “paying for volume” to “paying for value” provides a significant challenge for CBHOs.
3. A large majority of CBHOs do not have an ongoing a g ajo y o O do o a a o go gawareness of their cost of services or cost of processes involved in the delivery of services (i.e., “What is your cost and time to treatment?”)What is your cost and time to treatment? )
7Presented By:
David Lloyd, Founder
Shared Risk Funding Model R i tRequirements
I t t d fi iti f V l /Q lit Th t1. Important definition of Value/Quality: The outcomes achieved to objectively demonstrate that the client is getting better combined with the service array frequency and duration provided, and the cost of the process of treatment p , plinked to the outcomes achieved.
2. Ability of all staff to develop a dynamic tension between “quality” and “cost” as if they are on a pendulum
3. Ability to know levels of NET revenue received for services provided – NOT RATE for service billed
a. What is the claim denial/error rate last week, month, quarter, etc.?b What is the level of over utilization of capped/grant funding receivedb. What is the level of over utilization of capped/grant funding received
that reduces the net revenue earned per service (i.e., $82 per hour therapy rate reduced to $39.75 per hour net revenues earned due to over utilization of capped/grant funding contracts)
8Presented By:
David Lloyd, Founder
States Shifting From 1915 (b), (c) Carve g ( ) ( )Out Medicaid Waivers
Shift f t M di id BH f di t• Shift from carve out Medicaid BH funding to Section 1115 General Integrated Waivers (Alabama, Arizona, Arkansas, California, ( , , , ,Colorado, Delaware, Florida, Illinois, Iowa, Kansas, Kentucky, Illinois, Louisiana, Maryland, Massachusetts Maine Minnesota New MexicoMassachusetts, Maine, Minnesota, New Mexico, New Hampshire, New York, North Carolina, Oklahoma, Oregon, Tennessee, Texas, Utah, Vermont, Washington, Wisconsin, etc.)
• Over 40 states have modified their State Medicaid Plans since March 2010Medicaid Plans since March 2010
Presented By: David Lloyd, Founder 99
Presented By: David Lloyd, Founder
H lth R f T d i 2015Healthcare Reform Trends in 2015
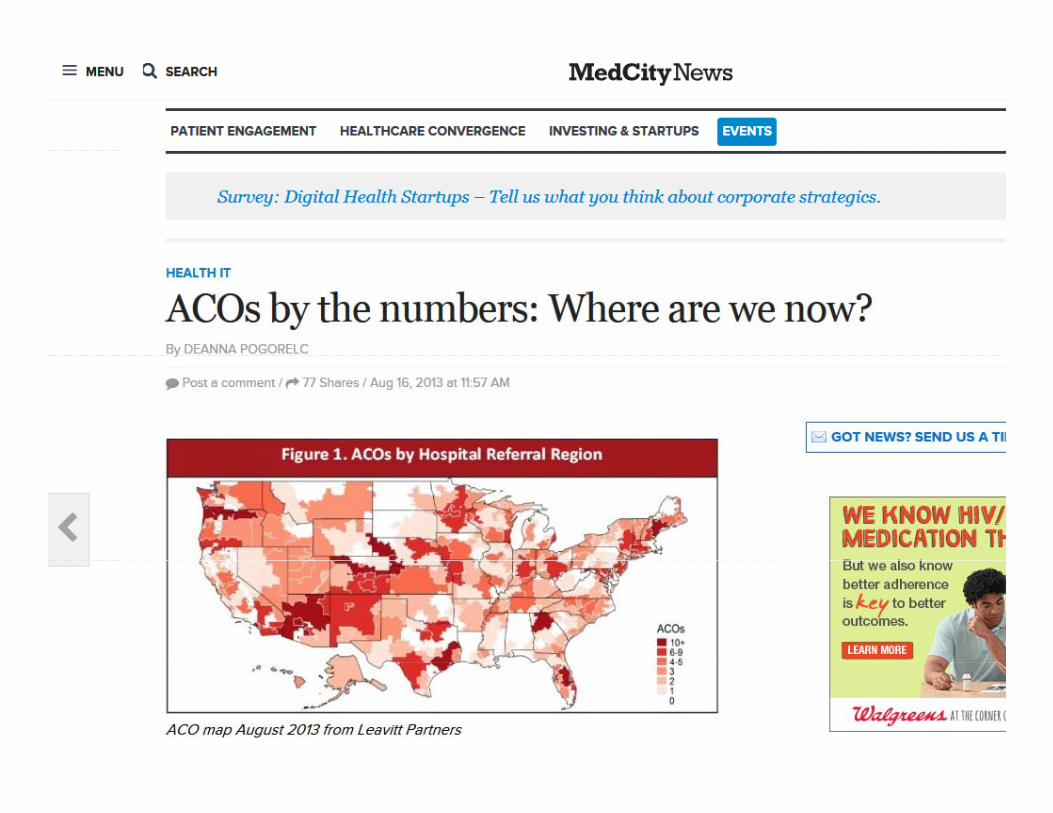
• Accountable Care Organizations (ACOs) are being certified by CMS with over 600 announced Federal Certifications for bothannounced Federal Certifications for both Medicare and Now Medicaid Share Savings Plans
• 14 plus states have applied under Section 2703 of the ACA to develop Integrated Care Health Homes (e g Missouri)Health Homes (e.g., Missouri)
• FQHCs have over 10,000 Federally Certified locations nationally and are still growing y g g
1010Presented By:
David Lloyd, Founder
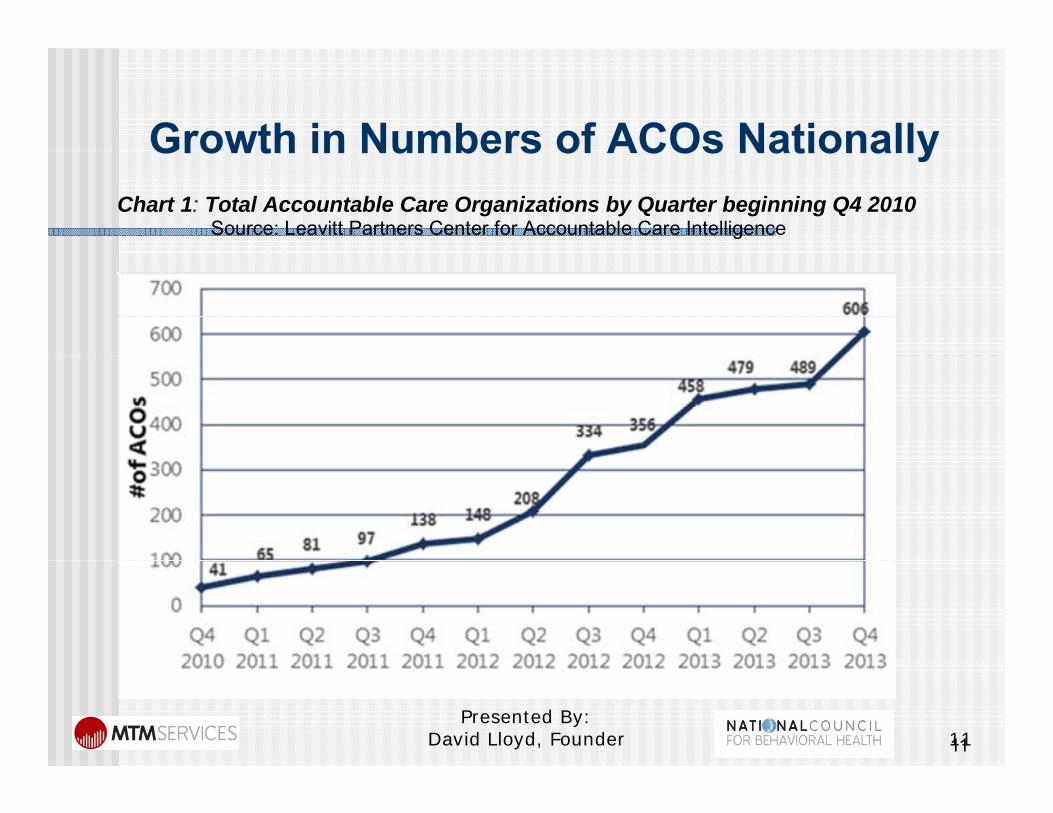
Growth in Numbers of ACOs NationallyGrowth in Numbers of ACOs NationallyChart 1: Total Accountable Care Organizations by Quarter beginning Q4 2010 Source: Leavitt Partners Center for Accountable Care Intelligence
1111Presented By:
David Lloyd, Founder
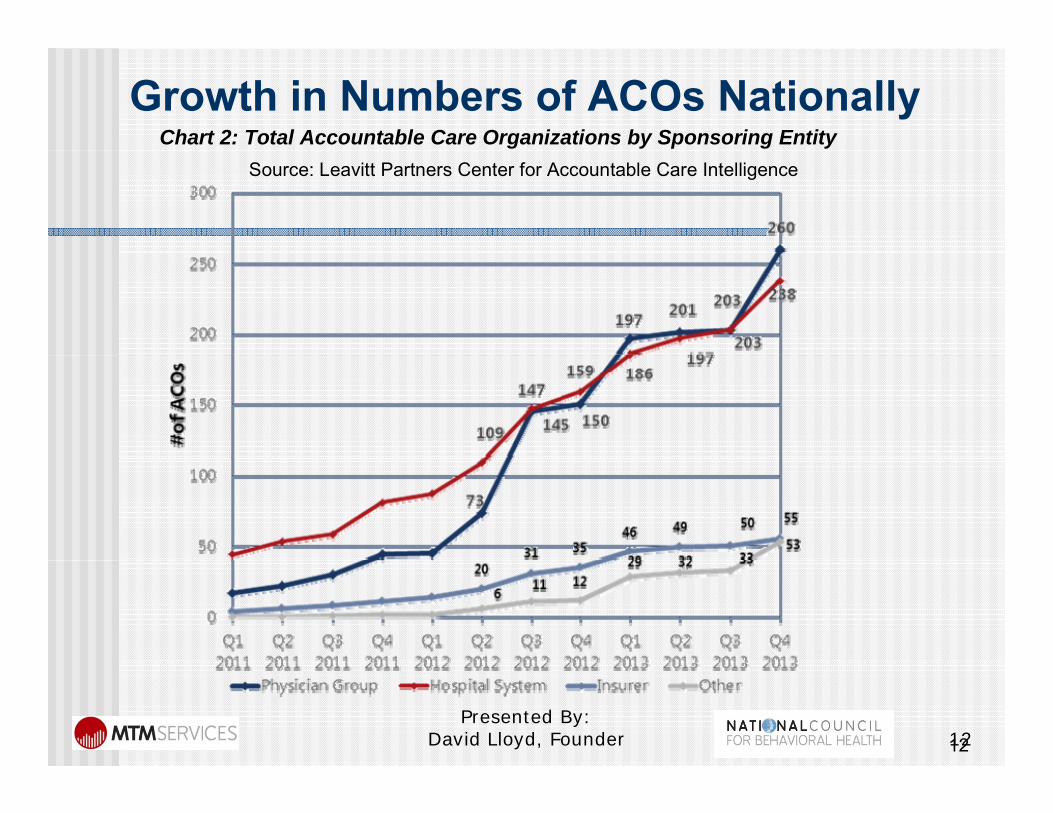
Growth in Numbers of ACOs NationallyChart 2: Total Accountable Care Organizations by Sponsoring Entity Source: Leavitt Partners Center for Accountable Care Intelligence
1212Presented By:
David Lloyd, Founder
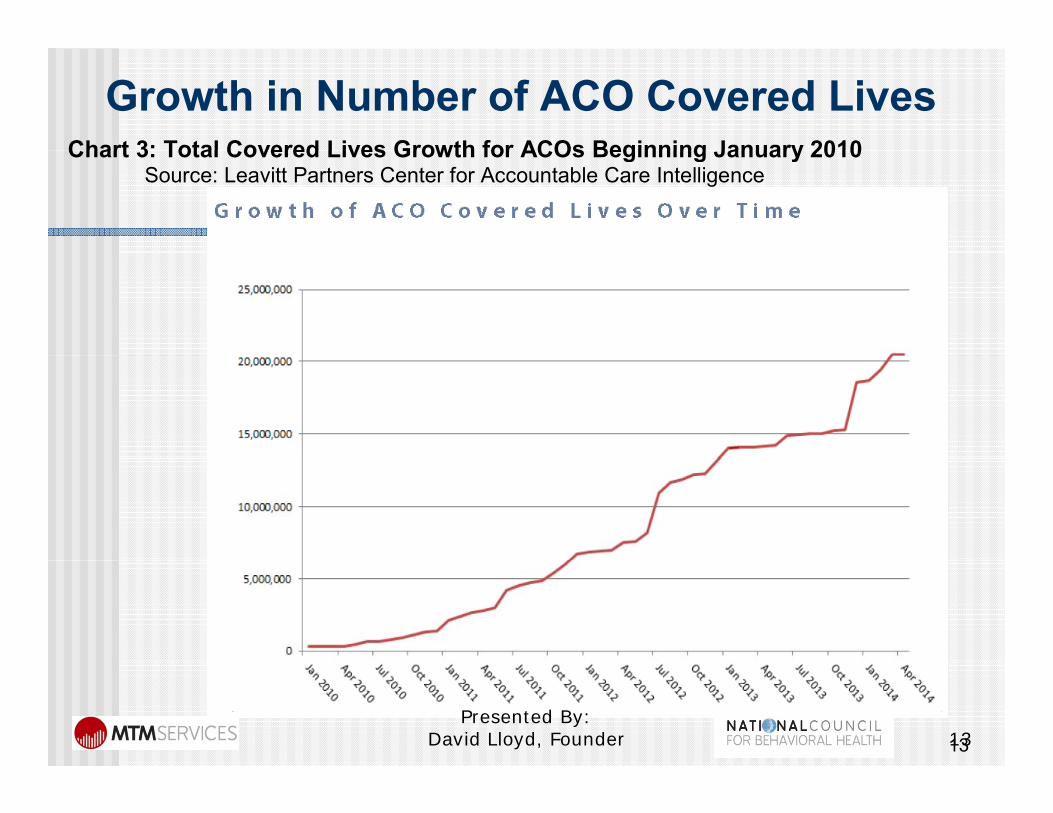
Growth in Number of ACO Covered LivesChart 3: Total Covered Lives Growth for ACOs Beginning January 2010Chart 3: Total Covered Lives Growth for ACOs Beginning January 2010
Source: Leavitt Partners Center for Accountable Care Intelligence
1313Presented By:
David Lloyd, Founder
Presented By: David Lloyd, Founder 14

Presented By: David Lloyd, Founder 15
Presented By: David Lloyd, Founder 16
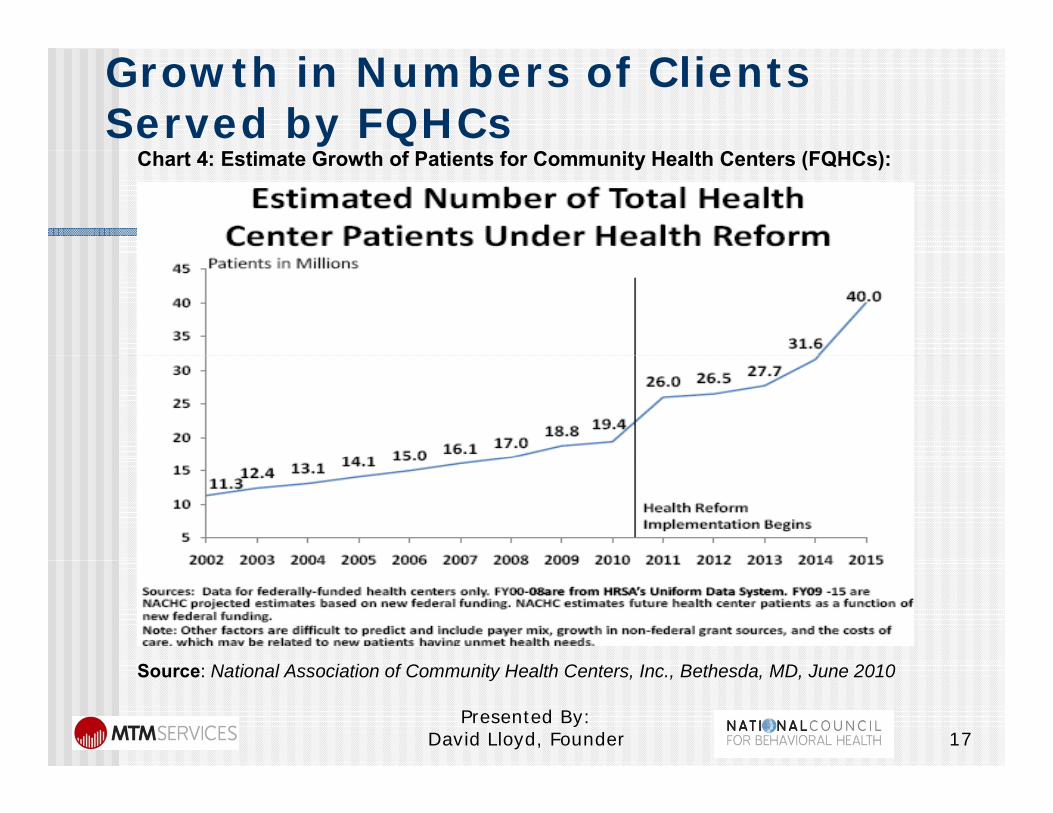
Growth in Numbers of Clients Served by FQHCs
Chart 4: Estimate Growth of Patients for Community Health Centers (FQHCs):
Presented By: David Lloyd, Founder 17
Source: National Association of Community Health Centers, Inc., Bethesda, MD, June 2010
Institute for HealthcareInstitute for Healthcare Improvement - The Triple Aim
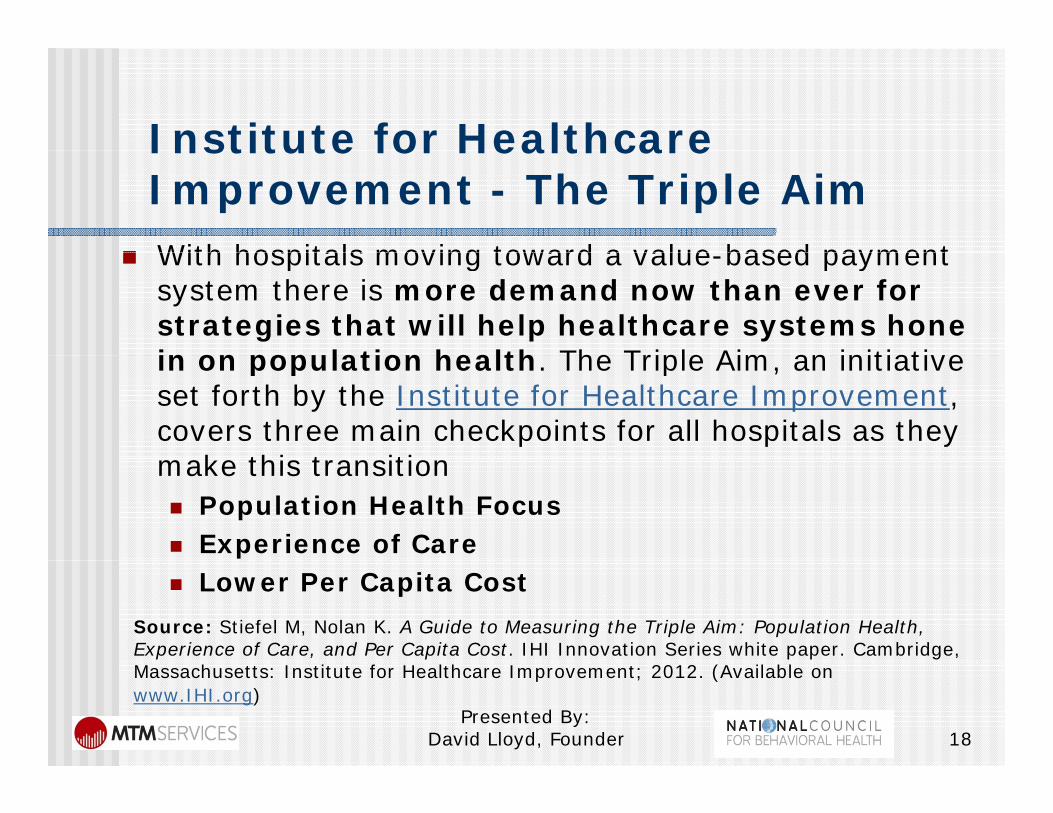
With hospitals moving toward a value based payment With hospitals moving toward a value-based payment system there is more demand now than ever for strategies that will help healthcare systems hone in on population health The Triple Aim an initiativein on population health. The Triple Aim, an initiative set forth by the Institute for Healthcare Improvement, covers three main checkpoints for all hospitals as they
k thi t itimake this transition Population Health Focus Experience of Care Lower Per Capita Cost
Source: Stiefel M, Nolan K. A Guide to Measuring the Triple Aim: Population Health, Experience of Care, and Per Capita Cost. IHI Innovation Series white paper. Cambridge, Massachusetts: Institute for Healthcare Improvement; 2012. (Available on www.IHI.org)
18Presented By:
David Lloyd, Founder
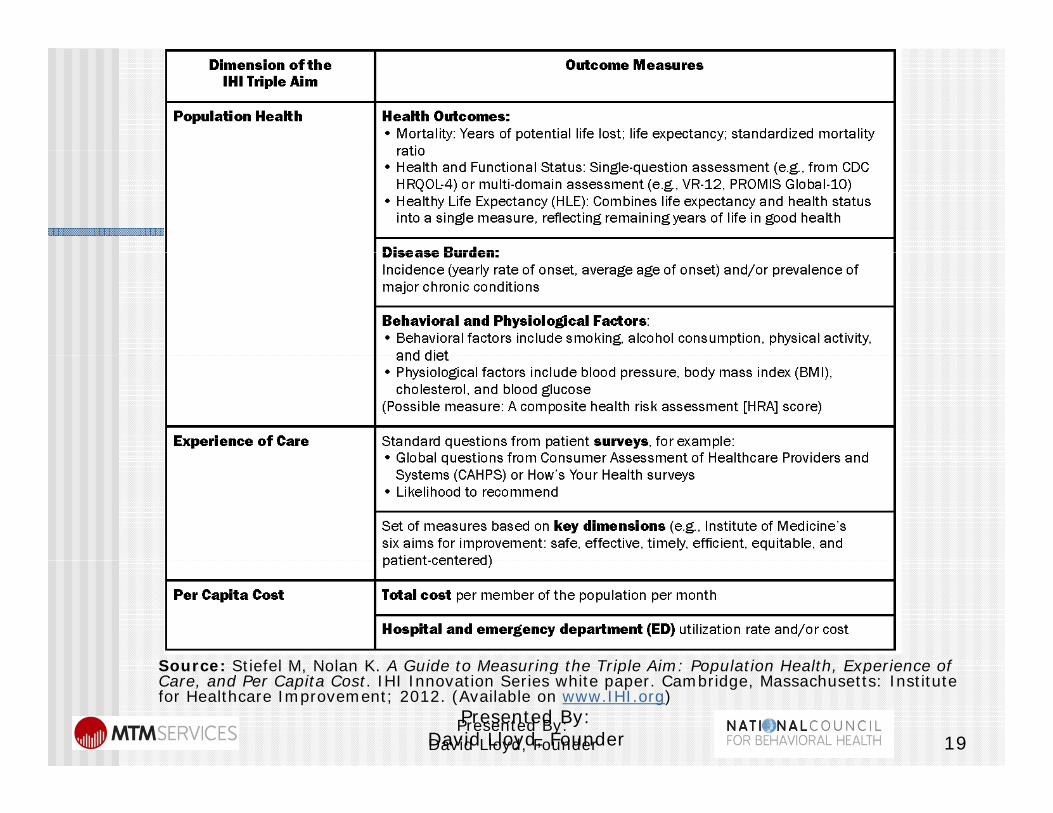
Source: Stiefel M Nolan K A Guide to Measuring the Triple Aim: Population Health Experience ofSource: Stiefel M, Nolan K. A Guide to Measuring the Triple Aim: Population Health, Experience of Care, and Per Capita Cost. IHI Innovation Series white paper. Cambridge, Massachusetts: Institute for Healthcare Improvement; 2012. (Available on www.IHI.org)
19Presented By:
David Lloyd, FounderPresented By:
David Lloyd, Founder
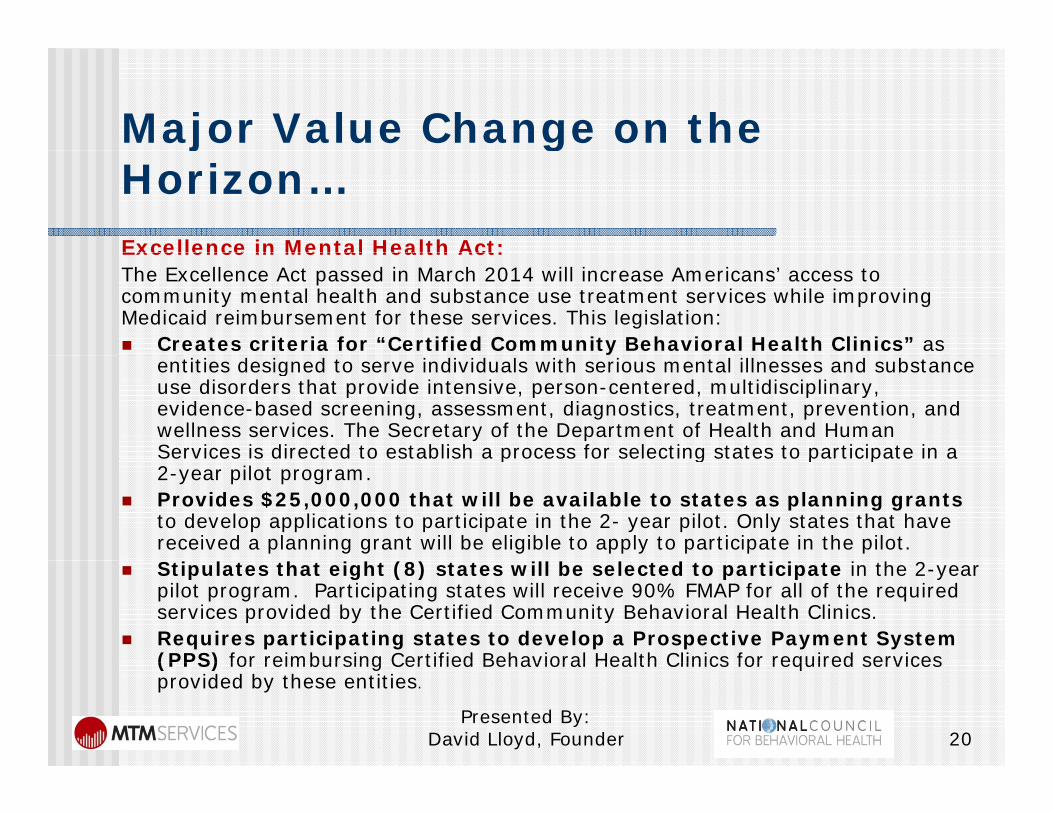
Major Value Change on the j gHorizon…Excellence in Mental Health Act:Excellence in Mental Health Act:The Excellence Act passed in March 2014 will increase Americans’ access to community mental health and substance use treatment services while improving Medicaid reimbursement for these services. This legislation: Creates criteria for “Certified Community Behavioral Health Clinics” as
entities designed to serve individuals with serious mental illnesses and substance use disorders that provide intensive, person-centered, multidisciplinary, evidence-based screening, assessment, diagnostics, treatment, prevention, and wellness services. The Secretary of the Department of Health and Human Services is directed to establish a process for selecting states to participate in aServices is directed to establish a process for selecting states to participate in a 2-year pilot program.
Provides $25,000,000 that will be available to states as planning grantsto develop applications to participate in the 2- year pilot. Only states that have received a planning grant will be eligible to apply to participate in the pilot.
Stipulates that eight (8) states will be selected to participate in the 2-year pilot program. Participating states will receive 90% FMAP for all of the required services provided by the Certified Community Behavioral Health Clinics.
Requires participating states to develop a Prospective Payment System (PPS) for reimbursing Certified Behavioral Health Clinics for required services(PPS) for reimbursing Certified Behavioral Health Clinics for required services provided by these entities.
Presented By: David Lloyd, Founder 20
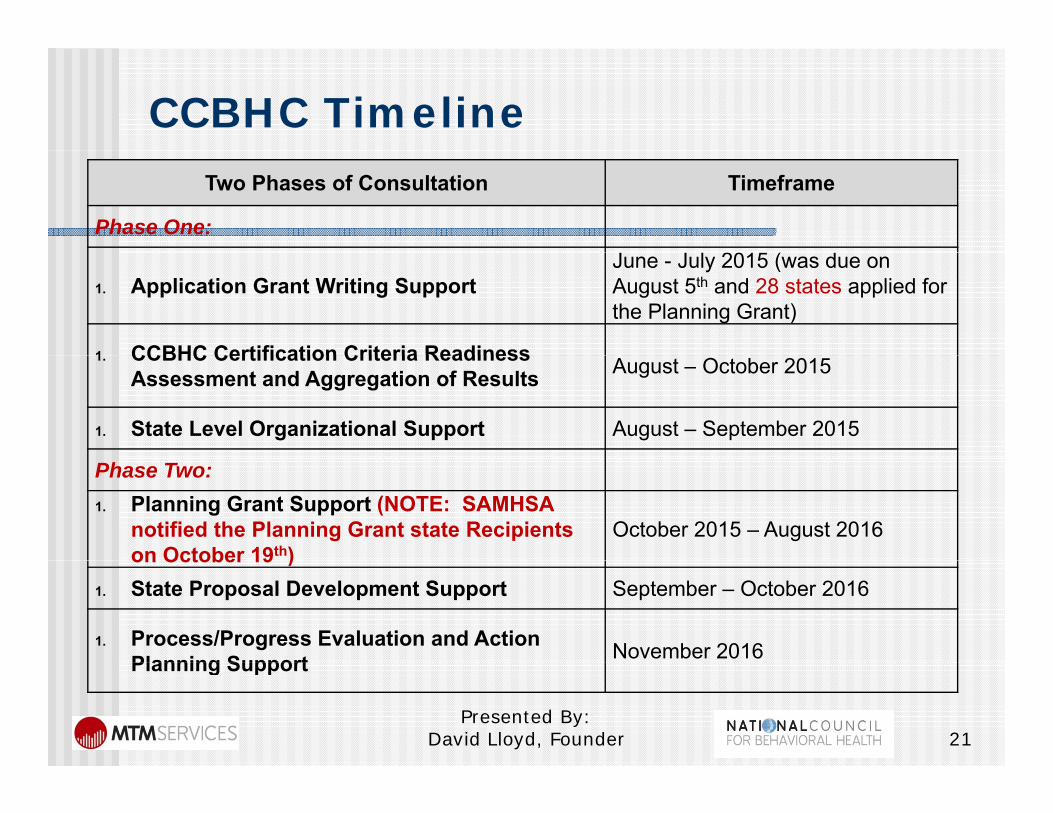
CCBHC TimelineTwo Phases of Consultation Timeframe
Phase One: J J l 2015 ( d
1. Application Grant Writing Support June - July 2015 (was due on August 5th and 28 states applied for the Planning Grant)
1 CCBHC Certification Criteria Readiness1. CCBHC Certification Criteria Readiness Assessment and Aggregation of Results August – October 2015
1. State Level Organizational Support August – September 2015
Phase Two:1. Planning Grant Support (NOTE: SAMHSA
notified the Planning Grant state Recipients on October 19th)
October 2015 – August 2016on October 19 )
1. State Proposal Development Support September – October 2016
1. Process/Progress Evaluation and Action Planning Support November 2016Planning Support
Presented By: David Lloyd, Founder 21
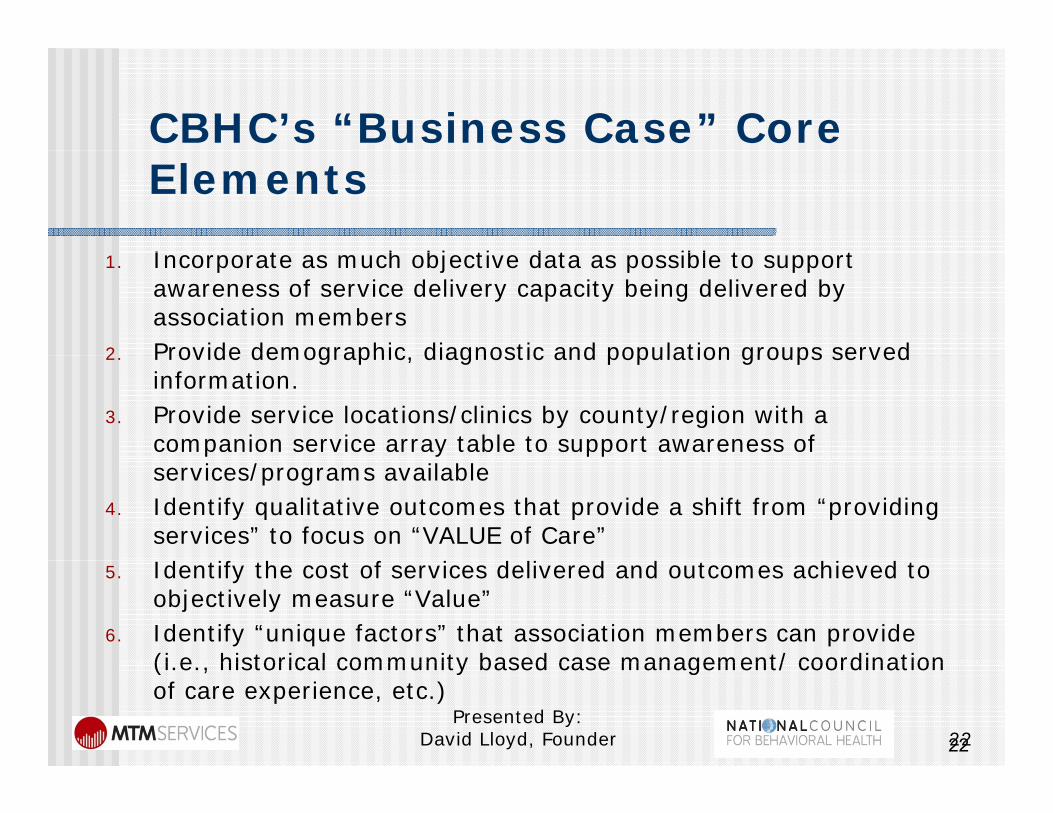
CBHC’s “Business Case” Core Elements
I t h bj ti d t ibl t t1. Incorporate as much objective data as possible to support awareness of service delivery capacity being delivered by association members
2 Provide demographic diagnostic and population groups served2. Provide demographic, diagnostic and population groups served information.
3. Provide service locations/clinics by county/region with a companion service array table to support awareness of services/programs available
4. Identify qualitative outcomes that provide a shift from “providing services” to focus on “VALUE of Care” d f h f d l d d h d5. Identify the cost of services delivered and outcomes achieved to
objectively measure “Value”6. Identify “unique factors” that association members can provide
(i e historical community based case management/ coordination(i.e., historical community based case management/ coordination of care experience, etc.)
22Presented By:
David Lloyd, Founder 22
Value of Care Components
Presented By: David Lloyd, Founder 23
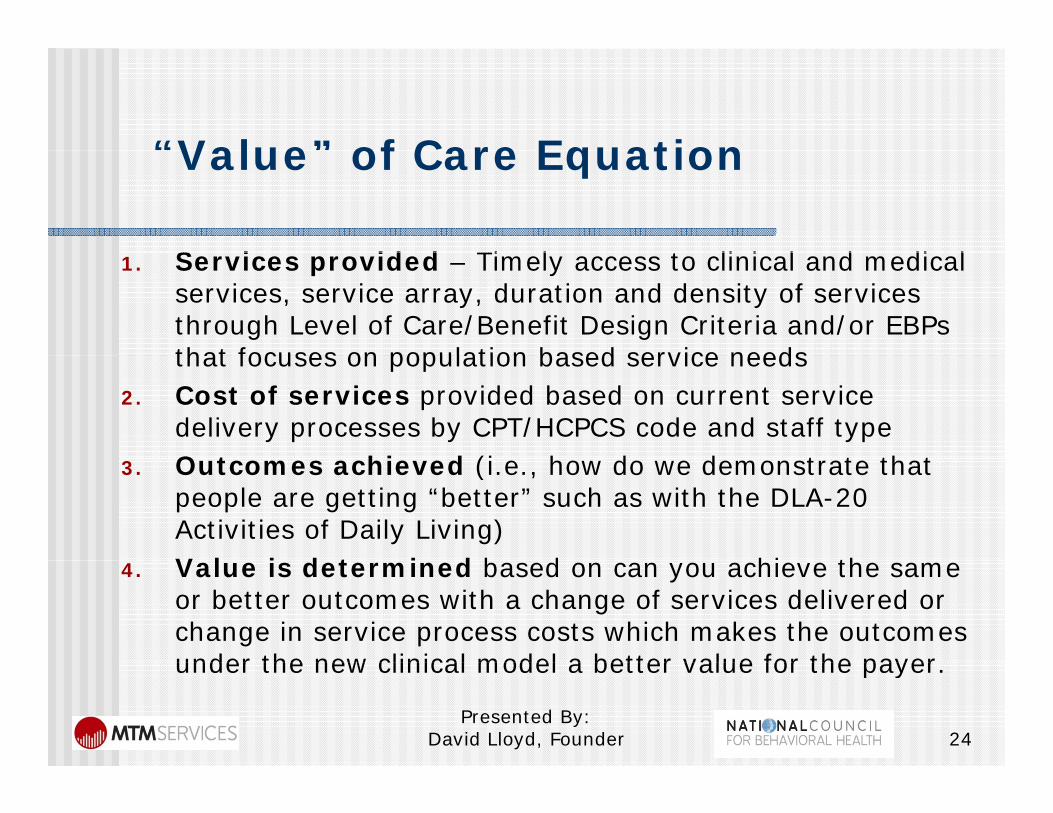
“Value” of Care EquationValue of Care Equation
S i id d Ti l t li i l d di l1. Services provided – Timely access to clinical and medical services, service array, duration and density of services through Level of Care/Benefit Design Criteria and/or EBPs that focuses on population based service needsthat focuses on population based service needs
2. Cost of services provided based on current service delivery processes by CPT/HCPCS code and staff typeO t hi d (i h d d t t th t3. Outcomes achieved (i.e., how do we demonstrate that people are getting “better” such as with the DLA-20 Activities of Daily Living)V l i d t i d b d hi th4. Value is determined based on can you achieve the same or better outcomes with a change of services delivered or change in service process costs which makes the outcomes under the new clinical model a better value for the payerunder the new clinical model a better value for the payer.
Presented By: David Lloyd, Founder 24
“Value” of Care Equation
Services Provided: Timely access to clinical and medical services, service array, duration and density of services through Level of Care/Benefit Design Criteria and/or EBPs that focuses on population p pbased service needs
Presented By: David Lloyd, Founder 25
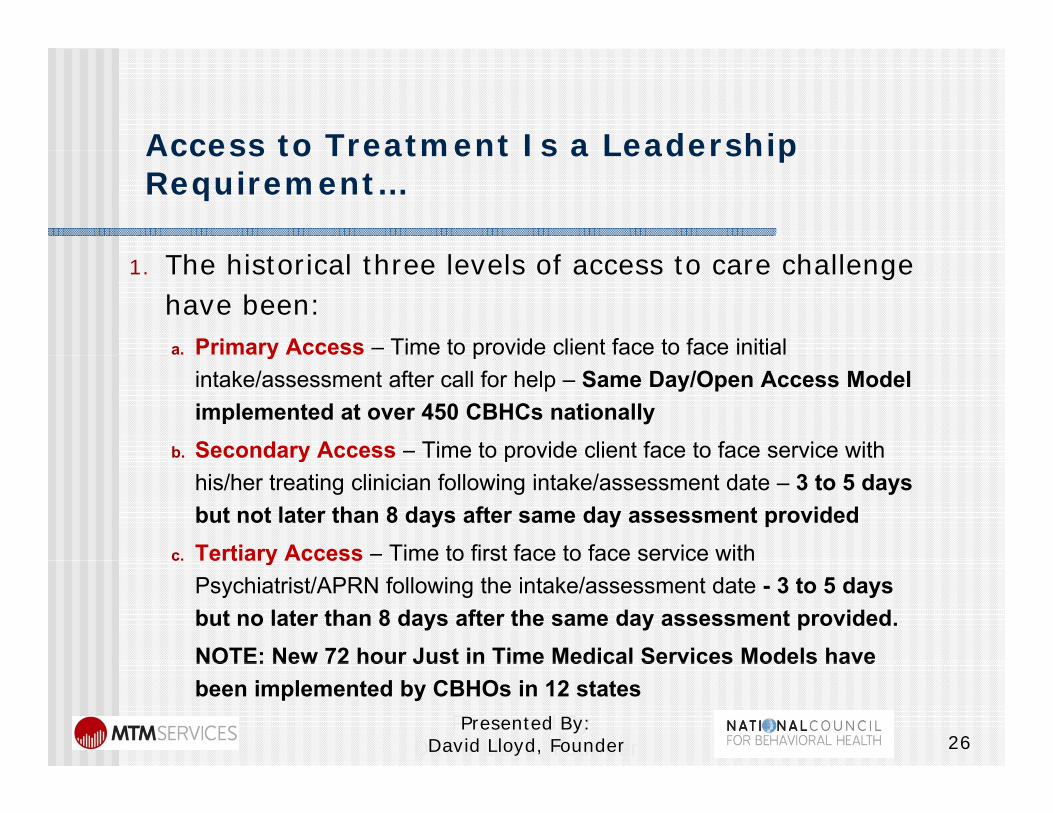
Access to Treatment Is a LeadershipAccess to Treatment Is a Leadership Requirement…
1. The historical three levels of access to care challenge have been:a. Primary Access – Time to provide client face to face initial y p
intake/assessment after call for help – Same Day/Open Access Model implemented at over 450 CBHCs nationally
b. Secondary Access – Time to provide client face to face service with y phis/her treating clinician following intake/assessment date – 3 to 5 days but not later than 8 days after same day assessment provided
c. Tertiary Access – Time to first face to face service withc. Tertiary Access Time to first face to face service with Psychiatrist/APRN following the intake/assessment date - 3 to 5 days but no later than 8 days after the same day assessment provided. NOTE: New 72 hour Just in Time Medical Services Models have
26
NOTE: New 72 hour Just in Time Medical Services Models have been implemented by CBHOs in 12 states
Presented By: David Lloyd, Founder
Presented By: David Lloyd, Founder
• Kim Beauregard, CEO • Dr. Ann Price, CMO• Tyler Booth COO• Tyler Booth, COO
• Phone 860-291-1313 • Email: [email protected]
InterCommunity IncInterCommunity, Inc.
27Presented By:
David Lloyd, Founder
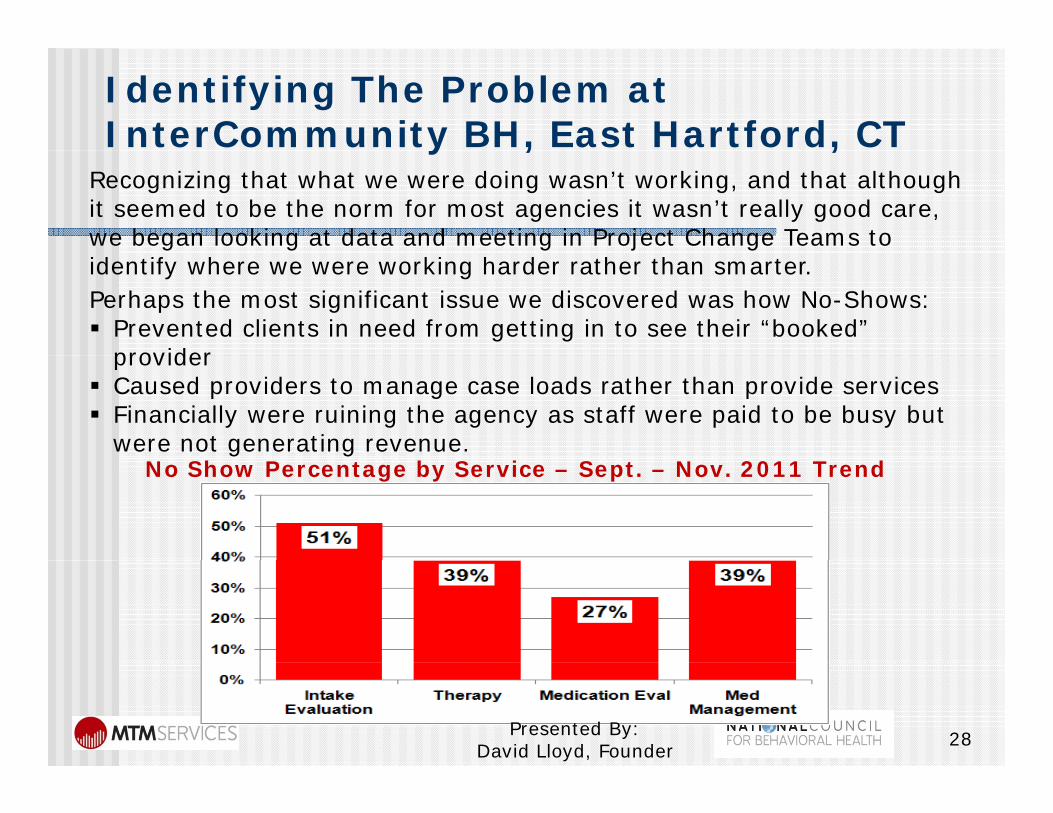
Identifying The Problem at InterCommunity BH, East Hartford, CTy , ,
Recognizing that what we were doing wasn’t working, and that although it seemed to be the norm for most agencies it wasn’t really good care, we began looking at data and meeting in Project Change Teams to identify where we were working harder rather than smarter. Perhaps the most significant issue we discovered was how No-Shows: Prevented clients in need from getting in to see their “booked”
providerprovider Caused providers to manage case loads rather than provide services Financially were ruining the agency as staff were paid to be busy but
were not generating revenue. No Show Percentage by Service – Sept. – Nov. 2011 Trend
28Presented By: David Lloyd, Founder
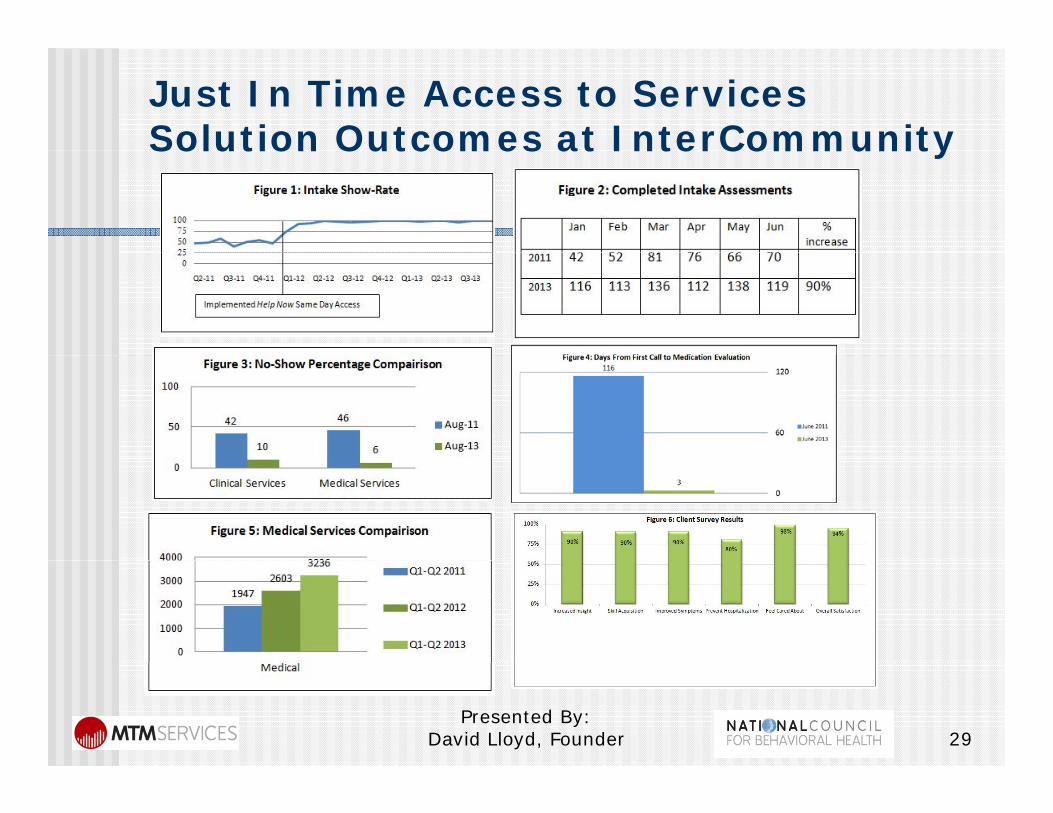
Just In Time Access to Services Solution Outcomes at InterCommunitySolution Outcomes at InterCommunity
Presented By: David Lloyd, Founder 29
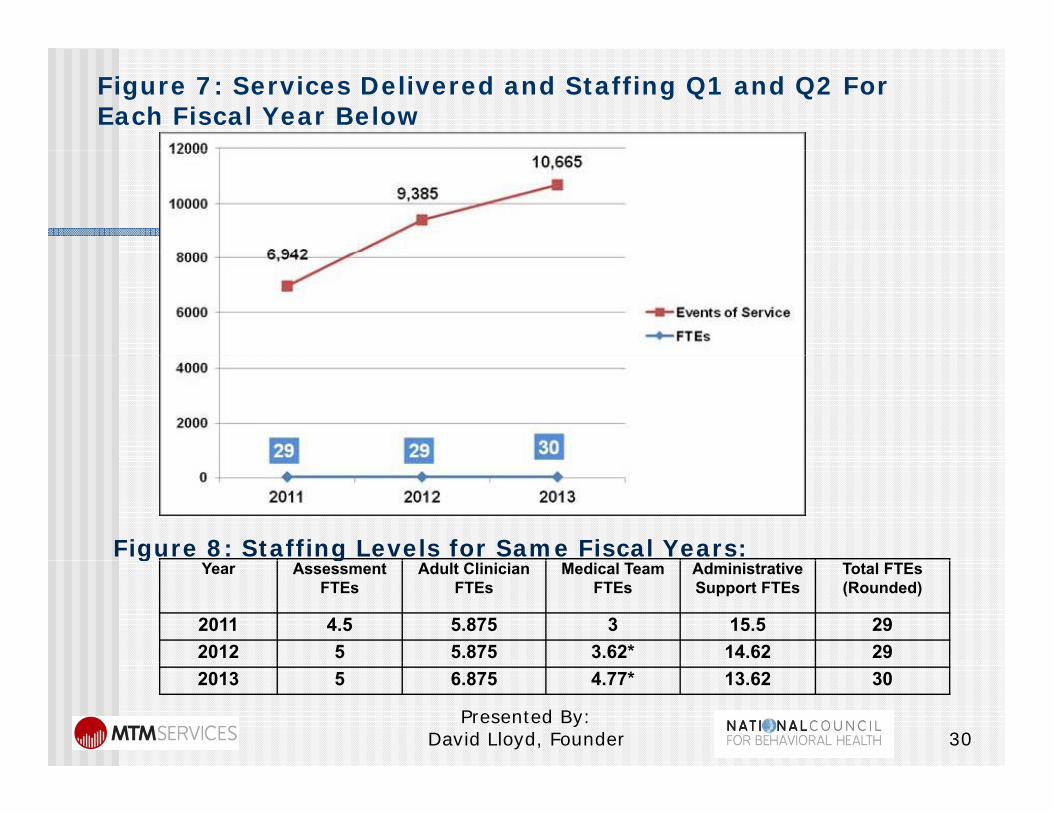
Figure 7: Services Delivered and Staffing Q1 and Q2 For Each Fiscal Year Below
Figure 8: Staffing Levels for Same Fiscal Years:Year Assessment
FTEsAdult Clinician
FTEsMedical Team
FTEsAdministrative Support FTEs
Total FTEs (Rounded)
2011 4.5 5.875 3 15.5 292012 5 5.875 3.62* 14.62 29
g g
2013 5 6.875 4.77* 13.62 30
30Presented By:
David Lloyd, Founder
“Help Now” Outcomes Summary at InterCommunityInterCommunity
In addition to improved engagement, client surveys indicate a 94% client satisfaction rating with 98% of clients reporting feeling cared for, 90% reporting benefits from therapy, and 80% asserting that InterCommunity’s timely services have prevented a need to seek inpatient psychiatric care. Figure 6 provides the client satisfaction outcomes achieved in 2013 after Help Now wasthe client satisfaction outcomes achieved in 2013 after Help Now was implemented.
The risk management benefits of the Help Now model of care have had a significant risk reduction and “bending the cost curve” effect on care. InterCommunity’s improved capacity to provide access to treatment has led to a decrease in ER visits/ hospitalizations at a savings of over $3.7 million.
The financial benefit (revenue over expenses) is also impressive. Staffing has been able to stay flat despite a 90% increase in intakes, 66% increase in medical services delivered, and 45% increase in clinical services delivered with Help Now (comparing Q3 Q4 of ‘11 to ’13) The significant increase in deliveredwith Help Now (comparing Q3-Q4 of ‘11 to ’13).The significant increase in delivered billable services, again without increased staffing, has led to a 48% increase in third party revenue.
The staff feels so positively about Help Now and their experience at the behavioral health center that they voted InterCommunity a Top Work Place in thebehavioral health center that they voted InterCommunity a Top Work Place in the state for the past three years.
Presented By: David Lloyd, Founder 31
National No Show/ Cancel Key Performance Indicators
I iti l I t k /Di ti A t S i 0%1. Initial Intake/Diagnostic Assessment Services = 0% No Show/Cancel rate based on Same Day access modelsO i Th S i 8% 12% N Sh /L t2. Ongoing Therapy Services = 8% - 12% No Show/Late Cancelled
3. Initial Psychiatric Evaluations = 12% to 15% No Sh /L t C ll dShow/Late Cancelled
4. Ongoing Medication Follow Up Services – 5% - 8% No Show/Late Cancelled - NOTE: Medications provided b h t li t th t i d th i i t t illby phone to clients that missed their appointments will have to be addressed to positively impact ongoing no show rates.
32Presented By:
David Lloyd, Founder
“Value” of Care Equation
Cost of services provided based on current service delivery processes by CPT code and staff typecode and staff type
Presented By: David Lloyd, Founder 33
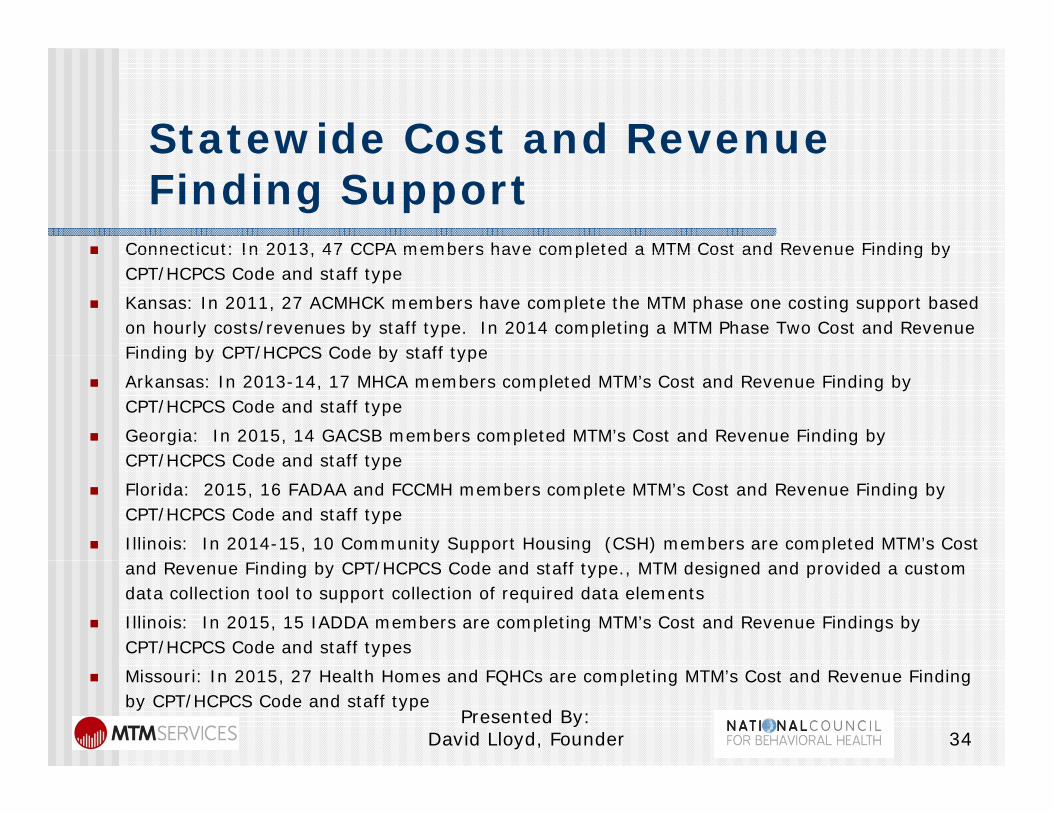
Statewide Cost and RevenueStatewide Cost and Revenue Finding Support
Connecticut: In 2013, 47 CCPA members have completed a MTM Cost and Revenue Finding by Connecticut: In 2013, 47 CCPA members have completed a MTM Cost and Revenue Finding by CPT/HCPCS Code and staff type
Kansas: In 2011, 27 ACMHCK members have complete the MTM phase one costing support based on hourly costs/revenues by staff type. In 2014 completing a MTM Phase Two Cost and Revenue Finding by CPT/HCPCS Code by staff typeFinding by CPT/HCPCS Code by staff type
Arkansas: In 2013-14, 17 MHCA members completed MTM’s Cost and Revenue Finding by CPT/HCPCS Code and staff type
Georgia: In 2015, 14 GACSB members completed MTM’s Cost and Revenue Finding by CPT/HCPCS Code and staff typeCPT/HCPCS Code and staff type
Florida: 2015, 16 FADAA and FCCMH members complete MTM’s Cost and Revenue Finding by CPT/HCPCS Code and staff type
Illinois: In 2014-15, 10 Community Support Housing (CSH) members are completed MTM’s Cost and Revenue Finding by CPT/HCPCS Code and staff type., MTM designed and provided a custom data collection tool to support collection of required data elements
Illinois: In 2015, 15 IADDA members are completing MTM’s Cost and Revenue Findings by CPT/HCPCS Code and staff types
Missouri: In 2015, 27 Health Homes and FQHCs are completing MTM’s Cost and Revenue Finding by CPT/HCPCS Code and staff type
Presented By: David Lloyd, Founder 34
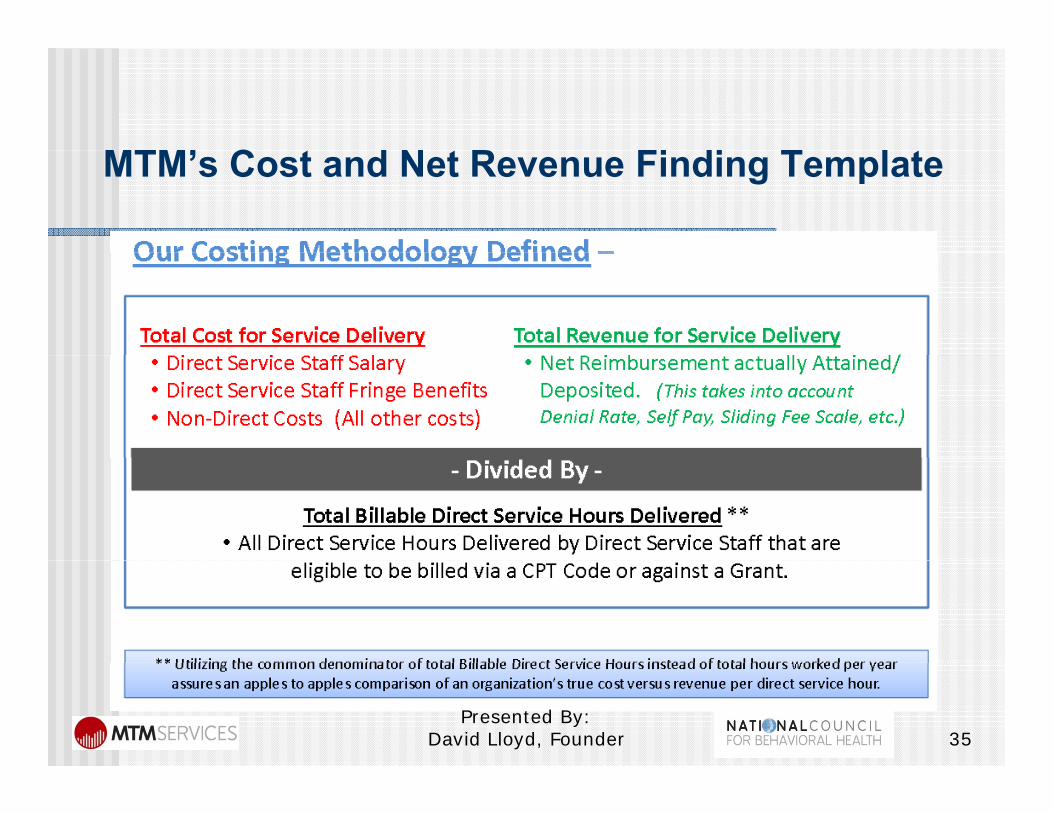
MTM’ C d N R Fi di T lMTM’s Cost and Net Revenue Finding Template
3535Presented By:
David Lloyd, Founder
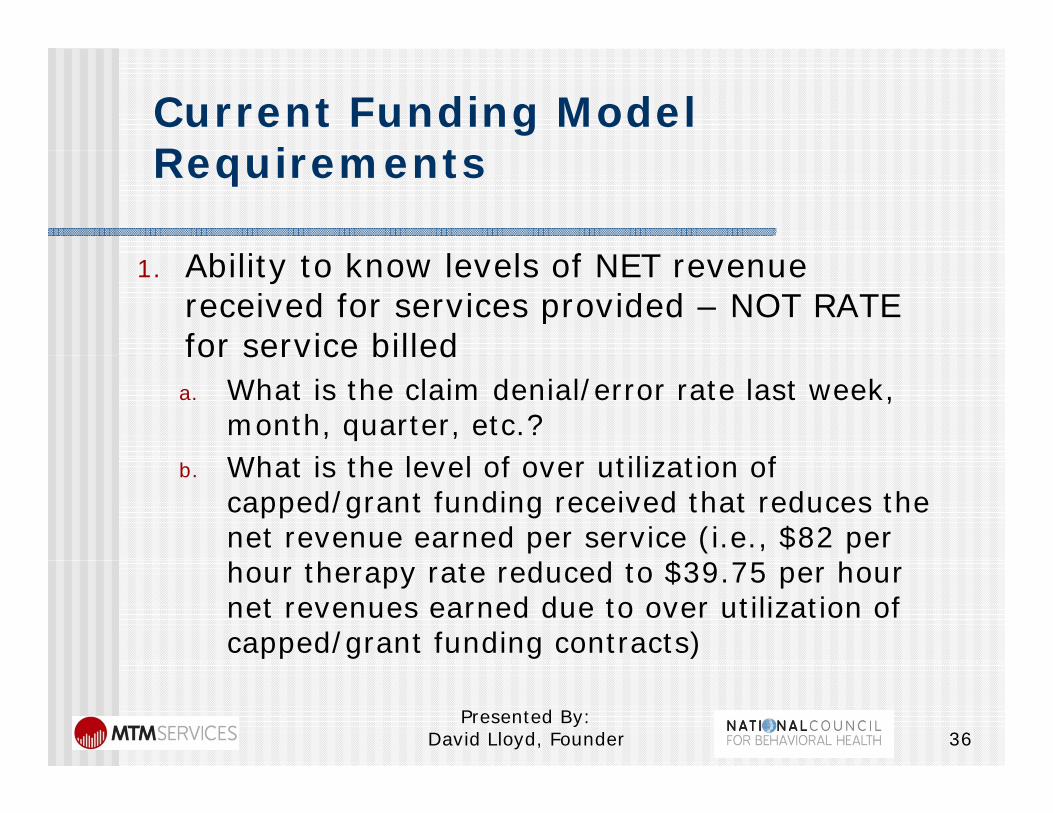
Current Funding Model R i tRequirements
bili k l l f1. Ability to know levels of NET revenue received for services provided – NOT RATE for service billedfor service billeda. What is the claim denial/error rate last week,
month, quarter, etc.?Wh t i th l l f tili ti fb. What is the level of over utilization of capped/grant funding received that reduces the net revenue earned per service (i.e., $82 per h h d d $ hhour therapy rate reduced to $39.75 per hour net revenues earned due to over utilization of capped/grant funding contracts)
36Presented By:
David Lloyd, Founder
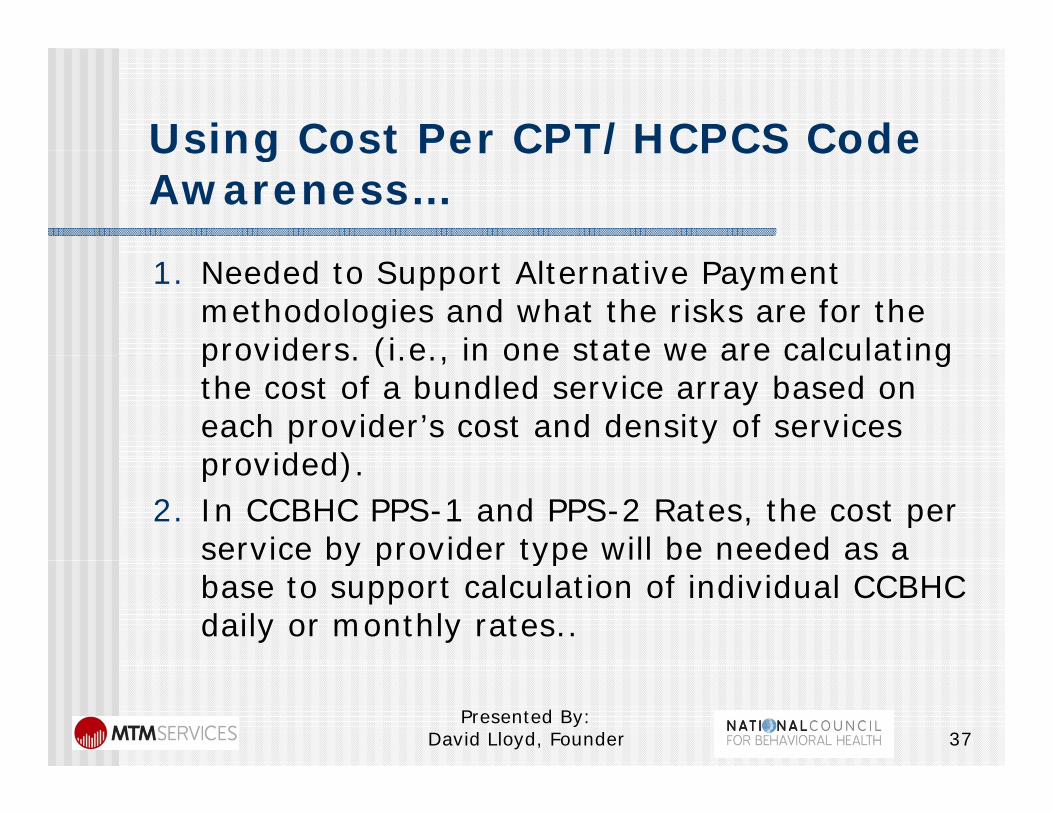
Using Cost Per CPT/HCPCS CodeUsing Cost Per CPT/HCPCS Code Awareness…
1. Needed to Support Alternative Payment methodologies and what the risks are for the providers (i e in one state we are calculatingproviders. (i.e., in one state we are calculating the cost of a bundled service array based on each provider’s cost and density of services provided)provided).
2. In CCBHC PPS-1 and PPS-2 Rates, the cost per service by provider type will be needed as a y p ypbase to support calculation of individual CCBHC daily or monthly rates..
Presented By: David Lloyd, Founder 37
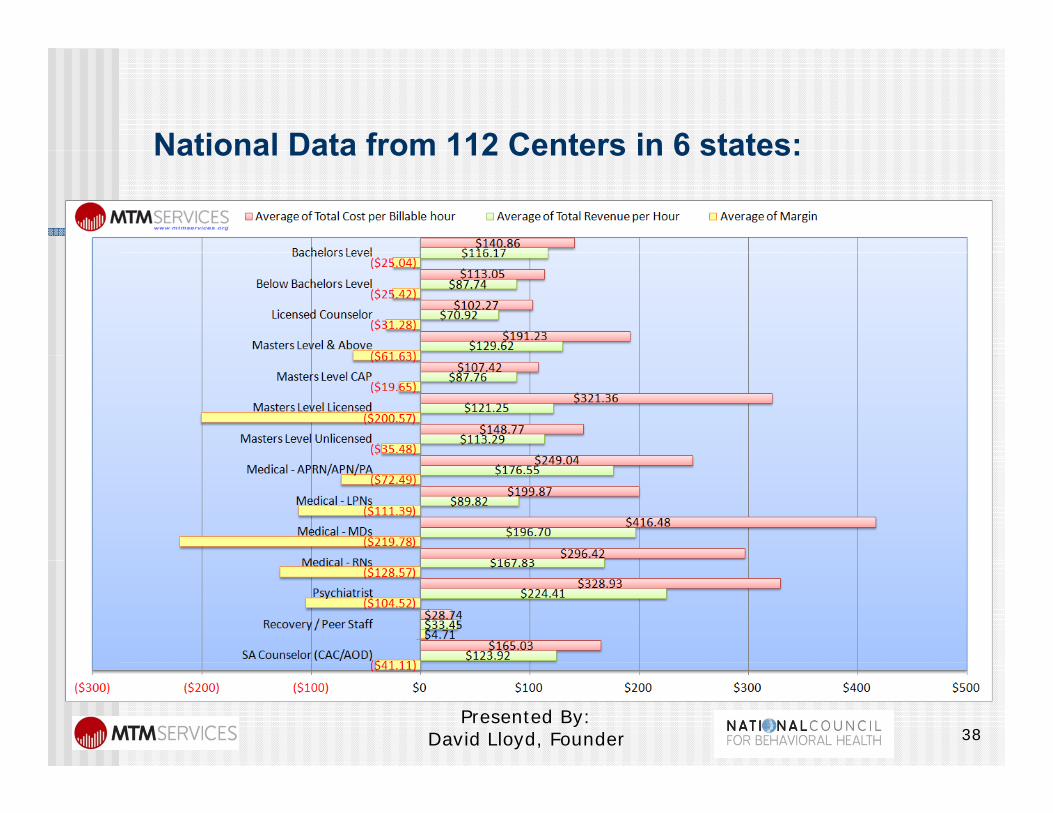
National Data from 112 Centers in 6 states:National Data from 112 Centers in 6 states:
38Presented By:
David Lloyd, Founder
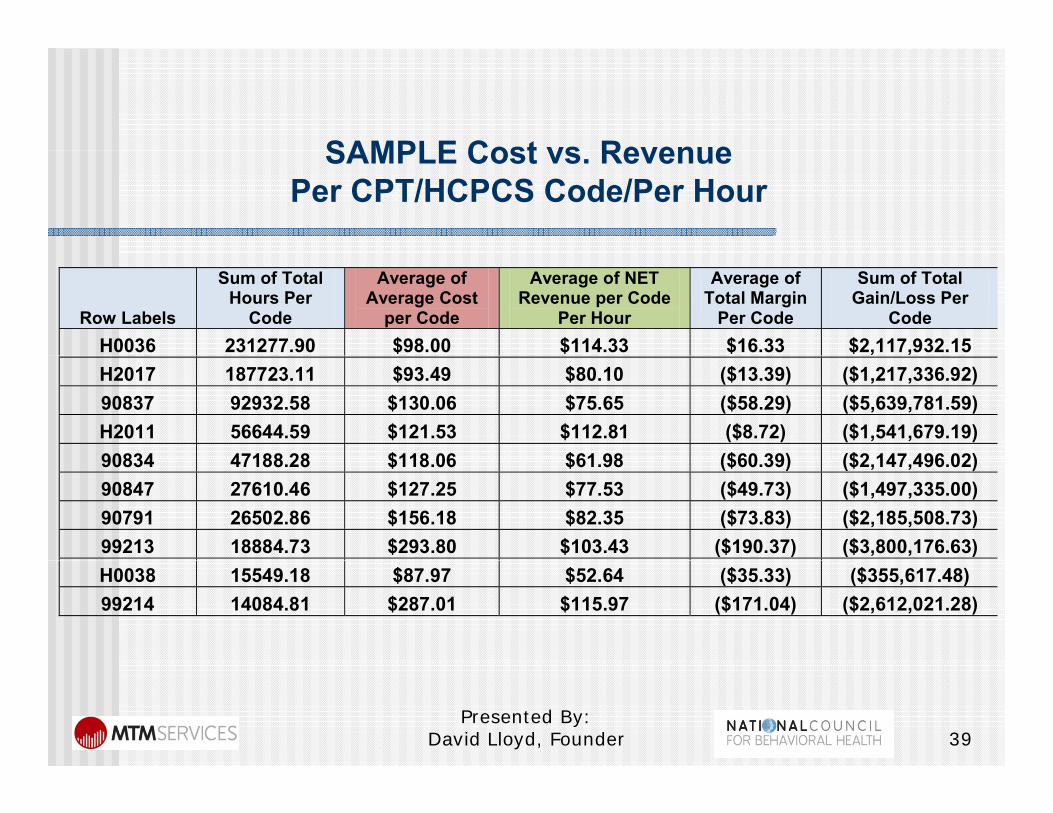
SAMPLE Cost vs RevenueSAMPLE Cost vs. RevenuePer CPT/HCPCS Code/Per Hour
Row Labels
Sum of Total Hours Per
Code
Average of Average Cost
per Code
Average of NET Revenue per Code
Per Hour
Average of Total Margin
Per Code
Sum of Total Gain/Loss Per
Code H0036 231277.90 $98.00 $114.33 $16.33 $2,117,932.15 H2017 187723.11 $93.49 $80.10 ($13.39) ($1,217,336.92) 90837 92932.58 $130.06 $75.65 ($58.29) ($5,639,781.59) H2011 56644.59 $121.53 $112.81 ($8.72) ($1,541,679.19) 90834 47188 28 $118 06 $61 98 ($60 39) ($2 147 496 02)90834 47188.28 $118.06 $61.98 ($60.39) ($2,147,496.02)90847 27610.46 $127.25 $77.53 ($49.73) ($1,497,335.00) 90791 26502.86 $156.18 $82.35 ($73.83) ($2,185,508.73) 99213 18884.73 $293.80 $103.43 ($190.37) ($3,800,176.63) H0038 15549.18 $87.97 $52.64 ($35.33) ($355,617.48) 99214 14084.81 $287.01 $115.97 ($171.04) ($2,612,021.28)
3939Presented By:
David Lloyd, Founder
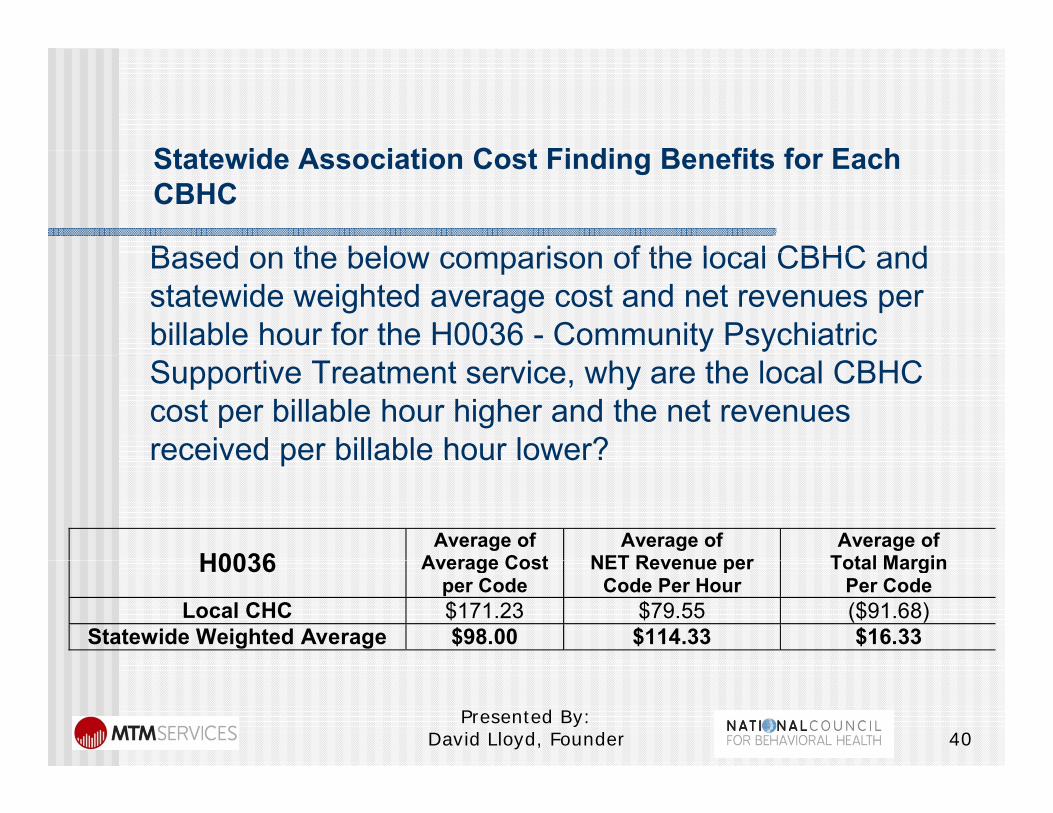
St t id A i ti C t Fi di B fit f E hStatewide Association Cost Finding Benefits for Each CBHC
Based on the below comparison of the local CBHC andBased on the below comparison of the local CBHC and statewide weighted average cost and net revenues per billable hour for the H0036 - Community Psychiatric Supportive Treatment service, why are the local CBHC cost per billable hour higher and the net revenues received per billable hour lower?received per billable hour lower?
H0036Average of
Average CostAverage of
NET Revenue perAverage of
Total MarginH0036 Average Cost per Code
NET Revenue per Code Per Hour
Total Margin Per Code
Local CHC $171.23 $79.55 ($91.68) Statewide Weighted Average $98.00 $114.33 $16.33
4040Presented By:
David Lloyd, Founder
“Value” of Care Equation
Outcomes achieved (i.e., how do we(i.e., how do we demonstrate that people are getting “better”are getting “better”
Presented By: David Lloyd, Founder 41

42Presented By:
David Lloyd, Founder
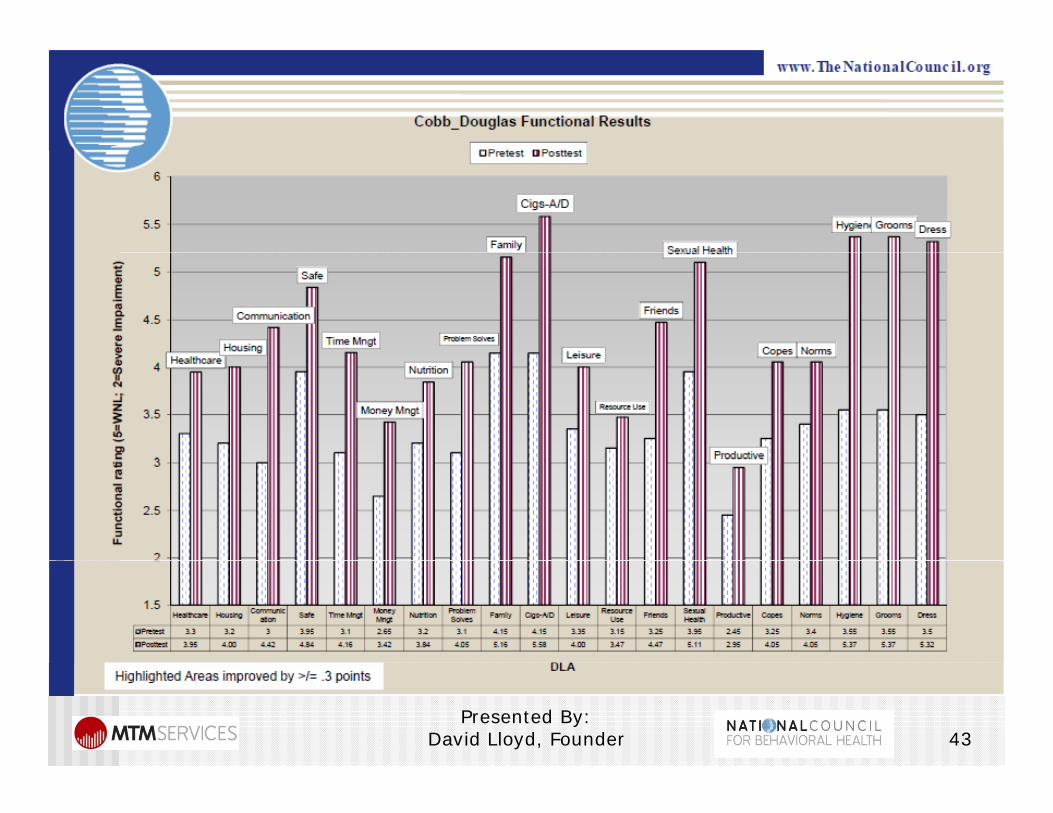
43Presented By:
David Lloyd, Founder
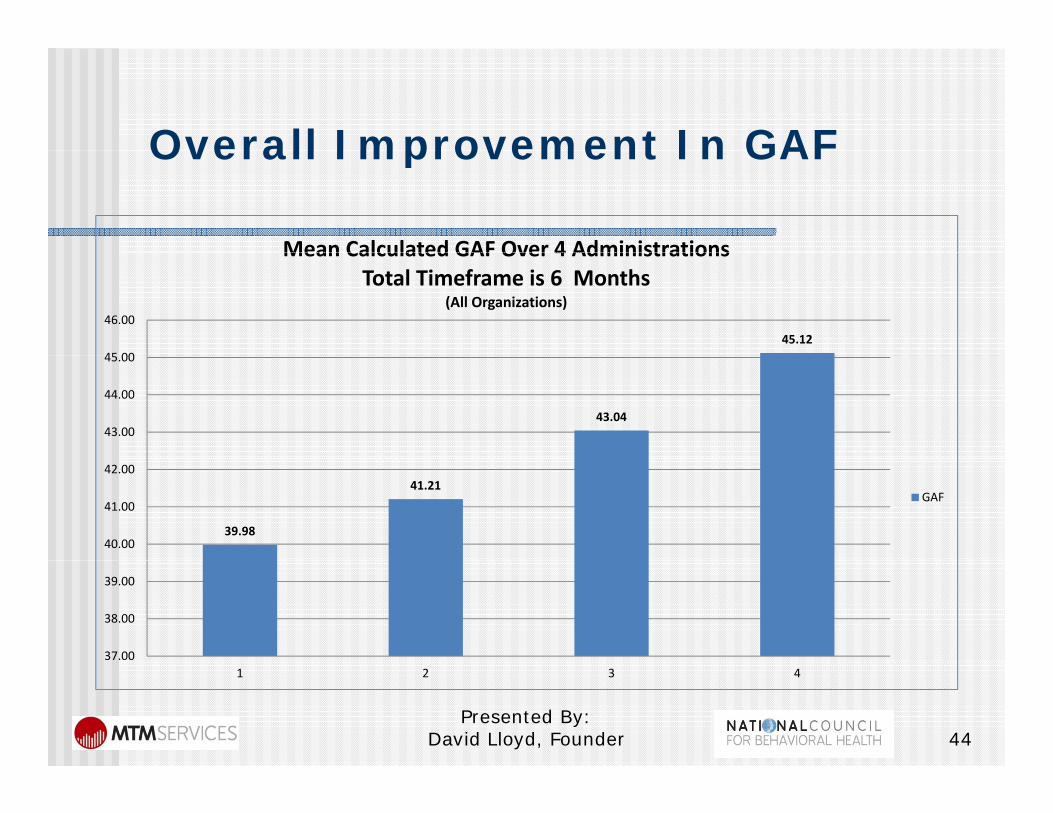
Overall Improvement In GAFOverall Improvement In GAF
Mean Calculated GAF Over 4 Administrations
45.1245 00
46.00
Mean Calculated GAF Over 4 Administrations Total Timeframe is 6 Months
(All Organizations)
43.0443.00
44.00
45.00
39.98
41.21
40.00
41.00
42.00
GAF
37.00
38.00
39.00
1 2 3 4
44Presented By:
David Lloyd, Founder
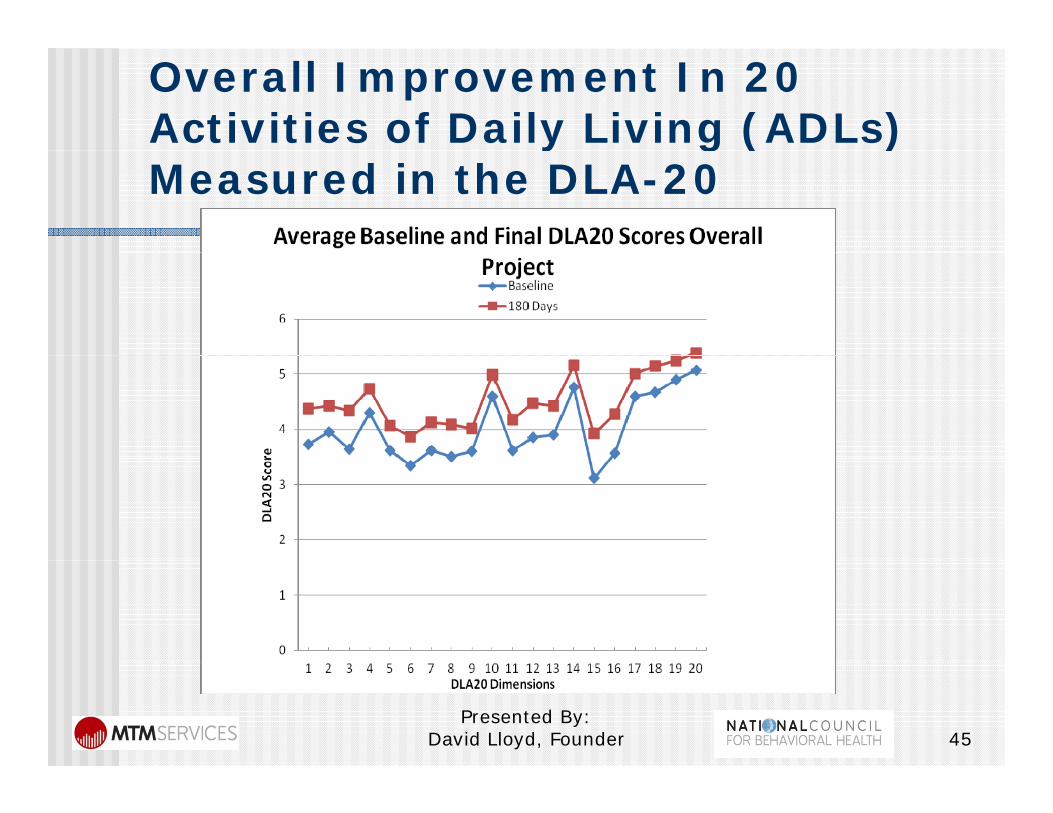
Overall Improvement In 20 Activities of Daily Living (ADLs) y g ( )Measured in the DLA-20
45Presented By:
David Lloyd, Founder
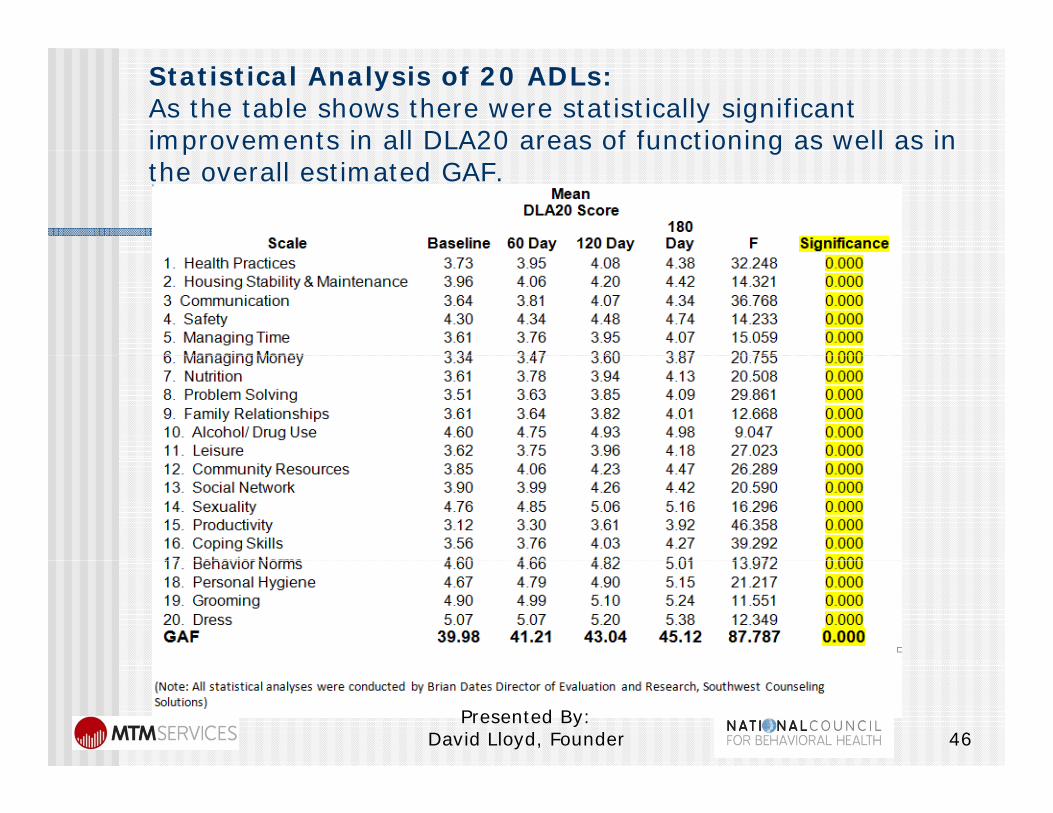
Statistical Analysis of 20 ADLs:As the table shows there were statistically significant improvements in all DLA20 areas of functioning as well as in p gthe overall estimated GAF.
46Presented By:
David Lloyd, Founder
Value of Care DeterminationValue of Care Determination
After implementation of the essential performance indicators for the above three components of Value of Care have been completed the individual results need to be integrated so that the resulting data from each of the components supports an objective determination of the level of “value” that your CBHC yis providing.
This level of objectivity can be very helpful to support individual CBHC and state association’ssupport individual CBHC and state association s “business case” to differentiate member CBHCs from other providers
4747Presented By:
David Lloyd, Founder
Value of Care Measurement Indicators
1 A t h i DLA20 b d1. Average percentage change in DLA20 based Functionality Achieved from Baseline Level compared to levels at 90 days, 180 days, 270 days and 12 months
2. Total Annual Cost of Services provided per severity levellevel
3. Number of clients in the cohort for each severity level
4. Total average annual cost of services per client5. Equals the average cost per client per percentage
i t f i t i f ti lit hi dpoint of improvement in functionality achieved
4848Presented By:
David Lloyd, Founder
49Presented By:
David Lloyd, Founder
50Presented By:
David Lloyd, Founder
What Do we Need to Begin to Measure to Support Value ofMeasure to Support Value of Care?
Presented By: David Lloyd, Founder 51
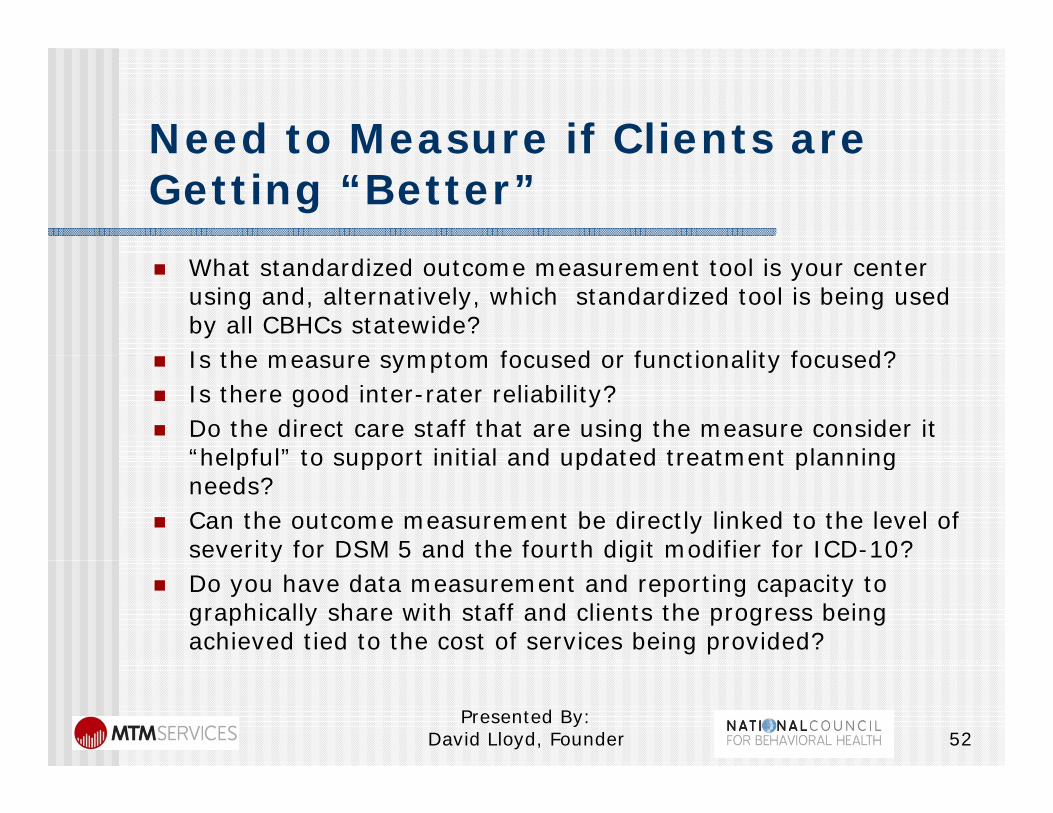
Need to Measure if Clients areNeed to Measure if Clients are Getting “Better” What standardized outcome measurement tool is your center
using and, alternatively, which standardized tool is being used by all CBHCs statewide?Is the measure symptom focused or functionality focused? Is the measure symptom focused or functionality focused?
Is there good inter-rater reliability? Do the direct care staff that are using the measure consider it
“helpful” to support initial and updated treatment planninghelpful to support initial and updated treatment planning needs?
Can the outcome measurement be directly linked to the level of severity for DSM 5 and the fourth digit modifier for ICD-10?y g
Do you have data measurement and reporting capacity to graphically share with staff and clients the progress being achieved tied to the cost of services being provided?
Presented By: David Lloyd, Founder 52
Example of Outcome Score Measurement Linked to Level ofMeasurement Linked to Level of Severity
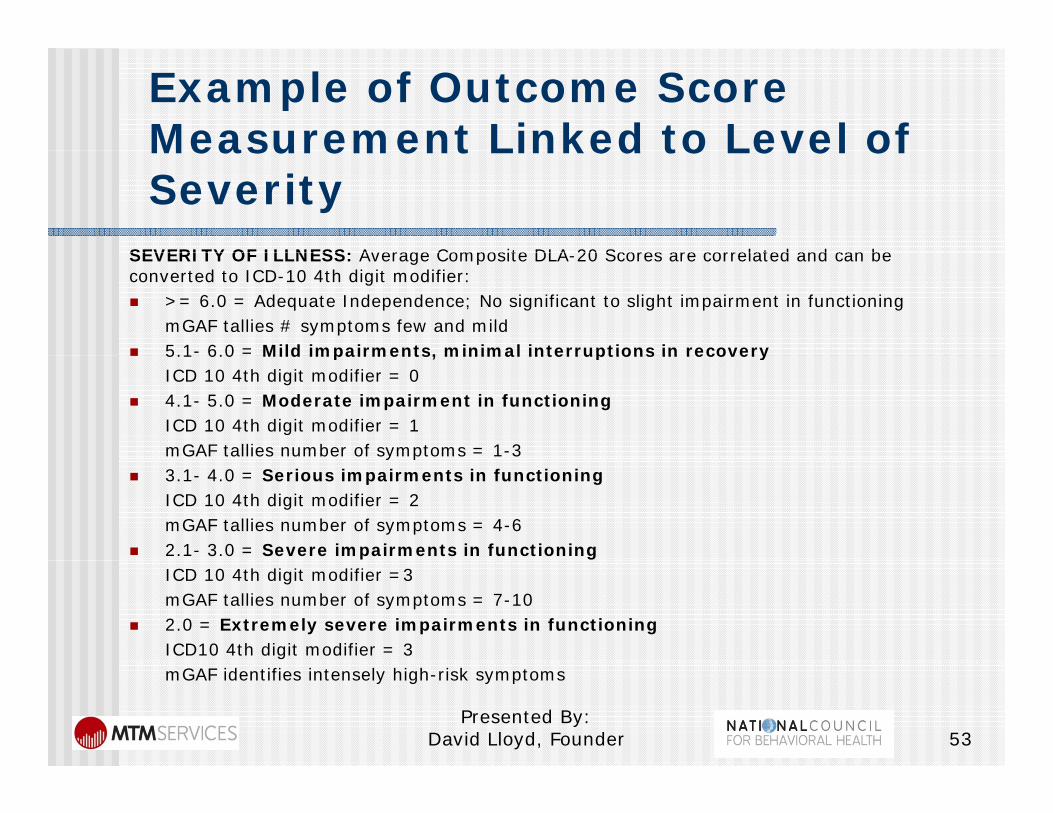
SEVERITY OF ILLNESS: Average Composite DLA 20 Scores are correlated and can beSEVERITY OF ILLNESS: Average Composite DLA-20 Scores are correlated and can be converted to ICD-10 4th digit modifier: >= 6.0 = Adequate Independence; No significant to slight impairment in functioning
mGAF tallies # symptoms few and mild 5.1- 6.0 = Mild impairments, minimal interruptions in recovery 5.1 6.0 Mild impairments, minimal interruptions in recovery
ICD 10 4th digit modifier = 0 4.1- 5.0 = Moderate impairment in functioning
ICD 10 4th digit modifier = 1mGAF tallies number of symptoms = 1-3y p
3.1- 4.0 = Serious impairments in functioningICD 10 4th digit modifier = 2mGAF tallies number of symptoms = 4-6
2.1- 3.0 = Severe impairments in functioningICD 10 4th digit modifier =3mGAF tallies number of symptoms = 7-10
2.0 = Extremely severe impairments in functioningICD10 4th digit modifier = 3mGAF identifies intensely high-risk symptoms
Presented By: David Lloyd, Founder 53
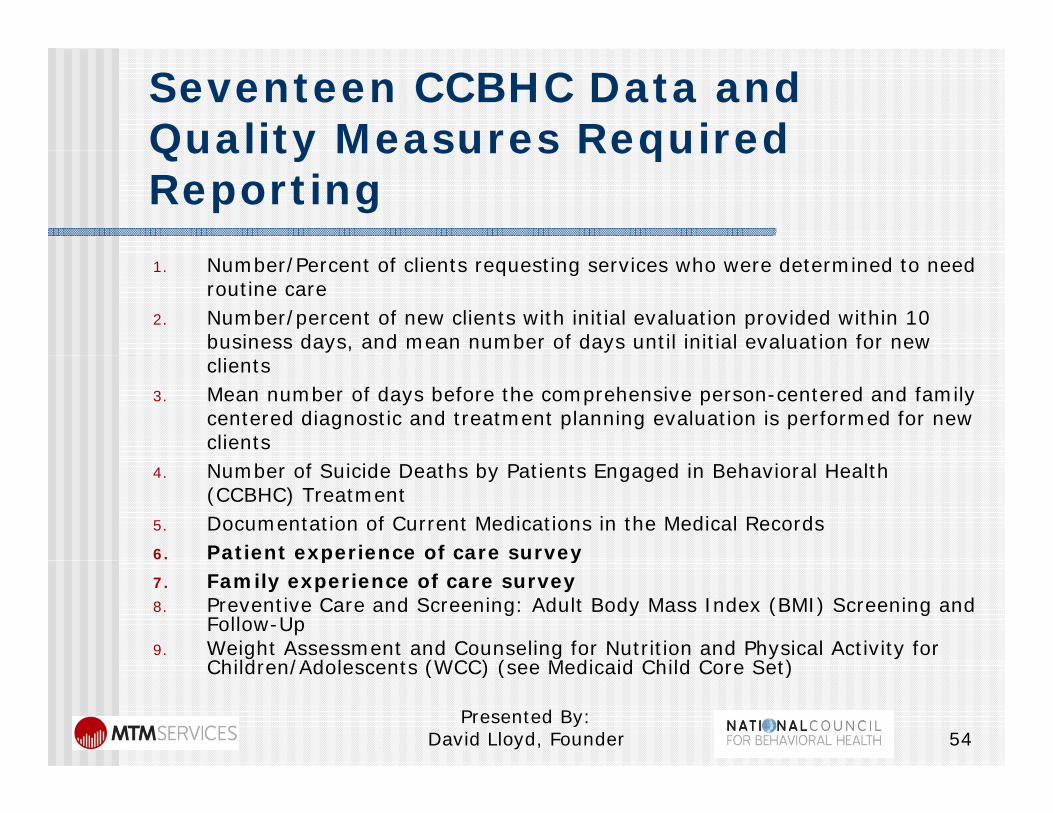
Seventeen CCBHC Data and Quality Measures RequiredQuality Measures Required Reporting 1. Number/Percent of clients requesting services who were determined to need
routine care2. Number/percent of new clients with initial evaluation provided within 10
business days, and mean number of days until initial evaluation for new clients
3. Mean number of days before the comprehensive person-centered and family centered diagnostic and treatment planning evaluation is performed for new clients
4. Number of Suicide Deaths by Patients Engaged in Behavioral Health (CCBHC) Treatment
5. Documentation of Current Medications in the Medical Records 6. Patient experience of care survey p y7. Family experience of care survey 8. Preventive Care and Screening: Adult Body Mass Index (BMI) Screening and
Follow-Up 9. Weight Assessment and Counseling for Nutrition and Physical Activity for
Child en/Adolescents (WCC) (see Medicaid Child Co e Set)Children/Adolescents (WCC) (see Medicaid Child Core Set)
Presented By: David Lloyd, Founder 54
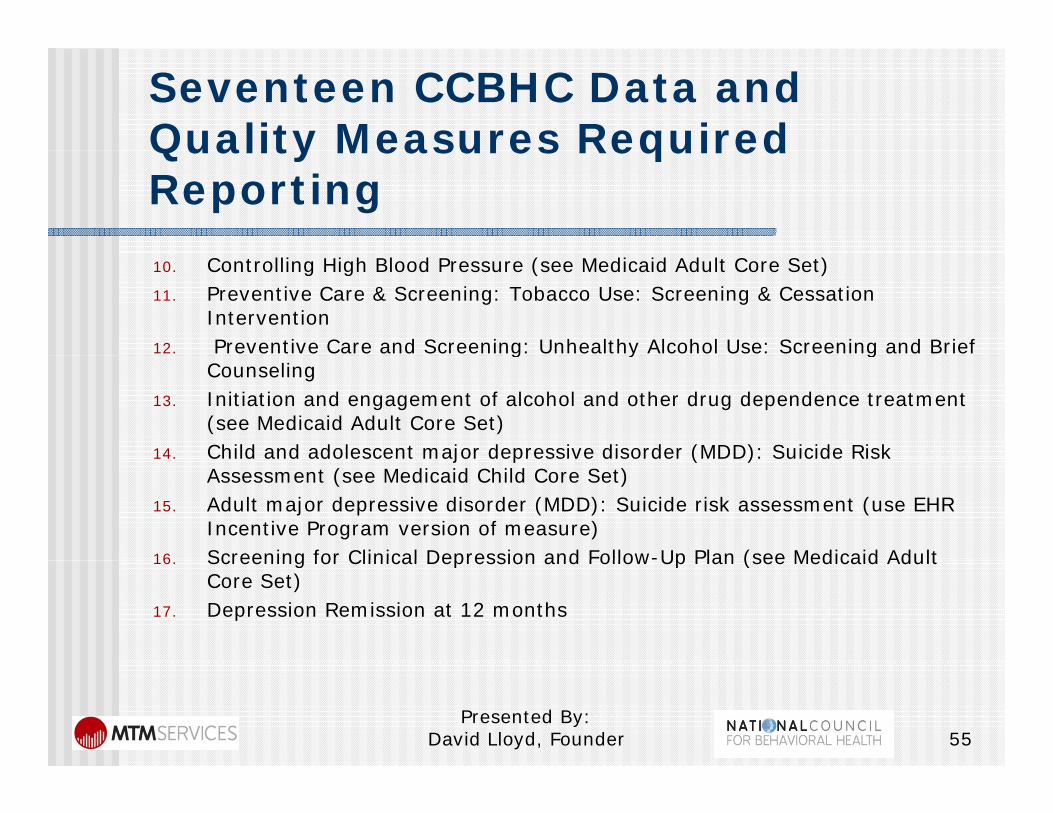
Seventeen CCBHC Data and Quality Measures RequiredQuality Measures Required Reporting 10. Controlling High Blood Pressure (see Medicaid Adult Core Set)11. Preventive Care & Screening: Tobacco Use: Screening & Cessation
Intervention 12. Preventive Care and Screening: Unhealthy Alcohol Use: Screening and Brief g y g
Counseling 13. Initiation and engagement of alcohol and other drug dependence treatment
(see Medicaid Adult Core Set) 14. Child and adolescent major depressive disorder (MDD): Suicide Risk14. Child and adolescent major depressive disorder (MDD): Suicide Risk
Assessment (see Medicaid Child Core Set) 15. Adult major depressive disorder (MDD): Suicide risk assessment (use EHR
Incentive Program version of measure) 16 Screening for Clinical Depression and Follow-Up Plan (see Medicaid Adult16. Screening for Clinical Depression and Follow Up Plan (see Medicaid Adult
Core Set) 17. Depression Remission at 12 months
Presented By: David Lloyd, Founder 55
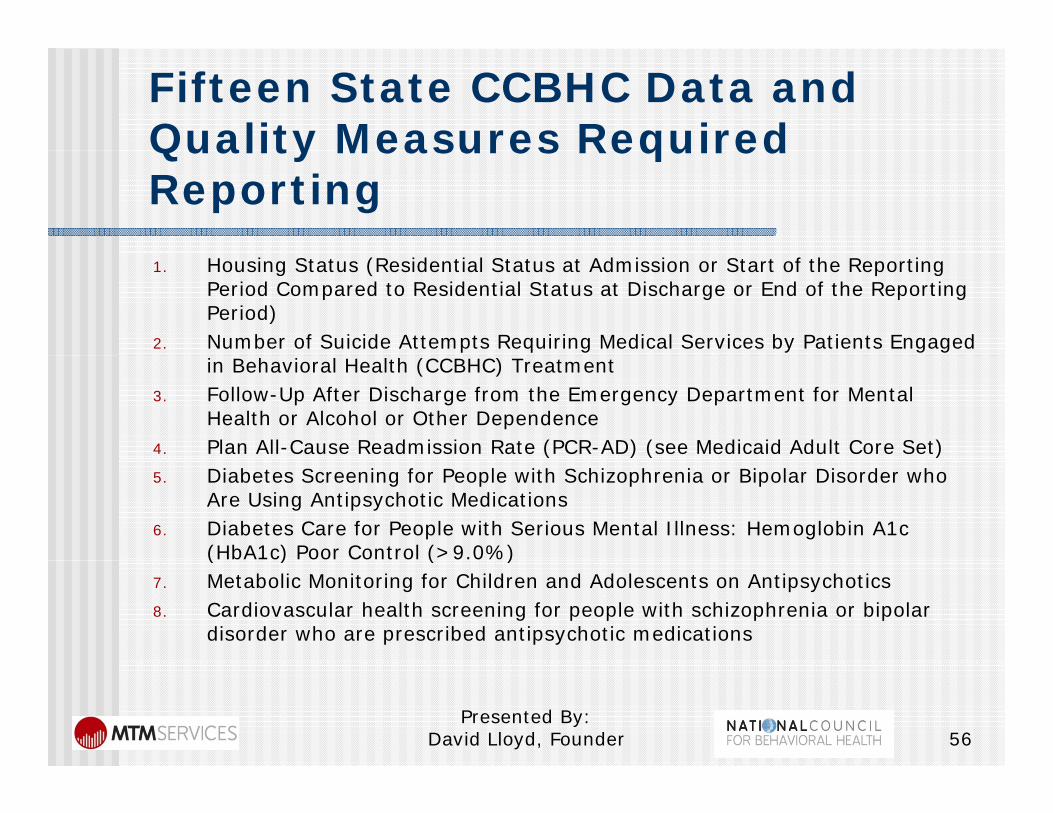
Fifteen State CCBHC Data and Quality Measures RequiredQuality Measures Required Reporting 1. Housing Status (Residential Status at Admission or Start of the Reporting
Period Compared to Residential Status at Discharge or End of the Reporting Period)
2. Number of Suicide Attempts Requiring Medical Services by Patients Engaged in Behavioral Health (CCBHC) Treatment
3. Follow-Up After Discharge from the Emergency Department for Mental Health or Alcohol or Other Dependence
4. Plan All-Cause Readmission Rate (PCR-AD) (see Medicaid Adult Core Set) 5. Diabetes Screening for People with Schizophrenia or Bipolar Disorder who
Are Using Antipsychotic Medications 6. Diabetes Care for People with Serious Mental Illness: Hemoglobin A1c
(HbA1c) Poor Control (>9.0%) ( ) ( )7. Metabolic Monitoring for Children and Adolescents on Antipsychotics 8. Cardiovascular health screening for people with schizophrenia or bipolar
disorder who are prescribed antipsychotic medications
Presented By: David Lloyd, Founder 56
Fifteen State CCBHC Data and Quality Measures RequiredQuality Measures Required Reporting
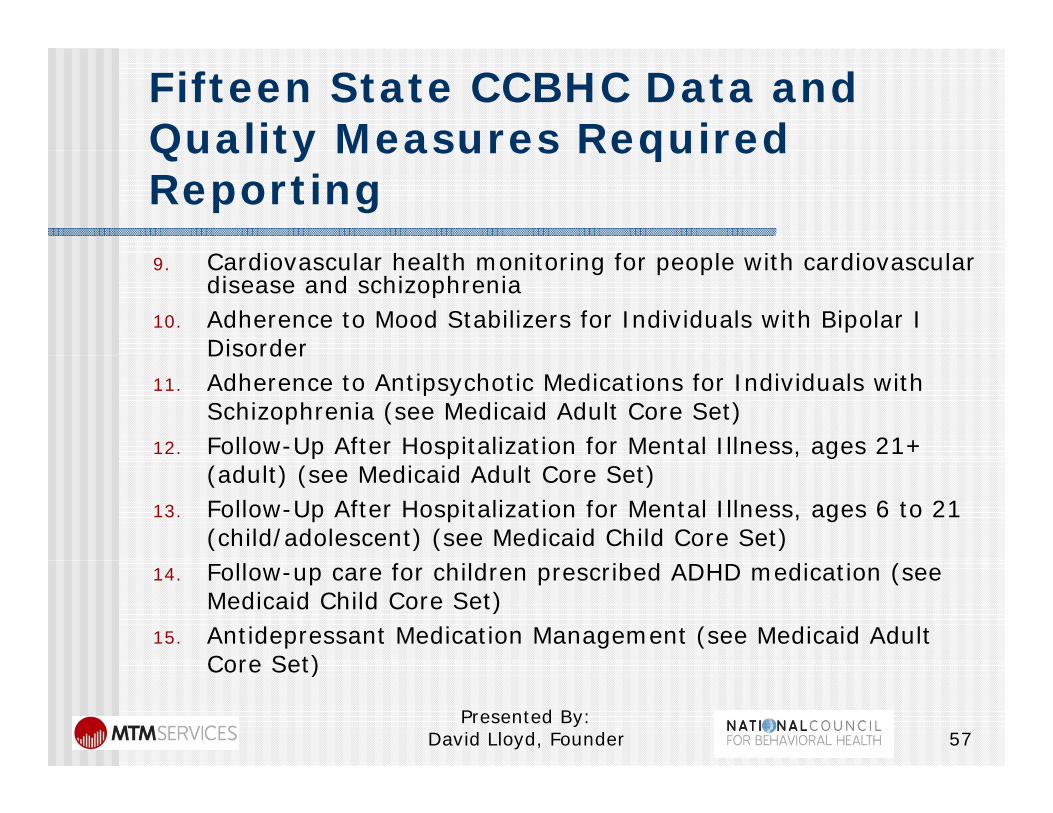
C di l h l h i i f l i h di l9. Cardiovascular health monitoring for people with cardiovascular disease and schizophrenia
10. Adherence to Mood Stabilizers for Individuals with Bipolar I DisorderDisorder
11. Adherence to Antipsychotic Medications for Individuals with Schizophrenia (see Medicaid Adult Core Set)
12. Follow-Up After Hospitalization for Mental Illness, ages 21+ p p , g(adult) (see Medicaid Adult Core Set)
13. Follow-Up After Hospitalization for Mental Illness, ages 6 to 21 (child/adolescent) (see Medicaid Child Core Set)
14. Follow-up care for children prescribed ADHD medication (see Medicaid Child Core Set)
15. Antidepressant Medication Management (see Medicaid Adult Core Set)Core Set)
Presented By: David Lloyd, Founder 57
Questions and FeedbackQuestions and Feedback
Questions? Questions? Feedback? Next Steps? Next Steps? Contact Information:
d l d dDavid Lloyd, Founder M.T.M. Services, LLCP. O. Box 1027, Holly Springs, NC 27540, y p g ,Phone: 919-434-3709 Fax: 919-773-8141E-mail: [email protected] Site: mtmservices org
Presented By: David Lloyd, Founder 58
Web Site: mtmservices.org